

New Zealand Dairy Statistics 2014-15
DAIRY%20STATISTICS%202014-15-WEB-6%20NOV%2015
DAIRY%20STATISTICS%202014-15-WEB-6%20NOV%2015

You also want an ePaper? Increase the reach of your titles
YUMPU automatically turns print PDFs into web optimized ePapers that Google loves.
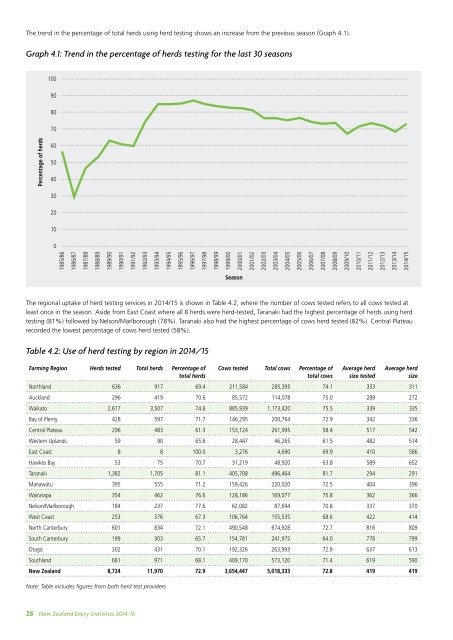
The trend in the percentage of total herds using herd testing shows an increase from the previous season (Graph 4.1).<br />
Graph 4.1: Trend in the percentage of herds testing for the last 30 seasons<br />
100<br />
90<br />
80<br />
70<br />
Percentage of herds<br />
60<br />
50<br />
40<br />
30<br />
20<br />
10<br />
0<br />
1985/86<br />
1986/87<br />
1987/88<br />
1988/89<br />
1989/90<br />
1990/91<br />
1991/92<br />
1992/93<br />
1993/94<br />
1994/95<br />
1995/96<br />
1996/97<br />
1997/98<br />
1998/99<br />
1999/00<br />
2000/01<br />
2001/02<br />
2002/03<br />
2003/04<br />
2004/05<br />
2005/06<br />
2006/07<br />
2007/08<br />
2008/09<br />
2009/10<br />
2010/11<br />
2011/12<br />
2012/13<br />
2013/14<br />
<strong>2014</strong>/<strong>15</strong><br />
Season<br />
The regional uptake of herd testing services in <strong>2014</strong>/<strong>15</strong> is shown in Table 4.2, where the number of cows tested refers to all cows tested at<br />
least once in the season. Aside from East Coast where all 8 herds were herd-tested, Taranaki had the highest percentage of herds using herd<br />
testing (81%) followed by Nelson/Marlborough (78%). Taranaki also had the highest percentage of cows herd tested (82%). Central Plateau<br />
recorded the lowest percentage of cows herd tested (58%).<br />
Table 4.2: Use of herd testing by region in <strong>2014</strong>/<strong>15</strong><br />
Farming Region Herds tested Total herds Percentage of<br />
total herds<br />
Cows tested Total cows Percentage of<br />
total cows<br />
Average herd<br />
size tested<br />
Average herd<br />
size<br />
Northland 636 917 69.4 211,584 285,395 74.1 333 311<br />
Auckland 296 419 70.6 85,572 114,078 75.0 289 272<br />
Waikato 2,617 3,507 74.6 885,939 1,173,420 75.5 339 335<br />
Bay of Plenty 428 597 71.7 146,295 200,764 72.9 342 336<br />
Central Plateau 296 483 61.3 <strong>15</strong>3,124 261,995 58.4 517 542<br />
Western Uplands 59 90 65.6 28,447 46,265 61.5 482 514<br />
East Coast 8 8 100.0 3,276 4,690 69.9 410 586<br />
Hawkes Bay 53 75 70.7 31,219 48,920 63.8 589 652<br />
Taranaki 1,382 1,705 81.1 405,708 496,464 81.7 294 291<br />
Manawatu 395 555 71.2 <strong>15</strong>9,426 220,020 72.5 404 396<br />
Wairarapa 354 462 76.6 128,186 169,077 75.8 362 366<br />
Nelson/Marlborough 184 237 77.6 62,082 87,694 70.8 337 370<br />
West Coast 253 376 67.3 106,764 <strong>15</strong>5,535 68.6 422 414<br />
North Canterbury 601 834 72.1 490,548 674,928 72.7 816 809<br />
South Canterbury 199 303 65.7 <strong>15</strong>4,781 241,975 64.0 778 799<br />
Otago 302 431 70.1 192,326 263,993 72.9 637 613<br />
Southland 661 971 68.1 409,170 573,120 71.4 619 590<br />
<strong>New</strong> <strong>Zealand</strong> 8,724 11,970 72.9 3,654,447 5,018,333 72.8 419 419<br />
Note: Table includes figures from both herd test providers<br />
26<br />
<strong>New</strong> <strong>Zealand</strong> <strong>Dairy</strong> <strong>Statistics</strong> <strong>2014</strong>-<strong>15</strong>