n?u=RePEc:ais:wpaper:1603&r=his
n?u=RePEc:ais:wpaper:1603&r=his
n?u=RePEc:ais:wpaper:1603&r=his

You also want an ePaper? Increase the reach of your titles
YUMPU automatically turns print PDFs into web optimized ePapers that Google loves.
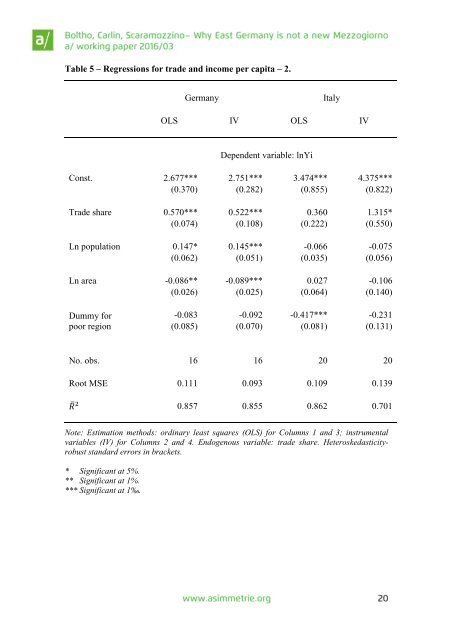
Table 5 – Regressions for trade and income per capita – 2.<br />
Germany<br />
Italy<br />
OLS IV OLS IV<br />
Dependent variable: lnYi<br />
Const. 2.677*** 2.751*** 3.474*** 4.375***<br />
(0.370) (0.282) (0.855) (0.822)<br />
Trade share 0.570*** 0.522*** 0.360 1.315*<br />
(0.074) (0.108) (0.222) (0.550)<br />
Ln population 0.147* 0.145*** -0.066 -0.075<br />
(0.062) (0.051) (0.035) (0.056)<br />
Ln area -0.086** -0.089*** 0.027 -0.106<br />
(0.026) (0.025) (0.064) (0.140)<br />
Dummy for<br />
poor region<br />
-0.083 -0.092 -0.417*** -0.231<br />
(0.085) (0.070) (0.081) (0.131)<br />
No. obs. 16 16 20 20<br />
Root MSE 0.111 0.093 0.109 0.139<br />
R̅2 0.857 0.855 0.862 0.701<br />
Note: Estimation methods: ordinary least squares (OLS) for Columns 1 and 3; instrumental<br />
variables (IV) for Columns 2 and 4. Endogenous variable: trade share. Heteroskedasticityrobust<br />
standard errors in brackets.<br />
* Significant at 5%.<br />
** Significant at 1%.<br />
*** Significant at 1‰.