n?u=RePEc:ais:wpaper:1603&r=his
n?u=RePEc:ais:wpaper:1603&r=his
n?u=RePEc:ais:wpaper:1603&r=his

You also want an ePaper? Increase the reach of your titles
YUMPU automatically turns print PDFs into web optimized ePapers that Google loves.
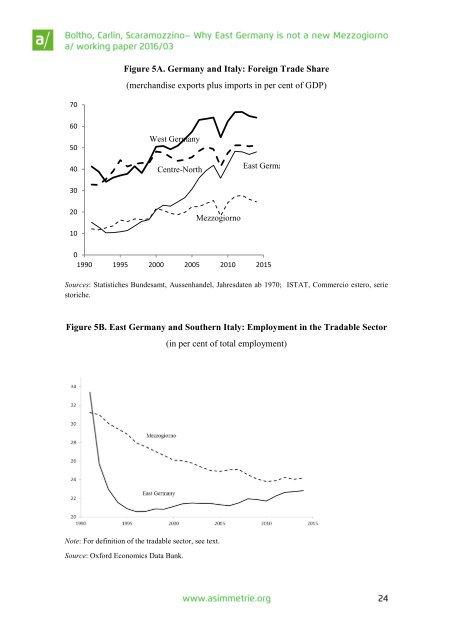
Figure 5A. Germany and Italy: Foreign Trade Share<br />
(merchandise exports plus imports in per cent of GDP)<br />
70<br />
60<br />
50<br />
40<br />
West Germany<br />
Centre-North<br />
East Germany<br />
30<br />
20<br />
10<br />
Mezzogiorno<br />
0<br />
1990 1995 2000 2005 2010 2015<br />
Sources: Statistiches Bundesamt, Aussenhandel, Jahresdaten ab 1970; ISTAT, Commercio estero, serie<br />
storiche.<br />
Figure 5B. East Germany and Southern Italy: Employment in the Tradable Sector<br />
(in per cent of total employment)<br />
Note: For definition of the tradable sector, see text.<br />
Source: Oxford Economics Data Bank.