CUT Annual Report 2013
The Annual Report is a premier publication that reports on institutional development and successes.
The Annual Report is a premier publication that reports on institutional development and successes.

Create successful ePaper yourself
Turn your PDF publications into a flip-book with our unique Google optimized e-Paper software.
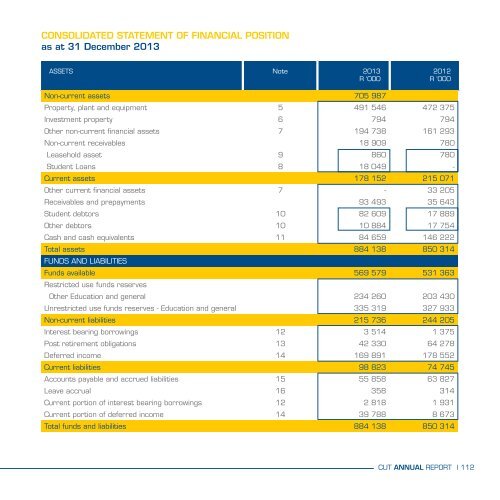
CONSOLIDATED STATEMENT OF FINANCIAL POSITION<br />
as at 31 December <strong>2013</strong><br />
ASSETS Note <strong>2013</strong><br />
R ‘000<br />
2012<br />
R ‘000<br />
Non-current assets 705 987 635 242<br />
Property, plant and equipment 5 491 546 472 375<br />
Investment property 6 794 794<br />
Other non-current financial assets 7 194 738 161 293<br />
Non-current receivables 18 909 780<br />
Leasehold asset 9 860 780<br />
Student Loans 8 18 049 -<br />
Current assets 178 152 215 071<br />
Other current financial assets 7 - 33 205<br />
Receivables and prepayments 93 493 35 643<br />
Student debtors 10 82 609 17 889<br />
Other debtors 10 10 884 17 754<br />
Cash and cash equivalents 11 84 659 146 222<br />
Total assets 884 138 850 314<br />
FUNDS AND LIABILITIES<br />
Funds available 569 579 531 363<br />
Restricted use funds reserves<br />
Other Education and general 234 260 203 430<br />
Unrestricted use funds reserves - Education and general 335 319 327 933<br />
Non-current liabilities 215 736 244 205<br />
Interest bearing borrowings 12 3 514 1 375<br />
Post retirement obligations 13 42 330 64 278<br />
Deferred income 14 169 891 178 552<br />
Current liabilities 98 823 74 745<br />
Accounts payable and accrued liabilities 15 55 858 63 827<br />
Leave accrual 16 358 314<br />
Current portion of interest bearing borrowings 12 2 818 1 931<br />
Current portion of deferred income 14 39 788 8 673<br />
Total funds and liabilities 884 138 850 314<br />
CONSOLIDATED STATEMENT OF COMPREHENSIVE INCOME<br />
for the year ended 31 December <strong>2013</strong><br />
Note<br />
Council<br />
Controlled<br />
Unrestricted<br />
Specifically<br />
Funded<br />
Activities<br />
Restricted<br />
<strong>2013</strong><br />
R ‘000<br />
SUB-<br />
TOTAL<br />
Student<br />
and staff<br />
Accommodation<br />
Unrestricted<br />
TOTAL<br />
2012<br />
R ‘000<br />
TOTAL<br />
TOTAL INCOME 510 531 95 086 605 617 11 652 617 269 567 369<br />
State appropriations - subsidies and grants 297 691 65 575 363 266 - 363 266 303 890<br />
Tuition and other fee income 191 261 5 194 196 454 11 652 208 106 183 290<br />
Income from contracts - 23 347 23 347 - 23 347 27 444<br />
Sales of goods and services 8 708 - 8 708 - 8 708 8 299<br />
Private gifts and grants 1 240 732 1 972 - 1 972 2 713<br />
SUB-TOTAL 498 901 94 848 593 748 11 652 605 399 525 636<br />
Finance income 19 11 631 239 11 869 - 11 869 15 249<br />
Gain on investments realised 20 - - - - - 26 483<br />
TOTAL EXPENDITURE 486 460 90 331 576 791 12 333 589 124 523 981<br />
486 460 90 331 576 791 12 333 589 124 523 981<br />
Personnel 17 306 478 18 759 325 237 5 190 330 427 306 036<br />
Salaries 311 521 18 759 330 281 5 190 335 471 299 839<br />
Settlement gain on post retirement benefit 13 (11 853) - (11 853) - (11 853)<br />
Post retirement benefits cost 13 6 810 - 6 810 - 6 810 6 197<br />
Other current operating expenses 18 145 661 71 571 217 232 7 143 224 375 188 205<br />
Depreciation 18 33 596 - 33 596 - 33 596 29 006<br />
SUBTOTAL 485 735 90 331 576 065 12 333 588 398 523 247<br />
Finance costs 21 425 - 425 - 425 464<br />
Loss / (Profit) on disposal of assets 300 - 300 - 300 270<br />
SURPLUS FOR THE YEAR 24 071 4 755 28 826 ( 681) 28 145 43 387<br />
OTHER COMPREHENSIVE INCOME<br />
Items that will not be reclassified to<br />
profit /(loss)<br />
Actuarial (loss) / gain on post<br />
retirement obligation<br />
13 1 537 - 1 537 - 1 537 (6 662)<br />
Items that may be subsequently classified to<br />
profit / (loss)<br />
Change in value of available-for-sale<br />
financial assets<br />
OTHER COMPREHENSIVE INCOME FOR<br />
THE YEAR<br />
TOTAL COMPREHENSIVE INCOME FOR<br />
THE YEAR<br />
7 - - - - - 14 020<br />
1 537 - 1 537 - 1 537 7 358<br />
25 608 4 755 30 363 ( 681) 29 682 50 746<br />
<strong>CUT</strong> ANNUAL REPORT | 112<br />
113 | <strong>CUT</strong> ANNUAL REPORT