

course
ey-africa-attractiveness-program-2016-staying-the-course
ey-africa-attractiveness-program-2016-staying-the-course

You also want an ePaper? Increase the reach of your titles
YUMPU automatically turns print PDFs into web optimized ePapers that Google loves.
Investors remain interested in South Africa’s well-developed<br />
economy and its status as a launch-pad into Africa.<br />
In contrast to South Africa’s more positive performance,<br />
<br />
<br />
<br />
country, where projects fell from 23 in 2014 to just 2 in 2015.<br />
The region’s other resource-rich economies, namely Angola and<br />
Zambia bore the brunt of lower oil and commodity prices. While<br />
Angola saw no change in the number of FDI projects, investment<br />
activity was subdued in Zambia, where projects fell 13.3% since<br />
2014.<br />
<br />
The West Africa subregion regained traction after a sluggish<br />
2014, with FDI projects up 16.2%. Interestingly, in 2015, West<br />
Africa became the leading recipient of capital investment on the<br />
continent, outpacing Southern Africa.<br />
2015 proved to be a landmark year for Nigeria. On the one hand,<br />
the country enjoyed a smooth transition of power following its<br />
26<br />
On the other hand, plunging oil prices piled pressure on the<br />
Nigerian economy, triggering a slowdown in growth as foreign<br />
exchange shortages crippled business and led to rising shortages. 27<br />
Nevertheless, from an FDI perspective, Africa’s largest economy<br />
recovered from weaker 2014 levels, with FDI projects up by 8.2%.<br />
Most of the activity was centered on business services, where<br />
projects grew from just 4 in 2014 to 12 in 2015.<br />
<br />
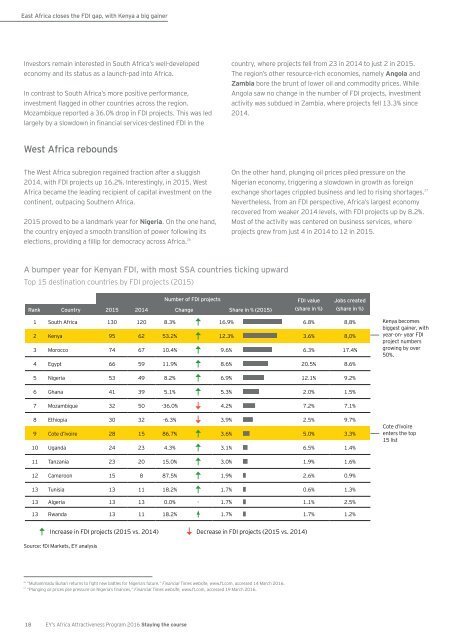
Top 15 destination countries by FDI projects (2015)<br />
<br />
Country <br />
<br />
<br />
Jobs created<br />
<br />
1 South Africa 130 120 8.3% 16.9% 6.8% 8,8%<br />
2 Kenya 95 62 53.2% 12.3% 3.6% 8,0%<br />
3 Morocco 74 67 10.4% 9.6% 6.3% 17.4%<br />
4 Egypt 66 59 11.9% 8.6% 20.5% 8.6%<br />
Kenya becomes<br />
biggest gainer, with<br />
year-on- year FDI<br />
project numbers<br />
growing by over<br />
50%.<br />
5 Nigeria 53 49 8.2% 6.9% 12.1% 9.2%<br />
6 Ghana 41 39 5.1% 5.3% 2.0% 1.5%<br />
7 32 50 -36.0% 4.2% 7.2% 7.1%<br />
8 Ethiopia 30 32 -6.3% 3.9% 2.5% 9.7%<br />
9 Cote d’lvoire 28 15 86.7% 3.6% 5.0% 3.3%<br />
10 Uganda 24 23 4.3% 3.1% 6.5% 1.4%<br />
Cote d’lvoire<br />
enters the top<br />
15 list<br />
11 Tanzania 23 20 15.0% 3.0% 1.9% 1.6%<br />
12 Cameroon 15 8 87.5% 1.9% 2.6% 0.9%<br />
13 Tunisia 13 11 18.2% 1.7% 0.6% 1.3%<br />
13 Algeria 13 13 0.0% - 1.7% 1.1% 2.5%<br />
13 Rwanda 13 11 18.2% 1.7% 1.7% 1.2%<br />
Increase in FDI projects (2015 vs. 2014) Decrease in FDI projects (2015 vs. 2014)<br />
Source: fDi Markets, EY analysis<br />
26<br />
” Financial Times website, www.ft.com, accessed 14 March 2016.<br />
27<br />
” Financial Times website, www.ft.com, accessed 19 March 2016.<br />
18 EY’s Africa Attractiveness Program 2016 Staying the <strong>course</strong>