- Page 2: Abbreviations and acronyms AFC Aver
- Page 6: Fundamentals of Power System Econom
- Page 10: For Penny and Philippe For Dragana,
- Page 14: viii CONTENTS 2.4.3 Future contract
- Page 18: x CONTENTS 7.3.2 Capacity payments
- Page 22: xii PREFACE The typical reader we h
- Page 26: 2 1 INTRODUCTION public utilities w
- Page 30: 4 1 INTRODUCTION Large consumers, o
- Page 34: 6 1 INTRODUCTION Genco Genco Disco
- Page 38: 8 1 INTRODUCTION objectives. When t
- Page 42: 2 Basic Concepts from Economics 2.1
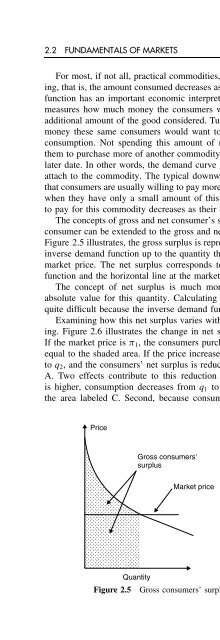
- Page 46: 2.2 FUNDAMENTALS OF MARKETS 13 Pric
- Page 52: 16 2 BASIC CONCEPTS FROM ECONOMICS
- Page 56: 18 2 BASIC CONCEPTS FROM ECONOMICS
- Page 60: 20 2 BASIC CONCEPTS FROM ECONOMICS
- Page 64: 22 2 BASIC CONCEPTS FROM ECONOMICS
- Page 68: 24 2 BASIC CONCEPTS FROM ECONOMICS
- Page 72: 26 2 BASIC CONCEPTS FROM ECONOMICS
- Page 76: 28 2 BASIC CONCEPTS FROM ECONOMICS
- Page 80: 30 2 BASIC CONCEPTS FROM ECONOMICS
- Page 84: 32 2 BASIC CONCEPTS FROM ECONOMICS
- Page 88: 34 2 BASIC CONCEPTS FROM ECONOMICS
- Page 92: 36 2 BASIC CONCEPTS FROM ECONOMICS
- Page 96: 38 2 BASIC CONCEPTS FROM ECONOMICS
- Page 100:
40 2 BASIC CONCEPTS FROM ECONOMICS
- Page 104:
42 2 BASIC CONCEPTS FROM ECONOMICS
- Page 108:
44 2 BASIC CONCEPTS FROM ECONOMICS
- Page 112:
46 2 BASIC CONCEPTS FROM ECONOMICS
- Page 116:
3 Markets for Electrical Energy 3.1
- Page 120:
3.3 THE NEED FOR A MANAGED SPOT MAR
- Page 124:
3.4 OPEN ELECTRICAL ENERGY MARKETS
- Page 128:
3.4 OPEN ELECTRICAL ENERGY MARKETS
- Page 132:
3.4 OPEN ELECTRICAL ENERGY MARKETS
- Page 136:
3.5 THE MANAGED SPOT MARKET 59 pool
- Page 140:
3.5 THE MANAGED SPOT MARKET 61 incr
- Page 144:
3.5 THE MANAGED SPOT MARKET 63 The
- Page 148:
3.6 THE SETTLEMENT PROCESS 65 syste
- Page 152:
3.8 PROBLEMS 67 OFGEM, http://www.o
- Page 156:
3.8 PROBLEMS 69 25/2/16 Magenta Sel
- Page 160:
3.8 PROBLEMS 71 3.6 A company calle
- Page 164:
4 Participating in Markets for Elec
- Page 168:
4.2 THE CONSUMER’S PERSPECTIVE 75
- Page 172:
4.2 THE CONSUMER’S PERSPECTIVE 77
- Page 176:
4.3 THE PRODUCER’S PERSPECTIVE 79
- Page 180:
4.3 THE PRODUCER’S PERSPECTIVE 81
- Page 184:
4.3 THE PRODUCER’S PERSPECTIVE 83
- Page 188:
4.3 THE PRODUCER’S PERSPECTIVE 85
- Page 192:
4.3 THE PRODUCER’S PERSPECTIVE 87
- Page 196:
4.3 THE PRODUCER’S PERSPECTIVE 89
- Page 200:
4.3 THE PRODUCER’S PERSPECTIVE 91
- Page 204:
4.3 THE PRODUCER’S PERSPECTIVE 93
- Page 208:
4.3 THE PRODUCER’S PERSPECTIVE 95
- Page 212:
4.3 THE PRODUCER’S PERSPECTIVE 97
- Page 216:
4.5 THE HYBRID PARTICIPANT’S PERS
- Page 220:
4.6 FURTHER READING 101 consider th
- Page 224:
4.7 PROBLEMS 103 with those given b
- Page 228:
5 System Security and Ancillary Ser
- Page 232:
5.2 DESCRIBING THE NEEDS 107 5.2 De
- Page 236:
5.2 DESCRIBING THE NEEDS 109 Load (
- Page 240:
5.2 DESCRIBING THE NEEDS 111 Freque
- Page 244:
5.2 DESCRIBING THE NEEDS 113 that t
- Page 248:
5.2 DESCRIBING THE NEEDS 115 Reacti
- Page 252:
5.3 OBTAINING ANCILLARY SERVICES 11
- Page 256:
5.3 OBTAINING ANCILLARY SERVICES 11
- Page 260:
5.4 BUYING ANCILLARY SERVICES 121 I
- Page 264:
5.4 BUYING ANCILLARY SERVICES 123 r
- Page 268:
5.4 BUYING ANCILLARY SERVICES 125 o
- Page 272:
5.4 BUYING ANCILLARY SERVICES 127 5
- Page 276:
5.4 BUYING ANCILLARY SERVICES 129 w
- Page 280:
5.5 SELLING ANCILLARY SERVICES 131
- Page 284:
5.5 SELLING ANCILLARY SERVICES 133
- Page 288:
5.5 SELLING ANCILLARY SERVICES 135
- Page 292:
5.7 PROBLEMS 137 Billinton R, Allan
- Page 296:
5.7 PROBLEMS 139 Line R (p.u.) X (p
- Page 300:
142 6 TRANSMISSION NETWORKS AND ELE
- Page 304:
144 6 TRANSMISSION NETWORKS AND ELE
- Page 308:
146 6 TRANSMISSION NETWORKS AND ELE
- Page 312:
148 6 TRANSMISSION NETWORKS AND ELE
- Page 316:
150 6 TRANSMISSION NETWORKS AND ELE
- Page 320:
152 6 TRANSMISSION NETWORKS AND ELE
- Page 324:
154 6 TRANSMISSION NETWORKS AND ELE
- Page 328:
156 6 TRANSMISSION NETWORKS AND ELE
- Page 332:
158 6 TRANSMISSION NETWORKS AND ELE
- Page 336:
160 6 TRANSMISSION NETWORKS AND ELE
- Page 340:
162 6 TRANSMISSION NETWORKS AND ELE
- Page 344:
164 6 TRANSMISSION NETWORKS AND ELE
- Page 348:
166 6 TRANSMISSION NETWORKS AND ELE
- Page 352:
168 6 TRANSMISSION NETWORKS AND ELE
- Page 356:
170 6 TRANSMISSION NETWORKS AND ELE
- Page 360:
172 6 TRANSMISSION NETWORKS AND ELE
- Page 364:
174 6 TRANSMISSION NETWORKS AND ELE
- Page 368:
176 6 TRANSMISSION NETWORKS AND ELE
- Page 372:
178 6 TRANSMISSION NETWORKS AND ELE
- Page 376:
180 6 TRANSMISSION NETWORKS AND ELE
- Page 380:
182 6 TRANSMISSION NETWORKS AND ELE
- Page 384:
184 6 TRANSMISSION NETWORKS AND ELE
- Page 388:
186 6 TRANSMISSION NETWORKS AND ELE
- Page 392:
188 6 TRANSMISSION NETWORKS AND ELE
- Page 396:
190 6 TRANSMISSION NETWORKS AND ELE
- Page 400:
192 6 TRANSMISSION NETWORKS AND ELE
- Page 404:
194 6 TRANSMISSION NETWORKS AND ELE
- Page 408:
196 6 TRANSMISSION NETWORKS AND ELE
- Page 412:
198 6 TRANSMISSION NETWORKS AND ELE
- Page 416:
200 6 TRANSMISSION NETWORKS AND ELE
- Page 420:
202 6 TRANSMISSION NETWORKS AND ELE
- Page 424:
204 6 TRANSMISSION NETWORKS AND ELE
- Page 428:
206 7 INVESTING IN GENERATION by th
- Page 432:
208 7 INVESTING IN GENERATION Bruce
- Page 436:
210 7 INVESTING IN GENERATION Year
- Page 440:
212 7 INVESTING IN GENERATION Nick
- Page 444:
214 7 INVESTING IN GENERATION sione
- Page 448:
216 7 INVESTING IN GENERATION River
- Page 452:
218 7 INVESTING IN GENERATION capac
- Page 456:
220 7 INVESTING IN GENERATION vulne
- Page 460:
222 7 INVESTING IN GENERATION durin
- Page 464:
224 7 INVESTING IN GENERATION Schwe
- Page 468:
226 7 INVESTING IN GENERATION of it
- Page 472:
228 8 INVESTING IN TRANSMISSION Mor
- Page 476:
230 8 INVESTING IN TRANSMISSION pos
- Page 480:
232 8 INVESTING IN TRANSMISSION 8.3
- Page 484:
234 8 INVESTING IN TRANSMISSION 20
- Page 488:
236 8 INVESTING IN TRANSMISSION 8.4
- Page 492:
238 8 INVESTING IN TRANSMISSION con
- Page 496:
240 8 INVESTING IN TRANSMISSION 8.4
- Page 500:
242 8 INVESTING IN TRANSMISSION 0 3
- Page 504:
244 8 INVESTING IN TRANSMISSION Tab
- Page 508:
246 8 INVESTING IN TRANSMISSION For
- Page 512:
248 8 INVESTING IN TRANSMISSION Dur
- Page 516:
250 8 INVESTING IN TRANSMISSION Tab
- Page 520:
252 8 INVESTING IN TRANSMISSION Tab
- Page 524:
254 8 INVESTING IN TRANSMISSION P A
- Page 528:
256 8 INVESTING IN TRANSMISSION Dur
- Page 532:
258 8 INVESTING IN TRANSMISSION A 0
- Page 536:
260 8 INVESTING IN TRANSMISSION are
- Page 540:
262 8 INVESTING IN TRANSMISSION Cap
- Page 544:
264 8 INVESTING IN TRANSMISSION Plo
- Page 548:
266 APPENDIX: ANSWERS TO SELECTED P
- Page 552:
268 APPENDIX: ANSWERS TO SELECTED P
- Page 556:
270 APPENDIX: ANSWERS TO SELECTED P
- Page 560:
272 APPENDIX: ANSWERS TO SELECTED P
- Page 564:
274 APPENDIX: ANSWERS TO SELECTED P
- Page 568:
278 INDEX Commitment Unit See Unit,
- Page 572:
280 INDEX Imbalance See Balance Inc
- Page 576:
282 INDEX Price (continued) Market
- Page 580:
284 INDEX Unit Commitment 58, 85 Th