

2huNXZF
2huNXZF
2huNXZF

You also want an ePaper? Increase the reach of your titles
YUMPU automatically turns print PDFs into web optimized ePapers that Google loves.
Appendix 1<br />
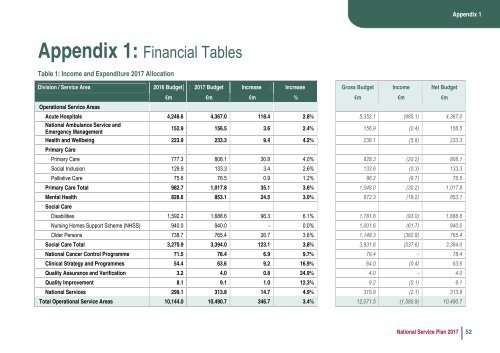
Appendix 1: Financial Tables<br />
Table 1: Income and Expenditure 2017 Allocation<br />
Division / Service Area 2016 Budget 2017 Budget Increase Increase Gross Budget Income Net Budget<br />
Operational Service Areas<br />
€m €m €m % €m €m €m<br />
Acute Hospitals 4,248.6 4,367.0 118.4 2.8% 5,352.1 (985.1) 4,367.0<br />
National Ambulance Service and<br />
Emergency Management<br />
152.9 156.5 3.6 2.4% 156.9 (0.4) 156.5<br />
Health and Wellbeing 223.9 233.3 9.4 4.2% 239.1 (5.8) 233.3<br />
Primary Care<br />
Primary Care 777.3 808.1 30.8 4.0% 828.3 (20.2) 808.1<br />
Social Inclusion 129.9 133.3 3.4 2.6% 133.6 (0.3) 133.3<br />
Palliative Care 75.6 76.5 0.9 1.2% 86.2 (9.7) 76.5<br />
Primary Care Total 982.7 1,017.8 35.1 3.6% 1,048.0 (30.2) 1,017.8<br />
Mental Health 828.6 853.1 24.5 3.0% 872.3 (19.2) 853.1<br />
Social Care<br />
Disabilities 1,592.2 1,688.6 96.3 6.1% 1,781.6 (93.0) 1,688.6<br />
Nursing Homes Support Scheme (NHSS) 940.0 940.0 - 0.0% 1,001.6 (61.7) 940.0<br />
Older Persons 738.7 765.4 26.7 3.6% 1,148.3 (382.9) 765.4<br />
Social Care Total 3,270.9 3,394.0 123.1 3.8% 3,931.6 (537.6) 3,394.0<br />
National Cancer Control Programme 71.5 78.4 6.9 9.7% 78.4 - 78.4<br />
Clinical Strategy and Programmes 54.4 63.6 9.2 16.9% 64.0 (0.4) 63.6<br />
Quality Assurance and Verification 3.2 4.0 0.8 24.9% 4.0 - 4.0<br />
Quality Improvement 8.1 9.1 1.0 12.3% 9.2 (0.1) 9.1<br />
National Services 299.1 313.8 14.7 4.9% 315.9 (2.1) 313.8<br />
Total Operational Service Areas 10,144.0 10,490.7 346.7 3.4% 12,071.5 (1,580.9) 10,490.7<br />
National Service Plan 2017 52