

2huNXZF
2huNXZF
2huNXZF

Create successful ePaper yourself
Turn your PDF publications into a flip-book with our unique Google optimized e-Paper software.
Appendix 3<br />
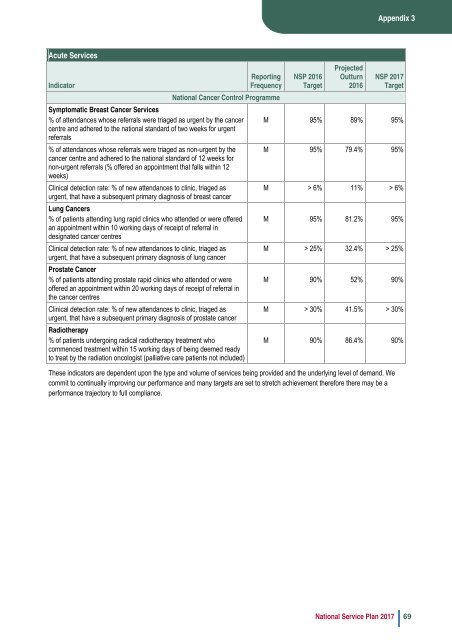
Acute Services<br />
Indicator<br />
Reporting<br />
Frequency<br />
National Cancer Control Programme<br />
Symptomatic Breast Cancer Services<br />
% of attendances whose referrals were triaged as urgent by the cancer<br />
centre and adhered to the national standard of two weeks for urgent<br />
referrals<br />
% of attendances whose referrals were triaged as non-urgent by the<br />
cancer centre and adhered to the national standard of 12 weeks for<br />
non-urgent referrals (% offered an appointment that falls within 12<br />
weeks)<br />
Clinical detection rate: % of new attendances to clinic, triaged as<br />
urgent, that have a subsequent primary diagnosis of breast cancer<br />
Lung Cancers<br />
% of patients attending lung rapid clinics who attended or were offered<br />
an appointment within 10 working days of receipt of referral in<br />
designated cancer centres<br />
Clinical detection rate: % of new attendances to clinic, triaged as<br />
urgent, that have a subsequent primary diagnosis of lung cancer<br />
Prostate Cancer<br />
% of patients attending prostate rapid clinics who attended or were<br />
offered an appointment within 20 working days of receipt of referral in<br />
the cancer centres<br />
Clinical detection rate: % of new attendances to clinic, triaged as<br />
urgent, that have a subsequent primary diagnosis of prostate cancer<br />
Radiotherapy<br />
% of patients undergoing radical radiotherapy treatment who<br />
commenced treatment within 15 working days of being deemed ready<br />
to treat by the radiation oncologist (palliative care patients not included)<br />
NSP 2016<br />
Target<br />
Projected<br />
Outturn<br />
2016<br />
NSP 2017<br />
Target<br />
M 95% 89% 95%<br />
M 95% 79.4% 95%<br />
M > 6% 11% > 6%<br />
M 95% 81.2% 95%<br />
M > 25% 32.4% > 25%<br />
M 90% 52% 90%<br />
M > 30% 41.5% > 30%<br />
M 90% 86.4% 90%<br />
These indicators are dependent upon the type and volume of services being provided and the underlying level of demand. We<br />
commit to continually improving our performance and many targets are set to stretch achievement therefore there may be a<br />
performance trajectory to full compliance.<br />
National Service Plan 2017 69