

CALTRANS FACT BOOKLET
2016_CFB
2016_CFB

You also want an ePaper? Increase the reach of your titles
YUMPU automatically turns print PDFs into web optimized ePapers that Google loves.
Sustainability: People, Planet, and Prosperity<br />
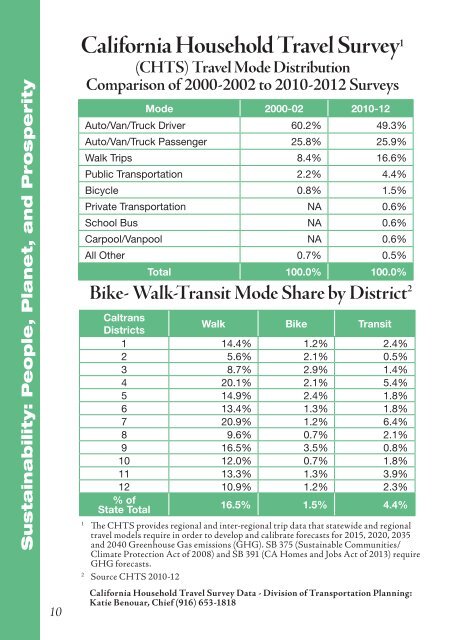
California Household Travel Survey 1<br />
(CHTS) Travel Mode Distribution<br />
Comparison of 2000-2002 to 2010-2012 Surveys<br />
Mode 2000-02 2010-12<br />
Auto/Van/Truck Driver 60.2% 49.3%<br />
Auto/Van/Truck Passenger 25.8% 25.9%<br />
Walk Trips 8.4% 16.6%<br />
Public Transportation 2.2% 4.4%<br />
Bicycle 0.8% 1.5%<br />
Private Transportation NA 0.6%<br />
School Bus NA 0.6%<br />
Carpool/Vanpool NA 0.6%<br />
All Other 0.7% 0.5%<br />
Total 100.0% 100.0%<br />
Bike- Walk-Transit Mode Share by District 2<br />
Caltrans<br />
Districts<br />
Walk Bike Transit<br />
1 14.4% 1.2% 2.4%<br />
2 5.6% 2.1% 0.5%<br />
3 8.7% 2.9% 1.4%<br />
4 20.1% 2.1% 5.4%<br />
5 14.9% 2.4% 1.8%<br />
6 13.4% 1.3% 1.8%<br />
7 20.9% 1.2% 6.4%<br />
8 9.6% 0.7% 2.1%<br />
9 16.5% 3.5% 0.8%<br />
10 12.0% 0.7% 1.8%<br />
11 13.3% 1.3% 3.9%<br />
12 10.9% 1.2% 2.3%<br />
% of<br />
State Total<br />
16.5% 1.5% 4.4%<br />
1<br />
The CHTS provides regional and inter-regional trip data that statewide and regional<br />
travel models require in order to develop and calibrate forecasts for 2015, 2020, 2035<br />
and 2040 Greenhouse Gas emissions (GHG). SB 375 (Sustainable Communities/<br />
Climate Protection Act of 2008) and SB 391 (CA Homes and Jobs Act of 2013) require<br />
GHG forecasts.<br />
2<br />
Source CHTS 2010-12<br />
California Household Travel Survey Data - Division of Transportation Planning:<br />
Katie Benouar, Chief (916) 653-1818<br />
Fuel Use<br />
Quantity of Fuel in Gallons and Total Cost<br />
Total Fuel Cost for FY 2014-2015 $36,206,000<br />
Total Fuel Used in FY 2014-2015<br />
Unleaded Gas<br />
Diesel<br />
Alternative Fuel Used in FY 2014-2015 1<br />
Biodiesel<br />
E-85<br />
CNG<br />
LPG<br />
11,833,109<br />
6,471,150<br />
2,333,533<br />
3,028,426<br />
2,738,218<br />
119,322<br />
152,863<br />
18,023<br />
Number of Bulk Fueling Stations 226<br />
1<br />
Alternate Fuel Definitions:<br />
Biodiesel - Produced from renewable resources and contains no<br />
petroleum; in its pure form it is known as B11 (100 % biodiesel)<br />
although it is often blended with petroleum diesel; e.g., B-5, B-10.<br />
E-85 - 85% ethanol and 15% gasoline.<br />
CNG - Compressed natural gas.<br />
LPG - Liquefied petroleum gas.<br />
Fuel Use data from Division of Equipment: Larry Orcutt, Chief (916) 227-9600<br />
Carbon Dioxide (CO 2 ) Emissions<br />
from Caltrans Operations<br />
Caltrans has reduced GHG emissions by 24.5% between 2010 and 2015!<br />
Greenhouse Gases 1 2010 through 2014 (in Metric Tons)<br />
2010 2011 2012 2013 2014 2015 2<br />
Vehicle Fuels 2 118,042 115,118 112,758 108,810 105,338 110,997<br />
Building Electricity<br />
and Gas<br />
35,336 38,019 29,028 36,075 30,039 30,751<br />
Street Lighting 64,107 61,270 56,638 54,339 21,808 22,425<br />
Total<br />
Emmissions 217,485 214,407 198,424 199,224 157,185 164,173<br />
1<br />
Data has been reported to the Climate Registry but has not been verified - changes may occur.<br />
2<br />
Due to a 2015 Statewide increase in the carbon intensity of the energy grid, Caltrans’ 2015 emissions from<br />
buildings and streetlights increased.<br />
Greenhouse Gases Data - Division of Transportation Planning:<br />
Katie Benouar, Chief (916) 653-1818.<br />
10 11<br />
Sustainability: People, Planet, and Prosperity