

CALTRANS FACT BOOKLET
2016_CFB
2016_CFB

Create successful ePaper yourself
Turn your PDF publications into a flip-book with our unique Google optimized e-Paper software.
Financial Information<br />
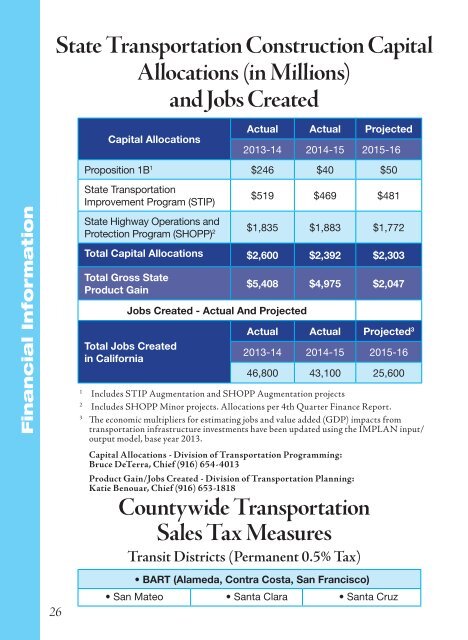
State Transportation Construction Capital<br />
Allocations (in Millions)<br />
and Jobs Created<br />
Capital Allocations<br />
Actual Actual Projected<br />
2013-14 2014-15 2015-16<br />
Proposition 1B 1 $246 $40 $50<br />
State Transportation<br />
Improvement Program (STIP)<br />
$519 $469 $481<br />
State Highway Operations and<br />
Protection Program (SHOPP) 2 $1,835 $1,883 $1,772<br />
Total Capital Allocations $2,600 $2,392 $2,303<br />
Total Gross State<br />
Product Gain<br />
Jobs Created - Actual And Projected<br />
Total Jobs Created<br />
in California<br />
$5,408 $4,975 $2,047<br />
Actual Actual Projected 3<br />
2013-14 2014-15 2015-16<br />
46,800 43,100 25,600<br />
1<br />
Includes STIP Augmentation and SHOPP Augmentation projects<br />
2<br />
Includes SHOPP Minor projects. Allocations per 4th Quarter Finance Report.<br />
3<br />
The economic multipliers for estimating jobs and value added (GDP) impacts from<br />
transportation infrastructure investments have been updated using the IMPLAN input/<br />
output model, base year 2013.<br />
Capital Allocations - Division of Transportation Programming:<br />
Bruce DeTerra, Chief (916) 654-4013<br />
Product Gain/Jobs Created - Division of Transportation Planning:<br />
Katie Benouar, Chief (916) 653-1818<br />
Countywide Transportation<br />
Sales Tax Measures<br />
Transit Districts (Permanent 0.5% Tax)<br />
• BART (Alameda, Contra Costa, San Francisco)<br />
• San Mateo • Santa Clara • Santa Cruz<br />
Countywide Transportation<br />
Sales Tax Measures 1 (cont.)<br />
Self-Help Counties - Temporary 0.5% Tax (in Millions)<br />
County<br />
Duration<br />
Est. 2016<br />
Revenue<br />
Alameda (Measure BB, 1% Tax) 2015-2045 $315<br />
Contra Costa 1989-2034 $85<br />
Fresno 1987-2027 $73<br />
Imperial 1990-2050 $17<br />
Los Angeles (1% Tax) Permanent $1,606<br />
Los Angeles (Measure R) 2009-2039 $803<br />
Madera 1990-2027 $9<br />
Marin 2005-2025 $27<br />
Napa (Measure T) 2 2018-2043 (Est.) -<br />
Orange 1991-2041 $345<br />
Riverside 1989-2039 $181<br />
Sacramento 1989-2039 $118<br />
San Bernardino 1990-2040 $184<br />
San Diego 1988-2048 $292<br />
San Francisco 1990-2034 $102<br />
San Joaquin 1991-2041 $57<br />
San Mateo 1989-2033 $87<br />
Santa Barbara 1990-2040 $38<br />
Santa Clara 1996-2036 (Est.) $218<br />
Santa Clara - (BART Ext 0.125%) 2013-2043 (Est.) $54<br />
Sonoma (0.25%) 2005-2025 $23<br />
Sonoma-Marin (SMART 0.25%) 2009-2029 $37<br />
Tulare 2007-2037 $34<br />
Total Estimated 2014 Revenue $4,689<br />
1<br />
Article XIIIB of the State Constitution provides the authority and requirements for the imposition<br />
of local sales tax measures subject to voter approval.<br />
2<br />
Napa will impose a one-half of one percent transactions and use tax for 25 years (Measure T).<br />
This tax will fund local street and road improvements and will be implemented once the Flood<br />
Protection tax (Measure A) expires. Measure A is expected to expire by 2018.<br />
Sales Tax Measure Data - Economic Analysis Branch - Division of Transportation Planning:<br />
Katie Benouar, Chief (916) 653-1818<br />
26 27<br />
Financial Information