

CALTRANS FACT BOOKLET
2016_CFB
2016_CFB

You also want an ePaper? Increase the reach of your titles
YUMPU automatically turns print PDFs into web optimized ePapers that Google loves.
Planning and Modal Programs<br />
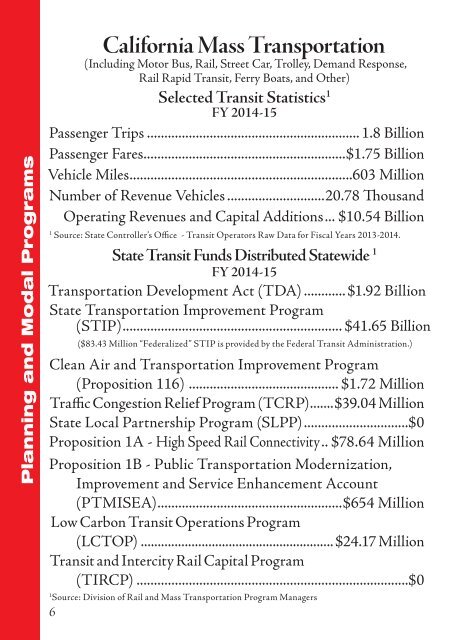
California Mass Transportation<br />
(Including Motor Bus, Rail, Street Car, Trolley, Demand Response,<br />
Rail Rapid Transit, Ferry Boats, and Other)<br />
Selected Transit Statistics 1<br />
FY 2014-15<br />
Passenger Trips.............................................................. 1.8 Billion<br />
Passenger Fares..........................................................$1.75 Billion<br />
Vehicle Miles.................................................................603 Million<br />
Number of Revenue Vehicles.............................20.78 Thousand<br />
Operating Revenues and Capital Additions.... $10.54 Billion<br />
1<br />
Source: State Controller’s Office - Transit Operators Raw Data for Fiscal Years 2013-2014.<br />
State Transit Funds Distributed Statewide 1<br />
FY 2014-15<br />
Transportation Development Act (TDA)............. $1.92 Billion<br />
State Transportation Improvement Program<br />
(STIP)................................................................ $41.65 Billion<br />
($83.43 Million “Federalized” STIP is provided by the Federal Transit Administration.)<br />
Clean Air and Transportation Improvement Program<br />
(Proposition 116) ............................................ $1.72 Million<br />
Traffic Congestion Relief Program (TCRP)........$39.04 Million<br />
State Local Partnership Program (SLPP)...............................$0<br />
Proposition 1A - High Speed Rail Connectivity... $78.64 Million<br />
Proposition 1B - Public Transportation Modernization,<br />
Improvement and Service Enhancement Account<br />
(PTMISEA)......................................................$654 Million<br />
Low Carbon Transit Operations Program<br />
(LCTOP).......................................................... $24.17 Million<br />
Transit and Intercity Rail Capital Program<br />
(TIRCP)...............................................................................$0<br />
1<br />
Source: Division of Rail and Mass Transportation Program Managers<br />
California Mass Transportation (cont.)<br />
Federal Transit Funds Distributed Statewide 1<br />
FY 2014-15 (FFY 2015)<br />
FTA 5310 - Enhanced Mobility of Seniors and Individuals with<br />
Disabilities Transportation .................................$33.7 Million<br />
FTA 5311 and 5311(f ) - Non-Urbanized Area<br />
Formula Program...........................................$27.9 Million<br />
FTA 5311 (b) - Rural Transit Assistance<br />
Program (RTAP)....................................... $370 Thousand<br />
FTA 5339 - Bus and Bus Facilities......................... $7.4 Million<br />
FTA 5339 - Bus and Bus Facilities<br />
State Discretionary ........................................$1.25 Million<br />
1<br />
Federal Transit Administration (FTA) Apportionment.<br />
Source: Division of Rail and Mass Transportation Program Managers<br />
California Intercity Rail Ridership<br />
By Calendar Year (in Millions)<br />
6 7<br />
Year<br />
Ridership<br />
2015 5.50<br />
2014 5.36<br />
2013 5.52<br />
2012 5.60<br />
2011 5.57<br />
2010 5.23<br />
Note: Ridership shown is the combined ridership for the Pacific Surfliner, San Joaquin, and<br />
Capitol Corridor routes.<br />
California Mass Transit and Interciy Rail Data - Division of Rail and Mass<br />
Transportation: Bruce Roberts, Chief (916) 654-7293<br />
Planning and Modal Programs