- Page 1 and 2: Understanding the Fundamentals of E
- Page 3 and 4: Preface Introductory epidemiology c
- Page 5 and 6: Table of Contents Chapter (in Acrob
- Page 7 and 8: 1. Introduction Definition, charact
- Page 9 and 10: problems (Schwartz and Carpenter, 1
- Page 11 and 12: HIV - a new or newly-recognized vir
- Page 13 and 14: d = principal investigator's degree
- Page 15 and 16: Analytic studies typically involve
- Page 17 and 18: Observational sciences especially a
- Page 19 and 20: McGavran EG. What is public health?
- Page 21 and 22: 2. An evolving historical perspecti
- Page 23 and 24: Time line for the history of public
- Page 25 and 26: as a one-room bacteriology laborato
- Page 27 and 28: − Health surveys − Research fun
- Page 29 and 30: his scientific peers of the correct
- Page 31 and 32: Kuhn, Thomas S. The structure of sc
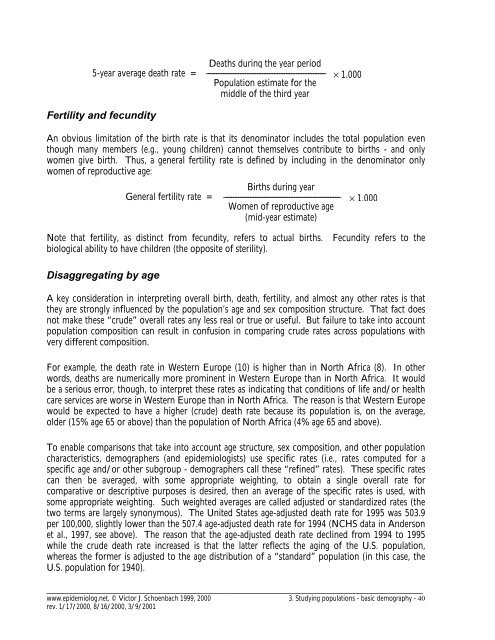
- Page 33 and 34: 3. Studying populations - basic dem
- Page 35 and 36: The demographic balancing equation
- Page 37 and 38: ates. Similarly, bulges in the repr
- Page 39 and 40: When the baby boom cohort retires 1
- Page 41: The pervasiveness, strength, viciou
- Page 45 and 46: Life expectancy The technique, of u
- Page 47 and 48: Excerpt from the U.S. 1993 abridged
- Page 49 and 50: At the other end of the life table,
- Page 51 and 52: to change, hopefully to decline. If
- Page 53 and 54: Thought question: Professors typica
- Page 55 and 56: Descriptive studies and surveillanc
- Page 57 and 58: 4. The Phenomenon of Disease Concep
- Page 59 and 60: Classification is the foundation As
- Page 61 and 62: As we gain more sophisticated under
- Page 63 and 64: To recapitulate the above discussio
- Page 65 and 66: Classifying cause of death Since mo
- Page 67 and 68: Laboratory and other objectively me
- Page 69 and 70: distribution but are not diabetic (
- Page 71 and 72: program in the general population,
- Page 73 and 74: Infectious disease Incubation "time
- Page 75 and 76: the direct effects of carcinogenic
- Page 77 and 78: patient outcomes. The design and ev
- Page 79 and 80: detected by screening will appear b
- Page 81 and 82: Morrison, Alan S. Screening in chro
- Page 83 and 84: e relevant. Compromises might be fo
- Page 85 and 86: educational attainment by the numbe
- Page 87 and 88: Distributions - the fuller picture
- Page 89 and 90: Per capita income: Should health ca
- Page 91 and 92: Deaths of children < 1 year of age
- Page 93 and 94:
No. of persons with senile dementia
- Page 95 and 96:
Incidence Immigration Relationship
- Page 97 and 98:
Examples: arthritis, cholelithiasis
- Page 99 and 100:
Cohort - entrance into the populati
- Page 101 and 102:
Sample calculation: 200 people free
- Page 103 and 104:
• The units of time must be state
- Page 105 and 106:
Calculation of person-time in a coh
- Page 107 and 108:
Original Calculation of person-time
- Page 109 and 110:
average risk for a member of the co
- Page 111 and 112:
However: Nurses: 601 cases/89,538 w
- Page 113 and 114:
treated. If the rate at which patie
- Page 115 and 116:
Incidence and prevalence in a popul
- Page 117 and 118:
small prevalence. So if the seropre
- Page 119 and 120:
Appendix on weighted averages Becau
- Page 121 and 122:
Appendix on exponents and logarithm
- Page 123 and 124:
and epidemiology. The notation ln(x
- Page 125 and 126:
3. For the following hypothetical d
- Page 127 and 128:
c. ________________ 6 fatalities /
- Page 129 and 130:
Measuring disease and exposure - As
- Page 131 and 132:
5. a. Flow Diagram Population of si
- Page 133 and 134:
New cases Q ID = ------------------
- Page 135 and 136:
Overview 6. Standardization of rate
- Page 137 and 138:
differences between the groups in f
- Page 139 and 140:
∑ (stratum-specific rates �× s
- Page 141 and 142:
especially important when comparing
- Page 143 and 144:
copy this cell to the other columns
- Page 145 and 146:
where the RR k are the stratum-spec
- Page 147 and 148:
and the observed number of deaths i
- Page 149 and 150:
Directly standardized rate for A =
- Page 151 and 152:
5,022 Indirectly standardized = —
- Page 153 and 154:
the situation among older age group
- Page 155 and 156:
Appendix on Standardized Mortality
- Page 157 and 158:
across age strata, then the damage
- Page 159 and 160:
d. How would you feel about the con
- Page 161 and 162:
Cases per 100,000 Mean annual incid
- Page 163 and 164:
d. dt Indirectly standardized rates
- Page 165 and 166:
The second ingredient for an standa
- Page 167 and 168:
Group US rate /100,000 County pop.
- Page 169 and 170:
Crude rates are comparable because
- Page 171 and 172:
The "Big Picture" 7. Relating risk
- Page 173 and 174:
Consider first the table on the lef
- Page 175 and 176:
The epidemiologist first arranges t
- Page 177 and 178:
(I1 - I0)/I0 = (0.01200-0.00800 / 0
- Page 179 and 180:
Descriptive adjectives for magnitud
- Page 181 and 182:
Odds ratio The odds ratio (OR) is a
- Page 183 and 184:
Duncan C. Thomas, "On the need for
- Page 185 and 186:
6. Odds of exposure in controls Pro
- Page 187 and 188:
CID = CI1 - CI0 = .20 - .10 = .10 (
- Page 189 and 190:
When both disease and exposure have
- Page 191 and 192:
variables is linear. An r of zero m
- Page 193 and 194:
2. In HIV-discordant couples in whi
- Page 195 and 196:
Incidence Diagrammatic representati
- Page 197 and 198:
PAR = AR × P1 = (I1 - I0)P1 = I -
- Page 199 and 200:
expresses the prevented cases as a
- Page 201 and 202:
Incidence Diagrammatic representati
- Page 203 and 204:
The result, (NHIH)/(NLIL+NHIH), is
- Page 205 and 206:
Proportion with = 0.5 ( 22 --- ) +
- Page 207 and 208:
CI may be preferred: � if the hea
- Page 209 and 210:
Appendix — Relating risk factors
- Page 211 and 212:
By definition, oddsr = risk / (1 -
- Page 213 and 214:
Bibliography Measures of effect: Te
- Page 215 and 216:
Relating risk factors to health - A
- Page 217 and 218:
4. In a study of adverse effects of
- Page 219 and 220:
number of "permanent" quits (define
- Page 221 and 222:
= I1n1- I0n1 + I0n0 - I0n0 ——
- Page 223 and 224:
2. Imprecision in determining the t
- Page 225 and 226:
Sometimes the appearance of a new s
- Page 227 and 228:
Case-control (case-referent, etc.)
- Page 229 and 230:
ealistic setting and results may th
- Page 231 and 232:
"ecologic fallacy", the erroneous i
- Page 233 and 234:
can vary substantially among indivi
- Page 235 and 236:
e estimated from that study since t
- Page 237 and 238:
Risk ratio Consider the example of
- Page 239 and 240:
Dietary Salt Intake and hypertensio
- Page 241 and 242:
Intervention trials can include tes
- Page 243 and 244:
Treatment allocation can be 1) fixe
- Page 245 and 246:
Example Cases Case-control studies
- Page 247 and 248:
Cases Controls ____________________
- Page 249 and 250:
population and that the controls we
- Page 251 and 252:
Estrogen users (N1) Nonusers (N0) N
- Page 253 and 254:
In the 3 × 10 6 unexposed women-ye
- Page 255 and 256:
similar to that in the case group t
- Page 257 and 258:
A modern perspective In general, de
- Page 259 and 260:
of exposed to unexposed persons sam
- Page 261 and 262:
Case-control studies: Armenian, Har
- Page 263 and 264:
Wingo, Phyllis A.; Howard W. Ory, P
- Page 265 and 266:
Part I Analytic study designs - Ass
- Page 267 and 268:
1. Doll and Hill state (page 1451,
- Page 269 and 270:
Part I Analytic study designs - Ass
- Page 271 and 272:
� Possible motivation to change b
- Page 273 and 274:
9. Causal inference * The desire to
- Page 275 and 276:
1955:35). Quarantine of sick person
- Page 277 and 278:
The mother who replaced the burned-
- Page 279 and 280:
As presented in Kleinbaum, Kupper,
- Page 281 and 282:
Popper maintains that it is fundame
- Page 283 and 284:
1. Is the association real or artef
- Page 285 and 286:
Temporality First exposure, then di
- Page 287 and 288:
confer upon us a freedom to ignore
- Page 289 and 290:
Lave, Lester B.; E.P. Seskin. Epide
- Page 291 and 292:
Precision The presence of random va
- Page 293 and 294:
the point estimate is based and thu
- Page 295 and 296:
methodological literature. Validity
- Page 297 and 298:
disease detection may be mistakenly
- Page 299 and 300:
In cohort studies, the primary sour
- Page 301 and 302:
present, then the D&C would detect
- Page 303 and 304:
Controls in an experiment In a true
- Page 305 and 306:
Southern endometrial cancer and est
- Page 307 and 308:
Cases ` The ` "detection bias" hypo
- Page 309 and 310:
from ETS, then a cohort study of ha
- Page 311 and 312:
employing lead exposure measures fr
- Page 313 and 314:
which the both measures increase in
- Page 315 and 316:
coefficient (slope) is to 1.0 and t
- Page 317 and 318:
_ _ Se = Pr(D'|D) Sp = PR(D'|D) _ _
- Page 319 and 320:
Differential misclassification, how
- Page 321 and 322:
subject plus or minus a random nois
- Page 323 and 324:
Appendix 2 More on the concern to a
- Page 325 and 326:
Bibliography Henneckens and Buring.
- Page 327 and 328:
Sackett, D.L.: Bias in analytic res
- Page 329 and 330:
e. OPTIONAL: If the reported cumula
- Page 331 and 332:
Results from the Evans County Cardi
- Page 333 and 334:
2. I1 = incidence in the exposed P1
- Page 335 and 336:
makes most sense to view detection
- Page 337 and 338:
Sensitivity × cases + (1 - Specifi
- Page 339 and 340:
In the factual world, however, we c
- Page 341 and 342:
Hypertensive SI participants were t
- Page 343 and 344:
3,154 male managers and white colla
- Page 345 and 346:
Table 2 Relationship of CHD to Beha
- Page 347 and 348:
a group did indeed have higher CHD
- Page 349 and 350:
Confounding - comparison of weighte
- Page 351 and 352:
Type A smokers) are not very meanin
- Page 353 and 354:
Different control groups for hypoth
- Page 355 and 356:
Confounding, then, is a function of
- Page 357 and 358:
Since the OR is the crossproduct ra
- Page 359 and 360:
Case-control study In a case-contro
- Page 361 and 362:
First and foremost, a potential con
- Page 363 and 364:
is defined in relation to the count
- Page 365 and 366:
poor. A scientific basis linking ra
- Page 367 and 368:
One way to obtain a better balance
- Page 369 and 370:
Stratified analysis is intuitively
- Page 371 and 372:
attributed to the exposure of inter
- Page 373 and 374:
Bibliography Rothman and Greenland
- Page 375 and 376:
Senior P, Bhopal RS. Ethnicity as a
- Page 377 and 378:
Some of the relationships just pres
- Page 379 and 380:
n1i _______________________________
- Page 381 and 382:
2. A 20-year retrospective cohort s
- Page 383 and 384:
No. of urinary tract infections Tab
- Page 385 and 386:
2. completely attributable to obesi
- Page 387 and 388:
5. a. C -- the adjusted relative ri
- Page 389 and 390:
of dietary antioxidants. However, c
- Page 391 and 392:
epidemiologic research is to identi
- Page 393 and 394:
Since the indicator variable (POP)
- Page 395 and 396:
Over two decades ago (Causes, Am J
- Page 397 and 398:
In this diagram, G and H exhibit ab
- Page 399 and 400:
In this situation, the first suffic
- Page 401 and 402:
Crude rates as weighted averages Re
- Page 403 and 404:
Lung cancer rates by smoking and as
- Page 405 and 406:
{B0} Smk Smk Asb. Asb. {B1} {B2} {B
- Page 407 and 408:
Notation for joint effects R1 risk
- Page 409 and 410:
and R111 = R000 + RD100 + RD010 + R
- Page 411 and 412:
RR11 = RR10 × RR01 [End of aside]
- Page 413 and 414:
multiplicative model supports the u
- Page 415 and 416:
Effect modification as a reflection
- Page 417 and 418:
4. Defining subgroups for preventiv
- Page 419 and 420:
Bibliography Rothman and Greenland,
- Page 421 and 422:
Multicausality: Effect modification
- Page 423 and 424:
4. Several studies have shown a syn
- Page 425 and 426:
1. Multicausality: Effect modificat
- Page 427 and 428:
In these data, or, Expected ROC,SMK
- Page 429 and 430:
to drinking in the absence of smoki
- Page 431 and 432:
we determine that confounding is pr
- Page 433 and 434:
Association between reserpine and b
- Page 435 and 436:
R11 R10 × R01 R10 —— = ——
- Page 437 and 438:
Hypothetical data on incidence of m
- Page 439 and 440:
1. Data conform to an additive mode
- Page 441 and 442:
Difference measure - the CID The va
- Page 443 and 444:
Distribution of CIR, IDR, OR 0 +1 M
- Page 445 and 446:
1 wi = ---------------------------
- Page 447 and 448:
5 Y n B 3 n Y C 8 n Y C 4 Y Y D 7 Y
- Page 449 and 450:
R11 - R00 = (R10 - R00) + (R01 - R0
- Page 451 and 452:
You may well wonder what is the val
- Page 453 and 454:
Moreover, the logistic model, we wi
- Page 455 and 456:
Key epidemiologic assumptions in th
- Page 457 and 458:
a + b1X1 + b2X2 + b3X3 + …) on th
- Page 459 and 460:
Wilcosky, Timothy C. and Lloyd E. C
- Page 461 and 462:
Data analysis and interpretation Ep
- Page 463 and 464:
Range checks Range checks compare e
- Page 465 and 466:
� Decisions deferred have to be m
- Page 467 and 468:
� Simpler is better � Avoid ext
- Page 469 and 470:
educe bias and tend to introduce ad
- Page 471 and 472:
data. Perhaps too often generalitie
- Page 473 and 474:
When this "analogous experiment" is
- Page 475 and 476:
tests are based (e.g., see Sander G
- Page 477 and 478:
The probability associated with bei
- Page 479 and 480:
conclude that the association is su
- Page 481 and 482:
Exposed to diethylstilbesterol? Yes
- Page 483 and 484:
For example, suppose that we are co
- Page 485 and 486:
The idea behind small studies bias
- Page 487 and 488:
Confidence intervals address the qu
- Page 489 and 490:
Computing a confidence interval for
- Page 491 and 492:
Bibliography General Ahlbom, Anders
- Page 493 and 494:
Thompson, W. Douglas. Statistical c
- Page 495 and 496:
Appendix Estimating sample size to
- Page 497 and 498:
p1 (1 - p1) p2 (1 - p2) σ 2 1 σ 2
- Page 499 and 500:
Margin of error (rounded) Point Sam
- Page 501 and 502:
Meditations on hypothesis testing a
- Page 503 and 504:
Independent replication is the corn
- Page 505 and 506:
More meditations on interpreting st
- Page 507 and 508:
Part I Data analysis and interpreta
- Page 509 and 510:
Part I 1. (a) Restriction Data anal
- Page 511 and 512:
9. ORCIG,HYP,OC [multiplicative mod
- Page 513 and 514:
15. Practical aspects of epidemiolo
- Page 515 and 516:
(CDC, which includes the National I
- Page 517 and 518:
cardiovascular area -- notably the
- Page 519 and 520:
Disease Control (CDC) decided again
- Page 521 and 522:
After submission but before the awa
- Page 523 and 524:
Journal of Medicine, Jan 14, 1999,
- Page 525 and 526:
Explore the data � Look at data (
- Page 527 and 528:
Recently, standardization has come
- Page 529 and 530:
Riesenberg, Don; Goerge D. Lundberg
- Page 531 and 532:
16. Data management and data analys
- Page 533 and 534:
implications, or suspicions or char
- Page 535 and 536:
1.4.1.2 Consistency Consistency is
- Page 537 and 538:
1.4.5.1.2 Series Runs in series are
- Page 539 and 540:
Obviously it will be easier to asse
- Page 541 and 542:
2.1.2.1 Statistical There are forma
- Page 543 and 544:
2.3.5 Bivariate displays If the sam
- Page 545 and 546:
errors. Related to this concern is
- Page 547 and 548:
3.3 Expected values Perhaps, the si
- Page 549 and 550:
Despite the best efforts, however,
- Page 551 and 552:
Complete data cases % distribution
- Page 553 and 554:
3.5 Outliers Outliers are now exami
- Page 555 and 556:
Bibliography Davidson, Fred. Princi
- Page 557 and 558:
attrib ckd length=$1 label='Check d
- Page 559 and 560:
17. Epidemiology and public health
- Page 561 and 562:
� Geneva - " . . . IFV and allied
- Page 563 and 564:
public health, since the best oppor
- Page 565 and 566:
Individual-level versus societal le
- Page 567 and 568:
14%, so that the burden of the envi
- Page 569 and 570:
1. exhausting various non-renewable
- Page 571 and 572:
O'Hare WP, Pollard KM, Mann TL, Ken
- Page 573 and 574:
� Health for all What contributes
- Page 575 and 576:
Challenges in the environment for e
- Page 577 and 578:
� What kind of population is requ
- Page 579:
Bibliography American College of Ep