- Page 1:
Nepal Health Facility Survey 2015 F
- Page 4 and 5:
This report presents findings of th
- Page 6 and 7:
3 FACILITY-LEVEL INFRASTRUCTURE, RE
- Page 8 and 9:
7 DELIVERY AND NEWBORN CARE .......
- Page 11 and 12:
TABLES AND FIGURES 1 OVERVIEW OF TH
- Page 13 and 14:
Figure 4.3 Trends in early childhoo
- Page 15 and 16:
Table 7.12 Postpartum exit delivery
- Page 17:
PREFACE T his is the first comprehe
- Page 21 and 22:
ACKNOWLEDGMENTS T he 2015 Nepal Hea
- Page 23:
LIST OF CONTRIBUTORS Chapter 1 Ram
- Page 26 and 27:
GDP HA HDC HFOMC HIV HLD HMIS HP HT
- Page 28 and 29:
VDC VDRL WHO village development co
- Page 30 and 31:
Eighty-five percent of facilities o
- Page 32 and 33:
Five percent of all facilities offe
- Page 34 and 35:
xxxii • Map of Nepal
- Page 36 and 37:
According to the 2013 Global Burden
- Page 38 and 39:
1.2.3 Nepal Health Sector Program T
- Page 40 and 41:
1.3 THE HEALTH CARE SYSTEM 1.3.1 Ov
- Page 42 and 43:
Figure 1.2 Health service delivery
- Page 44 and 45:
prepared on an incremental basis ac
- Page 47 and 48:
METHODOLOGY 2 2.1 OVERVIEW T he 201
- Page 49 and 50:
Health Facility Operation and Manag
- Page 51 and 52:
Assess the computer programs (CAPI
- Page 53 and 54:
Data Sorting, Editing, and Entry at
- Page 55 and 56:
Table 2.2 Results of facility conta
- Page 57 and 58:
Table 2.4 Distribution of providers
- Page 59 and 60:
2.5.3 Sample for Observations and E
- Page 61 and 62:
Table 2.8 Distribution of observed
- Page 63 and 64:
FACILITY-LEVEL INFRASTRUCTURE, RESO
- Page 65 and 66:
Table 3.1 Availability of specific
- Page 67 and 68: Figure 3.1 Availability of basic cl
- Page 69 and 70: Overall, around three fourths of pr
- Page 71 and 72: 3.3.3 Standard Precautions for Infe
- Page 73 and 74: PHCCs, HPs, or UHCs had all of the
- Page 75 and 76: Table 3.6 Capacity for processing e
- Page 77 and 78: Table 3.7.2 Laboratory diagnostic c
- Page 79 and 80: normal delivery services are consid
- Page 81 and 82: Overall, 37 percent of health facil
- Page 83 and 84: 3.4.2 Supportive Management for Pro
- Page 85 and 86: Supportive Management Practices A f
- Page 87 and 88: Table 3.13 HMIS status: HMIS report
- Page 89 and 90: Table 3.15 Storage practice for med
- Page 91 and 92: types, PHCCs (78 percent) were leas
- Page 93 and 94: Table 3.19 Average number of client
- Page 95 and 96: and counseling of clients on at lea
- Page 97 and 98: Table 3.20c Compliance with service
- Page 99 and 100: Table 3.21b Provision of quality fa
- Page 101 and 102: Table 3.22 Financial audit, disaste
- Page 103 and 104: CHILD HEALTH SERVICES 4 Key Finding
- Page 105 and 106: According to the 2011 Nepal Demogra
- Page 107 and 108: Figure 4.3 Trends in early childhoo
- Page 109: 4.2.2 Vitamin A Supplementation The
- Page 112 and 113: Table 4.4 Guidelines, trained staff
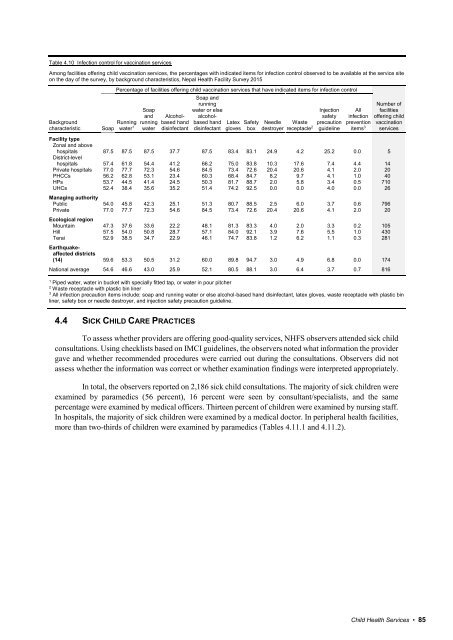
- Page 114 and 115: Figure 4.6 Items for infection cont
- Page 116 and 117: Figure 4.7 Availability of essentia
- Page 120 and 121: Table 4.11.1 Assessments and examin
- Page 122 and 123: 4.4.1 Full Assessment IMCI/IMNCI Ge
- Page 124 and 125: 4.5 CLIENT OPINIONS Before leaving
- Page 126 and 127: With regard to the topics of in-ser
- Page 128 and 129: Service readiness. Section 5.3, inc
- Page 130 and 131: Table 5.1 Availability of family pl
- Page 132 and 133: Table 5.3.1 Family planning service
- Page 134 and 135: Table 5.4.1 Methods of family plann
- Page 136 and 137: 5.3 SERVICE READINESS 5.3.1 Service
- Page 138 and 139: Table 5.7 Items for infection contr
- Page 140 and 141: Table 5.8.1 Client history and phys
- Page 142 and 143: Privacy during a family planning co
- Page 144 and 145: Table 5.10.1 Components of counseli
- Page 146 and 147: Table 5.11.1 Feedback from family p
- Page 148 and 149: 5.6.2 Training Continual training f
- Page 151 and 152: ANTENATAL CARE 6 Key Findings Abou
- Page 153 and 154: Facilities providing ANC services i
- Page 155 and 156: 6.2). Fifty-three percent of the fa
- Page 157 and 158: 6.3.4 Medicines The national antena
- Page 159 and 160: who are anemic. Only around 4 in 10
- Page 161 and 162: Physical Examinations and Preventiv
- Page 163 and 164: Table 6.8.2 Basic physical examinat
- Page 165 and 166: Table 6.9.1 Content of antenatal ca
- Page 167 and 168: Table 6.9a.1 Content of antenatal c
- Page 169 and 170:
Table 6.10.1 Content of antenatal c
- Page 171 and 172:
6.5.1 Client Knowledge Tables 6.11.
- Page 173 and 174:
Table 6.12.2 Feedback from antenata
- Page 175 and 176:
With regard to supervision of ANC p
- Page 177 and 178:
Table 6.16 Guidelines, trained staf
- Page 179 and 180:
DELIVERY AND NEWBORN CARE 7 Key Fin
- Page 181:
A quarter of facilities that offer
- Page 184 and 185:
Table 7.2 Guidelines, trained staff
- Page 186 and 187:
Table 7.3.2 Medicines and commoditi
- Page 188 and 189:
than facilities in the hill (75 per
- Page 190 and 191:
Considering the signal functions se
- Page 193 and 194:
Table 7.6 presents the proportion o
- Page 195 and 196:
7.6 BASIC MANAGEMENT AND ADMINISTRA
- Page 197 and 198:
Table 7.10 Training for providers o
- Page 199 and 200:
Table 7.12 Postpartum exit delivery
- Page 201:
Table 7.13.2 Postpartum check/advic
- Page 204 and 205:
new infections have dropped to belo
- Page 206 and 207:
Table 8.1 Availability of HIV testi
- Page 208 and 209:
had waste receptacles. Half of the
- Page 210 and 211:
176 • HIV/AIDS and Sexually Trans
- Page 212 and 213:
Good record-keeping systems to trac
- Page 214 and 215:
premature babies, and stillborn bir
- Page 216 and 217:
To be considered ready to provide S
- Page 218 and 219:
Chronic respiratory diseases. Secti
- Page 220 and 221:
Table 9.1 Guidelines, trained staff
- Page 222 and 223:
Table 9.2 Diagnostic capacity and e
- Page 224 and 225:
Figure 9.3 Items to support quality
- Page 226 and 227:
have spacers for inhalers. The latt
- Page 228 and 229:
Figure 9.6 Medicines and commoditie
- Page 230 and 231:
Although the number of TB cases and
- Page 232 and 233:
Only one-third of facilities in Nep
- Page 234 and 235:
terai (13 percent) regions. Similar
- Page 237 and 238:
MALARIA 11 Key Findings Half of Ne
- Page 239 and 240:
years, ACT stocks at health facilit
- Page 241 and 242:
Table 11.2 Availability of malaria
- Page 243 and 244:
11.4.2 Treatment Readiness to Treat
- Page 245 and 246:
REFERENCES Bhandari, G. P., M. R. A
- Page 247 and 248:
National Centre for AIDS and STD Co
- Page 249:
2016 - 2021 NHSS RF INDICATORS MATR
- Page 252 and 253:
7 8 Radhika Bogati Nisha Khadka Sad
- Page 255 and 256:
QUESTIONNAIRES Appendix C Appendix
- Page 257 and 258:
NEPAL HEALTH FACILITY SURVEY - 2015
- Page 259 and 260:
FACILITY IDENTIFICATION 001 NAME OF
- Page 261 and 262:
FIND THE MANAGER, THE PERSON IN-CHA
- Page 263 and 264:
SECTION 2: GENERAL FILTER QUESTIONS
- Page 265 and 266:
SOURCE OF WATER 330 What is the mos
- Page 267 and 268:
360* Does this facility have any ro
- Page 269 and 270:
SECTION 4: STAFFING - MANAGEMENT -
- Page 271 and 272:
420X CHECK Q006 FACILITY TYPE IS FA
- Page 273 and 274:
HMIS FIND THE PERSON RESPONSIBLE FO
- Page 275 and 276:
SECTION 5: PROCESSING OF INSTRUMENT
- Page 277 and 278:
602 CHECK Q600 FACILITY-BASED WASTE
- Page 279 and 280:
SECTION 7: BASIC SUPPLIES - CLIENT
- Page 281 and 282:
SECTION 8: DIAGNOSTICS 800 CHECK Q1
- Page 283 and 284:
811* Please tell me if: (a) (b) (c
- Page 285 and 286:
830 Does this facility do any blood
- Page 287 and 288:
847C* Does this facility do any tes
- Page 289 and 290:
861 Does this facility do any TB te
- Page 291 and 292:
SECTION 9: MEDICINES AND COMMODITIE
- Page 293 and 294:
MEDICINES FOR NON-COMMUNICABLE DISE
- Page 295 and 296:
MATERNAL AND CHILD HEALTH 906* Are
- Page 297 and 298:
SECTION 9.2: CONTRACEPTIVE COMMODIT
- Page 299 and 300:
SECTION 9.3: ANTI-TB DRUGS 930 CHEC
- Page 301 and 302:
944* Are any of the following Fusio
- Page 303 and 304:
1006* ASK YOUR RESPONDENT TO SHOW Y
- Page 305 and 306:
SECTION 11: CHILD GROWTH MONITORING
- Page 307 and 308:
1210 I would like to know if the fo
- Page 309 and 310:
SECTION 13: FAMILY PLANNING 1300 CH
- Page 311 and 312:
EQUIPMENT AND SUPPLIES 1314* I woul
- Page 313 and 314:
INFECTION CONTROL 1350 ASSESS THE R
- Page 315 and 316:
1407* As part of ANC services, plea
- Page 317 and 318:
INFECTION CONTROL 1450 ASSESS THE R
- Page 319 and 320:
1509* Do you have the national guid
- Page 321 and 322:
SECTION 16: DELIVERY AND NEWBORN CA
- Page 323 and 324:
EQUIPMENT AND SUPPLIES FOR ROUTINE
- Page 325 and 326:
PMTCT DURING LABOR AND DELIVERY 162
- Page 327 and 328:
SECTION 17: MALARIA 1700 CHECK Q102
- Page 329 and 330:
SECTION 18: SEXUALLY TRANSMITTED IN
- Page 331 and 332:
1851 INFECTION CONTROL AND CONDITIO
- Page 333 and 334:
1910 CHECK Q1902 AND Q1908 NO TB DI
- Page 335 and 336:
SECTION 20: HIV TESTING AND COUNSEL
- Page 337 and 338:
SECTION 21: HIV TREATMENT 2100 CHEC
- Page 339 and 340:
SECTION 22: HIV CARE AND SUPPORT 22
- Page 341 and 342:
BASIC SUPPLIES AND EQUIPMENT 2330 A
- Page 343 and 344:
SECTION 24: MINOR SURGICAL SERVICES
- Page 345 and 346:
SECTION 25: CESAREAN DELIVERY 2500
- Page 347 and 348:
SECTION 27: BLOOD TRANSFUSION SERVI
- Page 349 and 350:
SECTION 30: GENERAL FACILITY LEVEL
- Page 351 and 352:
NEPAL HEALTH FACILITY SURVEY - 2015
- Page 353 and 354:
201* CHECK [Q103] FOR PROVIDER OCCU
- Page 355 and 356:
4. FAMILY PLANNING SERVICES 400 In
- Page 357 and 358:
DELIVERY SERVICES 506 In your curre
- Page 359 and 360:
7. DIAGNOSTIC SERVICES 700 In your
- Page 361 and 362:
808 Among the various things relate
- Page 363 and 364:
Sample List for ANTENATAL CARE Obse
- Page 365 and 366:
Sample List for ANTENATAL CARE Obse
- Page 367 and 368:
NEPAL HEALTH FACILITY SURVEY - 2015
- Page 369 and 370:
NO. QUESTION / OBSERVATIONS CODES F
- Page 371 and 372:
NO. QUESTION / OBSERVATIONS ROUTINE
- Page 373 and 374:
NO. QUESTION / OBSERVATIONS DANGER
- Page 375 and 376:
NEPAL HEALTH FACILITY SURVEY - 2015
- Page 377 and 378:
NO. QUESTIONS CODING CLASSIFICATION
- Page 379 and 380:
NO. QUESTIONS CODING CLASSIFICATION
- Page 381 and 382:
205 What is the total amount you pa
- Page 383 and 384:
Sample List for FAMILY PLANNING Obs
- Page 385 and 386:
Sample List for FAMILY PLANNING Obs
- Page 387 and 388:
Nepal Health Facility Survey 2015 O
- Page 389 and 390:
NO. QUESTIONS / OBSERVATIONS CLIENT
- Page 391 and 392:
NO. QUESTIONS / OBSERVATIONS FOR Q1
- Page 393 and 394:
NO. QUESTIONS / OBSERVATIONS CODES
- Page 395 and 396:
NO. QUESTIONS / OBSERVATIONS CODES
- Page 397 and 398:
NO. QUESTIONS / OBSERVATIONS CODES
- Page 399 and 400:
NO. QUESTIONS / OBSERVATIONS 9. IMP
- Page 401 and 402:
NO. QUESTIONS / OBSERVATIONS CODES
- Page 403 and 404:
Nepal Health Facility Survey 2015 F
- Page 405 and 406:
NO. QUESTIONS CODING CLASSIFICATION
- Page 407 and 408:
NO. QUESTIONS CODING CLASSIFICATION
- Page 409 and 410:
205 What is the total amount you pa
- Page 411 and 412:
Sample List for SICK CHILD Observat
- Page 413 and 414:
Sample List for SICK CHILD Observat
- Page 415 and 416:
Nepal Health Facility Survey-2015 O
- Page 417 and 418:
NO. 5. PROVIDER INTERACTION WITH CA
- Page 419 and 420:
NO. QUESTIONS / OBSERVATIONS CODES
- Page 421 and 422:
NO. QUESTIONS / OBSERVATIONS CODES
- Page 423 and 424:
NO. QUESTIONS / OBSERVATIONS CODES
- Page 425 and 426:
Nepal Health Facility Survey-2015 S
- Page 427 and 428:
110 Has [HE/SHE] had watery and fre
- Page 429 and 430:
TREATMENT AND CARETAKER COMFORT LEV
- Page 431 and 432:
UNDERWEIGHT 136A Did the provider t
- Page 433 and 434:
205 What is the total amount you pa
- Page 435 and 436:
Sample List for POST PARTUM WOMEN D
- Page 437 and 438:
Nepal Health Facility Survey - 2015
- Page 439 and 440:
200. ACCESSING CARE AND DECISION MA
- Page 441 and 442:
S.N. Question/Information Coding Ca
- Page 443 and 444:
S.N. Question/Information Coding Ca
- Page 445 and 446:
S.N. Question/Information Coding Ca
- Page 447 and 448:
S.N. Question/Information Coding Ca
- Page 449 and 450:
S.N. Question/Information Coding Ca
- Page 451 and 452:
Nepal Health Facility Survey 2015 H
- Page 453 and 454:
2.0 Composition, Training and Knowl
- Page 455 and 456:
3.0 Participation Q.N. Questions Co
- Page 457 and 458:
Facility No.:____________________ T
- Page 459 and 460:
STAFF LISTING FORM: HEALTH WORKERS
- Page 461 and 462:
STAFF LISTING FORM: HEALTH WORKERS
- Page 463 and 464:
STAFF LISTING FORM: HEALTH WORKERS
- Page 465 and 466:
STAFF LISTING FORM: HEALTH WORKERS
- Page 467 and 468:
STAFF LISTING FORM: HEALTH WORKERS