Unilever Annual Report & Accounts and Form 20-F 2000
Unilever Annual Report & Accounts and Form 20-F 2000
Unilever Annual Report & Accounts and Form 20-F 2000
- TAGS
- unilever
- annual
- accounts-and-form
- f

You also want an ePaper? Increase the reach of your titles
YUMPU automatically turns print PDFs into web optimized ePapers that Google loves.
40<br />
<strong>Unilever</strong> <strong>Annual</strong> <strong>Report</strong> & <strong>Accounts</strong> <strong>and</strong> <strong>Form</strong> <strong>20</strong>-F <strong>20</strong>00 <strong>Report</strong> of the Directors<br />
Remuneration report<br />
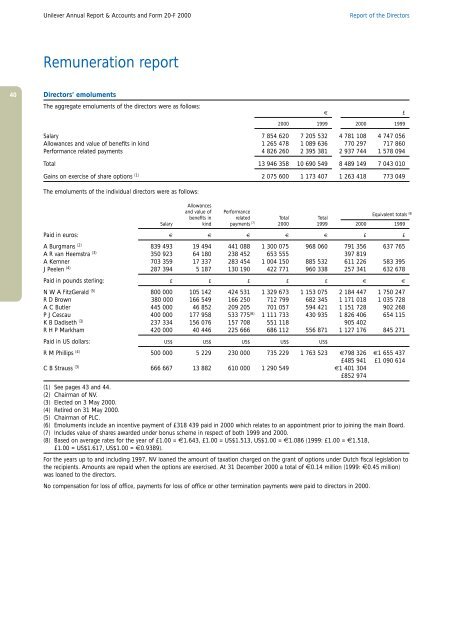
Directors’ emoluments<br />
The aggregate emoluments of the directors were as follows:<br />
€ £<br />
<strong>20</strong>00 1999 <strong>20</strong>00 1999<br />
Salary 7 854 6<strong>20</strong> 7 <strong>20</strong>5 532 4 781 108 4 747 056<br />
Allowances <strong>and</strong> value of benefits in kind 1 265 478 1 089 636 770 297 717 860<br />
Performance related payments 4 826 260 2 395 381 2 937 744 1 578 094<br />
Total 13 946 358 10 690 549 8 489 149 7 043 010<br />
Gains on exercise of share options (1) 2 075 600 1 173 407 1 263 418 773 049<br />
The emoluments of the individual directors were as follows:<br />
Allowances<br />
<strong>and</strong> value of Performance<br />
Equivalent totals (8)<br />
benefits in related Total Total<br />
Salary kind payments (7) <strong>20</strong>00 1999 <strong>20</strong>00 1999<br />
Paid in euros: € € € € € £ £<br />
A Burgmans (2) 839 493 19 494 441 088 1 300 075 968 060 791 356 637 765<br />
A R van Heemstra (3) 350 923 64 180 238 452 653 555 397 819<br />
A Kemner 703 359 17 337 283 454 1 004 150 885 532 611 226 583 395<br />
J Peelen (4) 287 394 5 187 130 190 422 771 960 338 257 341 632 678<br />
Paid in pounds sterling: £ £ £ £ £ € €<br />
N W A FitzGerald (5) 800 000 105 142 424 531 1 329 673 1 153 075 2 184 447 1 750 247<br />
R D Brown 380 000 166 549 166 250 712 799 682 345 1 171 018 1 035 728<br />
A C Butler 445 000 46 852 <strong>20</strong>9 <strong>20</strong>5 701 057 594 421 1 151 728 902 268<br />
P J Cescau 400 000 177 958 533 775 (6) 1 111 733 430 935 1 826 406 654 115<br />
K B Dadiseth (3) 237 334 156 076 157 708 551 118 905 402<br />
R H P Markham 4<strong>20</strong> 000 40 446 225 666 686 112 556 871 1 127 176 845 271<br />
Paid in US dollars: US$ US$ US$ US$ US$<br />
R M Phillips (4) 500 000 5 229 230 000 735 229 1 763 523 €798 326 €1 655 437<br />
£485 941 £1 090 614<br />
C B Strauss (3) 666 667 13 882 610 000 1 290 549 €1 401 304<br />
£852 974<br />
(1) See pages 43 <strong>and</strong> 44.<br />
(2) Chairman of NV.<br />
(3) Elected on 3 May <strong>20</strong>00.<br />
(4) Retired on 31 May <strong>20</strong>00.<br />
(5) Chairman of PLC.<br />
(6) Emoluments include an incentive payment of £318 439 paid in <strong>20</strong>00 which relates to an appointment prior to joining the main Board.<br />
(7) Includes value of shares awarded under bonus scheme in respect of both 1999 <strong>and</strong> <strong>20</strong>00.<br />
(8) Based on average rates for the year of £1.00 = €1.643, £1.00 = US$1.513, US$1.00 = €1.086 (1999: £1.00 = €1.518,<br />
£1.00 = US$1.617, US$1.00 = €0.9389).<br />
For the years up to <strong>and</strong> including 1997, NV loaned the amount of taxation charged on the grant of options under Dutch fiscal legislation to<br />
the recipients. Amounts are repaid when the options are exercised. At 31 December <strong>20</strong>00 a total of €0.14 million (1999: €0.45 million)<br />
was loaned to the directors.<br />
No compensation for loss of office, payments for loss of office or other termination payments were paid to directors in <strong>20</strong>00.