Code of Practice - Irrigated Public Open Space - SA Water
Code of Practice - Irrigated Public Open Space - SA Water
Code of Practice - Irrigated Public Open Space - SA Water

Create successful ePaper yourself
Turn your PDF publications into a flip-book with our unique Google optimized e-Paper software.
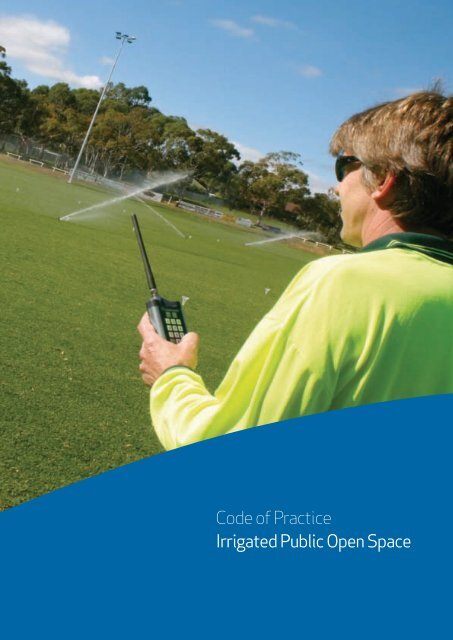
<strong>Code</strong> <strong>of</strong> <strong>Practice</strong><br />
<strong>Irrigated</strong> <strong>Public</strong> <strong>Open</strong> <strong>Space</strong>
CONTENTS<br />
1 EXECUTIVESUMMARY<br />
3 1.0 FOREWORD<br />
4 2.0 INTRODUCTION<br />
4 2.1 Why develop a <strong>Code</strong> <strong>of</strong> <strong>Practice</strong>?<br />
4 2.2 Whatis the aim<strong>of</strong> the <strong>Code</strong>?<br />
5 2.3 Whatarethe benefits <strong>of</strong> using the <strong>Code</strong>?<br />
5 2.4 Who shoulduse the <strong>Code</strong>?<br />
5 2.5 Whatis the legal status <strong>of</strong> the <strong>Code</strong>?<br />
5 2.6 Whatotheradviceis available?<br />
5 2.7 Glossary <strong>of</strong> terms and abbreviations<br />
6 3.0 POLICY&PLANNING<br />
6 3.1 <strong>Water</strong> use policy<br />
7 3.2 <strong>Water</strong> use objectives<br />
8 4.0 WATERSUPPLYOPTIONS<br />
10 5.0 TURF & IRRIGATION<br />
MANAGEMENT PRINCIPLES<br />
10 5.1 Irrigation system design<br />
11 5.2 Irrigation system installation and supervision<br />
11 5.3 Irrigation system maintenance and performance<br />
14 5.4 Plant/turf species selection<br />
14 5.5 Turf quality/‘fit for purpose’<br />
15 5.6 Turf and horticultural practices<br />
17 5.7 <strong>Water</strong> budget<br />
17 5.7.1 Irrigation Requirement ( Ir)<br />
21 5.7.2 Base Irrigation Requirement (BIr)<br />
22 5.7.3 Irrigation Requirement 2006/07 (<br />
Ir(06/07))<br />
23 5.8 Irrigation scheduling<br />
23 5.8.1 How much water does the plant need?<br />
24 5.8.2 How much water is stored in the soil?<br />
25 5.8.3 How much water is available to the plant?<br />
25 5.8.4 How much water needs to be applied?<br />
26 5.8.5 When should irrigation be applied?<br />
26 5.8.6 How long should the irrigation system be<br />
operated?<br />
28 5.9 Irrigation management technology<br />
28 5.9.1 Weather Based Irrigation Control Systems<br />
(WBICS)<br />
28 5.9.2 Weather stations<br />
28 5.9.3 Soil Moisture Based Control Systems<br />
(SMBCS)<br />
29 5.9.4 Rainfall sensors<br />
29 5.9.5 Flow/pressure sensors<br />
29 5.9.6 Computerised Irrigation Management<br />
Systems (CIMS)<br />
31 6.0 IRRIGATION MONITORING<br />
& PERFORMANCE REPORTING<br />
31 6.1 Irrigation efficiency reporting<br />
33 6.2 Turf quality/‘fit for use’ reporting<br />
34 7.0 DROUGHT RESPONSE PLAN<br />
35 8.0 TRAINING & CERTIFICATION<br />
35 9.0 CONCLUSION<br />
36 APPENDICES<br />
1. IPOS – IRRIGATION REQUIREMENT MODEL<br />
2. IPOS – IRRIGATION SCHEDULING MODEL<br />
3. IPOS– IRRIGATION EFFICIENCY<br />
REPORTING MODEL<br />
37 4. DETAILED CASE STUDIES<br />
45 5. GLOS<strong>SA</strong>RY OF TERMS & ABBREVIATIONS
ACKNOWLEDGMENTS<br />
The development <strong>of</strong> the <strong>Code</strong> <strong>of</strong> <strong>Practice</strong> for <strong>Irrigated</strong> <strong>Public</strong><br />
<strong>Open</strong> <strong>Space</strong> (IPOS) was supported by <strong>SA</strong> <strong>Water</strong> as part <strong>of</strong><br />
the State Government’s <strong>Water</strong> Pro<strong>of</strong>ing Adelaide Strategy and<br />
was managed by IPOS Consulting Pty Ltd reporting to the<br />
following reference group;<br />
• <strong>SA</strong> <strong>Water</strong><br />
• <strong>SA</strong> Local Government Association<br />
• Murray Darling Association<br />
• Local Government Turf & Irrigation Technical Group<br />
• Irrigation Australia Limited, <strong>SA</strong> Region<br />
• Australian Golf Course Superintendents Association, <strong>SA</strong><br />
• Parks & Leisure Australia<br />
• Bureau <strong>of</strong> Meteorology<br />
• Turf Grass Australia, <strong>SA</strong> Region<br />
• Department <strong>of</strong> Education & Children’s Services<br />
• Botanic Gardens <strong>of</strong> Adelaide.<br />
The specific input provided by the following organisations is<br />
acknowledged:<br />
•RuralSolutions<strong>SA</strong>andHydroPlanPtyLtd(fortechnical<br />
advice in developing irrigation requirements).<br />
•MircometPtyLtd(fortechnicalinputandthe<br />
development <strong>of</strong> the TQVS classifications).<br />
•University<strong>of</strong>Melbourne (for technical input and<br />
provision <strong>of</strong> graphics).<br />
In addition, the input <strong>of</strong> the many industry representatives<br />
who attended industry workshops is much appreciated.<br />
Disclaimer<br />
The <strong>Code</strong> has been developed using a range <strong>of</strong> information<br />
sourced from the public domain and provided by industry<br />
representatives. Every effort has been made to verify and<br />
correctly source information used to avoid errors or<br />
oversights but it is recognised that some may exist. It is also<br />
recognised that technology and management methods are<br />
changing with time and the methods used in the <strong>Code</strong> are<br />
not the only viable methods to achieve the outcome <strong>of</strong><br />
efficient irrigation management.
EXECUTIVE SUMMARY<br />
The <strong>Code</strong> <strong>of</strong> <strong>Practice</strong> for <strong>Irrigated</strong> <strong>Public</strong> <strong>Open</strong> <strong>Space</strong><br />
(IPOS) provides a template which can be used by open<br />
space managers to ensure the planning, management and<br />
reporting <strong>of</strong> water consumption in the urban environment is<br />
based on sound principles applied consistently at all levels<br />
<strong>of</strong> management.<br />
The <strong>Code</strong> can be used by providers, practitioners, and<br />
regulating authorities to set policy, manage resources and<br />
regulate water use in the provision <strong>of</strong> irrigated public<br />
open space.<br />
The <strong>Code</strong> provides a management framework for best<br />
practice turf and irrigation management for all irrigated<br />
public open space, including that managed by local<br />
government, the education sector and other IPOS<br />
managers. It forms the basis by which the industry can<br />
demonstrate efficient, effective resource management.<br />
A commitment to managing irrigation is the first and most<br />
critical step to realising water efficient irrigation practices.<br />
While the principles contained within the <strong>Code</strong> can be<br />
applied to all aspects <strong>of</strong> irrigated public open space, the<br />
<strong>Code</strong> specifically addresses irrigated turf rather than trees,<br />
landscape and ornamental gardens.<br />
1<br />
Aim<br />
The aim <strong>of</strong> the <strong>Code</strong> is to provide the tools and reporting<br />
models necessary to implement best practice irrigation<br />
management in the provision <strong>of</strong> public open space.<br />
This <strong>Code</strong> seeks to provide the following to potential<br />
subscribers:<br />
1. The need for developing a Turf and Irrigation<br />
Management Plan.<br />
2. The benefits <strong>of</strong> adopting the <strong>Code</strong>.<br />
3. The tools and reporting models necessary to implement<br />
best practice irrigation management.<br />
Benefits<br />
Subscription to the <strong>Code</strong> brings significant benefits not only<br />
to the subscriber but to the community and environment in<br />
a broader context. These benefits may be summarised as:<br />
1. ‘Fit for purpose’ turf.<br />
2. Significant water savings translating into reduced<br />
watering costs.<br />
3. Increased flexibility for the irrigator in the case <strong>of</strong> water<br />
restrictions.<br />
4. Recognition <strong>of</strong> the level <strong>of</strong> irrigation efficiency in<br />
assessing exemption applications in the case <strong>of</strong><br />
restrictions.<br />
5. Efficient irrigators are not penalised for efficiencies<br />
already demonstrated.<br />
6. Community recognition/accountability/demonstration <strong>of</strong><br />
efficient watering practices.<br />
7. Potential aversion <strong>of</strong> public health and safety issues –<br />
particularly in the case <strong>of</strong> school ovals and sporting<br />
grounds.<br />
8. Increased amenity levels associated with appropriately<br />
irrigated public open space.
The model explained<br />
Turf must be maintained to a level that ensures it is ‘fit for<br />
purpose’ and meets its functional objective. A passive<br />
irrigated area can be maintained using up to 50% less water<br />
than required for an active sportsground.<br />
Benchmark application rates provide a guide to how much<br />
water is required on an annual basis to sustain turf at the<br />
designated quality level based on average climatic conditions.<br />
These benchmarks are expressed in kL/hectare/annum and<br />
provide an indication <strong>of</strong> the quantum <strong>of</strong> savings available.<br />
In determining the benchmark application rates for the<br />
various turf quality levels ranging from elite sports fields to<br />
passive recreational areas, the critical factors used can be<br />
replicated for any geographic area for which local climatic<br />
data is available.<br />
As climatic conditions vary significantly from long term<br />
averages in any given year, the <strong>Code</strong> uses current climatic<br />
data provided by the Bureau <strong>of</strong> Meteorology to determine<br />
the irrigation requirement for the current period.<br />
Evaporation rates and rainfall can vary significantly from<br />
region to region. However the factor which remains<br />
constant is the need for an appropriately designed and<br />
managed irrigation system for which scheduling is<br />
constantly amended to account for changing climatic<br />
conditions and plant water requirements.<br />
Factors employed to determine the irrigation requirement:<br />
1. Plant water requirement or evapotranspiration (ETc)<br />
based on weather conditions.<br />
2. Functional objective and quality standard <strong>of</strong> the turf.<br />
3. Irrigation system application efficiency – distribution<br />
uniformity <strong>of</strong> 75% is assumed (in-field).<br />
Factors used to develop an irrigation schedule:<br />
1. Soil type and it’s water holding capacity.<br />
2. Plant root zone depth.<br />
3. Irrigation requirement.<br />
4. Irrigation system application rate.<br />
5. Site irrigation time constraints.<br />
Factors used to monitor irrigation efficiency<br />
1. Irrigation water applied for a given period.<br />
2. Irrigation water required for a given period.<br />
3. Fit for purpose standard <strong>of</strong> turf.<br />
Using the models developed in the <strong>Code</strong>, the irrigation<br />
manager can demonstrate performance in turf and<br />
irrigation management.<br />
EXECUTIVE SUMMARY<br />
2<br />
Where will the water savings come from?<br />
<strong>Water</strong> savings on large irrigated sites are rarely available<br />
during the peak irrigation season. Generally, there is a<br />
default level <strong>of</strong> efficiency at these sites due to the number <strong>of</strong><br />
irrigation stations and nights per week on which the system<br />
may be operated.<br />
<strong>Water</strong> savings will come largely from system scheduling<br />
during the shoulder periods either side <strong>of</strong> the peak season.<br />
Significant savings are also generally available at smaller<br />
sites where system constraints are not so much <strong>of</strong> an issue.<br />
Irrigation systems (particularly older systems) may have<br />
been poorly designed, resulting in significantly greater water<br />
use than would otherwise be required. The <strong>Code</strong> assumes a<br />
distribution uniformity <strong>of</strong> greater than 75% (in-field) which<br />
effectively means poorly functioning systems must be<br />
upgraded and or replaced, with irrigation auditing required<br />
to assess system performance.<br />
Ultimately the savings will be largely delivered by the<br />
ongoing monitoring and reporting <strong>of</strong> irrigation<br />
performance and adjustment <strong>of</strong> irrigation scheduling<br />
to match climatic conditions.
Key principles outlined in the<br />
<strong>Code</strong> <strong>of</strong> <strong>Practice</strong> - IPOS<br />
OBJECTIVE: To provide fit for purpose turf based on efficient<br />
irrigation management and sound horticultural practices.<br />
To deliver on this, subscribers to the <strong>Code</strong> will need to make<br />
a commitment to:<br />
MEASURE > MONITOR > MANAGE<br />
There are six steps to the process outlined within the <strong>Code</strong>:<br />
1. Implement a strategic approach to irrigation management<br />
underpinned by a policy statement and commitment by<br />
an organisation to appropriately resource and manage the<br />
irrigation <strong>of</strong> sites.<br />
2. Ensure systems are functioning to the appropriate<br />
performance standard with periodic system audits and<br />
ongoing regular maintenance.<br />
3. Ensure an appropriate horticultural maintenance<br />
program is in place to maintain soil structures and turf<br />
nutrient requirements.<br />
4. Determine the baseline irrigation requirement using<br />
long term average climatic data to set the monthly<br />
irrigation schedule.<br />
5. Amend the base irrigation schedule on a regular basis to<br />
account for climatic variance from the long term average<br />
in any given season. This will ensure turf is receiving the<br />
water requirement to maintain it at the appropriate<br />
quality level.<br />
6. Monitor irrigation consumption against irrigation<br />
requirement and report on irrigation efficiency and<br />
turf quality.<br />
3<br />
1.0 FOREWORD<br />
On average the River Murray provides about 40% <strong>of</strong><br />
Adelaide’s mains water. However in a drought year this<br />
can be as high as 90%. It also supports a large number <strong>of</strong><br />
country towns, rural communities and regional industries.<br />
The River Murray is <strong>of</strong> paramount importance to future<br />
water availability in South Australia. Combined with water<br />
sourced through catchments in the Mt L<strong>of</strong>ty Ranges it is the<br />
major source <strong>of</strong> fresh surface water in the State.<br />
South Australia’s water allocation from the River Murray is<br />
determined every year and takes the total available water in<br />
the river system into account. The historical annual average<br />
flow <strong>of</strong> water into South Australia is around 4000 GL per<br />
year. This average was not reached in the period between 2002<br />
and 2007 and the health <strong>of</strong> the river has suffered as a result.<br />
In 2003 the <strong>SA</strong> community faced the first water restrictions<br />
since the construction <strong>of</strong> the Mannum to Adelaide pipeline<br />
in 1954. The reduction in rainfall across the Adelaide Hills<br />
in 2002 was not particularly significant against long-term<br />
averages but combined with several years <strong>of</strong> low rainfall<br />
across the Murray-Darling Basin it helped to cement the<br />
realisation that South Australia needed to do more to<br />
manage its water supplies in a sustainable manner.<br />
The introduction <strong>of</strong> Permanent <strong>Water</strong> Conservation<br />
Measures in 2003 was the catalyst for the Local Government<br />
Turf and Irrigation Technical Group (LGTITG), comprised<br />
<strong>of</strong> a range <strong>of</strong> <strong>SA</strong> Councils, Irrigation Australia Limited<br />
(IAL), Murray Darling Association (MDA), Parks and<br />
Leisure Australia (PLA) and the Local Government<br />
Association (LGA) to consider actions that may assist to<br />
reduce water consumption.<br />
The LGTITG set out to formulate a solution that would<br />
satisfy the government’s water saving targets while<br />
providing flexibility for the management <strong>of</strong> community<br />
assets, rewarding those willing to commit to improving<br />
irrigation efficiency through the implementation <strong>of</strong> best<br />
practice irrigation.<br />
The <strong>Code</strong> provides a template which can be used by<br />
managers <strong>of</strong> IPOS to ensure the planning, management and<br />
reporting <strong>of</strong> water consumption in the urban environment is<br />
based on sound principles applied consistently at all levels<br />
<strong>of</strong> management.
2.0 INTRODUCTION<br />
2.1 Why develop a <strong>Code</strong>?<br />
The <strong>SA</strong> Government has committed to implement a series<br />
<strong>of</strong> initiatives to ensure that even in drought years the<br />
impacts <strong>of</strong> low water availability on the broad community<br />
<strong>of</strong> South Australia can be effectively managed. The<br />
development <strong>of</strong> <strong>Code</strong> <strong>of</strong> <strong>Practice</strong> for <strong>Irrigated</strong> <strong>Public</strong> <strong>Open</strong> <strong>Space</strong><br />
(IPOS) is a strategic initiative <strong>of</strong> the <strong>Water</strong>pro<strong>of</strong>ing<br />
Adelaide Strategy (WPA).<br />
The WPA Strategy No 33 states -<br />
“A <strong>Code</strong> <strong>of</strong> <strong>Practice</strong> that encourages irrigation efficiency for<br />
public purposes water use will be developed by the <strong>SA</strong><br />
Government in consultation with the Irrigation Association<br />
<strong>of</strong> Australia, Local Government Association <strong>of</strong> <strong>SA</strong>, Botanic<br />
Gardens and sporting associations”.<br />
<strong>Water</strong> for community purposes has been identified under<br />
the WPA Strategy as water used by government agencies,<br />
universities, schools, local government, public parks and<br />
gardens, sporting grounds, places <strong>of</strong> worship and hospitals.<br />
The majority <strong>of</strong> this water is used to maintain Adelaide’s<br />
amenity, particularly parklands, open spaces and gardens.<br />
During 2003 community purposes water use represented<br />
about 13% (25,000 ML) <strong>of</strong> total mains water use.<br />
Irrigating parks, gardens, ovals and sports fields uses<br />
approximately 15,000 ML per year. A significant amount<br />
<strong>of</strong> water is also taken from groundwater or surface water<br />
resources. Through more efficient irrigation practices there<br />
is the opportunity to reduce mains water use for public<br />
purposes by at least 20% (about 3,000 ML per year).<br />
The <strong>Code</strong> has been developed by a reference group<br />
established by <strong>SA</strong> <strong>Water</strong> as the Government’s lead agency.<br />
Members <strong>of</strong> the Reference Group included:<br />
• Local Government Association <strong>of</strong> <strong>SA</strong><br />
• Local Government Turf & Irrigation Technical Group<br />
• Murray Darling Association<br />
• Irrigation Australia Limited, <strong>SA</strong> Region<br />
• Australian Golf Course Superintendents Association,<br />
<strong>SA</strong> Region<br />
• Parks & Leisure Australia<br />
• Bureau <strong>of</strong> Meteorology<br />
• Turf Grass Australia, <strong>SA</strong> Region<br />
• Department <strong>of</strong> Education & Children’s Services<br />
• Botanic Gardens <strong>of</strong> Adelaide.<br />
4<br />
2.0 Introduction<br />
2.2 What is the aim <strong>of</strong> the <strong>Code</strong>?<br />
This <strong>Code</strong> explains how best to plan, manage and report<br />
water use for irrigated public open space, ensuring water use<br />
efficiency and ‘fit for purpose’ sports turf, recreational parks<br />
and reserves.<br />
Policy/Strategic<br />
Objectives<br />
<strong>Code</strong> <strong>of</strong> <strong>Practice</strong><br />
IPOS<br />
Turf & Irrigation<br />
Management<br />
Principles<br />
Efficient <strong>Water</strong><br />
Usage/ ‘Fit for<br />
Purpose’ Parks &<br />
Reserves<br />
Performance<br />
Monitoring &<br />
Reporting<br />
While the principals <strong>of</strong> the <strong>Code</strong> can be applied to all<br />
aspects <strong>of</strong> irrigated public open space, the <strong>Code</strong> specifically<br />
addresses irrigated turf rather than trees, landscape and<br />
ornamental gardens.<br />
The aim <strong>of</strong> the <strong>Code</strong> is to provide the tools and reporting<br />
models necessary to implement best practice irrigation<br />
management for irrigated public open space.
2.3 What are the benefits <strong>of</strong> using the <strong>Code</strong>?<br />
Irrigators <strong>of</strong> public open spaces who subscribe to the<br />
<strong>Code</strong> will realise significant benefits, not only to the<br />
subscriber, but to the community and the environment.<br />
Benefits include:<br />
• Significant water savings translating into reduced<br />
watering costs.<br />
• Increased flexibility for the irrigator in the case <strong>of</strong><br />
an escalation <strong>of</strong> water restrictions.<br />
• Recognition <strong>of</strong> the level <strong>of</strong> irrigation efficiency achieved.<br />
• Efficient irrigators are not penalised for efficiencies<br />
already demonstrated.<br />
• Community recognition <strong>of</strong> efficient watering practices.<br />
• ‘Fit for purpose’ recreational turf facilities.<br />
• Potential aversion <strong>of</strong> health and safety issues – particularly<br />
in the case <strong>of</strong> school ovals and sporting grounds.<br />
• Increased amenity levels associated with appropriately<br />
irrigated public open space.<br />
2.4 Who should use the <strong>Code</strong>?<br />
This <strong>Code</strong> should be used by everyone involved in the<br />
management and operation <strong>of</strong> irrigation systems for IPOS.<br />
The <strong>Code</strong> covers all areas from policy, planning, operation<br />
to performance monitoring and reporting. Those who<br />
should use the <strong>Code</strong> are:<br />
• Managers <strong>of</strong> irrigated public open space.<br />
• Irrigation consultants and designers.<br />
• Irrigation equipment suppliers.<br />
• Irrigation installation and maintenance contractors.<br />
• Irrigation technical <strong>of</strong>ficers.<br />
• Horticulture and irrigation operations staff.<br />
2.0 INTRODUCTION<br />
5<br />
2.5 What is the legal status <strong>of</strong> the <strong>Code</strong>?<br />
The <strong>Code</strong> provides advice on how to manage irrigation<br />
water use efficiently. It is a voluntary <strong>Code</strong> that is not linked<br />
to any regulation or legislation.<br />
The <strong>Code</strong> sets out principles that can be implemented to<br />
ensure best practice turf and irrigation management.<br />
Irrigation managers and consultants may already be<br />
operating at best practice and above. The methods described<br />
in the <strong>Code</strong> may be adapted or altered to suit individual<br />
organisations or as circumstances require.<br />
<strong>SA</strong> <strong>Water</strong> endorses the <strong>Code</strong> and its implementation may<br />
be linked to the assessment <strong>of</strong> applications for exemptions<br />
from modifications to water restrictions.<br />
2.6 What other advice is available?<br />
The <strong>Code</strong> has drawn on a wide range <strong>of</strong> technical<br />
documentation and sources in the public domain.<br />
A bibliography <strong>of</strong> reference material is included at the<br />
end <strong>of</strong> each section <strong>of</strong> the <strong>Code</strong>.<br />
2.7 Glossary <strong>of</strong> terms and abbreviations<br />
A glossary <strong>of</strong> terms and abbreviations is included as<br />
Appendix No 5 <strong>of</strong> the <strong>Code</strong>.
3.0 POLICY & PLANNING<br />
3.1 <strong>Water</strong> use policy<br />
In order to ensure that the issue <strong>of</strong> sustainable water<br />
management is a priority for the organisation, a clear policy<br />
statement is required. This statement should outline the<br />
commitment to sustainable water use in the management <strong>of</strong><br />
<strong>Irrigated</strong> <strong>Public</strong> <strong>Open</strong> <strong>Space</strong> (IPOS). The policy should be<br />
succinct and be able to guide future decisions in relation to<br />
the provision and management <strong>of</strong> IPOS.<br />
The policy should address the planning and development <strong>of</strong><br />
new sites and should be used to assess the appropriateness<br />
<strong>of</strong> current irrigated sites.<br />
s<br />
T<br />
EXAMPLE: ISSUES TO BE ADDRESSED IN THE WATER USE POLICY<br />
• <strong>Water</strong>supply<br />
Where possible sources other than potable mains water should<br />
be identified and investigated for use on IPOS.<br />
• Environmentalandwaterqualitymanagement<br />
Steps must be taken at the planning and design stage to ensure<br />
irrigation has minimal negative affects on the surrounding<br />
environment and natural drainage systems. <strong>Water</strong> sensitive urban<br />
design principals must be considered and implemented when<br />
planning the development <strong>of</strong> IPOS.<br />
• Bestpracticeirrigationmanagement<br />
All sites irrigated should adopt the principles <strong>of</strong> best practice in<br />
regard to design, installation, maintenance and scheduling.<br />
6<br />
The objectives <strong>of</strong> this policy are to:<br />
• Achieve a balance between the provision <strong>of</strong> an amenity<br />
landscape that is aesthetically pleasing, meets the needs<br />
<strong>of</strong> the community and is economically and<br />
environmentally sustainable.<br />
• Implement the principles <strong>of</strong> water sensitive urban design<br />
to achieve integration <strong>of</strong> water cycle management into<br />
urban planning and design.<br />
• Achieve a consistent approach in the provision and<br />
development <strong>of</strong> the irrigated landscape.<br />
• Provide a clear direction and framework for irrigation<br />
and water management strategies to enable water<br />
conservation and financial savings to be achieved.<br />
The policy must be endorsed by the organisation at the<br />
highest level.<br />
• Functionalbenefit<strong>of</strong>IPOS<br />
The provision <strong>of</strong> IPOS should be based on an assessment <strong>of</strong> the<br />
functional benefit <strong>of</strong> the site. Irrigation should only be provided<br />
where there is a clear functional benefit (eg sports ground, picnic<br />
area). The area being irrigated should be the minimum required to<br />
achieve the functional objective, complimented by dry–landscape<br />
treatments. Areas with low function but high aesthetic value<br />
(eg verges, entry statements) should be restricted to water<br />
supply sources other than mains potable water.<br />
• <strong>Water</strong>efficiencymanagementplanningandreporting<br />
All sites should be covered under a water efficiency management<br />
plan and reporting process that monitors irrigation efficiency and<br />
the quality and ‘fit for purpose’ standard <strong>of</strong> the turf.
3.2 <strong>Water</strong> use objectives<br />
<strong>Water</strong> use objectives are specific statements which provide a<br />
framework within which the policy will be achieved. From<br />
the objectives come actions and priorities which must be<br />
followed to successfully implement the policy.<br />
<strong>Water</strong> use objectives and strategic actions require funding and<br />
the allocation <strong>of</strong> resources. As such they must be achievable<br />
and endorsed by the organisation at the highest level.<br />
EXAMPLES OF WATER USE OBJECTIVES<br />
3.0 POLICY & PLANNING<br />
• “To develop a Turf and Irrigation Management Plan for the organisation.”<br />
• “To audit all irrigation systems to determine their operating efficiency.”<br />
• “To fund irrigation system upgrades where current performance is below best practice benchmarks.”<br />
7<br />
FURTHER INFORMATION:<br />
WATER MANAGEMENT POLICY & PLANNING<br />
Connellan, G. <strong>Water</strong> Management Plan Guidelines,<br />
Victorian Golf Association, Vic. November 2005.<br />
www.golfvic.org.au<br />
Connellan, G. <strong>Water</strong> Management Plan Template,<br />
Victorian Golf Association, Vic. November 2005.<br />
www.golfvic.org.au<br />
Melbourne <strong>Water</strong>. 2005. <strong>Water</strong> Sensitive Urban Design –<br />
Engineering Procedures (Stormwater). CSIRO Publishing.<br />
http://www.publish.csiro.au<br />
• “To ensure staff have the appropriate skills or access to these skills to ensure efficient turf and irrigation management <strong>of</strong> IPOS.”<br />
• “To investigate the viability <strong>of</strong> alternate water supply options and set targets for replacement <strong>of</strong> current mains water supply.”
4.0 WATER SUPPLY OPTIONS<br />
The sustainability <strong>of</strong> mains water supply for use in irrigation<br />
<strong>of</strong> public open space is questionable. Alternative water<br />
sources to mains supply should be investigated and identified.<br />
Where viable they should be developed for irrigation<br />
purposes. Alternative water supplies include bore water,<br />
effluent water and stormwater. Where alternative supply<br />
options prove viable, targets for the development <strong>of</strong> these<br />
supplies should be set.<br />
Information on the availability <strong>of</strong> alternative water sources<br />
can be gained from government departments responsible for<br />
the management <strong>of</strong> water resources.<br />
• Potable mains and recycled effluent<br />
-<strong>SA</strong><strong>Water</strong>Corporation<br />
www.sawater.com.au<br />
• Groundwater bores/stormwater<br />
- Department <strong>of</strong> <strong>Water</strong>, Land & Biodiversity Conservation<br />
www.dwlbc.sa.gov.au<br />
- Natural Resource Management Boards<br />
www.nrm.sa.gov.au<br />
-LocalGovernmentAuthorities<br />
www.lga.sa.gov.au<br />
8<br />
Where alternative water supply to mains water is being used,<br />
it is important to ensure water quality is acceptable and<br />
Department <strong>of</strong> Health requirements are met. A water quality<br />
analysis should be undertaken reporting on the following;<br />
• Salinity/EC<br />
• pH<br />
• Sodium<br />
• Chloride<br />
• Boron<br />
• Carbonate & Bicarbonat<br />
• Sodium Absorption Ratio (<strong>SA</strong>R)<br />
• Nutrients (N-P-K)<br />
• Thermo-tolerant Coliforms<br />
Whatever the water supply, a dedicated meter is required to<br />
enable water consumption to be monitored.<br />
FURTHER INFORMATION:<br />
WATER SUPPLY OPTIONS<br />
Neylan, J. (2005) Golf Course <strong>Water</strong> Quality,<br />
Victorian Golf Association, November 2005.<br />
www.golfvic.org.au<br />
Use <strong>of</strong> Surface and Groundwater Resources Versus<br />
Availability, Dept <strong>of</strong> Environment and Heritage,<br />
South Australia.<br />
www.environment.sa.gov.au<br />
Environment Protection Agency,<br />
South Australian Reclaimed <strong>Water</strong> Guidelines,<br />
Dept for Environment and Heritage, South Australia.<br />
April 1999.<br />
www.epa.sa.gov.au
CASE STUDY No 1<br />
CITY OF <strong>SA</strong>LISBURY<br />
– AQUIFER STORAGE AND RECOVERY<br />
Origins <strong>of</strong> Wetland and Aquifer Storage and Recovery<br />
(ASR).<br />
The City <strong>of</strong> Salisbury has thirty six major wetlands<br />
including six aquifer storage and recovery sites injecting<br />
1,895 ML into the underground aquifer annually. In<br />
addition, all new residential subdivisions in the past ten<br />
years have been required to install wetlands to contain<br />
stormwater on site as much as possible. Large industrial<br />
developments have been actively encouraged to develop<br />
wetlands for the same reason as well as to contain potential<br />
industrial spills on site. Collectively, these initiatives have<br />
effectively eliminated flood risk in an otherwise flood-prone<br />
area and have dramatically increased the wildlife habitat and<br />
biodiversity within the City. The development <strong>of</strong> the<br />
<strong>Water</strong>pro<strong>of</strong>ing Northern Adelaide Project will ensure water<br />
security for the northern Adelaide region into the future.<br />
Importantly, flows <strong>of</strong> polluted surface water into the<br />
fragile Barker Inlet estuary have been reduced. New<br />
opportunities have been created for the economic recycling<br />
<strong>of</strong> stormwater and reduced demand on water sourced<br />
from the River Murray.<br />
4.0 WATER SUPPLY OPTIONS<br />
9<br />
For further information refer to the full case study in<br />
Appendix No 4.
5.0 TURF & IRRIGATION MANAGEMENT PRINCIPLES<br />
5.1 Irrigation system design<br />
Irrigation systems must be designed to ensure the efficient,<br />
uniform application <strong>of</strong> water to the site. Design should be<br />
aimed at conserving and protecting water resources. Design<br />
should take into consideration agronomic, climatic and water<br />
supply issues to ensure that the system can operate effectively.<br />
Guidelines for the design <strong>of</strong> urban irrigation systems have<br />
been developed by Irrigation Australia Limited and can be<br />
accessed in the IAL publication, Urban Irrigation Best<br />
<strong>Practice</strong> Guidelines (2006).<br />
An irrigation design brief should be prepared to ensure the<br />
designer meets all appropriate requirements <strong>of</strong> the urban<br />
irrigation best management practice guidelines.<br />
Issues considered in the design should include:<br />
• Soil type and structure.<br />
• Infiltration rate.<br />
• Plant species.<br />
• Root zone depth.<br />
• Average and forecasted climatic data (ETo/rainfall).<br />
• <strong>Water</strong> quality, pressure and flow rate parameters.<br />
• Scheduling restrictions.<br />
• Use <strong>of</strong> technology to enhance water management such as,<br />
weather stations, moisture sensors, rain sensors,<br />
computerised irrigation management systems.<br />
ABOVE GROUND OR SUB-SURFACE IRRIGATION<br />
When planning and designing an irrigation system a critical decision<br />
is whether to use a traditional above ground pop-up irrigation<br />
system or alternatively a sub-surface in-line drip irrigation system.<br />
Sub-surface drip technology for turf has advanced significantly in<br />
recent years with systems performing to a high standard. The<br />
benefits <strong>of</strong> correctly designed, installed and maintained sub-surface<br />
drip include;<br />
• Highdistributionuniformityduetoelimination<strong>of</strong>theeffects<strong>of</strong><br />
wind, misting, poorly aligned sprinklers. As a general rule a high<br />
performing sub-surface drip system can achieve DU ratings <strong>of</strong><br />
between 80 – 90% while similar pop up systems will achieve<br />
between 70 – 80%.<br />
• Sub-surfacedripcanbescheduledatanytimeasitisnoteffected<br />
by evaporation and does not effect the turf surface.<br />
• <strong>Water</strong>isapplieddirectlytotherootzoneandcanbescheduled<br />
daily to replace evapotranspiration losses, keeping the available<br />
water at optimum levels.<br />
• Vandalismisreducedastherearenoabovegroundcomponents<br />
such as pop up sprinklers.<br />
• Installationcanberetr<strong>of</strong>ittedintoestablishedturf.<br />
10<br />
New systems should be designed to meet following<br />
standards:<br />
• A system application rate <strong>of</strong> between 11 – 15mm per hour.<br />
• Lower Quarter Distribution Uniformity (DU) measure <strong>of</strong><br />
>85% which must equate to a field DU >75%. DU is the<br />
unit <strong>of</strong> measure used to determine the performance <strong>of</strong> turf<br />
irrigation systems. DU is defined as “the average water<br />
applied in the 25% <strong>of</strong> the area receiving the least amount<br />
<strong>of</strong> water, regardless <strong>of</strong> location within the pattern, divided<br />
by the average water applied over the total area.”<br />
(refer IAL – Certified Irrigation Audit Manual, 2004.)<br />
Design documentation to include:<br />
• Irrigation plans.<br />
• Design parameters (flow, pressure, DU, precipitation rate).<br />
• Installation specification including component<br />
specification to meet appropriate Australian standards.<br />
• Quality control inspection procedures.<br />
• <strong>Water</strong> budget.<br />
• Irrigation schedule.<br />
Irrigation systems should be designed by qualified irrigation<br />
designers (refer section 8.0 – Training & Certification)<br />
However, not all situations are suitable for sub-surface drip.<br />
Some drawbacks include:<br />
• Highercapitalcostforsub-surfacesystems.<br />
• Somesoiltypes(egcoarsesands)donotallowsufficientlateral<br />
water movement through the soil pr<strong>of</strong>ile.<br />
• Wheresuitablesoiltypeisnot<strong>of</strong>aconsistentfriablestructure,<br />
vertical channelling <strong>of</strong> water can result causing the leaching <strong>of</strong><br />
fines and poor lateral movement <strong>of</strong> water.<br />
• Therecanbedifficultyinestablishingnewturf.<br />
• Intrusion<strong>of</strong>rootsintothedriplinescanbeaproblemifnot<br />
addressed in irrigation practices.<br />
• Turfrenovationpractices(egaerationanddecompaction)mustbe<br />
modified to ensure damage does not occur to the in-line drip lines<br />
set at approximately 200mm below the surface.<br />
• Eventmanagementmustconsidertheimpact<strong>of</strong>heavymachinery<br />
and the erection <strong>of</strong> marquis, or other variables in relation to<br />
sub-surface drip lines.<br />
Regardless <strong>of</strong> the choice to have above ground or sub-surface<br />
irrigation systems it is critical that design, installation and<br />
maintenance is <strong>of</strong> the highest standard.<br />
For advice on system selection consult a qualified irrigation designer<br />
or irrigation manager.
5.2 Irrigation system installation/supervision<br />
Correct installation <strong>of</strong> an irrigation system is critical to<br />
ensure optimum performance and the achievement <strong>of</strong> design<br />
objectives. Guidelines for the installation <strong>of</strong> urban irrigation<br />
systems have been developed by Irrigation Australia Limited<br />
and can be accessed in the IAL publication, Urban Irrigation<br />
Best <strong>Practice</strong> Guidelines (2006).<br />
Installation should be carried out by qualified irrigation<br />
installation contractors or personnel (refer section 8.0 –<br />
Training & Certification).<br />
Supervision should be carried out by a suitably qualified<br />
supervisor or project manager (refer section 8.0 – Training<br />
& Certification).<br />
Installation should be in accordance with the irrigation<br />
design and technical specification. All components and<br />
fittings must meet specified standards. Quality <strong>of</strong> installation<br />
should be checked with stop points signed <strong>of</strong>f at specified<br />
stages <strong>of</strong> the project.<br />
Installation inspection points to include:<br />
• Check all materials and fittings comply with specified<br />
Australian standards and codes <strong>of</strong> compliance.<br />
• Check trench alignment, depth and pipe coverage prior<br />
to backfill.<br />
• Check all valve and valve box installation.<br />
• Check all extra low voltage wiring (24 volt) meets<br />
specification.<br />
• Check sprinkler installation and placement.<br />
• Check the construction and installation <strong>of</strong> all thrust blocks.<br />
• Pressure test all mainlines according to the specification.<br />
At completion <strong>of</strong> installation, contractor to provide:<br />
• System compliance report detailing any deviations<br />
from the original design specification.<br />
• As constructed, irrigation system plan detailing any<br />
changes to original design layout.<br />
• All product operating manuals and warranties.<br />
5.0 TURF & IRRIGATION MANAGEMENT PRINCIPLES<br />
11<br />
Prior to final handover, the following checks should be<br />
carried out by the project supervisor or an independent<br />
third party:<br />
• Irrigation audit report in accordance with<br />
Certified Landscape Irrigation Audit standards.<br />
Critical factors include:<br />
• System compliance report detailing sprinkler, valve<br />
and component. Installation conforms to design and<br />
technical specification.<br />
• Operating pressures and flows.<br />
• Field operational DU >75%.<br />
• A water budget and irrigation schedule to meet<br />
average climatic conditions.<br />
Any faults identified to be rectified by the contractor prior<br />
to handover <strong>of</strong> the system.<br />
5.3 Irrigation system maintenance & performance<br />
In order for the irrigation system to continue to perform to<br />
design standards in relation to distribution uniformity,<br />
application rates and overall irrigation efficiency, it is critical<br />
that effective maintenance practices are put into place.<br />
Guidelines for the maintenance <strong>of</strong> urban irrigation systems<br />
have been developed by Irrigation Australia Limited and<br />
can be accessed in the IAL publication, Urban Irrigation<br />
Best <strong>Practice</strong> Guidelines (2006).<br />
Irrigation system maintenance must be undertaken by<br />
suitably qualified irrigation maintenance personnel<br />
(refer section 8.0 – Training & Certification).<br />
Maintenance should be programmed to ensure the system<br />
operates to design specification and should include:<br />
• Periodic checks <strong>of</strong> pressure and flows to ensure they are<br />
within acceptable ratings for system operation.<br />
• Periodic checks <strong>of</strong> system components (eg sprinklers,<br />
valves, controller, pumps, filters, sensors) to ensure they<br />
operate to manufacturer and design specifications.<br />
• Periodic lifting and adjustment <strong>of</strong> sprinkler heads to<br />
ensure they are set and aligned as specified.<br />
• Periodic clearance <strong>of</strong> vegetation around sprinkler heads.<br />
• Replacement <strong>of</strong> all worn parts with those matching<br />
system requirements in accordance with the original<br />
design specification.<br />
• Operation during the non irrigation season, periodically for<br />
a short duration, to flush system and operate components.
An irrigation audit in accordance with Certified<br />
Landscape Irrigation Audit standards should be<br />
undertaken every three to five years to ensure efficient<br />
system performance, distribution uniformity and irrigation<br />
application rates are as originally specified.<br />
The plant water requirement will be the same for similar<br />
sites in similar locations. However, the performance <strong>of</strong> the<br />
irrigation system may vary significantly. Actual system<br />
performance could be as low as DU 40 – 50%. This could<br />
result in the need to apply up to twice as much water as<br />
required to account for system inefficiencies and ensure<br />
driest sections <strong>of</strong> turf receive adequate irrigation.<br />
5.0 TURF & IRRIGATION MANAGEMENT PRINCIPLES<br />
EXAMPLE: IMPORTANCE OF IRRIGATION SYSTEM UNIFORMITY<br />
The actual system performance <strong>of</strong> many ageing systems could be as<br />
low as DU 40 – 60%. This could result in the need to apply<br />
significantly more water than required, to account for system<br />
inefficiencies and ensure the driest sections <strong>of</strong> turf are receiving<br />
adequate irrigation otherwise turf quality will be reduced.<br />
Example <strong>of</strong> Poor Distribution Uniformity<br />
The importance <strong>of</strong> high performing irrigation systems can be<br />
demonstrated by comparing the water budget or base irrigation<br />
requirement <strong>of</strong> two sports fields <strong>of</strong> identical size, in the same<br />
geographic region, with the same turf species but differing irrigation<br />
system application efficiencies.<br />
12<br />
In reality, due to low application rates and restricted timing<br />
<strong>of</strong> irrigation events, it is <strong>of</strong>ten not possible to compensate for<br />
poor system efficiency by applying additional water. This<br />
results in poor turf condition and may jeopardise the ‘fit for<br />
use’ quality standards <strong>of</strong> the sports turf.<br />
No allowance has been made for poor system application<br />
efficiency in the benchmarks developed in the <strong>Code</strong>, as it is<br />
considered fundamental that systems should be designed,<br />
installed and maintained to high standards. Where systems<br />
have a DU < 75%, upgrade or replacement is advised.<br />
The following example is <strong>of</strong> a local level soccer ground (TQVS Cat. 3)<br />
<strong>of</strong> 1 ha with Kikuyu turf in the Adelaide metropolitan area.<br />
Irrigation System Application Efficiency Comparison<br />
Description Soccer Soccer Variance<br />
Field No 1 Field No 2 No2–No1<br />
Net Irrigation req. (In) kL 2,890 2,890 -<br />
Irrigation System Application<br />
Efficiency (Ea) 80% 55% - 25%<br />
<strong>Water</strong> Budget – Base Irrigation<br />
Requirement (BIr) kL 3,620 5,210 1,590<br />
<strong>Water</strong> Cost @ $ 1.16 kL $ 4,200 $ 6,040 $ 1,840<br />
BIr for medium council with<br />
75 ha <strong>of</strong> irrigated reserves kL 271,500 390,750 119,250<br />
<strong>Water</strong> Cost @ $ 1.16 kL $ 314,940 $ 453,270 $ 138,330<br />
Soccer field No 2 requires 45% more water to achieve the same<br />
standard <strong>of</strong> turf as Soccer field No 1. When the additional water<br />
requirement and cost is extrapolated over the many local<br />
government and educational sector sports grounds and irrigated<br />
reserves the amount <strong>of</strong> wastage and additional cost is significant.
CASE STUDY No 2<br />
IRRIGATION AUDITING<br />
– DEPARTMENT OF EDUCATION AND<br />
CHILDREN’S SERVICES<br />
The South Australian Department <strong>of</strong> Education and<br />
Children’s Services (DECS) has directed significant<br />
resources in recent years toward improvements in irrigation<br />
infrastructure and management. DECS irrigation audits are<br />
carried out by landscape irrigation auditors certified by the<br />
Irrigation Australia Limited and are be done according to<br />
the IAL Certified Landscape Irrigation Audit Methodology.<br />
Information provided in the audits is sufficiently detailed to:<br />
• Permit efficiency rating <strong>of</strong> the irrigation system.<br />
• Quantify potential mains water savings.<br />
• Calculate water budgets for each school.<br />
Auditors can develop water budgets around this target figure<br />
and provide recommendations to reduce water use without<br />
compromising turf quality. Estimated water savings should<br />
be quantified for each recommendation to enable actions to<br />
be prioritised.<br />
Approximately 20% <strong>of</strong> mains water used for parks, gardens,<br />
ovals and sports fields in South Australia is used in schools.<br />
As a significant water user DECS seeks to continually<br />
improve its water management practices.<br />
5.0 TURF & IRRIGATION MANAGEMENT PRINCIPLES<br />
13<br />
For further information refer to the full case study in<br />
Appendix No 4.<br />
FURTHER INFORMATION:<br />
IRRIGATION SYSTEM DESIGN, INSTALLATION<br />
& MAINTENANCE<br />
Cape, J. Urban Irrigation, Best Management <strong>Practice</strong><br />
Guidelines, Irrigation Australia Limited, NSW, 2006.<br />
www.irrigation.org.au<br />
Cape, J. 2004. Certified Landscape Irrigation Auditor<br />
Resource Manual. Irrigation Australia Limited, NSW.<br />
www.irrigation.org.au<br />
Standard Irrigation Contract, Irrigation Australia Limited,<br />
NSW, 2007.<br />
www.irrigation.org.au<br />
Information on Certified Irrigation Designer,<br />
Certified Irrigation Installer and Certified Irrigation Auditor<br />
accreditation can be found at www.irrigation.org.au<br />
Connellan, G. Evaluating Irrigation Performance –<br />
Uniformity Auditing, Victorian Golf Association, Vic,<br />
December 2005.<br />
www.golfvic.org.au
5.4 Plant/turf species selection<br />
Warm season turf grasses (Kikuyu or Couch) use 30 – 50%<br />
less water than cool season turf grasses, (Fescues or Ryes).<br />
The drought tolerance <strong>of</strong> warm season grasses is significantly<br />
higher than the cool season grasses. Turf species should be<br />
selected to meet the functional objective while minimising<br />
water use.<br />
Warm season turf grasses (Kikuyu or Couch) should be<br />
used as the predominant turf grassspeciesforirrigated<br />
public open space in South Australian conditions.<br />
Where turf is subject to intensive winter activity such as<br />
football, over sowing in autumn with a cool season turf<br />
species such as a transitional rye grass will improve<br />
wearability and recovery <strong>of</strong> the turf during the cooler months<br />
without requiring additional water over the summer period.<br />
5.5 Turf quality/‘fit for purpose’<br />
Turf should be maintained to meet quality and risk<br />
management standards appropriate for its intended use.<br />
Sporting club associations and ground managers have a<br />
duty <strong>of</strong> care to all people using facilities. This means that<br />
sports facilities, including turf surface, must not present an<br />
unacceptable risk <strong>of</strong> injury to those using the facilities.<br />
Passive irrigated areas require a lower standard and have<br />
lower risk ratings than active sports grounds. The standard<br />
to which turf is maintained has significant impact on water<br />
usage. Turf must be maintained at a level that ensures safety<br />
for users and meets the functional objective. A passive<br />
irrigated area can be maintained using up to 50% less water<br />
than an active sportsground.<br />
5.0 TURF & IRRIGATION MANAGEMENT PRINCIPLES<br />
14<br />
<strong>Irrigated</strong> turf areas should be classified according to the<br />
intended function and the ‘fit for purpose’ standard. Turf<br />
can be rated according to the Turf Quality Visual Standard<br />
(TQVS) classifications as detailed in Table No 1.<br />
Turf quality and risk management standards should be<br />
developed and include the following criteria:<br />
• Turf Quality Visual Standards (TQVS) indicating<br />
‘fit for use’ turf standards.<br />
• Turf grass vigour and density.<br />
• Evenness <strong>of</strong> turf surface.<br />
• Cutting height <strong>of</strong> turf.<br />
• Presence <strong>of</strong> weed species or pest infestation.<br />
• Presence <strong>of</strong> divots, pot holes.<br />
• Presence <strong>of</strong> sunken or raised sprinkler heads.<br />
• Traction and shear strength <strong>of</strong> the turf.<br />
• Ground hardness and impact severity.<br />
• Associated infrastructure: goal posts, coaches’ boxes and<br />
fences should also be assessed for safety.<br />
The quality and risk standards should be detailed in a<br />
quality and risk audit checklist which is used by the<br />
organisation and the users to ensure risks have been<br />
identified and appropriate controls have been put in place.<br />
A risk assessment <strong>of</strong> the turf surface should be undertaken<br />
weekly for active sports with a quality audit undertaken<br />
monthly to monitor wear trends and turf quality.
Table No 1 – Turf Quality Visual Standard<br />
(Rhizomatous sp. (Kikuyu/Couch))<br />
Classification No 1<br />
Elite Sports Turf<br />
– State/National Competition<br />
AAMI Stadium/Adelaide Oval<br />
Classification No 2<br />
Premier Sports Turf<br />
– State/Regional Competition<br />
A Grade Cricket/Football/Athletics<br />
Classification No 3<br />
Local Sports Turf<br />
– Local Competition<br />
Local Sports Grounds/Community Parks<br />
Classification No 4<br />
Passive Recreation Reserve<br />
– Non Sports Turf<br />
Neighbourhood Parks/Passive Reserves<br />
FURTHER INFORMATION:<br />
TURF QUALITY/‘FIT FOR PURPOSE’<br />
Aldous, D.E., and I.H. Chivers (2005).<br />
Player Perceptions <strong>of</strong> Australian Football League Sports<br />
Grass Surfaces. Report for the Australian Football League<br />
Players’ Association. The University <strong>of</strong> Melbourne and<br />
Racing Solutions Pty. Ltd., 55pp.<br />
http://www.landfood.unimelb.edu.au/staff/aldous.html<br />
Henderson, C. Best management practices for sustainable<br />
and safe playing surface <strong>of</strong> Australian Football League sports<br />
fields, Dept <strong>of</strong> Primary Industries and Fisheries, Qld. 2006.<br />
http://www2.dpi.qld.gov.au/horticulture/16834.html<br />
Chivers, I. Otago, L. Swan, P. Finch, C. Payne, W. Orchard,<br />
J. ‘Ground Conditions and Injury Risk – Implications for<br />
Sports Grounds Assessment <strong>Practice</strong>s in Victoria.’<br />
University <strong>of</strong> Ballarat. March 2007.<br />
AS/NZS 4360: 2004. Risk Management – Australian/<br />
New Zealand Standard – Risk Management.<br />
AS/ANZ 4360: HB 246: 2004 – Guidelines for Managing<br />
Risk in Sport and Recreation.<br />
http://www.riskmanagement.com.au/<br />
5.0 TURF & IRRIGATION MANAGEMENT PRINCIPLES<br />
15<br />
5.6 Turf & horticultural practices<br />
Critical to the maintenance <strong>of</strong> quality, ‘fit for purpose’<br />
irrigated public open space is sound turf and horticultural<br />
maintenance practices. An annual turf and landscape<br />
maintenance program should be developed for each<br />
individual location. The aim <strong>of</strong> the program is:<br />
• To improve soil texture and structure.<br />
• Ensure appropriate nutrient levels.<br />
• Identify and treat turf pests and diseases.<br />
• Promote deep root growth.<br />
• Ensure the turf surface is safe and ‘fit for purpose’.<br />
Mowing heights, fertilizer application, compaction relief<br />
and rolling top dressing all have an impact on the quality<br />
and water requirement <strong>of</strong> the turf grass. Turf maintenance<br />
operations are required to improve soil structure through<br />
aeration, decompaction and promotion <strong>of</strong> deep root<br />
growth, ensuring water is utilised to its full potential and<br />
turf quality meets its functional objective.<br />
FURTHER INFORMATION:<br />
TURF & HORTICULTURAL PRACTICES<br />
Handreck, K. A. and Black, N. D. (2001) Growing Media<br />
for Ornamental Plants and Turf, 3rd Edition, NSW,<br />
University Press, Kensington, Australia 2001.
CASE STUDY No 3<br />
CITY OF TEA TREE GULLY<br />
– IRRIGATION MANAGEMENT STRATEGIES<br />
An Irrigation Management Strategy (IMS) was developed<br />
by the City <strong>of</strong> Tea Tree Gully in 2003 when permanent<br />
water conservation measures were introduced. The objective<br />
<strong>of</strong> the IMS was to reduce water consumption by a<br />
minimum <strong>of</strong> 20% while ensuring efficient irrigation<br />
practices and ‘fit for purpose’ sport and recreational turf.<br />
The results over the three year period from 2003 - 2006 have<br />
seen a reduction <strong>of</strong> 31% or 290,000 kL per annum from<br />
950,000 kL to 660,000 kL in overall water consumption<br />
while maintaining the same area <strong>of</strong> irrigated turf to<br />
satisfactory ‘fit for use’ standards. Further reductions were<br />
achieved in the 2006/07 irrigation season as a result <strong>of</strong> level<br />
3 water restrictions.<br />
Average <strong>Water</strong> Consumption per annum<br />
Average Annual Consumption<br />
Period <strong>Irrigated</strong> area Consumption per Hectare<br />
(ha) kL/ annum kL/ha<br />
1998 - 2003 171 950,000 5,556<br />
2003 - 2006 171 660,000 3,860<br />
Variance kL 290,000 1,696<br />
Variance % 31% 31%<br />
2006 / 2007 460,000<br />
5.0 TURF & IRRIGATION MANAGEMENT PRINCIPLES<br />
16<br />
Average Annual <strong>Water</strong> Consumption<br />
Kilolitres<br />
1,000,000<br />
900,000<br />
800,000<br />
700,000<br />
600,000<br />
500,000<br />
400,000<br />
300,000<br />
200,000<br />
100,000<br />
0<br />
1998-2002 2003-2006<br />
Period<br />
2006-2007<br />
For further information refer to the full case study in<br />
Appendix No 4.
5.7 <strong>Water</strong> budget<br />
A water budget should be developed to set irrigation water<br />
consumption targets. A water budget calculates the<br />
Irrigation Requirement (Ir) <strong>of</strong> the site for a given period<br />
based on climatic, agronomic, turf quality and system<br />
performance factors. The outcome is monthly water<br />
consumption targets, based on long term average climatic<br />
conditions, in mm depth <strong>of</strong> water which can be converted<br />
to kilolitres per hectare. From the water budget a financial<br />
budget for water cost can also be developed to enable the<br />
management <strong>of</strong> both water and financial resources.<br />
Due to daily and seasonal variations in weather factors the<br />
plant water requirement is continually changing. It is critical<br />
to monitor and revise irrigation targets according to<br />
prevailing weather conditions. The drought conditions <strong>of</strong><br />
2006/07 are an example <strong>of</strong> significant variation from<br />
average climatic conditions for that period, with an irrigation<br />
requirement <strong>of</strong> approximately 30% greater than the average.<br />
Templates have been developed to assist in the development<br />
<strong>of</strong> water budgets and are attached as Appendix No 1 –<br />
IPOS - Irrigation Requirement Model.<br />
The irrigation requirement has been developed for both<br />
the Base Irrigation Requirement (BIr) using long term<br />
average climatic data and the irrigation requirement for<br />
season 2006/07 (Ir(06/07)) using current climate data. The<br />
methodology on which the model is based is outlined below.<br />
5.7.1 Irrigation Requirement (Ir)<br />
In order to determine how much water to apply to the turf<br />
and monitor water usage, the amount <strong>of</strong> water that needs to<br />
be applied by the irrigation system to sustain turf to the<br />
accepted standard must be determined. This is called the<br />
Irrigation Requirement (Ir).<br />
The methodology for calculating Ir is detailed in the FAO<br />
Technical Paper No 56 – Crop Evapotranspiration.<br />
Guidelines for computing crop water requirements 1988.<br />
The simplified calculation for the Irrigation Requirement<br />
(Ir) is:<br />
Ir = In/Ea<br />
Where:<br />
Ir - Irrigation Requirement (mm)<br />
In - Net Irrigation Requirement (mm)<br />
Ea - Irrigation System Application Efficiency<br />
5.0 TURF & IRRIGATION MANAGEMENT PRINCIPLES<br />
17<br />
Net Irrigation Requirement (In) is the water requirement<br />
<strong>of</strong> the plant or Crop Evapotranspiration (ETc) less any<br />
Effective Rainfall (Pe) for the period.<br />
In = ETc - Pe<br />
Where:<br />
In - Net Irrigation Requirement (mm)<br />
ETc - Crop Evapotranspiration (mm)<br />
Pe - Effective Rainfall (mm)<br />
Crop Evapotranspiration (ETc) is a combination <strong>of</strong> the<br />
water used by a specific species <strong>of</strong> plant for healthy growth,<br />
which is called transpiration, and the water evaporated from<br />
the soil surface.<br />
The ETc is directly related to climatic conditions and the<br />
relevant plant species.<br />
ETc = ETo x Kc x Ks<br />
Where:<br />
ETc - Crop Evapotranspiration (mm)<br />
ETo - Reference Evapotranspiration<br />
Kc - Crop Co-efficient (decimal factor)<br />
Ks - Crop Stress Factor (decimal factor)<br />
Reference Evapotranspiration (ETo) is calculated using<br />
climate data which directly effects evapotranspiration. The<br />
climatic data is sourced from weather stations and includes;<br />
• Air temperature.<br />
• Relative humidity.<br />
• Solar radiation.<br />
• Wind speed.<br />
Figure No 1 – Factors Influencing Plant <strong>Water</strong> Use<br />
Relative<br />
Humidity<br />
Air Movement<br />
Wind<br />
Evapotranspiration<br />
ET<br />
Temperature<br />
LEAF<br />
Solar<br />
Radiation<br />
Graphic courtesy <strong>of</strong> Ge<strong>of</strong>f Connellan, University <strong>of</strong> Melbourne<br />
Air<br />
Temperature
Using the above climate data the evapotranspiration from a<br />
reference crop (tall cool season grass (lucerne) grown to a<br />
height <strong>of</strong> 12cm which covers the ground and is supplied<br />
with adequate water), can be calculated. The result is<br />
reference evapotranspiration (ETo). ETo is calculated by the<br />
Bureau <strong>of</strong> Meteorology (BoM) and is published on their<br />
website or can be accessed from private weather stations in<br />
regional areas where the BoM does not have stations.<br />
As the water requirement varies for different turf species<br />
under different growth conditions the ETo must be<br />
converted to evapotranspiration for a specific crop (ETc).<br />
A crop co-efficient (Kc) is required to covert ETo to ETc.<br />
Crop co-efficients (Kc) for turf grassareasfollows.<br />
Table No 2 - Turf Grass Crop Co-efficients (Kc)<br />
TurfType Warm Season Cool Season<br />
Turf Grass Turf Grass<br />
Couch sp. / Kikuyu Rye sp./Bluegrass/<br />
Fescue<br />
Crop Co-efficient( Kc ) 0.6 - 0.8 0.8 - 0.95<br />
Note: Kc = 0.7 has been used in calculations in the <strong>Code</strong>.<br />
Crop Stress Factor (Ks) is applied where a management<br />
decision has been made to reduce the vigour and quality <strong>of</strong><br />
the turf grass.Asdetailedpreviously,irrigatedpublicopen<br />
space can be classified into four TQVS standards depending<br />
on the function and required standard <strong>of</strong> the turf surface.<br />
The Ks effectively reduces the irrigation requirement to<br />
achieve the appropriate functional outcome <strong>of</strong> the turf.<br />
Crop stress factors for IPOS are as follows;<br />
Table No 3 – Turf Grass Crop Stress Factors (Ks)<br />
TQVS Cat. TQVS 1 TQVS2 TQVS3 TQVS4<br />
Description Passive<br />
Elite Premier Local Recreational<br />
Sports Turf Sports Turf Sports Turf Turf<br />
Crop stress<br />
factor (Ks) 1.0 0.6 0.5 0.4<br />
The calculation for ETc is;<br />
ETc = ETo x Kc x Ks<br />
ETc = ETo x 0.7 x 0.5 (TQVS 3)<br />
5.0 TURF & IRRIGATION MANAGEMENT PRINCIPLES<br />
18<br />
Effective Rainfall (Pe)<br />
Rainfall or precipitation (P) replaces water lost from the soil<br />
by evapotranspiration and thereby reduces the Net<br />
Irrigation Requirement (In). Rainfall (P), during the<br />
irrigation season can be variable and is not always effective.<br />
Small rain events are lost by evaporation and do not soak<br />
into the soil, whereas large events may deliver more water<br />
than the soil can hold and can be lost either through<br />
drainage or run <strong>of</strong>f.<br />
A general rule for a shallow rooted turf grass crop is that<br />
only half the rainfall that occurs in the irrigation season is<br />
effective and actually replenishes soil to the root zone <strong>of</strong> the<br />
plant. The Effective Rainfall Factor (Pf) used in the <strong>Code</strong> is<br />
0.5 or 50%. When this is multiplied by the total rainfall,<br />
Effective Rainfall (Pe) is calculated.<br />
Rainfall data can be accessed from the BoM website or<br />
from local rain gauges.<br />
The calculation for effective rainfall is;<br />
Pe = P x Pf<br />
Where:<br />
Pe - Effective rainfall (mm)<br />
P - Total rainfall (mm)<br />
Pf - Effective rainfall Factor (decimal factor)<br />
Application Efficiency (Ea)<br />
Irrigation systems do not apply water at 100% efficiency.<br />
The optimum performing irrigation system is subject to<br />
inherent system inefficiencies. Factors such as wind,<br />
misting, poor sprinkler spacing, nozzle loss and other<br />
system performance faults impact on the uniformity <strong>of</strong><br />
water application. Therefore a factor must be applied to<br />
account for irrigation system performance.
Figure No 2 – Factors Influencing Irrigation System<br />
Application Efficiency<br />
Root<br />
zone<br />
Graphic courtesy <strong>of</strong> Ge<strong>of</strong>f Connellan, University <strong>of</strong> Melbourne<br />
A field irrigation audit conducted by a qualified irrigation<br />
auditor is required to determine the performance <strong>of</strong> the<br />
irrigation system. The distribution uniformity (DU) is one<br />
measure <strong>of</strong> irrigation system application efficiency.<br />
However this can vary with conditions such as high wind or<br />
system pressure fluctuations. A high performing pop up<br />
sprinkler system will achieve a field DU <strong>of</strong> between 75%<br />
and 85%. In practice many systems fall short <strong>of</strong> this figure<br />
and will achieve between 55% and 65% DU.<br />
An application efficiency factor <strong>of</strong> 80% or 0.8 has been used<br />
in the <strong>Code</strong> as this represents a high performing system.<br />
Ea = 0.8<br />
Evaporation<br />
Unevendepth<br />
Deepdrainage<br />
Where:<br />
Ea - Irrigation system application efficiency (decimal factor)<br />
No allowance has been made for poor DU in the<br />
benchmarks developed in the <strong>Code</strong>, as it is considered<br />
fundamental that systems should be designed, installed and<br />
maintained to high standards. Where systems have a<br />
DU < 75%, upgrade or replacement is advised.<br />
5.0 TURF & IRRIGATION MANAGEMENT PRINCIPLES<br />
Wind<br />
drift<br />
Run<strong>of</strong>f<br />
19<br />
Converting Irrigation Depth (mm per m 2 ) to Volume<br />
(kL per ha)<br />
Irrigation requirement (Ir) refers to the depth <strong>of</strong> water<br />
which needs to be applied by the irrigation system to<br />
replace soil water used by the plant. Each millimetre (mm)<br />
<strong>of</strong> water applied refers to 1 mm depth <strong>of</strong> water over the<br />
entire irrigated area. 1 mm depth <strong>of</strong> water over an area <strong>of</strong><br />
one square metre equals one litre <strong>of</strong> water. Subsequently<br />
and irrigation depth <strong>of</strong> 1 mm per hectare (10.000 m 2 ) is<br />
equal to 10,000 litres or 10 kilolitres <strong>of</strong> water. To convert<br />
mm depth <strong>of</strong> water applied to kilolitres per hectare a<br />
multiplier factor <strong>of</strong> 10 is used. The calculation is:<br />
kL per ha = mm x 10<br />
Where:<br />
kL - kilolitres (1,000 litres)<br />
ha - hectares (10,000 square metres)<br />
mm - millimetre depth <strong>of</strong> water<br />
10 - conversion factor mm to kL per ha<br />
<strong>Water</strong> Cost<br />
The cost <strong>of</strong> mains water is set by the Government <strong>of</strong> South<br />
Australia and is adjusted annually. The cost <strong>of</strong> mains water<br />
2007/08 financial year is $1.16 per kilolitre. The cost <strong>of</strong><br />
water for irrigation is calculated by multiplying kilolitres<br />
used by the water cost.<br />
Total water cost = kL used x water cost per kL<br />
= kL x 1.16 (2007/08)<br />
Given the above information, the irrigation requirement can<br />
be calculated, as in the following example.
IRRIGATION REQUIREMENT (Ir) EXAMPLE:<br />
Site - Local soccer ground<br />
Area - 1.2 hectare<br />
Location - Adelaide metropolitan area<br />
Turf species: quality standard - Kikuyu: TQVS Cat 3<br />
Irrigation season - October – April inclusive<br />
Climate period - Long term average<br />
5.0 TURF & IRRIGATION MANAGEMENT PRINCIPLES<br />
Irrigation Requirement (Ir) = Net Irrigation Requirement (In) / Application Efficiency (Ea)<br />
Ir = In / Ea<br />
Net Irrigation Requirement (In) = Crop Evapotranspiration (ETc) – Effective rainfall (Pe)<br />
In = ETc - Pe<br />
Crop Evapotranspiration (ETc) = Reference Evapotranspiration (ETo) x Crop Co-efficient (Kc) x Crop Stress Factor (Ks)<br />
ETc =EToxKcxKs<br />
= 1088 x 0.7 x 0.5<br />
= 381 mm<br />
Effective rainfall (Pe) = Total rainfall (P) x Effective rainfall Factor (Pf)<br />
Pe = P x Pf<br />
= 183 x 0.5<br />
= 92 mm<br />
Net Irrigation Requirement<br />
In = ETc – Pe<br />
= 381 - 92<br />
= 289 mm<br />
Application Efficiency<br />
Ea = 0.80<br />
Irrigation Requirement (mm)<br />
Ir = In / Ea<br />
= 289 / 0.80<br />
= 362 mm<br />
Irrigation Requirement (kL per ha)<br />
Ir(kL/ha) = Ir(mm) x 10<br />
= 362 x 10<br />
= 3620 kL / ha<br />
Irrigation Requirement (Site)<br />
Ir(site) = Ir(kL per ha) x site area<br />
= 3620 x 1.2<br />
= 4,344 kL<br />
<strong>Water</strong> Cost<br />
= Ir(site) x <strong>Water</strong> cost ($ per kL)<br />
= 4,344 x 1.16<br />
= $ 5,039<br />
20
5.7.2 Base Irrigation Requirement (BIr)<br />
The Base Irrigation Requirement (BIr) forms the water<br />
budget and is calculated using long term average reference<br />
evapotranspiration (ETo) and rainfall (P) data available<br />
from the Bureau <strong>of</strong> Meteorology (BoM). The source for the<br />
required data is; www.bom.gov.au/climate/averages.<br />
Appendix No 1 – IPOS - Irrigation Requirement Model provides<br />
a model for the calculation <strong>of</strong> the Base Irrigation<br />
Requirement (BIr).<br />
Table No 4 details BIr for each <strong>of</strong> the turf classifications.<br />
Table No 4 – Base Irrigation Requirement (BIr)<br />
– Couch/Kikuyu – Adelaide Metro<br />
5.0 TURF & IRRIGATION MANAGEMENT PRINCIPLES<br />
21<br />
In regional areas site specific climatic data can be sourced<br />
from the Bureau <strong>of</strong> Meteorology website, other factors<br />
remain the same (refer Appendix No 1).<br />
The water budget or BIr data provides benchmarks for<br />
irrigation requirement using long term average climatic data.<br />
The climate, evaporation and rainfall can be variable over<br />
given periods. The BIr can be used as a forecast <strong>of</strong> the<br />
irrigation requirement. However, it must be monitored<br />
against actual climatic conditions and irrigation requirement<br />
for the current period when scheduling irrigation events and<br />
monitoring irrigation efficiency. The drought conditions <strong>of</strong><br />
2006/07 are an example <strong>of</strong> significant variation in average<br />
climatic conditions for that period with an irrigation<br />
requirement <strong>of</strong> approximately 30% greater than the average.<br />
TQVS Cat. TQVS 1 TQVS2 TQVS3 TQVS4<br />
Description Elite Sports Turf Premier Sports Turf Local Sports Turf Passive Recreational Turf<br />
Month Base Irrigation Requirement Base Irrigation Requirement Base Irrigation Requirement Base Irrigation Requirement<br />
(mm/month) (BIr) (mm/month)(BIr) (mm/month) (BIr) (mm/month) (BIr)<br />
Oct 86 42 31 19<br />
Nov 121 66 52 39<br />
Dec 148 83 66 50<br />
Jan 165 94 77 59<br />
Feb 138 78 63 48<br />
Mar 116 64 51 38<br />
Apr 65 30 21 13<br />
Total (mm) 838 457 362 266<br />
Total (kL/ha) 8,380 4,570 3,620 2,660<br />
Total Cost @ $1.16 per kL $ 9,721 $ 5,301 $ 4,199 $ 3,086
5.7.3 Irrigation Requirement 2006/07 (Ir(06/07))<br />
The Irrigation Requirement (Ir) for the current period is<br />
calculated in the same way as the BIr, except current ETo<br />
and rainfall data is used. Current data can be accessed from<br />
the BoM on the following website:<br />
www.bom.gov.au/anon2/home/sa/DATA/evapotrans/<br />
Appendix No 1 – IPOS - Irrigation Requirement Model provides<br />
a model for the calculation <strong>of</strong> the Irrigation Requirement (Ir)<br />
Table No 5 details Ir (06/07) for each <strong>of</strong> the turf classifications.<br />
In regional areas, site specific climatic data can be sourced<br />
from the Bureau <strong>of</strong> Meteorology website or private weather<br />
stations in regional areas and other factors remain the same.<br />
The methodology and factors used for calculating the<br />
Irrigation Requirement for landscapes other than turf can be<br />
found in the Certified Landscape Irrigation Auditor Resource<br />
Manual 2004 available from the Irrigation Australia Limited.<br />
Table No 5 – Irrigation Requirement (Ir) 2006/07<br />
– Couch/Kikuyu – Adelaide Metro<br />
5.0 TURF & IRRIGATION MANAGEMENT PRINCIPLES<br />
22<br />
FURTHER INFORMATION:<br />
DETERMINING IRRIGATION REQUIREMENT (Ir)<br />
Connellan, G. 2005. Determining Target <strong>Water</strong> Budget,<br />
Victorian Golf Association, Vic.<br />
www.golfvic.org.au<br />
Cape, J. 2004. Certified Landscape Irrigation Auditor<br />
Resource Manual. Irrigation Australia Limited, NSW.<br />
www.irrigation.org.au<br />
University <strong>of</strong> California Cooperative Extension.<br />
California Department <strong>of</strong> <strong>Water</strong> Resources 2000.<br />
A Guide To Estimating Irrigation <strong>Water</strong> Needs <strong>of</strong><br />
Landscape Plantings in California.<br />
http://www.owue.water.ca.gov/docs/wucols00.pdf<br />
FAO Technical Paper No 56 – Crop Evapotranspiration.<br />
Guidelines for computing crop water requirements 1988.<br />
http://www.fao.org/docrep/X0490E/X0490E00.htm<br />
TQVS Cat. TQVS 1 TQVS2 TQVS3 TQVS4<br />
Description Elite Sports Turf Premier Sports Turf Local Sports Turf Passive Recreational Turf<br />
Month Base Irrigation Requirement Base Irrigation Requirement Base Irrigation Requirement Base Irrigation Requirement<br />
(mm/month) (BIr) (mm/month)(BIr) (mm/month) (BIr) (mm/month) (BIr)<br />
Oct-06 147 88 73 58<br />
Nov-06 149 85 68 52<br />
Dec-06 191 110 89 69<br />
Jan-07 164 89 70 51<br />
Feb-07 181 108 90 72<br />
Mar-07 145 82 66 51<br />
Apr-07 63 19 8 -3<br />
Total (mm) 1,038 580 465 350<br />
Total (kL/ha) 10,380 5,800 4,650 3,500<br />
Total Cost @ $1.16 per kL $ 12,041 $ 6,728 $ 5,394 $ 4,060
5.8 Irrigation scheduling<br />
Irrigation scheduling is a critical component <strong>of</strong> efficient<br />
irrigation management. Irrigation controllers are <strong>of</strong>ten<br />
programmed at the start <strong>of</strong> the season based on either the BIr<br />
or operator experience and <strong>of</strong>ten not adjusted to respond to<br />
changing weather conditions and plant water requirements.<br />
Figure No 3 – Factors Influencing Irrigation Scheduling<br />
Correct<br />
Depth<br />
Correct<br />
Timing<br />
GOODIRRIGATION<br />
Uniform<br />
Application<br />
Graphic courtesy <strong>of</strong> Ge<strong>of</strong>f Connellen, University <strong>of</strong> Melbourne.<br />
In order to ensure only as much water is applied to turf as<br />
is required without wastage, the irrigation schedule must be<br />
matched to the irrigation requirement <strong>of</strong> the site. To do this<br />
the following information is required;<br />
• How much water does the plant need?<br />
• How much water is stored in soil?<br />
• How much water is available to the plant?<br />
• How much water needs to be applied?<br />
• When should irrigation be applied?<br />
• How long should the irrigation system be operated for?<br />
In answering the above questions, an irrigation schedule will<br />
be developed for the following site;<br />
Site - Local soccer ground<br />
Area - 1.2 hectare<br />
Location - Adelaide metropolitan area<br />
Turf species - Kikuyu<br />
Turf Quality Standard - TQVS Cat 3<br />
Soil Type - Sandy Loam<br />
Irrigation season - October – April inclusive<br />
Climate data period - Long term average<br />
Irrigation time limits - 9.00pm - 8.00am<br />
Irrigation day limits - No irrigation Friday/Saturday<br />
5.0 TURF & IRRIGATION MANAGEMENT PRINCIPLES<br />
No<br />
Losses<br />
23<br />
5.8.1 How much water does the plant need?<br />
The water requirement <strong>of</strong> the plant or Crop<br />
Evapotranspiration (ETc) less any Effective Rainfall (Pe)<br />
for the period is the Net Irrigation Requirement (In) for a<br />
given period. Daily net irrigation requirement is used in<br />
developing an irrigation schedule to monitor the plant water<br />
use and reduction in soil water available to the plant.<br />
The calculation <strong>of</strong> the Net Irrigation Requirement (In)<br />
is detailed in Sect 5.7 <strong>of</strong> this paper and in Appendix No 1 –<br />
IPOS - Irrigation Requirement Model.<br />
Table No 6 details the Net Irrigation Requirement (In)<br />
for TQVS Cat. 3 (local sports ground).<br />
Table No 6 – Daily Net Irrigation Requirement (In)<br />
– TQVS Cat. 3<br />
Item Oct Nov Dec Jan Feb Mar Apr<br />
Net Irrigation Req. (In) 24 42 53 61 50 41 17<br />
Days per month 31 30 31 31 28 31 30<br />
Daily In (mm) 0.8 1.4 1.7 2.0 1.8 1.3 0.6
5.8.2 How much water is stored in the soil?<br />
Total Available <strong>Water</strong> (TAW)<br />
The amount <strong>of</strong> water stored in the soil and available to the<br />
plant is referred to as the Total Available <strong>Water</strong> (TAW).<br />
When the soil reservoir is full it is said to be at field<br />
capacity. Any further water applied to the soil will either<br />
run-<strong>of</strong>f or be lost below the root zone by drainage. Plants<br />
will extract water from the soil as required until the<br />
remaining water in the soil is no longer able to be taken in<br />
by the plant. This is called ‘wilting point’. If water is not<br />
applied, either through natural rainfall or irrigation, the<br />
plant will become stressed to the point where it will die.<br />
The total available water in the root zone is the difference<br />
between the water content at field capacity and wilting point.<br />
The TAW is determined by the soil type and its water<br />
holding capacity and the Root Zone Depth (Zr) <strong>of</strong> the plant.<br />
The calculation is:<br />
TAW = WHC x Zr<br />
Where:<br />
TAW - Total Available <strong>Water</strong> (mm)<br />
WHC - <strong>Water</strong> Holding Capacity <strong>of</strong> the soil (mm/mm)<br />
Zr root - Zone Depth (mm)<br />
Soil <strong>Water</strong> Holding Capacity (WHC)<br />
<strong>Water</strong> is stored in the soil between the pore spaces or the<br />
soil particles. Different soils have different sized pore spaces<br />
and there is a significant variation in the water holding<br />
capacity <strong>of</strong> different soils. By taking a soil sample and<br />
determining the soil type, the water holding capacity <strong>of</strong> the<br />
soil can be determined from the following table.<br />
5.0 TURF & IRRIGATION MANAGEMENT PRINCIPLES<br />
24<br />
Table No 7 – Typical <strong>Water</strong> Holding Capacity and<br />
Infiltration Rate <strong>of</strong> Soils<br />
SoilType Soil <strong>Water</strong> Soil <strong>Water</strong> Soil<br />
Holding Holding Infiltration<br />
Capacity (WHC) Capacity (WHC) Rate<br />
mm/metre mm/metre (mm/hr)<br />
Sand 60 0.06 >20<br />
Fine sand 90 0.09 15 – 20<br />
Sandy loam 110 0.11 10 – 18<br />
Loam 150 0.15 10 – 15<br />
Silt loam 160 0.16 8 – 12<br />
Clay loam 180 0.18 5 – 10<br />
Clay 150 0.15 < 5<br />
Plant Root Zone Depth (Zr)<br />
The extent to which the plant roots grow into the soil<br />
determines the depth and volume <strong>of</strong> water in the soil the<br />
plant can access. Generally open soils such as sand enable<br />
plants to develop root systems to a greater depth than<br />
heavier clay soils. The depth <strong>of</strong> roots in turf can be<br />
determined by taking a soil sample and measuring the<br />
depth <strong>of</strong> roots in the pr<strong>of</strong>ile.<br />
Having determined the soil water holding capacity and the<br />
plant root zone depth, the total available water can be<br />
calculated as follows;<br />
Where Kikuyu is grown in sandy loam with a root zone<br />
depth <strong>of</strong> 150mm:<br />
TAW = WHC x Zr<br />
= 0.11 x 150 = 16.5 mm
5.8.3 How much water is available to the plant?<br />
Readily Available <strong>Water</strong> (RAW)<br />
The percentage <strong>of</strong> the Total Available <strong>Water</strong> (TAW) that a<br />
plant can extract from the root zone without suffering stress<br />
is the Readily Available <strong>Water</strong> (RAW).<br />
RAW =TAWxMAD<br />
Where<br />
RAW -ReadilyAvailable<strong>Water</strong>(mm)<br />
TAW -TotalAvailable<strong>Water</strong>(mm)<br />
MAD - Maximum Allowable Depletion (%)<br />
As the soil water level is reduced the ability <strong>of</strong> the plant to<br />
take up water is also reduced. In most situations it is desirable<br />
to maintain the soil water level at a level where the plant is<br />
able to extract water with no stress. The soil water level must<br />
be kept between field capacity and wilting point. This is<br />
called the Maximum Allowable Depletion (MAD). When the<br />
soil water level reduces to the MAD, irrigation must be<br />
applied to bring the soil moisture level back to field capacity.<br />
Determining the MAD is a management decision that may<br />
vary depending upon a number <strong>of</strong> factors including season,<br />
usage <strong>of</strong> the turf andgrowthphase<strong>of</strong>the turf. As a general<br />
rule the MAD for turf is set at 50% <strong>of</strong> RAW.<br />
Where Kikuyu is grown in sandy loam with a root zone<br />
depth <strong>of</strong> 150mm<br />
RAW = TAW x MAD<br />
= 16.5 x 0.5<br />
= 8.3 mm<br />
5.0 TURF & IRRIGATION MANAGEMENT PRINCIPLES<br />
25<br />
5.8.4 How much water needs to be applied?<br />
When the plant has extracted the Readily Available <strong>Water</strong><br />
(RAW) from the root zone, irrigation needs to be applied to<br />
refill the soil reservoir to field capacity. The amount <strong>of</strong> water<br />
that needs to be applied is that extracted from the soil (RAW)<br />
plus an additional amount to compensate for irrigation<br />
system application inefficiencies (Ea). This is referred to as<br />
the irrigation depth or the Optimum Irrigation Event (OIE)<br />
OIE = RAW/Ea<br />
Where:<br />
OIE - Optimum Irrigation Event (mm)<br />
RAW -ReadilyAvailable<strong>Water</strong>(mm)<br />
Ea - Application Efficiency (mm)<br />
Irrigation System Application Efficiency (Ea)<br />
As previously indicated, irrigation systems have inherent<br />
inefficiencies which reduce the uniformity <strong>of</strong> application <strong>of</strong><br />
the system. A field irrigation audit, conducted by a qualified<br />
irrigation auditor, is required to determine the performance<br />
<strong>of</strong> the irrigation system. The irrigation system application<br />
efficiency factor used in the <strong>Code</strong> is 0.8 or 80% efficiency<br />
Ea = 0.8<br />
Given the information above the OIE, or the irrigation<br />
depth can be calculated<br />
OIE = RAW x Ea<br />
= 8.3/0.8<br />
= 10.3 mm (10 mm)<br />
The OIE <strong>of</strong> 10 mm is the amount <strong>of</strong> water that should be<br />
applied by the irrigation system to refill the soil moisture<br />
level to field capacity after the depletion <strong>of</strong> the Readily<br />
Available <strong>Water</strong> (RAW) (8.3 mm) in the root zone. Any<br />
water applied in excess <strong>of</strong> 10 mm in any one irrigation<br />
event will be wasted through deep drainage or run<strong>of</strong>f.
5.8.5 When should irrigation be applied?<br />
Irrigation Interval (Ti)<br />
The Irrigation Interval (Ti) is the interval or number <strong>of</strong><br />
days between the application <strong>of</strong> the Optimum Irrigation<br />
Event (OIE).<br />
Using long term average climatic data from the BoM to<br />
determine the daily net irrigation requirement, the daily soil<br />
water depletion can be monitored. When the soil water level<br />
reduces to the point where the Readily Available <strong>Water</strong><br />
(RAW) has been extracted, it is time to apply the Optimum<br />
Irrigation Event (OIE).<br />
The Irrigation Interval (Ti) (number <strong>of</strong> days between<br />
irrigation events) is calculated by dividing the Readily<br />
Available <strong>Water</strong> (RAW) in the soil by the Daily Net<br />
Irrigation Requirement (In(daily)) <strong>of</strong> the plant.<br />
Ti = RAW/In (daily)<br />
Where:<br />
Ti - Irrigation Interval (days)<br />
RAW - Readily Available <strong>Water</strong> (mm)<br />
In(daily) - Daily Net Irrigation Requirement (mm)<br />
Table No 8 – Irrigation Interval Per Month (days)<br />
Item Oct Nov Dec Jan Feb Mar Apr<br />
Readily avail. water<br />
(RAW) mm 8.3 8.3 8.3 8.3 8.3 8.3 8.3<br />
Daily net irrigation<br />
req. (In(daily)) mm 0.8 1.4 1.7 2.0 1.8 1.3 0.6<br />
Irrigation interval<br />
( Ti ) days 10 6 5 4 5 6 14<br />
5.0 TURF & IRRIGATION MANAGEMENT PRINCIPLES<br />
26<br />
5.8.6 How long should the irrigation system<br />
be operated?<br />
To determine how long the irrigation system should<br />
operate per station, Optimum Irrigation Event (OIE) is<br />
divided by the Irrigation System Application Rate (Iar) to<br />
give the Irrigation Run Time (Irt) to ensure application <strong>of</strong><br />
the required depth <strong>of</strong> water. The result is multiplied by<br />
60 to convert the result to minutes.<br />
Irt = (OIE/Iar) x 60<br />
Where:<br />
Irt - Irrigation System Run Time (minutes)<br />
OIE - Optimum Irrigation Event (mm)<br />
Iar - Irrigation System Application Rate (mm)<br />
60 - Multiplier to covert result to minutes.<br />
Irrigation System Application Rate (Iar)<br />
The rate at which the irrigation system applies water to the<br />
site is determined at the point <strong>of</strong> design. Factors such as<br />
flow, pressure, sprinkler type and sprinkler spacing all impact<br />
on the System Application Rate (Iar). Irrigation systems<br />
designed for large areas such as irrigated public open space<br />
generally have lower application rates than domestic<br />
systems. This is due to the size <strong>of</strong> the area being irrigated.<br />
IPOS irrigation systems generally have irrigation application<br />
rates <strong>of</strong> between 10 – 15 mm per hour. Domestic systems<br />
have application rates <strong>of</strong> up to 40 mm per hour.<br />
The application rate <strong>of</strong> the system can be determined by<br />
checking system pressure, flows and sprinkler spacing<br />
against the manufacturers sprinkler performance charts or<br />
by a field audit <strong>of</strong> the irrigation system.<br />
The irrigation application rate used in developing a base<br />
irrigation schedule in the <strong>Code</strong> is 13 mm per hour.<br />
The irrigation system run time per station is:<br />
Irt (min per station) = (OIE/Iar) x 60<br />
= (10/13) x 60<br />
= 0.8 x 60<br />
= 48 mins per station
Where an irrigation system has 12 stations the Irt per<br />
station is multiplied by the number <strong>of</strong> stations.<br />
Irt (minutes per site) = Irt (station) x 12<br />
= 48 x 12<br />
= 571 minutes<br />
Irt (hrs per site) = Irt (mins)/60<br />
= 571/60<br />
= 9.52 hours<br />
= 9 hrs 30 minutes<br />
An irrigation schedule is then developed in consideration<br />
<strong>of</strong> time restrictions in which irrigation can take place<br />
(usually night watering between 9.00pm and 8.00am) and<br />
usage <strong>of</strong> the reserve (no irrigation Friday or Saturday pm).<br />
Table No 9 – Irrigation Schedule – TQVS Cat 3<br />
5.0 TURF & IRRIGATION MANAGEMENT PRINCIPLES<br />
27<br />
A template for the development <strong>of</strong> an irrigation program is<br />
provided in Appendix No 2 IPOS – Irrigation Schedule Model.<br />
Irrigation schedules should respond to changing plant water<br />
requirements and should not be set for standard operation<br />
over the entire season. The base irrigation schedule is<br />
developed using long term average climatic data. The plant<br />
water requirement is determined by climatic factors and<br />
changes with the weather, i.e. evaporation/rainfall. As such<br />
the timing <strong>of</strong> irrigation events is governed by the irrigation<br />
requirement for the current period.<br />
The irrigation schedule detailed in table No 9 has been<br />
developed for a standard sports ground example using a<br />
high quality water source. Many irrigated sites have a<br />
variety <strong>of</strong> slopes, soil types and use water supplies high in<br />
salts, such as treated effluent. In such cases scheduling<br />
parameters such as surface run<strong>of</strong>f, soil infiltration rates and<br />
salt leaching factors need to be considered in the<br />
development <strong>of</strong> the irrigation schedule.<br />
Item Oct Nov Dec Jan Feb Mar Apr<br />
No <strong>of</strong> stations 12 12 12 12 12 12 12<br />
Total irrigation runtime (mins) 571 571 571 571 571 571 571<br />
Total irrigation runtime (hrs) 9.52 9.52 9.52 9.52 9.52 9.52 9.52<br />
Program start time 9.00pm 9.00pm 9.00pm 9.00pm 9.00pm 9.00pm 9.00pm<br />
Program finish time 6.30am 6.30am 6.30am 6.30am 6.30am 6.30am 6.30am<br />
<strong>Water</strong>ing days (wk 1) M M M M,Th M,Th M,Th Th<br />
<strong>Water</strong>ing days (wk 2) W M,Th M,Th M,Th M,Th<br />
<strong>Water</strong>ing days (wk 3) M M M,Th M,Th M,Th W M<br />
<strong>Water</strong>ing days (wk 4) M,Th M,Th M,Th M,Th W<br />
Irrigation events per month 2 5 7 8 8 5 2
5.9 Irrigation management technology<br />
In order to manage irrigation efficiently, daily monitoring<br />
<strong>of</strong> the weather and soil moisture levels is required. This can<br />
involve ongoing complex calculations and adjustment <strong>of</strong><br />
irrigation schedules to respond to the ever changing plant<br />
water requirements. Technologies have been developed to<br />
assist the irrigation manager to monitor climatic and soil<br />
moisture changes and adjust irrigation schedules<br />
automatically as required. Technologies such as<br />
computerised irrigation management systems, weather<br />
stations, soil moisture sensors and rain sensors can all<br />
improve irrigation management.<br />
5.9.1 Weather based irrigation control systems<br />
Irrigation control systems have been developed that use<br />
climatic data to calculate irrigation run times or to schedule<br />
irrigation events. Such systems are a useful tool in managing<br />
irrigation and relieve the irrigation manager from the task <strong>of</strong><br />
calculating the irrigation requirement and automatically<br />
adjust irrigation schedules as a function <strong>of</strong> the weather.<br />
Some systems are fully automatic and are linked to weather<br />
stations from which they retrieve climatic data and<br />
automatically calculate reference ETo and effective rainfall.<br />
The irrigation requirement is then calculated using preset<br />
crop co-efficient and system efficiency factors. Semiautomatic<br />
systems require manual input <strong>of</strong> a base irrigation<br />
schedule and daily input <strong>of</strong> reference ETo and effective<br />
rainfall from which the system determines the frequency <strong>of</strong><br />
irrigation events.<br />
Services are available whereby irrigation management service<br />
providers access climatic data from a network <strong>of</strong> weather<br />
stations. The data is processed by a centralised computer and<br />
transmitted to irrigation sites adjusting schedules or<br />
regulating irrigation events according to the weather.<br />
Climatic data can be accessed from either the Bureau <strong>of</strong><br />
Meteorology or from private weather stations. A significant<br />
factor in the efficiency <strong>of</strong> the control system is the quality<br />
<strong>of</strong> data used.<br />
5.0 TURF & IRRIGATION MANAGEMENT PRINCIPLES<br />
28<br />
5.9.2 Weather stations<br />
Weather stations can be installed by organisations to<br />
provide real time climatic data from which reference<br />
evaporation can be calculated. Weather stations are<br />
particularly useful for regional areas where Bureau <strong>of</strong><br />
Meteorology data is limited or for specific sites where<br />
climate data is required.<br />
Weather stations used for monitoring reference<br />
evapotranspiration (ETo) should conform to the<br />
requirements specified by the Bureau <strong>of</strong> Meteorology<br />
and in the FAO Technical Paper No 56.<br />
The following data is required;<br />
• Air temperature.<br />
• Relative humidity.<br />
• Wind speed.<br />
• Solar radiation.<br />
Weather station data is then used by the system to calculate<br />
ETo and subsequent irrigation schedules or events.<br />
5.9.3 Soil moisture based<br />
irrigation control systems<br />
Soil moisture sensors are able to directly record the soil<br />
moisture status <strong>of</strong> the soil. Information gained from soil<br />
moisture sensors provides both data on soil water reduction<br />
through ETc and a feedback loop which monitors the<br />
accuracy <strong>of</strong> climate driven irrigation schedules. The sensors<br />
record the net effect <strong>of</strong> the integration <strong>of</strong> soil, turf grass,<br />
climate and irrigation to assist with identifying indicators<br />
that drive the decision for irrigation and monitor the<br />
efficiency <strong>of</strong> irrigation.
Soil moisture sensors can be directly linked to the irrigation<br />
controller and are set at a threshold between field capacity<br />
and wilting point. The sensor will enable the system to<br />
activate a preset irrigation event when it records a reduction<br />
in soil moisture level to a percentage <strong>of</strong> field capacity. The<br />
irrigation event will apply a quantity <strong>of</strong> water that<br />
replenishes the soil moisture level to field capacity.<br />
Soil moisture sensors can also be used in conjunction with<br />
weather based control systems to monitor soil moisture<br />
levels and water movement through the soil pr<strong>of</strong>ile. They<br />
provide a feedback loop from which scheduling parameters<br />
can be adjusted to improve irrigation efficiency.<br />
Soil moisture sensors also provide conductivity measurements<br />
which are useful where treated effluent or water with high salt<br />
content is being used. When the sensor readings indicate that<br />
salt levels in the soil have reached a critically high point based<br />
on the conductivity readings, the turf should be irrigated<br />
heavily to leach the salts to below the root zone.<br />
With the use <strong>of</strong> soil moisture sensors, the irrigation<br />
manager can be aware <strong>of</strong>:<br />
• Root zone activity and root depth.<br />
• Drying out <strong>of</strong> the pr<strong>of</strong>ile during hot spells.<br />
• Infiltration levels as the pr<strong>of</strong>ile builds.<br />
• The timing <strong>of</strong> when to change the irrigation regime<br />
to avoid over watering.<br />
• The effectiveness <strong>of</strong> rain fall events in filling up the pr<strong>of</strong>ile<br />
• How effective is the leaching program <strong>of</strong> salts below<br />
the root zone.<br />
• What the actual irrigations events occurred with visual<br />
documentation to enable review and improvements.<br />
5.9.4 Rainfall sensors<br />
Rainfall sensors are a simple, effective method <strong>of</strong><br />
interrupting irrigation when an effective rainfall event has<br />
been experienced. Rainfall sensors are wired into a<br />
controller and can override the irrigation schedule causing<br />
the system to shut down in the event <strong>of</strong> rainfall.<br />
5.0 TURF & IRRIGATION MANAGEMENT PRINCIPLES<br />
29<br />
5.9.5 Flow and pressure sensors<br />
Flow and pressure sensors are used widely with pumping<br />
systems to control pump operation in the event <strong>of</strong><br />
abnormally low or high flows or pressures. They can also<br />
be used on mains water supply systems to detect bursts or<br />
sprinkler malfunctions and interrupt irrigation by closing<br />
a master valve in the event <strong>of</strong> failure.<br />
5.9.6 Computerised Irrigation Management<br />
System (CIMS)<br />
Computerised Irrigation Management Systems (CIMS) can<br />
be linked to a diverse range <strong>of</strong> sensors to remotely control<br />
irrigation events based on data collected from the sensors.<br />
CIMS will calculate the irrigation requirement based on<br />
sound principles using data transmitted from weather stations<br />
or soil moisture sensors or entered by the irrigation manager.<br />
CIMS can also remotely monitor system flows, pressure, or<br />
any aspect <strong>of</strong> the irrigation system that is sensor installed.<br />
CIMS have the capacity to manage a network <strong>of</strong> satellite<br />
controllers through a centralised computer system. The<br />
system can monitor and control the irrigation schedule based<br />
on a variety <strong>of</strong> parameters including flow rates, pressures,<br />
weather conditions and soil moisture from a single location.<br />
CIMS can be managed by the irrigation manager or can be<br />
managed externally by irrigation management providers.<br />
FURTHER INFORMATION:<br />
DEVELOPING AN IRRIGATION SCHEDULE<br />
Cape, J. 2004. Certified Landscape Irrigation Auditor<br />
Resource Manual. Irrigation Australia Limited, NSW.<br />
www.irrigation.org.au<br />
FAO Technical Paper No 56 – Crop Evapotranspiration.<br />
Guidelines for computing crop water requirements 1988.<br />
http://www.fao.org/docrep/X0490E/X0490E00.htm<br />
Australian Bureau <strong>of</strong> Meteorology (BoM), 2005, “Automatic<br />
Weather Stations for Agricultural and Other Applications.”<br />
US Department <strong>of</strong> Interior. Bureau <strong>of</strong> Reclamation,<br />
Lower Colorado Region. South California Area Office.<br />
2007. Weather and Soil Moisture Based Landscape<br />
Irrigation Scheduling Devices – Technical Review Report.<br />
Connellan, G. 2005. Best <strong>Practice</strong> Turf Irrigation<br />
Management, Victorian Golf Association, Vic.<br />
www.golfvic.org.au
CASE STUDY No 4<br />
GLENELG GOLF CLUB<br />
– IRRIGATION MANAGEMENT<br />
Glenelg Golf Club is a private course. It is one <strong>of</strong> Adelaide’s<br />
four Group 1 Clubs and ranked inside the top 70 in Australia<br />
and is based on the sand belt <strong>of</strong> Adelaide’s western suburbs,<br />
1km from Gulf St Vincent and in close proximity to<br />
Brownhill and Sturt Creeks and the Patawolonga.<br />
Glenelg has gone through a process <strong>of</strong> improving turf and<br />
irrigation management practices over the past 10 years with<br />
the redevelopment <strong>of</strong> the course commencing in 1998. This<br />
process included reconstruction <strong>of</strong> some greens, fairways<br />
and tees; the upgrading <strong>of</strong> the irrigation system and the<br />
installation <strong>of</strong> a computerised centralised control system;<br />
the use <strong>of</strong> soil moisture sensors to monitor soil water<br />
volumes and salt content <strong>of</strong> the soil and the development <strong>of</strong><br />
wetlands to harvest stormwater for an aquifer storage and<br />
recovery system that will provide a sustainable water supply<br />
for the course.<br />
The results <strong>of</strong> the significant investment have been:<br />
• Overall improvement in the turf quality<strong>of</strong>the course.<br />
• Significant reduction in water consumption for irrigation.<br />
• Sustainable environmental management practices that<br />
minimise impact on the site and ground water reserves.<br />
• Improved water quality and access to a sustainable<br />
water supply.<br />
• Improved management <strong>of</strong> nutrient and salt levels within<br />
the soil pr<strong>of</strong>ile.<br />
5.0 TURF & IRRIGATION MANAGEMENT PRINCIPLES<br />
30<br />
Glenelg Golf Club is committed to sustainable management<br />
<strong>of</strong> water and has invested heavily to develop and monitor<br />
efficiency improvements.<br />
This case study demonstrates this commitment, which is<br />
documented throughout the Club’s Environmental<br />
Management System and Quality Turf Plan.<br />
For more information refer to the full case study in<br />
Appendix No 4.
6.0 IRRIGATION MONITORING<br />
& PERFORMANCE REPORTING<br />
It is necessary to monitor both water consumption and<br />
quality or ‘fit for purpose’ standard <strong>of</strong> turf, to ensure the<br />
objectives <strong>of</strong> efficient and effective turf and irrigation<br />
management are being met. The objective <strong>of</strong> irrigation<br />
management is to produce a turf quality outcome that is<br />
able to meet its functional objective.<br />
6.1 Irrigation efficiency reporting<br />
In order to evaluate past and current irrigation efficiency,<br />
it is necessary to compare Irrigation Applied (I) with the<br />
Irrigation Requirement (BIr or Ir) for a given period.<br />
Irrigation efficiency reporting models compare the Irrigation<br />
Applied (I) with Base Irrigation Requirement (BIr) and/or<br />
the Irrigation Requirement (Ir) to calculate an Irrigation<br />
Efficiency Index (Ii) for each site. The Ii is used as a measure<br />
<strong>of</strong> water use efficiency.<br />
Ii = I/Ir<br />
Where:<br />
Ii - Irrigation Efficiency Index (decimal)<br />
I - Irrigation Applied (mm)<br />
Ir - Irrigation Requirement (mm)<br />
Table No 10 - Irrigation Efficiency Index<br />
- Comparison between various categories <strong>of</strong> turf<br />
Note – I (06/07) values are for demonstration only.<br />
31<br />
Figure No 4 – Irrigation Efficiency Index (Ii)<br />
A.WATERAPPLIED<br />
(Ii) = <strong>Water</strong>Applied<br />
<strong>Water</strong>Required<br />
Graphic courtesy <strong>of</strong> Ge<strong>of</strong>f Connellan, University <strong>of</strong> Melbourne.<br />
B.WATERREQUIRED<br />
Rainfall<br />
Irrigation<br />
ET<br />
The Irrigation Applied (I) is obtained by reading the water<br />
meter or from <strong>SA</strong> <strong>Water</strong> consumption records. Meters<br />
should be fitted to all water supplies. Where buildings or<br />
other uses come <strong>of</strong>f the same water supply, slave meters<br />
should be fitted to record consumption for each function.<br />
Meters with electronic flow rate output signals that can be<br />
monitored remotely are desirable.<br />
Description TQVS Cat. Area ha BIr Ir(06/07) I(06/07) Variance (I–Ir) Irrigation<br />
kL/site kL/site kL/site Efficiency (Ii)<br />
AFL Football Ground 1 1.9 15,915 19,729 20,910 1,181 1.06<br />
District Cricket Ground 2 1.7 7,766 9,852 10,910 1,058 1.11<br />
Local Soccer Ground 3 1.2 4,340 5,578 5,395 -183 0.97<br />
Local Picnic Ground 4 0.6 1,599 2,101 3,005 904 1.43
Examples <strong>of</strong> Ii for each TQVS category <strong>of</strong> turf using<br />
Ir (06/07) data are shown below;<br />
A Ii result <strong>of</strong> 1.0 indicates that the Irrigation Application (I)<br />
is equal to Irrigation Requirement (Ir) which is the aim <strong>of</strong><br />
good irrigation management. Where the result is >1.0 this<br />
indicates more water has been used than required.<br />
Conversely where the result is
6.2 Turf quality/‘fit for use’ reporting<br />
Assessing irrigation efficiency is only half the job. With the<br />
ultimate objective being the provision <strong>of</strong> safe, ‘fit for<br />
purpose’ turf, the quality <strong>of</strong> the turf must also be monitored<br />
regularly. Reducing water consumption at the expense <strong>of</strong><br />
the ability <strong>of</strong> the turf to perform its intended function is an<br />
unacceptable outcome.<br />
The Ii can be linked to turf quality and thereby provide<br />
indicators as to the performance <strong>of</strong> the overall turf and<br />
irrigation management.<br />
Table No 11 provides a correlation between Ii and the turf<br />
quality outcome.<br />
The matrix below provides turf quality indicators according<br />
to varying irrigation efficiency indices. The turf must<br />
however be monitored and inspected to ensure the actual<br />
turf quality and ‘fit for purpose’ standards are acceptable.<br />
Table No 11 - Irrigation Efficiency<br />
– Turf Quality Analysis Matrix<br />
6.0 IRRIGATION MONITORING & PERFORMANCE REPORTING<br />
Irrigation Efficiency Index (Ii) Efficiency Rating Turf Quality Indicator<br />
33<br />
Turf should be maintained to meet quality and risk<br />
management standards appropriate for its intended use.<br />
Sporting club associations and ground managers have a duty<br />
<strong>of</strong> care to all people using facilities. This means that sports<br />
facilities, including the turf surface, must not present an<br />
unacceptable risk <strong>of</strong> injury to those using them.<br />
The standards for turf will vary with the TQVS rating and<br />
the usage <strong>of</strong> the ground. It is important to document the<br />
required standards using criteria discussed in section 5.5 <strong>of</strong><br />
the <strong>Code</strong>. A quality and risk assessment inspection sheet<br />
should be prepared to enable sites to be assessed and a<br />
record kept <strong>of</strong> the assessment outcomes. A risk assessment<br />
<strong>of</strong> the turf surface should be undertaken weekly for active<br />
sports with a quality audit undertaken monthly to monitor<br />
wear trends and turf quality.<br />
< 0.50 Extremely poor I is greater than 50% less than Ir. Turf under significant stress/dying.<br />
Sports ground may be unsafe and not "fit for use".<br />
Review Irrigation Management Plan and scheduling parameters.<br />
0.69 to 0.50 Very poor I is between 31 to 50% less than Ir. Turf wilting does not meet quality standard.<br />
Sports ground may be unsafe and not "fit for use". Review and alter scheduling parameters.<br />
0.79 to 0.70 Poor I is between 21 to 30% less than Ir. Turf showing signs <strong>of</strong> stress.<br />
Does not meet quality standard. Review and alter scheduling parameters.<br />
0.89 to 0.80 Medium I is between 11 to 20% Ir. Turf quality declining. Increased irrigation required.<br />
Check scheduling parameters.<br />
0.99 to 0.90 Good I is less than 10% <strong>of</strong> Ir. Turf meets quality standard. Fine tune scheduling parameters.<br />
1.00 Optimum Irrigation applied (I) meets Irrigation requirement (Ir). Turf meets quality standard.<br />
1.01 to 1.10 Good I is between 1 to 10% greater than Ir. Turf meets quality standard.<br />
Fine tune scheduling parameters.<br />
1.11 to 1.20 Medium I is between 11 to 20% greater than Ir. Turf quality high.<br />
Reduction in irrigation required. Check scheduling parameters.<br />
1.21 to 1.30 Poor I is between 21 to 30% greater than AIR. Turf lush, exceeding quality standard.<br />
<strong>Water</strong> wastage. Review and alter scheduling parameters.<br />
1.31 to 1.50 Very poor I is between 31 to 50% greater than Ir. Turf lush exceeding quality standard.<br />
Wastage <strong>of</strong> water. Review and alter scheduling parameters.<br />
> 1.50 Extremely poor I is greater than 50% more than Ir. Turf lush. Significant water wastage.<br />
Review Irrigation Management Plan and scheduling parameters.
7.0 DROUGHT RESPONSE PLAN<br />
A drought response plan should be developed to ensure<br />
strategies are in place to deal with drought scenarios where<br />
water availability for irrigated public open space is reduced.<br />
The objective <strong>of</strong> the drought response plan is to provide a<br />
staged strategy that protects community assets and valuable<br />
recreation facilities while reducing water consumption<br />
during periods <strong>of</strong> drought. The costs <strong>of</strong> re-establishing the<br />
landscape and irrigated turf can be significant.<br />
As a result <strong>of</strong> drought conditions and water shortages in<br />
national capitals across Australia, water restrictions have<br />
been introduced ranging from permanent water<br />
conservation measures where management <strong>of</strong> IPOS must<br />
follow best practice management to Level 5 restrictions<br />
where irrigation <strong>of</strong> public open space using potable mains<br />
water is prohibited. Organisations responsible for managing<br />
IPOS must be prepared to take appropriate action to<br />
comply with water use reduction regimes and restrictions.<br />
In developing a drought response plan the following issues<br />
require consideration:<br />
• A <strong>Water</strong> Efficiency Management Plan (WEMP) should<br />
be developed in accordance with the <strong>Code</strong> <strong>of</strong> <strong>Practice</strong>.<br />
The WEMP should be implemented as part <strong>of</strong><br />
permanent water conservation measures.<br />
• All irrigated sites should be categorised according to the<br />
TQVS standard and functional objective <strong>of</strong> the site as<br />
part <strong>of</strong> the WEMP.<br />
• An inventory <strong>of</strong> all significant and feature trees and<br />
garden beds should be made prioritising them in order<br />
<strong>of</strong> importance.<br />
• Turf sites should be assessed against functional standards<br />
and reduced in size to the minimum area required to<br />
meet the functional objective. Areas where irrigation is<br />
withdrawn should be re-landscaped with drought tolerant<br />
plantings and treatments.<br />
• A strategy <strong>of</strong> withdrawing irrigation from less functional<br />
sites should be prepared, to be implemented as water<br />
availability decreases.<br />
• Alternate water supplies to potable mains water should<br />
be investigated and where possible accessed for irrigation<br />
purposes. Ground water or recycled water may have to be<br />
transported to critical areas <strong>of</strong> the landscape i.e.<br />
significant trees or turf cricket pitches, as mains water<br />
availability reduces.<br />
• Sports grounds may have to be closed to competitive<br />
sport where grounds become unsafe for play. Turf quality<br />
and risk assessment audits will form the basis <strong>of</strong> such<br />
ground closures.<br />
34
8.0 TRAINING & CERTIFICATION<br />
In order to manage IPOS effectively specific skill sets or<br />
competencies are required at different levels from the<br />
maintenance <strong>of</strong> grounds and irrigation systems to<br />
scheduling, management and design. The following matrix<br />
details competencies and qualifications required by<br />
personnel involved in the management <strong>of</strong> IPOS.<br />
Table No 12 – Irrigation Skills Matrix<br />
Position/Task Competency level Min.qualifications/accreditation<br />
Grounds person General horticulture skills including; Certificate III Horticulture/Turf Management<br />
-Turfculturalpractices<br />
-Soils&plantnutrition IAL Certified Irrigation Operator<br />
-Turfgrassidentification<br />
-Operatingirrigationsystems<br />
Irrigation installer/maintenance worker Irrigation, installation & maintenance Certificate III Horticulture/Irrigation<br />
9.0 CONCLUSION<br />
The <strong>Code</strong> <strong>of</strong> <strong>Practice</strong> – <strong>Irrigated</strong> <strong>Public</strong> <strong>Open</strong> <strong>Space</strong> provides a<br />
process which can be used by managers <strong>of</strong> IPOS to ensure<br />
the planning, management and reporting <strong>of</strong> water<br />
consumption in the urban environment is based on sound<br />
principles applied consistently at all levels <strong>of</strong> management.<br />
The <strong>Code</strong> <strong>of</strong> <strong>Practice</strong> can be used by providers, practitioners,<br />
and regulating authorities to set policy, manage resources<br />
and regulate water use in the provision <strong>of</strong> IPOS.<br />
35<br />
IAL Certified Irrigation Installer<br />
Irrigation auditor/scheduler Advanced horticulture & irrigation maintenance Certificate IV Horticulture/Turf<br />
-Monitorperformance<strong>of</strong>Irrigationsystem<br />
& turf quality IAL Certified Landscape Irrigation Auditor<br />
Parks/irrigation manager Advanced horticulture & irrigation management Diploma Horticulture<br />
-Manageoverallperformance<strong>of</strong>thelandscape<br />
including human, infrastructure & financial resources IAL Certified Landscape Irrigation Manager<br />
Irrigation designer Advanced horticulture & irrigation Diploma Horticulture/Irrigation<br />
-Designlandscapeirrigationsystems<br />
-Provideadviceonefficientirrigationpractices IAL Certified Irrigation Designer<br />
Landscape design Landscape design/plant selection Diploma Landscape Design<br />
-Plantselection<br />
-<strong>Water</strong>sensitiveurbandesign Bachelor Landscape Architecture<br />
-Landscapedesign
APPENDICES<br />
APPENDIX No 1<br />
IPOS – WATER BUDGET/IRRIGATION REQUIREMENT MODEL<br />
(refer Excel spreadsheets on CD supplied in the back <strong>of</strong> this document for Appendices 1 – 3)<br />
APPENDIX No 2<br />
IPOS – IRRIGATION SCHEDULING MODEL<br />
(refer Excel spreadsheets on CD supplied in the back <strong>of</strong> this document for Appendices 1 – 3)<br />
APPENDIX No 3<br />
IPOS – IRRIGATION EFFICIENCY REPORTING MODEL<br />
(refer Excel spreadsheets on CD supplied in the back <strong>of</strong> this document for Appendices 1 – 3)<br />
APPENDIX No 4<br />
DETAILED CASE STUDIES<br />
APPENDIX No 5<br />
GLOS<strong>SA</strong>RY<br />
36
CITY OF <strong>SA</strong>LISBURY<br />
- AQUIFER STORAGE AND RECOVERY<br />
Origins <strong>of</strong> Wetland and Aquifer Storage and Recharge<br />
(ASR).<br />
In the early 1970’s the City <strong>of</strong> Salisbury embarked on a<br />
project to redevelop a 46 hectare (ha) site in Para Hills<br />
known as the Paddocks. The objective <strong>of</strong> the development<br />
was to create a community sport and recreation complex<br />
and to provide flood mitigation for proposed residential<br />
developments adjacent to the site. 23 (ha) <strong>of</strong> irrigated<br />
passive and active turf was developed while the remaining<br />
23 (ha) was constructed with a series <strong>of</strong> mounds, swales<br />
and shallow wetlands planted out with indigenous<br />
terrestrial and aquatic plantings. Stormwater from the<br />
adjacent para-escarpment residential area was held within<br />
the constructed wetlands providing flood protection for<br />
adjacent developments while the irrigated sports grounds<br />
provided a valuable recreation facility for the community.<br />
APPENDICES<br />
APPENDIX No 4 – CASE STUDY No 1<br />
37<br />
At the time <strong>of</strong> construction little was known <strong>of</strong> the potential<br />
for wetlands to improve water quality and the main objective<br />
was for flood mitigation and to provide a significant<br />
landscape feature. It was not until the early 1990’s that water<br />
quality monitoring <strong>of</strong> the site identified the success <strong>of</strong> the<br />
wetland in improving water quality to the point where it was<br />
suitable for aquifer recharge. Nutrient and pollution loads<br />
are reduced by as much as 90% with the treated water<br />
having salinity less than 220 gm/l. Subsequently the<br />
Paddocks became the first Aquifer Storage and Recovery<br />
(ASR) site in Adelaide and became the prototype for ASR<br />
projects nationally. Today the stormwater from the paraescarpment<br />
in winter is cleansed through the Paddocks<br />
wetland, recharged into the underground aquifer and drawn<br />
from the aquifer to irrigate the entire sporting complex<br />
during summer.
The City <strong>of</strong> Salisbury now has some thirty six major<br />
wetlands, covering several square kilometres in all. In<br />
addition, all new residential subdivisions in the past ten<br />
years have been required to install wetlands to contain<br />
stormwater onsite as much as possible. Large industrial<br />
developments have also been actively encouraged to develop<br />
wetlands for the same reason and in order to contain<br />
potential industrial spills. Collectively, these initiatives have<br />
effectively eliminated flood risk in an otherwise flood-prone<br />
area and have dramatically increased the wildlife habitat<br />
and biodiversity within the City.<br />
Importantly, they have also substantially reduced the flow<br />
<strong>of</strong> polluted surface water into the fragile Barker Inlet<br />
estuary, opened new opportunities for the economic<br />
recycling <strong>of</strong> stormwater and reduced demand on water<br />
sourced from the River Murray.<br />
<strong>Water</strong> for Industry<br />
The City <strong>of</strong> Salisbury has six ASR sites currently operating,<br />
harvesting a total <strong>of</strong> 1,895 megalitres (ML) <strong>of</strong> stormwater<br />
annually. Two ASR sites are used to provide water to<br />
industry which would otherwise rely on mains water as the<br />
primary source. The Parafield Wetlands provide 1,100 ML<br />
per annum to G H Michell and Sons, Australia’s largest<br />
wool processing company. The Kaurna Park Wetlands<br />
provides 100 ML <strong>of</strong> water to Heynes Nursery. The<br />
Edinburgh Parks Storm <strong>Water</strong> Supply Project is currently<br />
under development and will yield approximately 1,500 ML<br />
<strong>of</strong> water annually supplying General Motors Holden,<br />
DSTO, Edinburgh Airport and the Edinburgh Parks<br />
Industrial Precinct.<br />
Irrigation<br />
AQUIFIERSTORAGE ANDRECOVERY(ASR)<br />
Injection<br />
Well Wetland/Basin<br />
Wet Season<br />
DrySeason<br />
Sewage<br />
Treatment<br />
Stormwater/<br />
Wastewater<br />
Sewage<br />
GroundwaterLevel<br />
ConfiningLayer<br />
Aquifer<br />
Storm/Wastewatertoaquiferinwetseason<br />
Recoveryfromaquiferindryseason<br />
Natural<br />
Recharge<br />
APPENDICES<br />
38<br />
<strong>Water</strong> for <strong>Irrigated</strong> <strong>Public</strong> <strong>Open</strong> <strong>Space</strong><br />
In addition to supporting industry with supplies <strong>of</strong><br />
alternative water sources, the City <strong>of</strong> Salisbury has invested<br />
significantly in developing alternative water supplies to<br />
irrigated public open space. In 1983 Salisbury had only<br />
6% <strong>of</strong> its irrigated area supplied by alternative water<br />
supplies to mains water. In 2006 this increased to 56%.<br />
City <strong>of</strong> Salisbury <strong>Water</strong> Use Pr<strong>of</strong>ile 2006<br />
– <strong>Irrigated</strong> <strong>Public</strong> <strong>Open</strong> <strong>Space</strong><br />
<strong>Water</strong> Supply Native Re-claimed Storm<br />
Mains Ground Effluent <strong>Water</strong> Total<br />
<strong>Water</strong> ASR<br />
Area ha 75 48 11 35 169<br />
Area % 44% 28% 7% 21% 100%<br />
ML / Annum 285 183 42 134 643<br />
Reclaimed<br />
Effluent<br />
7%<br />
CITYOF<strong>SA</strong>LISBURYWATERUSEPROFILE2006<br />
Stormwater ASR<br />
21%<br />
Mains<br />
44%<br />
Extension <strong>of</strong> the ASR program has also seen schools within<br />
the council area being provided with water to irrigate their<br />
sports grounds. Currently eight schools are being supplied<br />
with ASR based water with a further thirty sites identified<br />
for connection over the next three years.<br />
<strong>Water</strong> for the Community (Mawson Lakes)<br />
Native<br />
Ground <strong>Water</strong><br />
28%<br />
The developing suburb <strong>of</strong> Mawson Lakes in the City <strong>of</strong><br />
Salisbury local government area will cater for approximately<br />
10,000 residents when complete in 2010. This innovative<br />
development uses recycled water technology to provide both<br />
potable mains water and alternative recycled water to every<br />
house in the development.<br />
This recycled water system is the product <strong>of</strong> a unique<br />
partnership between the State Government’s Land<br />
Management Corporation, <strong>SA</strong> <strong>Water</strong>, Delfin Lend Lease<br />
and the City <strong>of</strong> Salisbury.<br />
The recycled water is a mix <strong>of</strong> treated wastewater from the<br />
<strong>SA</strong> <strong>Water</strong> Bolivar Wastewater Treatment Plant and cleansed<br />
stormwater from the Parafield Airport Wetlands.
Treated wastewater is chlorinated and pumped from the<br />
plant at Bolivar, to a 25 ML tank adjacent to the<br />
Greenfields wetlands. <strong>Water</strong> from the Parafield Stormwater<br />
Harvesting scheme is pumped to the tank at Greenfields,<br />
where it is mixed with treated wastewater. From the mixing<br />
tank it is pumped by <strong>SA</strong> <strong>Water</strong> to Mawson Lakes via a<br />
separate reticulation system defined by lilac coloured pipes.<br />
The recycled water at Mawson Lakes is used by residents for<br />
flushing toilets, watering gardens and washing cars as well as<br />
for irrigating public open space within the development.<br />
<strong>Water</strong> for the Future (<strong>Water</strong>pro<strong>of</strong>ing Northern Adelaide)<br />
In the past decade the City <strong>of</strong> Salisbury has pioneered the use<br />
<strong>of</strong> wetlands and water recycling projects to improve overall<br />
water efficiency in the region. In recognition <strong>of</strong> achievements<br />
to date the <strong>Water</strong>pro<strong>of</strong>ing Northern Adelaide Project has<br />
now commenced. The Australian Government <strong>Water</strong> Fund<br />
is providing a $41.8m grant, the State will provide over $16m<br />
and three councils (Salisbury, Playford and Tea Tree Gully)<br />
will invest over $22m over the years up to 2010.<br />
This project will integrate stormwater, groundwater,<br />
wastewater and drinking water systems in the Northern<br />
Adelaide Plains region <strong>of</strong> South Australia and will include:<br />
• The capture and cleansing <strong>of</strong> stormwater in urban<br />
wetlands, Aquifer Storage and Recovery (ASR) and<br />
distribution <strong>of</strong> water for the irrigation <strong>of</strong> public spaces<br />
and for industrial use.<br />
• An Aquifer Storage, Treatment and Recovery (ASTR)<br />
trial to be undertaken by the CSIRO to determine<br />
optimum practices <strong>of</strong> storage and recovery to treat water<br />
to drinking quality standards.<br />
• The trialling <strong>of</strong> a system to utilise domestic rainwater<br />
tanks to harvest water and release it for community reuse.<br />
• Hydrological modelling to predict the annual average<br />
run<strong>of</strong>f from regional catchments to enhance regional<br />
water management.<br />
APPENDICES<br />
39<br />
The project will also substitute 1.2 gigalitres per year <strong>of</strong><br />
water currently sourced from stressed groundwater systems<br />
and recharge five gigalitres per year to the local over used<br />
and over allocated groundwater.<br />
12.1 gigalitres per year <strong>of</strong> drinking water currently used for<br />
industrial and urban irrigation will be replaced with treated<br />
stormwater drawn from the Northern Adelaide Plains<br />
groundwater system. This will reduce the region’s<br />
dependence on drinking water by 6%.<br />
The additional recharge to the groundwater will return the<br />
Dry Creek, Virginia and <strong>Water</strong>loo Corner regions <strong>of</strong><br />
groundwater drawdown to sustainable levels. The reuse <strong>of</strong><br />
stormwater will reduce the ocean outfall through Barker Inlet<br />
and the regions dependence on water from the River Murray.<br />
Conclusion<br />
The City <strong>of</strong> Salisbury has demonstrated leadership in the<br />
area <strong>of</strong> integrated water cycle management. The<br />
construction <strong>of</strong> swales, wetlands and ponding basins has<br />
enhanced the landscape and biodiversity <strong>of</strong> the Northern<br />
Adelaide Plain and has provided opportunity to harvest<br />
stormwater for reuse in industry and the irrigation <strong>of</strong> public<br />
open space.<br />
It is hoped the leadership shown by the City <strong>of</strong> Salisbury in<br />
this area will act as a catalyst to achieve the paradigm shift<br />
amoung regulators, industry and the community that is<br />
necessary if we are to realise the enormous potential <strong>of</strong><br />
stormwater as a valuable and sustainable resource.<br />
FURTHER INFORMATION:<br />
Go to www.salisbury.sa.gov.au
APPENDICES<br />
APPENDIX No 4 – CASE STUDY No 2<br />
IRRIGATION AUDITING - DEPARTMENT OF<br />
EDUCATION AND CHILDREN’S SERVICES<br />
The South Australian Department <strong>of</strong> Education and<br />
Children’s Services (DECS) has directed significant<br />
resources in recent years toward improvements in irrigation<br />
infrastructure and management. Many schools have<br />
received financial grants to automate manual systems to<br />
permit night time watering and water efficient scheduling.<br />
Others have been assisted in the training <strong>of</strong> the grounds<br />
staff in efficient irrigation techniques and the auditing <strong>of</strong><br />
irrigation practices. DECS irrigation audits are carried out<br />
by landscape irrigation auditors certified by the Irrigation<br />
Australia Limited (IAL) and are to be done according to the<br />
IAL Certified Landscape Irrigation Audit Methodology.<br />
Information provided in the audits is sufficiently detailed to:<br />
• Permit efficiency rating <strong>of</strong> the irrigation system<br />
• Quantify potential mains water savings<br />
• Calculate water budgets for each school<br />
Comparing historical consumption with the recommended<br />
Base Irrigation Rates in the <strong>Code</strong> <strong>of</strong> <strong>Practice</strong> can reveal<br />
which schools are potentially over-watering. A school oval<br />
should typically be watered to the Turf Quality Visual<br />
Standard ‘Classification No 3 – Local Sports Turf’<br />
(a Base Irrigation Rate <strong>of</strong> 3620 kL/ha/annum). Auditors<br />
can develop water budgets around this target figure and<br />
The table below lists DECS schools within metropolitan<br />
Adelaide that were recently audited.<br />
40<br />
provide recommendations to reduce water use without<br />
compromising turf quality. Estimated water savings should<br />
be quantified for each recommendation to enable<br />
prioritisation <strong>of</strong> actions. Some <strong>of</strong> the more significant<br />
actions being implemented at DECS schools as a result <strong>of</strong><br />
recent audits include:<br />
• Reprogramming controllers against a recommended<br />
schedule.<br />
• Installation <strong>of</strong> sub metering.<br />
• Raising, realigning or replacing sprinkler heads.<br />
• Installing rain sensors, flow sensor and moisture sensors.<br />
• Fixing leaking seals.<br />
• Replacing mainlines.<br />
• Replacing leaking heads.<br />
• Installingpumpsandtankstoimprovesystemperformance.<br />
• Relocating, rewiring or reprogramming controllers.<br />
Approximately 20% <strong>of</strong> mains water used for parks, gardens,<br />
ovals and sports fields in South Australia is used in schools.<br />
As a significant water user DECS seeks to continually<br />
improve its water management practices.<br />
FURTHER INFORMATION:<br />
Craig Walker, Senior Adviser ESD<br />
Dept Education and Children’s Services<br />
Telephone 8226 1295<br />
School # Irrigation System Average Irrigation Area <strong>of</strong> turf Historical irrigation Base Irrigation Potential<br />
Distribution <strong>Water</strong> Use under irrigation water use (kL/ha) required water savings<br />
Uniformity (DU) (kL/annum) TQVS Cat3 (kL/ha) (kL/annum)<br />
1 58% 29,280 6.05 4,840 3,620 7,381<br />
2 65% 19,968 3.90 5,120 3,620 5,850<br />
3 68% 25,154 4.27 5,891 3,620 9,697<br />
4 66% 19,910 4.42 4,505 3,620 3,912<br />
5 72% 17,540 4.50 3,898 3,620 1,251<br />
6 68% 20,469 4.41 4,792 3,620 5,169
CITY OF TEA TREE GULLY<br />
– IRRIGATION MANAGEMENT STRATEGIES<br />
The City <strong>of</strong> Tea Tree Gully (located in the north <strong>of</strong> the<br />
Adelaide metropolitan area) has a total <strong>of</strong> 430 irrigated<br />
parks and reserves totalling 171 hectares.<br />
An Irrigation Management Strategy (IMS) was implemented<br />
by the city in 2003 when permanent water conservation<br />
measures were introduced. The objective <strong>of</strong> the IMS was to<br />
reduce water consumption by a minimum <strong>of</strong> 20% while<br />
ensuring efficient irrigation practices and ‘fit for purpose’<br />
sport and recreational turf.<br />
The results over the three year period from 2003-2006 has<br />
seen a reduction <strong>of</strong> 31% or 290,000 kL per annum from<br />
950,000 kL to 660,000 kL in overall water consumption<br />
while maintaining the same area <strong>of</strong> irrigated turf to<br />
satisfactory ‘fit for use’ standards.<br />
Average <strong>Water</strong> Consumption per annum<br />
APPENDICES<br />
APPENDIX No 4 – CASE STUDY No 3<br />
Average Annual Consumption<br />
Period <strong>Irrigated</strong> area Consumption per Hectare<br />
(ha) kL/ annum kL/ha<br />
Kilolitres<br />
1998 - 2003 171 950,000 5,556<br />
2003 - 2006 171 660,000 3,860<br />
Variance kL 290,000 1,696<br />
Variance % 31% 31%<br />
2006 / 2007 460,000<br />
1,000,000<br />
900,000<br />
800,000<br />
700,000<br />
600,000<br />
500,000<br />
400,000<br />
300,000<br />
200,000<br />
100,000<br />
0<br />
1998-2002 2003-2006<br />
Period<br />
2006-2007<br />
41<br />
Further reductions <strong>of</strong> 200,000 kL were achieved in the<br />
irrigation season 2006/07. These savings were largely the<br />
result <strong>of</strong> a reduction in irrigated area and the downgrading<br />
<strong>of</strong> some sites in order to meet the requirements for<br />
exemptions from Level 3 water restrictions to enable<br />
irrigation <strong>of</strong> sports grounds. The commissioning <strong>of</strong> ground<br />
water and ASR water supply projects also resulted in<br />
reduced mains water consumption.<br />
These results have been achieved through the implementation<br />
<strong>of</strong> a number <strong>of</strong> strategies to minimise water use on irrigated<br />
public open space. Strategies have included:<br />
Establishment <strong>of</strong> a Proactive <strong>Water</strong> Management System<br />
The objective <strong>of</strong> this strategy was to read all council water<br />
meters on a monthly basis and use this information to track<br />
water use. This strategy has been implemented for the past<br />
three years and has resulted in large water savings across the<br />
City. The information is also used to identify high water use<br />
areas, pipe leaks and assists Council to prioritise irrigation<br />
system repairs, upgrades and replacements.<br />
Irrigation Control Systems Replacement Program<br />
Irrigation controllers throughout the City were aging, faulty<br />
and lacked the latest water saving technologies such as<br />
water budgeting, central control capabilities and ‘cycle and<br />
soak’ watering.<br />
Over the past three years the Council has updated all <strong>of</strong> its<br />
controllers in the field to central control compatible systems<br />
that have many water saving features, even as stand-alone<br />
controllers. The larger sites will progressively be connected<br />
to a high-tech central control irrigation management system<br />
over the next few years.<br />
This system downloads information from a weather station<br />
such as evaporation and rainfall on a daily basis and<br />
automatically adjusts schedules to suit the environmental<br />
conditions. With the addition <strong>of</strong> an electronic flow meter to<br />
the irrigation system the controller will recognise pipe breaks<br />
and electrical faults in the field and shut the system down,<br />
potentially saving substantial amounts <strong>of</strong> water.
Auditing <strong>of</strong> Existing Systems<br />
Auditing <strong>of</strong> all Council’s irrigation systems is prioritised,<br />
starting with high water use reserves and larger irrigated<br />
areas. Auditing <strong>of</strong> irrigation systems is an essential and<br />
valuable tool to understand system performance and<br />
develop the appropriate schedule for each site. The majority<br />
<strong>of</strong> irrigation system infrastructure is aging (10-30 years old)<br />
and was not designed to current industry ‘best practice’<br />
standards, resulting in high maintenance and poor system<br />
efficiency (Distribution uniformities averaging 55%).<br />
Irrigation System Upgrades/Subsurface Drip Irrigation<br />
Based on the results <strong>of</strong> the irrigation audits, irrigation<br />
systems are being progressively upgraded. Where appropriate,<br />
sub surface drip irrigation systems are being installed.<br />
The City <strong>of</strong> Tea Tree Gully was the first council in Australia<br />
to trial sub-surface drip irrigation in a sportsfield in 1993.<br />
Sub-surface drip irrigates the turf directly to the root zone<br />
where the water is required. These systems are capable <strong>of</strong><br />
improving irrigation efficiency by 30 – 40%. Vandalism and<br />
maintenance costs are also significantly reduced. Council<br />
has four sports fields and ten neighbourhood parks irrigated<br />
with sub-surface drip.<br />
Council has been successful in obtaining Federal<br />
Government Community <strong>Water</strong> Grant funding to assist in<br />
the upgrading <strong>of</strong> irrigation systems.<br />
Alternative <strong>Water</strong> Sources<br />
Council has been proactive over the last five years, and has<br />
put in place schemes to reduce reliance on mains water.<br />
These strategies have provided for diversion from mains<br />
water to reclaimed/reuse water and to date have accounted<br />
for approximately 90,000 kL per annum, equating to<br />
approximately 15% <strong>of</strong> the City’s water consumption.<br />
Tea Tree Gully Council has joined forces with the Cities <strong>of</strong><br />
Salisbury and Playford in the <strong>Water</strong>pro<strong>of</strong>ing Northern<br />
Adelaide initiative in a bid to conserve and recycle water in<br />
the northern suburbs <strong>of</strong> Adelaide. This new water resource<br />
management scheme will deliver significant social,<br />
environmental and economic developments to the City.<br />
Under this scheme the City, for irrigation proposes to totally<br />
replace the demand on mains water by using treated<br />
wastewater and cleansed stormwater to meet the Council’s<br />
irrigation needs and to supplement mains water supplied to<br />
industries with higher water requirements.<br />
APPENDICES<br />
42<br />
Conclusion<br />
Over the past three to five years sound irrigation<br />
management strategies has resulted in significant reduction<br />
<strong>of</strong> water consumption for irrigated public open space within<br />
the City <strong>of</strong> Tea Tree Gully. Subsequent to reduced water<br />
consumption has been significant financial savings which<br />
will be ongoing and enable the funding <strong>of</strong> irrigation<br />
upgrades, the introduction <strong>of</strong> new technology and the<br />
development <strong>of</strong> alternative water supplies which will ensure<br />
a sustainable water supply into the future.<br />
FURTHER INFORMATION:<br />
Go to www.teatreegully.sa.gov.au
GLENELG GOLF CLUB<br />
– IRRIGATION MANAGEMENT<br />
Glenelg Golf Club is a private course and is one <strong>of</strong><br />
Adelaide’s four Group 1 Clubs ranked inside the top 70 in<br />
Australia. It is based on the sand belt <strong>of</strong> Adelaide’s western<br />
suburbs, 1km from Gulf St Vincent in close proximity to<br />
Brownhill and Sturt Creeks and the Patawolonga.<br />
The geological history <strong>of</strong> the site has resulted in a complex<br />
groundwater system that can be located at depths <strong>of</strong> one<br />
metre in places through to 100m (Tertiary – T1) and<br />
200m (Tertiary – T2) under the course.<br />
Irrigation management at Glenelg Golf Club is driven by<br />
the following:<br />
• Expectations for high quality playing surfaces from<br />
members and guests.<br />
• Complexity <strong>of</strong> this groundwater system.<br />
• Environmental sensitivity <strong>of</strong> the site.<br />
• Potential for public scrutiny <strong>of</strong> management practices.<br />
Course Redevelopment/Irrigation System Upgrade<br />
Since the Club was formed in 1927 it has had access to bore<br />
water throughout the course for irrigation purposes. This<br />
water was delivered via a constantly evolving manual<br />
irrigation system up until 1973 when an automatic system<br />
was installed. This system was based around single row<br />
valve-in-head sprinklers on fairways and single speed full<br />
circle sprinklers around greens and tees.<br />
The system was continually upgraded and altered, including<br />
the installation <strong>of</strong> a variable speed pump set in 1991 to<br />
improve water delivery efficiency and reduce pipe work<br />
stress from water hammer.<br />
In 1998, the Club embarked on a staged Course<br />
Redevelopment Project to upgrade the quality <strong>of</strong> the turf<br />
playing surfaces and produce a sustainable course. <strong>Water</strong><br />
management was a cornerstone for the success <strong>of</strong> this<br />
project, with Irrigation Management identified as an area<br />
that needed to be addressed at several levels.<br />
As a result, each stage <strong>of</strong> the project included capital<br />
investment (dictated by budget) in the irrigation system.<br />
This process is continuing today (despite the course<br />
redevelopment having been completed in 2004), with<br />
sectional upgrades planned until 2010. From 2010, an asset<br />
management plan for the irrigation system has been<br />
projected to 2025 so that irrigation management remains a<br />
focus for the Club in years to come.<br />
APPENDICES<br />
APPENDIX No 4 – CASE STUDY No 4<br />
43<br />
Some <strong>of</strong> the features <strong>of</strong> the irrigation management review<br />
and irrigation system upgrade have included:<br />
• Fully computerised central control system.<br />
• More efficient control <strong>of</strong> applied water, and performance<br />
monitoring capabilities.<br />
• Installation <strong>of</strong> dual (and triple) row fairway irrigation.<br />
• Greater distribution uniformity without increasing<br />
irrigated areas.<br />
• Installation <strong>of</strong> dual head green and surrounds sprinklers.<br />
• More precise control <strong>of</strong> differing irrigation demands.<br />
• Use <strong>of</strong> adjustable arc sprinkler heads.<br />
• Flexibility in irrigation management as part <strong>of</strong> drought<br />
response plan.<br />
• Introduction <strong>of</strong> prospective ET based scheduling.<br />
• Ability to match applied water with plant needs.<br />
Results<br />
These improvements, along with the introduction <strong>of</strong><br />
improved turf species and turf management practices, have<br />
resulted in water savings <strong>of</strong>:<br />
• >40% on greens<br />
• >30% across the entire course<br />
Current water application rates are:<br />
• Bent grass greens 10,000 kL/ha/annum<br />
• Couch fairways and tees 7 – 8,000 kL/ha/annum<br />
• Roughs and carries 0 – 4,000 kL/ha/annum<br />
Also<br />
• 75% reduction in chemical use.<br />
• Superior playing surfaces across the course.<br />
Soil Moisture Monitoring<br />
As significant as these savings and improvements are,<br />
Glenelg Golf Club continues to seek ways <strong>of</strong> further<br />
improving water management practices across the course.<br />
The summer <strong>of</strong> 2006-07 saw the trialling <strong>of</strong> soil moisture<br />
sensors in various locations around the course, aimed at<br />
providing ‘live’ data on soil moisture, temperature and<br />
salinity. This technology was used to monitor the<br />
performance <strong>of</strong> current irrigation practices and to<br />
understand the impacts <strong>of</strong> turf management practices over<br />
the course <strong>of</strong> the summer.<br />
The information was particularly valuable as it supported<br />
the principles <strong>of</strong> the Club’s Quality Turf Plan and Irrigation<br />
Management Plan, both <strong>of</strong> which take into account the<br />
saline nature <strong>of</strong> the Club’s water supply.
It was found that current practices were not resulting in<br />
excessive leaching or movement <strong>of</strong> water beyond the turf<br />
root zone and in fact, the principles applied to irrigation<br />
scheduling for couch areas (fairways, tees) was resulting in<br />
deficit irrigation against ET and still producing high<br />
quality surfaces.<br />
Through the latter part <strong>of</strong> the 2006-07 irrigation season one<br />
site was managed based on the data supplied from the soil<br />
moisture sensors and visual observations <strong>of</strong> turf quality. By<br />
autumn <strong>of</strong> 2007, irrigation management and lack <strong>of</strong> rainfall<br />
resulted in Volumetric Soil Moisture (VSM) being as low as<br />
1-2% without seriously compromising playing surface<br />
quality, although presentation was slightly reduced.<br />
This exercise highlighted the potential to make further<br />
reductions in water consumption.<br />
There is still much to learn about this technology in turf<br />
situations, but it has great potential, including the<br />
following:<br />
• Understanding the fate <strong>of</strong> applied water.<br />
• Understanding the impacts <strong>of</strong> irrigation practices.<br />
• Understanding the impacts <strong>of</strong> turf management practices.<br />
• Reduction in water consumption based on actual data<br />
and plant requirement knowledge.<br />
• Management <strong>of</strong> salinity.<br />
• Monitoring <strong>of</strong> nutrient and pesticide fate.<br />
• Timing <strong>of</strong> turf management practices and applications.<br />
APPENDICES<br />
44<br />
<strong>Water</strong> Supply<br />
Up until 1973 Glenelg Golf Club’s irrigation needs were<br />
supplied exclusively by bore water. The introduction <strong>of</strong> the<br />
automatic irrigation system in 1973 coincided with the<br />
introduction <strong>of</strong> recycled Class B effluent from the Glenelg<br />
Wastewater Treatment Plant, with demand being met for<br />
the next 30 years through a “50/50” blend <strong>of</strong> both bore and<br />
effluent water.<br />
Both water sources were <strong>of</strong> similar salinity (1000-1300ppm),<br />
with the effluent containing nutrient loading that was far<br />
from balanced with turf needs and had to be factored into<br />
fertility programming.<br />
In 2005, Glenelg Golf Club was faced with a choice for<br />
securing a longer term higher quality water supply due to<br />
price increases in the supply <strong>of</strong> effluent. The Club was very<br />
mindful <strong>of</strong> its obligation to have a positive impact on the<br />
wider community as well as to its members.<br />
Detailed investigations led to the decision to invest in a<br />
$2 million Aquifer Storage and Recharge project, which will<br />
see the diversion <strong>of</strong> stormwater from Brownhill Creek into<br />
newly constructed wetlands on the course. This stormwater,<br />
which would otherwise flow untreated into the Patawolonga<br />
and Gulf St Vincent, will be pumped into the wetlands<br />
where the water quality will be improved naturally by the<br />
plants before it is injected into the underlying aquifer.<br />
The resulting superior water quality (projected to be<br />
approximately 600ppm) will potentially result in further<br />
water savings due to improved reactions within the soil<br />
once applied.<br />
Summary<br />
Glenelg Golf Club is committed to sustainable management<br />
<strong>of</strong> water, and has invested heavily to develop and monitor<br />
efficiency improvements.<br />
This case demonstrates this commitment, which is<br />
documented throughout the Club’s Environmental<br />
Management System and Quality Turf Plan.<br />
FURTHER INFORMATION:<br />
Daryl Sellar, Consulting Superintendent<br />
Turfwise Consulting<br />
Glenelg Golf Course
GLOS<strong>SA</strong>RY OF TERMS & ABBREVIATIONS<br />
APPENDICES<br />
APPENDIX No 5 – GLOS<strong>SA</strong>RY<br />
Term Abbreviation Description<br />
base irrigation requirement BIr The amount water to be applied by irrigation to a given area <strong>of</strong> turf to produce the desired quality outcome<br />
using long term average climatic data.<br />
Bureau <strong>of</strong> Meteorology BoM Federal Government organisation responsible for monitoring and reporting on climate.<br />
computerised irrigation CIMS Centralise irrigation control systems that manage a network <strong>of</strong> satellite controllers<br />
management system through a centralised computer.<br />
distribution uniformity DU The average water applied in the 25% <strong>of</strong> the area receiving the least amount <strong>of</strong> water,<br />
regardless <strong>of</strong> location within the pattern, divided by the average water applied over the total area.<br />
application efficiency Ea A factor representing the inherent irrigation system inefficiencies in applying water to the site.<br />
evapotranspiration ET The combination <strong>of</strong> water that is lost to the soil by a combination <strong>of</strong> evaporation from the soil surface<br />
and transpiration by the plant. A measure <strong>of</strong> plant water requirement.<br />
crop evapotranspiration ETc TheETrate<strong>of</strong>aspecificcrop.<br />
reference ETo TheETrate<strong>of</strong>areferencecrop<strong>of</strong>healthygrass,completelycoveringthegroundtoauniformheight<strong>of</strong><br />
evapotranspiration 75 - 125 mm, evapotranspiration and having an adequate supply <strong>of</strong> water.<br />
irrigation depth I Thedepth<strong>of</strong>waterinmmappliedbytheirrigationsystem.<br />
irrigation application rate Iar The rate at which the irrigation system applies water to the site expressed as mm per hour.<br />
irrigation efficiency index Ii A measure <strong>of</strong> performance <strong>of</strong> irrigation system application which compares the depth <strong>of</strong> water applied ( I )<br />
to the estimated depth <strong>of</strong> water required ( Ir ) for a given period.<br />
net irrigation requirement In The water requirement <strong>of</strong> the plant (ETc) less effective rainfall for the period.<br />
irrigated public open space IPOS <strong>Irrigated</strong> open space which is managed by or used by the general community.<br />
Usually managed by the public sector but also includes private schools and golf courses.<br />
irrigation requirement Ir The amount water to be applied by irrigation to a given area <strong>of</strong> turf to produce the desired quality outcome<br />
for a given period using real time climatic data.<br />
irrigation run time Irt The length <strong>of</strong> time the irrigation system must operate to apply the optimum irrigation event (OIE).<br />
crop co-efficient Kc An agronomic factor that can be applied to Reference Evapotranspiration (Eto) value to convert<br />
ETo to an evapotranspiration value for a specified crop (ETc).<br />
crop stress factor Ks A factor that is applied to the reference evapotranspiration (Eto) value and the crop co-efficient (Kc)<br />
to adjust the crop evapotranspiration (ETc) value in consideration <strong>of</strong> the plant quality required.<br />
maximum allowable MAD The amount <strong>of</strong> moisture that is allowed to be removed from the soil before an irrigation event occurs<br />
depletion to replenish the soil water level to field capacity. The MAD is a factor representing the percentage<br />
<strong>of</strong> water removed from the TAW.<br />
optimum irrigation event OIE The amount <strong>of</strong> water required to refill the root zone <strong>of</strong> the soil to Field Capacity.<br />
rainfall P rainorprecipitationthatoccursnaturally.<br />
plant available water PAW The amount <strong>of</strong> water held in the root zone <strong>of</strong> the soil between field capacity and the maximum<br />
allowable depletion (MAD).<br />
effective rainfall Pe The amount <strong>of</strong> rainfall that is held in the root zone <strong>of</strong> the soil and is available to the plant after a rain event.<br />
effective rainfall factor Pf A factor representing the percentage <strong>of</strong> rainfall that is deemed to be effective.<br />
45
GLOS<strong>SA</strong>RY OF TERMS & ABBREVIATIONS<br />
Term Abbreviation Description<br />
APPENDICES<br />
total available water TAW Theamount<strong>of</strong>waterheldintherootzone<strong>of</strong>thesoilbetweenfieldcapacityandwiltingpoint.<br />
irrigation interval Ti The number <strong>of</strong> days between irrigation events.<br />
turf quality visual standard TQVS A visual indicator <strong>of</strong> turf quality based on the functional objective and 'Fit for Purpose'<br />
requirement <strong>of</strong> the turf grass surface.<br />
water holding capacity WHC The amount <strong>of</strong> water that be held within the pore spaces <strong>of</strong> the soil.<br />
root zone depth Zr The depth which the plants roots grow into the soil.<br />
field capacity When a soil has been thoroughly wetted, then allowed to drain by gravity for a specified period <strong>of</strong> time,<br />
(usually one to two days depending on soil structure) until there is no further water loss.<br />
wilting point The point at which the plant can no longer extract moisture for the soil.<br />
46
Image copyright to the Australian Government, Department <strong>of</strong> the Environment and <strong>Water</strong> Resources