t - Sabanci University Research Database
t - Sabanci University Research Database
t - Sabanci University Research Database

Create successful ePaper yourself
Turn your PDF publications into a flip-book with our unique Google optimized e-Paper software.
Feed Cutting Force - N<br />
Tangential Cutting Force - N<br />
Feed Cutting Force - N<br />
Tangential Cutting Force - N<br />
300<br />
250<br />
200<br />
150<br />
100<br />
150m/min-exp<br />
50<br />
0<br />
225m/min-exp<br />
150m/min-model<br />
225m/min-model<br />
0.05 0.1 0.15 0.2 0.25 0.3<br />
1400<br />
1200<br />
1000<br />
800<br />
600<br />
400<br />
200<br />
400<br />
350<br />
300<br />
250<br />
200<br />
150<br />
100<br />
50<br />
feed rate - mm/rev<br />
(a)<br />
150m/min-exp<br />
225m/min-exp<br />
150m/min-model<br />
225m/min-model<br />
0<br />
0.05 0.1 0.15 0.2 0.25 0.3<br />
feed rate - mm/rev<br />
(b)<br />
300m/min-exp<br />
400m/min-exp<br />
300m/min-model<br />
400m/min-model<br />
0<br />
0.05 0.1 0.15 0.2 0.25 0.3<br />
1200<br />
1000<br />
800<br />
600<br />
400<br />
200<br />
feed rate - mm/rev<br />
(c)<br />
0<br />
0.05 0.1 0.15 0.2 0.25 0.3<br />
feed rate - mm/rev<br />
300m/min-exp<br />
400m/min-exp<br />
300m/min-model<br />
400m/min-model<br />
(d)<br />
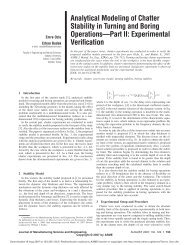
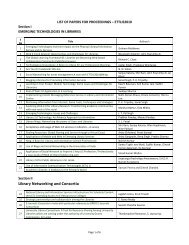
Figure 5: Feed cutting (a, c), and tangential cutting<br />
force (b, d) comparisons for AISI 4340.<br />
In order to select the best parameter set we<br />
propose to apply a non-linear regression fitting<br />
procedure with the experimental data set using<br />
the shear stress at the shear plane. Due to the<br />
high sensitivity of the non-linear regression<br />
analysis to the initial and the tolerance values<br />
used, the number of parameters to be determined<br />
need to be reduced. If all the parameters<br />
of the Johnson Cook model are to be determined,<br />
the final values may turn out to be<br />
impractical. For instance, B can be found to be<br />
a negative number which is impossible. In order<br />
to solve this problem, we set the parameters B,<br />
n, m and ν as in Table 1, and solve for the parameter<br />
A which minimizes the error between<br />
the predicted and measured shear stresses.<br />
The results are shown in Table 1 which are<br />
called as set 1, and are used for all the predictions<br />
in Section 3. On the other hand, in order<br />
to compare the fitted parameters and the parameters<br />
that are found in the literature (see<br />
Table 2) a comparison for the cutting forces are<br />
conducted using these sets. The results can be<br />
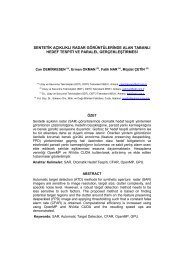
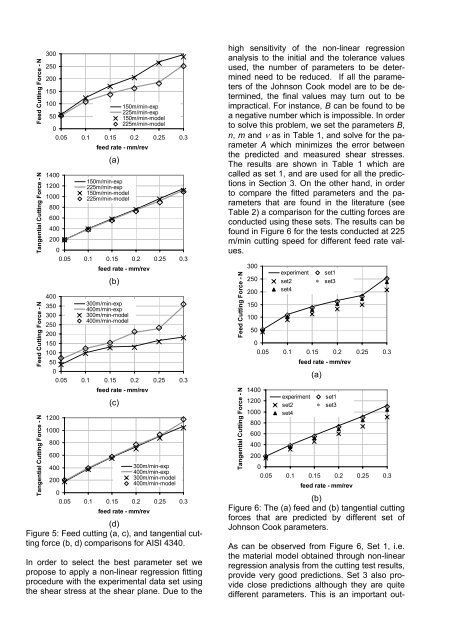
found in Figure 6 for the tests conducted at 225<br />
m/min cutting speed for different feed rate values.<br />
Feed Cutting Force - N<br />
Tangential Cutting Force - N<br />
300<br />
250<br />
200<br />
150<br />
100<br />
50<br />
experiment set1<br />
set2 set3<br />
set4<br />
0<br />
0.05 0.1 0.15 0.2 0.25 0.3<br />
1400<br />
1200<br />
1000<br />
800<br />
600<br />
400<br />
200<br />
feed rate - mm/rev<br />
(a)<br />
experiment set1<br />
set2 set3<br />
set4<br />
0<br />
0.05 0.1 0.15 0.2 0.25 0.3<br />
feed rate - mm/rev<br />
(b)<br />
Figure 6: The (a) feed and (b) tangential cutting<br />
forces that are predicted by different set of<br />
Johnson Cook parameters.<br />
As can be observed from Figure 6, Set 1, i.e.<br />
the material model obtained through non-linear<br />
regression analysis from the cutting test results,<br />
provide very good predictions. Set 3 also provide<br />
close predictions although they are quite<br />
different parameters. This is an important out-