

Gender Inequality and Economic Development Fertility Education and Norms
kleven-landais_economica_jan2017
kleven-landais_economica_jan2017

You also want an ePaper? Increase the reach of your titles
YUMPU automatically turns print PDFs into web optimized ePapers that Google loves.
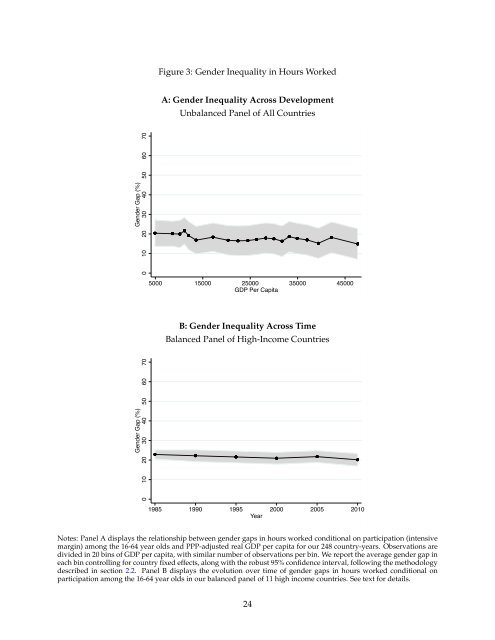
Figure 3: <strong>Gender</strong> <strong>Inequality</strong> in Hours Worked<br />
A: <strong>Gender</strong> <strong>Inequality</strong> Across <strong>Development</strong><br />
Unbalanced Panel of All Countries<br />
<strong>Gender</strong> Gap (%)<br />
0 10 20 30 40 50 60 70<br />
5000 15000 25000 35000 45000<br />
GDP Per Capita<br />
B: <strong>Gender</strong> <strong>Inequality</strong> Across Time<br />
Balanced Panel of High-Income Countries<br />
<strong>Gender</strong> Gap (%)<br />
0 10 20 30 40 50 60 70<br />
1985 1990 1995 2000 2005 2010<br />
Year<br />
Notes: Panel A displays the relationship between gender gaps in hours worked conditional on participation (intensive<br />
margin) among the 16-64 year olds <strong>and</strong> PPP-adjusted real GDP per capita for our 248 country-years. Observations are<br />
divided in 20 bins of GDP per capita, with similar number of observations per bin. We report the average gender gap in<br />
each bin controlling for country fixed effects, along with the robust 95% confidence interval, following the methodology<br />
described in section 2.2. Panel B displays the evolution over time of gender gaps in hours worked conditional on<br />
participation among the 16-64 year olds in our balanced panel of 11 high income countries. See text for details.<br />
24