

Gender Inequality and Economic Development Fertility Education and Norms
kleven-landais_economica_jan2017
kleven-landais_economica_jan2017

You also want an ePaper? Increase the reach of your titles
YUMPU automatically turns print PDFs into web optimized ePapers that Google loves.
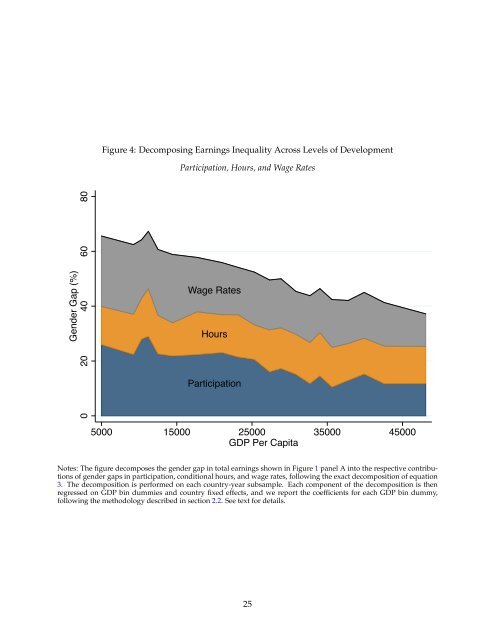
Figure 4: Decomposing Earnings <strong>Inequality</strong> Across Levels of <strong>Development</strong><br />
Participation, Hours, <strong>and</strong> Wage Rates<br />
<strong>Gender</strong> Gap (%)<br />
0 20 40 60 80<br />
Wage Rates<br />
Hours<br />
Participation<br />
5000 15000 25000 35000 45000<br />
GDP Per Capita<br />
Notes: The figure decomposes the gender gap in total earnings shown in Figure 1 panel A into the respective contributions<br />
of gender gaps in participation, conditional hours, <strong>and</strong> wage rates, following the exact decomposition of equation<br />
3. The decomposition is performed on each country-year subsample. Each component of the decomposition is then<br />
regressed on GDP bin dummies <strong>and</strong> country fixed effects, <strong>and</strong> we report the coefficients for each GDP bin dummy,<br />
following the methodology described in section 2.2. See text for details.<br />
25