

Gender Inequality and Economic Development Fertility Education and Norms
kleven-landais_economica_jan2017
kleven-landais_economica_jan2017

Create successful ePaper yourself
Turn your PDF publications into a flip-book with our unique Google optimized e-Paper software.
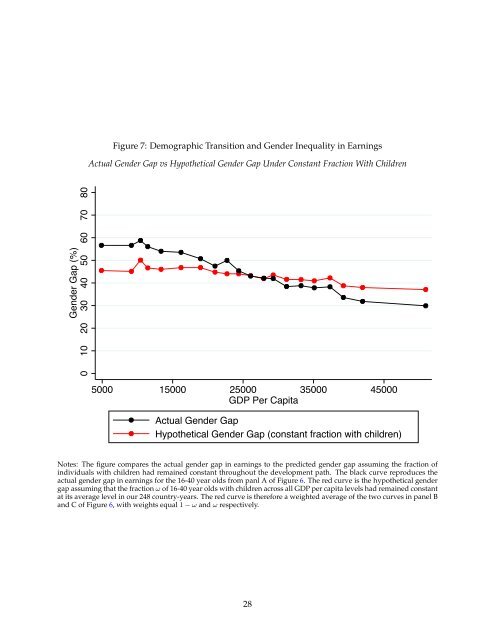
Figure 7: Demographic Transition <strong>and</strong> <strong>Gender</strong> <strong>Inequality</strong> in Earnings<br />
Actual <strong>Gender</strong> Gap vs Hypothetical <strong>Gender</strong> Gap Under Constant Fraction With Children<br />
<strong>Gender</strong> Gap (%)<br />
0 10 20 30 40 50 60 70 80<br />
5000 15000 25000 35000 45000<br />
GDP Per Capita<br />
Actual <strong>Gender</strong> Gap<br />
Hypothetical <strong>Gender</strong> Gap (constant fraction with children)<br />
Notes: The figure compares the actual gender gap in earnings to the predicted gender gap assuming the fraction of<br />
individuals with children had remained constant throughout the development path. The black curve reproduces the<br />
actual gender gap in earnings for the 16-40 year olds from panl A of Figure 6. The red curve is the hypothetical gender<br />
gap assuming that the fraction ! of 16-40 year olds with children across all GDP per capita levels had remained constant<br />
at its average level in our 248 country-years. The red curve is therefore a weighted average of the two curves in panel B<br />
<strong>and</strong> C of Figure 6, with weights equal 1 ! <strong>and</strong> ! respectively.<br />
28