

Gender Inequality and Economic Development Fertility Education and Norms
kleven-landais_economica_jan2017
kleven-landais_economica_jan2017

Create successful ePaper yourself
Turn your PDF publications into a flip-book with our unique Google optimized e-Paper software.
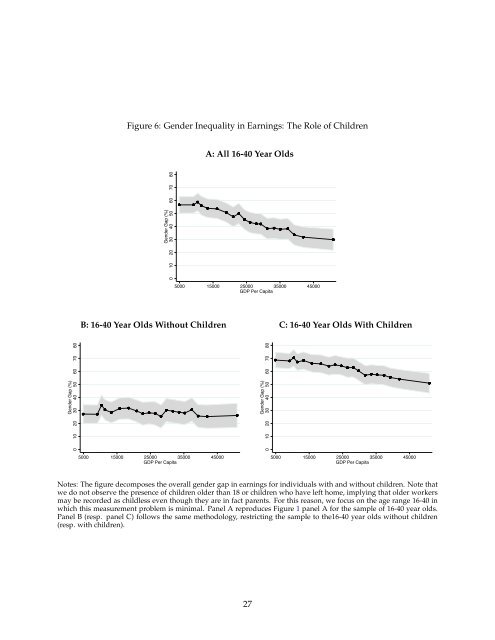
Figure 6: <strong>Gender</strong> <strong>Inequality</strong> in Earnings: The Role of Children<br />
A: All 16-40 Year Olds<br />
<strong>Gender</strong> Gap (%)<br />
0 10 20 30 40 50 60 70 80<br />
5000 15000 25000 35000 45000<br />
GDP Per Capita<br />
B: 16-40 Year Olds Without Children C: 16-40 Year Olds With Children<br />
<strong>Gender</strong> Gap (%)<br />
0 10 20 30 40 50 60 70 80<br />
<strong>Gender</strong> Gap (%)<br />
0 10 20 30 40 50 60 70 80<br />
5000 15000 25000 35000 45000<br />
GDP Per Capita<br />
5000 15000 25000 35000 45000<br />
GDP Per Capita<br />
Notes: The figure decomposes the overall gender gap in earnings for individuals with <strong>and</strong> without children. Note that<br />
we do not observe the presence of children older than 18 or children who have left home, implying that older workers<br />
may be recorded as childless even though they are in fact parents. For this reason, we focus on the age range 16-40 in<br />
which this measurement problem is minimal. Panel A reproduces Figure 1 panel A for the sample of 16-40 year olds.<br />
Panel B (resp. panel C) follows the same methodology, restricting the sample to the16-40 year olds without children<br />
(resp. with children).<br />
27