

Download Complete Issue - Academic Journals
Download Complete Issue - Academic Journals
Download Complete Issue - Academic Journals

You also want an ePaper? Increase the reach of your titles
YUMPU automatically turns print PDFs into web optimized ePapers that Google loves.
2604 Afr. J. Agric. Res.<br />
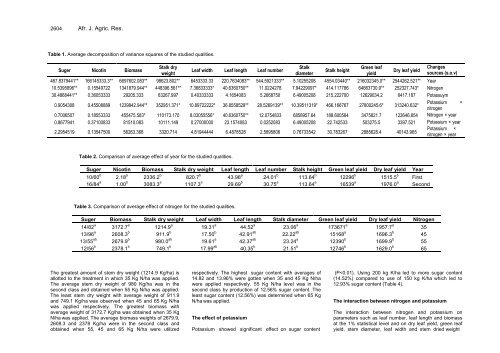
Table 1. Average decomposition of variance squares of the studied qualities.<br />
Suger Nicotin Biomass<br />
Stalk dry<br />
weight<br />
Leaf width Leaf length Leaf number<br />
Stalk<br />
diameter<br />
Stalk height<br />
Green leaf<br />
yield<br />
Dry leaf yield<br />
Changes<br />
sources (s.o.v)<br />
467.8379441** 166145333.3** 6697602.083** 98623.802** 6453333.33 220.7634083** 544.5921333** 5.10255208 4554.03440** 216032345.0** 2544262.521** Year<br />
10.5395896** 0.15549722 1341879.944** 448396.561** 7.36833333* 40.6360750** 11.0224278 7.94229097* 414.117786 64663730.9** 252327.743* Nitrogen<br />
30.4868441** 0.36053333 29205.333 63267.997 0.40333333 4.1654083 5.2668750 6.49005208 215.222700 12629034.2 6417.187 Potassuym<br />
0.9054308 0.45508889 1239942.944** 352951.371* 10.89722222* 36.8558528** 28.5269139** 10.39511319* 466.166767 27800245.6* 313240.632*<br />
Potassium<br />
nitrogen<br />
×<br />
0.7006507 0.18553333 455475.583* 110173.170 8.03055556* 40.6360750** 12.0754833 6858957.64 188.600564 3475821.7 123646.854 Nitrogen × year<br />
0.8677941 0.37100833 81510.083 10111.149 0.27000000 23.1574083 0.0252083 6.49005208 22.742533 503275.5 3397.521 Potassium × year<br />
2.2954519 0.13547500 56263.368 3320.714 4.81944444 6.4878528 2.5895806 0.76733542 30.783267 2885628.4 40143.965<br />
Potassium ×<br />
nitrogen × year<br />
Table 2. Comparison of average effect of year for the studied qualities.<br />
Suger Nicotin Biomass Stalk dry weight Leaf length Leaf number Stalk height Green leaf yield Dry leaf yield Year<br />
10/60 b 2.18 a 2336.2 b 820.7 b 43.98 a 24.01 b 113.64 b 12296 b 1515.5 b First<br />
16/84 a 1.00 b 3083.3 a 1107.3 a 29.69 b 30.75 a 113.64 a 16539 a 1976.0 a Second<br />
Table 3. Comparison of average effect of nitrogen for the studied qualities.<br />
Suger Biomass Stalk dry weight Leaf width Leaf length Stalk diameter Green leaf yield Dry leaf yield Nitrogen<br />
14/82 a 3172.7 a 1214.9 a 19.31 a 44.52 a 23.06 a 173671 a 1957.7 a 35<br />
13/96 a 2608.3 b 911.9 b 17.50 b 42.91 ab 22.22 ab 15168 a 1696.3 b 45<br />
13/55 ab 2679.9 b 980.0 ab 19.61 a 42.37 ab 23.24 a 12390 b 1699.9 b 55<br />
12/56 b 2378.1 b 749.1 b 17.99 ab 40.35 b 21.51 b 12746 b 1629.0 b 65<br />
The greatest amount of stem dry weight (1214.9 Kg/ha) is<br />
allotted to the treatment in which 35 Kg N/ha was applied.<br />
The average stem dry weight of 980 Kg/ha was in the<br />
second class and obtained when 55 Kg N/ha was applied.<br />
The least stem dry weight with average weight of 911.9<br />
and 749.1 Kg/ha was observed when 45 and 65 Kg N/ha<br />
was applied respectively. The greatest biomass with<br />
average weight of 3172.7 Kg/ha was obtained when 35 Kg<br />
N/ha was applied. The average biomass weights of 2679.9,<br />
2608.3 and 2378 Kg/ha were in the second class and<br />
obtained when 55, 45 and 65 Kg N/ha were utilized<br />
respectively. The highest sugar content with averages of<br />
14.82 and 13.96% were gotten when 35 and 45 Kg N/ha<br />
were applied respectively. 55 Kg N/ha level was in the<br />
second class by production of 12.56% sugar content. The<br />
least sugar content (12.56%) was determined when 65 Kg<br />
N/ha was applied.<br />
The effect of potassium<br />
Potassium showed significant effect on sugar content<br />
(P


