Human Development Report 2016
6Tyccfrzw
6Tyccfrzw

Create successful ePaper yourself
Turn your PDF publications into a flip-book with our unique Google optimized e-Paper software.
<strong>Human</strong> <strong>Development</strong><br />
<strong>Report</strong> <strong>2016</strong><br />
<strong>Human</strong> <strong>Development</strong> for Everyone<br />
Empowered lives.<br />
Resilient nations.
The <strong>2016</strong> <strong>Human</strong> <strong>Development</strong> <strong>Report</strong> is the latest in the series of global <strong>Human</strong> <strong>Development</strong> <strong>Report</strong>s published<br />
by the United Nations <strong>Development</strong> Programme (UNDP) since 1990 as independent, analytically and empirically<br />
grounded discussions of major development issues, trends and policies.<br />
Additional resources related to the <strong>2016</strong> <strong>Human</strong> <strong>Development</strong> <strong>Report</strong> can be found online at http://hdr.undp.org,<br />
including digital versions of the <strong>Report</strong> and translations of the overview in more than 20 languages, an interactive<br />
web version of the <strong>Report</strong>, a set of background papers and think pieces commissioned for the <strong>Report</strong>, interactive<br />
maps and databases of human development indicators, full explanations of the sources and methodologies used in<br />
the <strong>Report</strong>’s composite indices, country profiles and other background materials as well as previous global, regional<br />
and national <strong>Human</strong> <strong>Development</strong> <strong>Report</strong>s. The <strong>2016</strong> <strong>Report</strong> and the best of <strong>Human</strong> <strong>Development</strong> <strong>Report</strong> Office<br />
content, including publications, data, HDI rankings and related information can also be accessed on Apple iOS and<br />
<strong>Human</strong> <strong>Development</strong><br />
Android <strong>Report</strong> smartphones <strong>2016</strong> via a new and easy to use mobile app.<br />
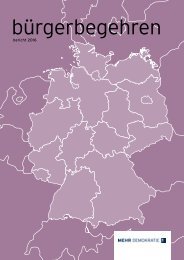
<strong>Human</strong> <strong>Development</strong> for Everyone<br />
The cover reflects the basic message that human development is for<br />
everyone—in the human development journey no one can be left out.<br />
Using an abstract approach, the cover conveys three fundamental<br />
points. First, the upward moving waves in blue and whites represent<br />
the road ahead that humanity has to cover to ensure universal human<br />
development. The different curvature of the waves alerts us that some<br />
paths will be more difficult and sailing along those paths will not be easy,<br />
but multiple options are open. Second, in this journey some people will<br />
be ahead, but some will be lagging behind. Those lagging behind will<br />
need helping hands from those who are ahead. The gestures of the two<br />
hands reflect that spirit of human solidarity. Third, the two colours—<br />
green and blue—and the hands at the top—convey that universal human<br />
development requires a balance among planet, peace and people.<br />
Copyright @ <strong>2016</strong><br />
By the United Nations <strong>Development</strong> Programme<br />
1 UN Plaza, New York, NY 10017 USA<br />
All rights reserved. No part of this publication may be reproduced, stored in a retrieval system or transmitted, in any form or by means, electronic,<br />
mechanical, photocopying, recording or otherwise, without prior permission.<br />
Sales no.: E.16.III.B.1<br />
ISBN: 978-92-1-126413-5<br />
eISBN: 978-92-1-060036-1<br />
ISSN: 0969-4501<br />
A catalogue record for this book is available from the British Library and Library of Congress<br />
Printed in Canada, by the Lowe-Martin Group, on Forest Stewardship Council certified and elemental chlorine-free papers. Printed using vegetable-based<br />
ink.<br />
Editing and production: Communications <strong>Development</strong> Incorporated, Washington DC, USA<br />
Information design and data visualization: Gerry Quinn and <strong>Human</strong> <strong>Development</strong> <strong>Report</strong> Office<br />
Cover design: Phoenix Design Aid<br />
For a list of any errors and omissions found subsequent to printing, please visit our website at http://hdr.undp.org
<strong>Human</strong> <strong>Development</strong> <strong>Report</strong> <strong>2016</strong><br />
<strong>Human</strong> <strong>Development</strong> for Everyone<br />
Empowered lives.<br />
Resilient nations.<br />
Published for the<br />
United Nations<br />
<strong>Development</strong><br />
Programme<br />
(UNDP)
<strong>Human</strong> <strong>Development</strong> <strong>Report</strong> <strong>2016</strong> Team<br />
Director and lead author<br />
Selim Jahan<br />
Deputy director<br />
Eva Jespersen<br />
Research and statistics<br />
Shantanu Mukherjee (Team Leader). Milorad Kovacevic (Chief Statistician), Botagoz Abdreyeva, Astra Bonini, Cecilia<br />
Calderon, Christelle Cazabat, Yu-Chieh Hsu, Christina Lengfelder, Patrizia Luongo, Tanni Mukhopadhyay, Shivani Nayyar<br />
and Heriberto Tapia<br />
Production and web<br />
Admir Jahic and Dharshani Seneviratne<br />
Outreach and communications<br />
Jon Hall, Sasa Lucic, Jennifer O’Neil Oldfield and Anna Ortubia<br />
Operations and administration<br />
Sarantuya Mend (Operations Manager), Fe Juarez Shanahan and May Wint Than<br />
ii | HUMAN DEVELOPMENT REPORT <strong>2016</strong>
<strong>Human</strong> <strong>Development</strong><br />
<strong>Report</strong> <strong>2016</strong><br />
<strong>Human</strong> <strong>Development</strong> for Everyone<br />
Foreword<br />
<strong>Human</strong> development is all about human freedoms:<br />
freedom to realize the full potential of<br />
every human life, not just of a few, nor of most,<br />
but of all lives in every corner of the world—now<br />
and in the future. Such universalism gives the<br />
human development approach its uniqueness.<br />
However, the principle of universalism is<br />
one thing; translating it into practice is another.<br />
Over the past quarter-century there has<br />
been impressive progress on many fronts in human<br />
development, with people living longer,<br />
more people rising out of extreme poverty and<br />
fewer people being malnourished. <strong>Human</strong><br />
development has enriched human lives—but<br />
unfortunately not all to the same extent, and<br />
even worse, not every life.<br />
It is thus not by chance but by choice that<br />
world leaders in 2015 committed to a development<br />
journey that leaves no one out—a central<br />
premise of the 2030 Agenda. Mirroring that<br />
universal aspiration, it is timely that the <strong>2016</strong><br />
<strong>Human</strong> <strong>Development</strong> <strong>Report</strong> is devoted to the<br />
theme of human development for everyone.<br />
The <strong>Report</strong> begins by using a broad brush<br />
to paint a picture of the challenges the world<br />
faces and the hopes humanity has for a better<br />
future. Some challenges are lingering (deprivations),<br />
some are deepening (inequalities)<br />
and some are emerging (violent extremism),<br />
but most are mutually reinforcing. Whatever<br />
their nature or reach, these challenges have an<br />
impact on people’s well-being in both present<br />
and future generations.<br />
At the same time, however, the <strong>Report</strong> reminds<br />
us what humanity has achieved over the<br />
past 25 years and gives us hope that further advances<br />
are possible. We can build on what we<br />
have achieved, we can explore new possibilities<br />
to overcome challenges and we can attain what<br />
once seemed unattainable. Hopes are within<br />
our reach to realize.<br />
Given that broader context, the <strong>Report</strong><br />
then raises two fundamental questions: who<br />
has been left out in progress in human development<br />
and how and why did that happen.<br />
It emphasizes that poor, marginalized and<br />
vulnerable groups—including ethnic minorities,<br />
indigenous peoples, refugees and<br />
migrants—are being left furthest behind. The<br />
barriers to universalism include, among others,<br />
deprivations and inequalities, discrimination<br />
and exclusion, social norms and values, and<br />
prejudice and intolerance. The <strong>Report</strong> also<br />
clearly identifies the mutually reinforcing<br />
gender barriers that deny many women the<br />
opportunities and empowerment necessary to<br />
realize the full potential of their lives.<br />
To ensure human development for everyone,<br />
the <strong>Report</strong> asserts that merely identifying the<br />
nature of and the reasons for the deprivation<br />
of those left out is not enough. Some aspects<br />
of the human development analytical framework<br />
and assessment perspectives must be<br />
brought to the fore to address issues that<br />
prevent universal human development. For<br />
example, human rights and human security,<br />
voice and autonomy, collective capabilities<br />
and the interdependence of choices are key for<br />
the human development of those currently left<br />
out. Similarly, quality of human development<br />
outcomes and not only quantity, going beyond<br />
the averages and disaggregating statistics<br />
(particularly gender-disaggregation)—must<br />
be considered to assess and ensure that human<br />
development benefits reach everyone.<br />
The <strong>Report</strong> forcefully argues that caring for<br />
those left out requires a four-pronged policy<br />
strategy at the national level: reaching those<br />
left out using universal policies (for example,<br />
inclusive growth, not mere growth), pursuing<br />
measures for groups with special needs (for<br />
example, persons with disabilities), making<br />
human development resilient and empowering<br />
those left out.<br />
The <strong>Report</strong> rightly recognizes that national<br />
policies need to be complemented by actions<br />
at the global level. It addresses issues related to<br />
the mandate, governance structures and work<br />
of global institutions. It draws our attention<br />
to the fact that even though we have grown<br />
accustomed to heated debates winding up in<br />
gridlock at the national, regional and global<br />
levels, underneath the rumble of all that,<br />
consensus has been emerging around many<br />
global challenges to ensure a sustainable world<br />
for future generations. The landmark Paris<br />
Foreword | iii
Agreement on climate change, which recently<br />
came into force, bears testimony to this. What<br />
was once deemed unthinkable must now prove<br />
to be unstoppable.<br />
The <strong>Report</strong> complements the 2030 Agenda<br />
by sharing the principle of universalism and by<br />
concentrating on such fundamental areas as<br />
eliminating extreme poverty, ending hunger<br />
and highlighting the core issue of sustainability.<br />
The human development approach and<br />
the 2030 Agenda can be mutually reinforcing<br />
by contributing to the narrative of each other,<br />
by exploring how human development and<br />
Sustainable <strong>Development</strong> Goal indicators can<br />
complement each other and by being a forceful<br />
advocacy platform for each other.<br />
We have every reason to hope that transformation<br />
in human development is possible.<br />
What seem to be challenges today can be<br />
overcome tomorrow. The world has fewer than<br />
15 years to achieve its bold agenda of leaving<br />
no one out. Closing the human development<br />
gap is critical, as is ensuring the same, or even<br />
better, opportunities for future generations.<br />
<strong>Human</strong> development has to be sustained and<br />
sustainable and has to enrich every human life<br />
so that we have a world where all people can<br />
enjoy peace and prosperity.<br />
Helen Clark<br />
Administrator<br />
United Nations <strong>Development</strong> Programme<br />
iv | HUMAN DEVELOPMENT REPORT <strong>2016</strong>
<strong>Human</strong> <strong>Development</strong><br />
<strong>Report</strong> <strong>2016</strong><br />
<strong>Human</strong> <strong>Development</strong> for Everyone<br />
Acknowledgements<br />
The <strong>2016</strong> <strong>Human</strong> <strong>Development</strong> <strong>Report</strong> is the<br />
product of the <strong>Human</strong> <strong>Development</strong> <strong>Report</strong><br />
Office (HDRO) at the United Nations<br />
<strong>Development</strong> Programme (UNDP).<br />
The findings, analysis and policy recommendations<br />
of the <strong>Report</strong> are those of<br />
HDRO alone and cannot be attributed to<br />
UNDP or to its Executive Board. The UN<br />
General Assembly has officially recognized<br />
the <strong>Human</strong> <strong>Development</strong> <strong>Report</strong> as “an<br />
independent intellectual exercise” that has<br />
become “an important tool for raising awareness<br />
about human development around the<br />
world.”<br />
We owe a lot to Nobel Laureate Professor<br />
Amartya Sen for his continued inspirational<br />
intellectual advice, guidance and thoughts.<br />
HDRO is also privileged to receive a series<br />
of contributions by eminent people and<br />
organizations. Particular appreciation is due<br />
for the signed contributions from Professor<br />
Dan Ariely ( James B. Duke Professor of<br />
Psychology and Behavioral Economics at<br />
Duke University), Carol Bellamy (chair of the<br />
Governing Board of the Global Community<br />
Engagement and Resilience Fund and former<br />
executive director of the United Nations<br />
Children’s Fund), Mirna Cunningham Kain<br />
(Nicaraguan Miskitu, indigenous peoples<br />
rights activist and former chairperson of<br />
the United Nations Permanent Forum on<br />
Indigenous Issues), Olafur Eliasson (artist and<br />
founder of Little Sun), Melinda Gates (cochair<br />
of the Bill & Melinda Gates Foundation),<br />
Dr. Angela Merkel (chancellor of the Federal<br />
Republic of Germany) and Juan Manuel<br />
Santos (president of Colombia and <strong>2016</strong><br />
Nobel Peace Prize Laureate). We are especially<br />
thankful to Martin Santiago and the UNDP<br />
Country Office in Colombia for facilitating<br />
President Santos’s contribution.<br />
Appreciation is also extended for contributions<br />
from the following authors: Paul Anand,<br />
Ayesha Banu, Flavio Comim, Giovanni<br />
Andrea Cornia, Juliana Martinez Franzoni,<br />
Stephany Griffith-Jones, Irene Khan, Peter<br />
Lunenborg, Manuel Montes, Siddiqur<br />
Osmani, Enrique Peruzzotti, Robert Pollin,<br />
Diego Sanchez-Ancochea, Anuradha Seth,<br />
Frances Stewart and Florencia Torche.<br />
We are thankful for think pieces contributed<br />
by Oscar A. Gomez, Sachiko G. Kamidohzono<br />
and Ako Muto of the Japan International<br />
Cooperation Agency Research Institute; Mara<br />
Simane of the Cross Sectoral Coordination<br />
Centre of the Latvia Cabinet of Ministers; and<br />
HOPE XXL, a civil society organization. Two<br />
UNDP Global Policy Centres—one in Seoul<br />
on global development partnerships and one<br />
in Nairobi on resilient ecosystems and desertification—contributed<br />
think pieces to the<br />
<strong>Report</strong>, and our thanks go to Balazs Hovarth<br />
and Anne-Gertraude Juepner.<br />
Invaluable insights and guidance were received<br />
from a distinguished Advisory Panel:<br />
Olu Ajakaiye, Magdalena Sepúlveda Carmona,<br />
Giovanni Andrea Cornia, Diane Elson, Heba<br />
Handoussa, Richard Jolly, Ravi Kanbur,<br />
Yasushi Katsuma, Ella Libanova, Justin Yifu<br />
Lin, Leticia Merino, Solita Monsod, Onalenna<br />
Doo Selolwane and Frances Stewart.<br />
For providing expert advice on methodologies<br />
and data choices related to the calculation<br />
of the <strong>Report</strong>’s human development indices,<br />
we would also like to thank the <strong>Report</strong>’s<br />
Statistical Advisory Panel members: Lisa Grace<br />
S. Bersales, Albina Chuwa, Koen Decancq,<br />
Enrico Giovannini, Pascual Gerstenfeld, Janet<br />
Gornick, Gerald Haberkorn, Haishan Fu,<br />
Robert Kirkpatrick, Jaya Krishnakumar and<br />
Michaela Saisana.<br />
The <strong>Report</strong>’s composite indices and other<br />
statistical resources rely on the expertise of the<br />
leading international data providers in their<br />
specialized fields, and we express our gratitude<br />
for their continued collegial collaboration with<br />
the HDRO. To ensure accuracy and clarity,<br />
the statistical analysis has benefited from discussions<br />
of statistical issues with Gisela Robles<br />
Aguilar, Sabina Alkire, Kenneth Hartggen and<br />
Nicolas Fasel and his team from the Office of<br />
the United Nations High Commissioner for<br />
<strong>Human</strong> Rights.<br />
The consultations held during the preparation<br />
of the <strong>Report</strong> relied on the generous<br />
support of many institutions and individuals<br />
Acknowledgements | v
who are too numerous to mention here (participants<br />
and partners are listed at http://<br />
hdr.undp.org/<strong>2016</strong>-report/consultations).<br />
Formal multistakeholder consultations were<br />
held between April and September <strong>2016</strong> in<br />
Geneva, Paris, Istanbul, Nairobi, Singapore<br />
and Panama. We are grateful to the UNDP<br />
Office in Geneva, the Organisation for<br />
Economic Co-operation and <strong>Development</strong><br />
and UNDP regional service centres and global<br />
policy centres for organizing these consultations<br />
and in particular to Rebeca Arias, Max<br />
Everest-Phillips, Anne-Gertraude Juepner,<br />
Alexis Laffittan, Marcos Neto and Maria<br />
Luisa Silva. Informal consultations were also<br />
held on the side of the launch of the 2015<br />
<strong>Human</strong> <strong>Development</strong> <strong>Report</strong> in Beijing,<br />
Bonn, Colombo, Dhaka, Helsinki, London,<br />
Manila, Reykjavik and Vienna. Contributions,<br />
support and assistance from partnering institutions,<br />
including UNDP regional bureaus<br />
and country offices, are acknowledged with<br />
much gratitude.<br />
Special thanks are extended to UNDP colleagues<br />
who constituted the Readers Group<br />
for the <strong>Report</strong>: Mandeep Dhaliwal, Priya<br />
Gajraj, George Ronald Gray, Anne-Gertraude<br />
Juepner, Sheila Marnie, Ayodele Odusola,<br />
Thangavel Palanivel, Sarah Poole, Mounir<br />
Tabet, Claire Van der Vaeren and Claudia<br />
Vinay. The political read of the <strong>Report</strong> was<br />
done by Patrick Keuleers, Luciana Mermet<br />
and Nicholas Rosellini, and their advice is<br />
thankfully acknowledged.<br />
Former HDRO colleagues and friends of<br />
the <strong>Report</strong>, including Moez Doraid, Sakiko<br />
Fukuda-Parr, Terry McKinley, Saraswathi<br />
Menon, Siddiqur Osmani, Stefano Pettinato<br />
and David Stewart, were kind enough to spend<br />
a day with us and share their insights, views<br />
and experiences, which are invaluable.<br />
We further benefited on <strong>Report</strong>-related<br />
topics from discussions with and inputs<br />
from Saamah Abdallah, Helmut K. Anheier,<br />
Michelle Breslauer, Cosmas Gitta, Ronald<br />
Mendoza, Eugenia Piza-Lopez, Julia Raavad,<br />
Diane Sawyer and Oliver Schwank. We would<br />
like to thank members of the public who participated<br />
in online surveys for <strong>Report</strong>-related<br />
topics on our website.<br />
Several talented young people contributed<br />
to the <strong>Report</strong> as interns: Ellen Hsu,<br />
Mohammad Taimur Mustafa, Abedin Rafique,<br />
Jeremías Rojas, Prerna Sharma, Weijie Tan and<br />
Danielle Ho Tan Yau. They deserve recognition<br />
for their dedication and contributions.<br />
We are grateful for the highly professional<br />
editing and production by Communications<br />
<strong>Development</strong> Incorporated—led by Bruce<br />
Ross-Larson, with Joe Caponio, Mike Crumplar,<br />
Christopher Trott and Elaine Wilson—and designers<br />
Gerry Quinn and Phoenix Design Aid.<br />
Most of all, on a personal note, I am,<br />
as always, profoundly grateful to UNDP<br />
Administrator Helen Clark for her leadership<br />
and vision as well as her commitment to the<br />
cause of human development and her solid<br />
support to our work. My thanks also go to the<br />
entire HDRO team for their dedication in<br />
producing a report that strives to further the<br />
advancement of human development.<br />
Selim Jahan<br />
Director<br />
<strong>Human</strong> <strong>Development</strong> <strong>Report</strong> Office<br />
vi | HUMAN DEVELOPMENT REPORT <strong>2016</strong>
Contents<br />
Foreword<br />
Acknowledgements<br />
Overview 1<br />
CHAPTER 1<br />
<strong>Human</strong> development — achievements, challenges and hopes 25<br />
The achievements we have made 26<br />
The challenges we face 29<br />
The hopes we have 39<br />
The human development approach and the 2030 Agenda 45<br />
CHAPTER 2<br />
Universalism—from principles to practice 51<br />
Momentum towards universalism 52<br />
Beyond averages — using the family of human development indices 52<br />
A look at disadvantaged groups 56<br />
Deprivations in human development as a dynamic process 67<br />
Barriers to universalism 76<br />
Breaking down barriers 81<br />
CHAPTER 3<br />
Reaching everyone —analytical and assessment issues 85<br />
What aspects need to be analysed 85<br />
Checking whether progress in human development reaches everyone<br />
— assessment requirements 94<br />
CHAPTER 4<br />
Caring for those left out — national policy options 105<br />
Reaching those left out using universal policies 105<br />
Pursuing measures for groups with special needs 118<br />
Making human development resilient 122<br />
Empowering those left out 128<br />
Conclusion 133<br />
iii<br />
v<br />
CHAPTER 5<br />
Transforming global institutions 137<br />
Structural challenges in global institutions 138<br />
Options for institutional reform 147<br />
Conclusion 160<br />
CHAPTER 6<br />
<strong>Human</strong> development for everyone — looking forward 163<br />
<strong>Human</strong> development for everyone — an action agenda 163<br />
<strong>Human</strong> development for everyone — future substantive work 168<br />
Conclusion 169<br />
Notes 171<br />
References 175<br />
STATISTICAL ANNEX<br />
Readers guide 193<br />
Statistical tables<br />
1. <strong>Human</strong> <strong>Development</strong> Index and its components 198<br />
2. <strong>Human</strong> <strong>Development</strong> Index trends, 1990–2015 202<br />
3. Inequality-adjusted <strong>Human</strong> <strong>Development</strong> Index 206<br />
4. Gender <strong>Development</strong> Index 210<br />
5. Gender Inequality Index 214<br />
6. Multidimensional Poverty Index: developing countries 218<br />
7. Population trends 222<br />
8. Health outcomes 226<br />
9. Education achievements 230<br />
10. National income and composition of resources 234<br />
11. Work and employment 238<br />
12. <strong>Human</strong> security 242<br />
13. International integration 246<br />
14. Supplementary indicators: perceptions of well-being 250<br />
15. Status of fundamental human rights treaties 254<br />
<strong>Human</strong> development dashboards<br />
1. Life-course gender gap 259<br />
2. Sustainable development 264<br />
Regions 269<br />
Statistical references 270<br />
Contents | vii
SPECIAL CONTRIBUTIONS<br />
Peace in Colombia is also peace for the world—Juan Manuel Santos 20<br />
The power of culture to prompt action—Olafur Eliasson 44<br />
Getting a clearer picture of poverty—Melinda Gates 57<br />
Predictably irrational—helping advance human development in a less than<br />
rational world—Dan Ariely 90<br />
The world has much to learn from indigenous peoples—Mirna Cunningham Kain 121<br />
Preventing violent extremism and promoting human development for all:<br />
A critical issue on the global development agenda—Carol Bellamy 158<br />
The Sustainable <strong>Development</strong> Goals—shared vision, collective responsibilities<br />
—Dr. Angela Merkel 167<br />
BOXES<br />
1 <strong>Human</strong> development — a comprehensive approach 2<br />
2 Measuring human development 3<br />
1.1 <strong>Human</strong> development — a people-centred approach 25<br />
1.2 <strong>Human</strong> development in the Republic of Korea — a longer term perspective 29<br />
1.3 Insights based on horizontal inequalities 33<br />
1.4 Millennials versus the silent generation 34<br />
1.5 Five common myths about refugees 36<br />
1.6 <strong>Human</strong> security, as people see it 37<br />
1.7 Cyberactivism — a new form of participation 40<br />
1.8 Five misconceptions about women’s economic empowerment 42<br />
1.9 The growing recognition of the importance of environmental sustainability 43<br />
1.10 Sustainable <strong>Development</strong> Goals 46<br />
2.1 Poverty is also a developed country problem 55<br />
2.2 Gender-based inequalities in South Asian households 58<br />
2.3 <strong>Human</strong> development among African Americans in the United States 61<br />
2.4 Limitations in opportunities among young people in small island<br />
developing<br />
states 62<br />
2.5 Disadvantages facing migrants 64<br />
2.6 The challenge of a two-tier public and private system for universal access<br />
to quality services 69<br />
2.7 <strong>Human</strong> security from a woman’s point of view 71<br />
2.8 Antenatal stress and intergenerational deprivation 72<br />
2.9 From the champagne glass to the elephant curve 77<br />
3.1 Voice and participation—intrinsic, instrumental and constructive 87<br />
3.2 Facilitating participation through new technologies 88<br />
3.3 Strategies for changing social norms 92<br />
3.4 Test score methods for assessing the quality of education 97<br />
3.5 Voice and accountability indicator—the World Bank’s approach 98<br />
3.6 A long-term vision of the future—the Leimers List 100<br />
4.1 The Global Deal — a triple-win strategy 107<br />
4.2 Providing finance to rural farmers in the former Yugoslav Republic of Macedonia<br />
107<br />
4.3 E-governance 110<br />
4.4 Fiscal decentralization in Indonesia — improving service delivery 111<br />
4.5 How local government makes a difference in Moldova 112<br />
4.6 Arab States — opening opportunities for women 113<br />
4.7 Social businesses attract young people 115<br />
4.8 Affirmative action has helped increase women’s representation in parliament 119<br />
4.9 Overcoming discrimination against lesbian, gay, bisexual, transgender<br />
and intersex individuals 120<br />
4.10 Maori representation in New Zealand’s parliament 120<br />
4.11 Enlarging employment choices among persons with disabilities in Serbia 122<br />
4.12 Providing work to Syrian refugees in Jordan 123<br />
4.13 The Swedish economy is being boosted by immigration 123<br />
4.14 Reaching those left out in the fight against HIV and AIDS 124<br />
4.15 Success in reducing maternal and child mortality in Afghanistan 126<br />
4.16 Two paths in carbon pricing 127<br />
4.17 Mainstreaming the poverty– environment nexus 129<br />
4.18 Resilient human development — lessons from Latvia 129<br />
4.19 Equality under the law — Georgia’s Legal Aid Service 132<br />
4.20 Right to information — actions in developing countries 133<br />
5.1 Transnational corporations and human development—no automatic link 140<br />
5.2 Loopholes of globalization—tax avoidance and illegal financial flows 141<br />
5.3 The World Trade Organization and India’s national development policies 142<br />
5.4 Bilateral investment treaties and national policies in Ecuador 144<br />
5.5 Civil society and environment sustainability 147<br />
5.6 Reassessing treaties—some examples 149<br />
5.7 International Organization for Migration—a new member of the UN family 150<br />
5.8 Global institutional developments promoting women’s inclusion 153<br />
5.9 The new regional development bank—for infrastructure in Asia 154<br />
5.10 Civil society and women’s participation 159<br />
6.1 Administrative registries in Latin America and the Caribbean 165<br />
6.2 The Paris Agreement on climate change 166<br />
6.3 The New York Declaration 168<br />
FIGURES<br />
1 <strong>Human</strong> development — the analytical approach 2<br />
2 Analytical links between the human development approach<br />
and the 2030 Agenda 4<br />
3 Women are discriminated against with respect to opportunities 6<br />
4 Barriers to universalism 7<br />
5 National policies to care for those left out—a four-pronged strategy 10<br />
6 21st century skills 13<br />
1.1 Regional trends in <strong>Human</strong> <strong>Development</strong> Index values 27<br />
1.2 <strong>Human</strong> deprivation lingers in some indicators of well-being 30<br />
1.3 Relative global inequality has declined steadily over the past few decades,<br />
but absolute inequality has increased dramatically 31<br />
1.4 Some 46 percent of the total increase in income between 1988 and 2011<br />
went to the wealthiest 10 percent 32<br />
1.5 Global wealth has become far more concentrated 32<br />
1.6 The planet’s surging population is projected to grow to 9.7 billion in 2050 33<br />
1.7 People self-defined as part of the lower middle class and working class feel<br />
less engaged by the concept of global citizenship 35<br />
1.8 At the end of 2015 there were more than 65 million people worldwide<br />
who had been forcibly displaced 36<br />
1.9 2014 saw the highest number of battle-related deaths since 1989:<br />
more than 50,000 36<br />
1.10 Analytical links between the human development approach and the 2030<br />
Agenda 47<br />
2.1 A third of the world’s population lives in low human development 53<br />
2.2 Women are the most disadvantaged in low human development countries 54<br />
2.3 People in rural areas are far more likely than people in urban areas to be<br />
multidimensionally poor 55<br />
2.4 Variations in <strong>Human</strong> <strong>Development</strong> Index values are wide across population<br />
groups in Nepal 60<br />
viii | HUMAN DEVELOPMENT REPORT 2015
2.5 In the United States the <strong>Human</strong> <strong>Development</strong> Index value is below the<br />
country average for some ethnic groups but above it for others 60<br />
2.6 Since the 1990s attitudes towards the lesbian, gay, bisexual, transgender<br />
and intersex community have become more tolerant, and the number of<br />
antidiscrimination laws has increased 66<br />
2.7 Basic mobile or fixed broadband plans cost much more in developing<br />
countries than in developed countries and cost the most in the least<br />
developed countries 70<br />
2.8 Deprivations among women can accumulate throughout life 72<br />
2.9 Interventions for women early in life can prevent deprivations later<br />
in the lifecycle 73<br />
2.10 There are differences in the aggregate priorities of individuals in countries<br />
at different levels of human development 75<br />
2.11 The priorities of Chileans vary by income 75<br />
2.12 In South Asia many girls marry before age 18—some before age 15 79<br />
2.13 Over the past three decades there has been a decline in rights of<br />
free association and collective bargaining 81<br />
3.1 Choices rest on four foundations 86<br />
3.2 People’s perceptions of threats to security were much more intense<br />
in Nigeria’s Federal Capital Territory than in the South-South region 95<br />
3.3 It is possible for a country to have a high <strong>Human</strong> <strong>Development</strong> Index value<br />
and a low score on the voice and accountability index 98<br />
3.4 The trend in nonincome <strong>Human</strong> <strong>Development</strong> Index values and in women’s<br />
and men’s shares of seats in parliament is moving in the desired direction<br />
in every region 99<br />
3.5 <strong>Human</strong> development indicators and Sustainable <strong>Development</strong> Goal<br />
indicators may support each other—an example in health 101<br />
3.6 New data sources for Sustainable <strong>Development</strong> Goals 101<br />
4.1 Investments in priority human development to ensure human development<br />
for everyone 108<br />
4.2 Factors that enable or constrain women’s empowerment—six direct and<br />
four underlying factors 112<br />
4.3 21st century skills 115<br />
4.4 Navigating the fourth industrial revolution 116<br />
4.5 Many countries have not ratified or signed various international<br />
human rights instruments 131<br />
5.1 The number of countries subscribing to multilateral instruments varies 139<br />
5.2 Net payments of royalties and licences from developing to developed<br />
countries have grown immensely since 1990 143<br />
5.3 The share of core resources in UN operational activities is low and declining 144<br />
5.4 Of the more than 4,500 nongovernmental organizations granted consultative<br />
status by the United Nations Economic and Social Council, 72 percent were<br />
admitted after 2000 146<br />
5.5 Good telecommunication infrastructure means more online participation 147<br />
5.6 Developing countries would add $191 billion to official development<br />
assistance by meeting their contribution target of 0.7 percent of<br />
gross national income 154<br />
6.1 Reaching everyone — time is of the essence in Sub- Saharan Africa 164<br />
TABLES<br />
2.1 Years of schooling, indigenous and nonindigenous children, selected countries 65<br />
2.2 The difference between life expectancy and healthy life expectancy<br />
in selected countries 68<br />
5.1 Examples of the social benefits and costs of globalizing market institutions 138<br />
5.2 South–South cooperation advantages in Asia and Latin America 155<br />
Contents | ix
Overview<br />
<strong>Human</strong> development<br />
for everyone
Infographic 1 <strong>Human</strong> development for everyone<br />
Today’s and future generations<br />
Good<br />
health<br />
Access to<br />
knowledge<br />
Dignity<br />
Capabilities<br />
and opportunities<br />
for all individuals<br />
<strong>Human</strong><br />
rights<br />
Selfdetermination<br />
Nondiscrimination<br />
Decent<br />
standard<br />
of living<br />
<strong>Human</strong><br />
security
<strong>Human</strong> <strong>Development</strong><br />
<strong>Report</strong> <strong>2016</strong><br />
<strong>Human</strong> <strong>Development</strong> for Everyone<br />
Overview<br />
<strong>Human</strong> development for everyone<br />
Over the past quarter-century the world has changed — and with it the development landscape. New countries have<br />
emerged, and our planet is now home to more than 7 billion people, one in four of them young. 1 The geopolitical scenario<br />
has also changed, with developing countries emerging as a major economic force and political power. Globalization has<br />
integrated people, markets and work, and the digital revolution has changed human lives.<br />
Progress in human development has been impressive<br />
over the past 25 years. People now live<br />
longer, more children are in school and more<br />
people have access to basic social services. 2 The<br />
Millennium Declaration and the Millennium<br />
<strong>Development</strong> Goals — global commitments<br />
at the turn of the century to end basic human<br />
deprivations within 15 years — added to the<br />
momentum.<br />
Yet human development has been uneven,<br />
and human deprivations persist. Progress has<br />
bypassed groups, communities, societies — and<br />
people have been left out. Some have achieved<br />
only the basics of human development, and<br />
some not even that. And new development challenges<br />
have emerged, ranging from inequalities<br />
to climate change, from epidemics to desperate<br />
migration, from conflicts to violent extremism.<br />
The <strong>2016</strong> <strong>Human</strong> <strong>Development</strong> <strong>Report</strong><br />
focuses on how human development can be ensured<br />
for everyone — now and in the future (see<br />
infographic 1 on the facing page). It starts with<br />
an account of the achievements, challenges and<br />
hopes for human progress, envisioning where<br />
humanity wants to go. Its vision draws from<br />
and builds on the 2030 Agenda for Sustainable<br />
<strong>Development</strong> that the 193 member states of the<br />
United Nations endorsed last year and the 17<br />
Sustainable <strong>Development</strong> Goals that the world<br />
has committed to achieve. 3<br />
The <strong>Report</strong> explores who has been left out in<br />
the progress in human development and why.<br />
It argues that to ensure human development<br />
for everyone, a mere mapping of the nature<br />
and location of deprivations is not enough.<br />
Some aspects of the human development<br />
approach and assessment perspectives have to<br />
be brought to the fore. The <strong>Report</strong> also identifies<br />
the national policies and key strategies<br />
that will enable every human being to achieve<br />
basic human development and to sustain and<br />
protect the gains. And addressing the structural<br />
challenges of the current global system, it<br />
presents options for institutional reforms.<br />
Key messages<br />
This <strong>Report</strong> conveys five basic messages:<br />
• Universalism is key to human development,<br />
and human development for everyone is<br />
attainable.<br />
• Various groups of people still suffer from basic<br />
deprivations and face substantial barriers<br />
to overcoming them.<br />
• <strong>Human</strong> development for everyone calls for<br />
refocusing some analytical issues and assessment<br />
perspectives.<br />
• Policy options exist and, if implemented,<br />
would contribute to achieving human development<br />
for everyone.<br />
• A reformed global governance, with fairer<br />
multilateralism, would help attain human<br />
development for everyone.<br />
<strong>Human</strong> development is all<br />
about enlarging freedoms<br />
for every human being<br />
<strong>Human</strong> development is about enlarging freedoms<br />
so that all human beings can pursue<br />
choices that they value. Such freedoms have<br />
two fundamental aspects — freedom of well-being,<br />
represented by functionings and capabilities,<br />
and freedom of agency, represented by<br />
voice and autonomy (figure 1).<br />
• Functionings are the various things a person<br />
may value being and doing — such as being<br />
happy, adequately nourished and in good<br />
Universalism is key to<br />
human development,<br />
and human<br />
development for<br />
everyone is attainable<br />
Overview | 1
FIGURE 1<br />
<strong>Human</strong> development — the analytical approach<br />
Functionings<br />
Things a person<br />
values being or doing<br />
Capabilities<br />
Set of<br />
combinations<br />
of functionings that<br />
can be achieved<br />
<strong>Human</strong><br />
development<br />
Agency to do or<br />
achieve what<br />
is valued<br />
Voice and autonomy<br />
Source: <strong>Human</strong> <strong>Development</strong> <strong>Report</strong> Office.<br />
<strong>Human</strong> development<br />
focuses on the<br />
richness of human<br />
lives rather than on the<br />
richness of economies<br />
health, as well as having self-respect and taking<br />
part in the life of the community.<br />
• Capabilities are the various sets of functionings<br />
(beings and doings) that a person can achieve.<br />
• Agency is related to what a person is free to<br />
do and achieve in pursuit of whatever goals<br />
or values he or she regards as important.<br />
Both types of freedoms are absolutely necessary<br />
for human development.<br />
The first <strong>Human</strong> <strong>Development</strong> <strong>Report</strong>,<br />
in 1990, presented human development as<br />
a people-centred approach to development<br />
(box 1). 4 The human development approach<br />
shifted the development discourse from<br />
pursuing material opulence to enhancing<br />
human well-being, from maximizing income<br />
to expanding capabilities, from optimizing<br />
growth to enlarging freedoms. It focused on<br />
the richness of human lives rather than on<br />
simply the richness of economies, and doing<br />
so changed the lens for viewing development<br />
results (box 2).<br />
BOX 1<br />
<strong>Human</strong> development — a comprehensive approach<br />
<strong>Human</strong> development is a process of enlarging people’s<br />
choices. But human development is also the objective,<br />
so it is both a process and an outcome. <strong>Human</strong> development<br />
implies that people must influence the processes<br />
that shape their lives. In all this, economic growth is<br />
an important means to human development, but not the<br />
end.<br />
<strong>Human</strong> development is the development of the people<br />
through building human capabilities, by the people<br />
through active participation in the processes that shape<br />
their lives and for the people by improving their lives. It<br />
is broader than other approaches, such as the human<br />
resource approach, the basic needs approach and the<br />
human welfare approach.<br />
Source: <strong>Human</strong> <strong>Development</strong> <strong>Report</strong> Office.<br />
2 | HUMAN DEVELOPMENT REPORT <strong>2016</strong>
BOX 2<br />
Measuring human development<br />
The composite <strong>Human</strong> <strong>Development</strong> Index (HDI) integrates<br />
three basic dimensions of human development.<br />
Life expectancy at birth reflects the ability to<br />
lead a long and healthy life. Mean years of schooling<br />
and expected years of schooling reflect the ability to<br />
acquire knowledge. And gross national income per<br />
capita reflects the ability to achieve a decent standard<br />
of living.<br />
To measure human development more comprehensively,<br />
the <strong>Human</strong> <strong>Development</strong> <strong>Report</strong> also presents four<br />
other composite indices. The Inequality-adjusted HDI discounts<br />
the HDI according to the extent of inequality. The<br />
Gender <strong>Development</strong> Index compares female and male<br />
HDI values. The Gender Inequality Index highlights women’s<br />
empowerment. And the Multidimensional Poverty<br />
Index measures nonincome dimensions of poverty.<br />
Source: <strong>Human</strong> <strong>Development</strong> <strong>Report</strong> Office.<br />
The human development approach also provided<br />
the analytical bedrock of the Millennium the world still faces many complex develop-<br />
Yet, even with all this commendable progress,<br />
Declaration and the Millennium <strong>Development</strong> ment challenges. Some challenges are lingering<br />
Goals — the timebound development objectives (deprivations), some deepening (inequalities)<br />
and targets agreed on in 2000 by 189 heads of and some emerging (violent extremism). Some<br />
states and governments to reduce basic human are global (gender inequality), some regional<br />
poverty by 2015. And it informed and influenced<br />
the 2030 Agenda and the Sustainable Most are mutually reinforcing — climate change<br />
(water stress) and some local (natural disasters).<br />
<strong>Development</strong> Goals.<br />
reduces food security; rapid urbanization marginalizes<br />
the urban poor. Whatever their reach,<br />
these challenges have a negative impact on<br />
<strong>Human</strong> development for<br />
people’s well-being.<br />
everyone is attainable<br />
Despite all these challenges, what humanity<br />
has achieved over 25 years gives hope that<br />
As universalism is the centrepiece of human fundamental changes are possible. In fact, some<br />
development, human development must be of the impressive achievements have been in<br />
and can be attained for everyone. The positive regions or areas that once were lagging. All over<br />
evidence is encouraging.<br />
the world people are increasingly engaged in<br />
By 2015 the world had achieved some of influencing the processes that shape their lives.<br />
what seemed to be daunting challenges 25 years <strong>Human</strong> ingenuity and creativity have initiated<br />
ago. Even though the global population increased<br />
by 2 billion — from 5.3 billion in 1990 into the way we work, think and behave.<br />
technological revolutions and translated them<br />
to 7.3 billion in 2015 — more than 1 billion Gender equality and women’s empowerment<br />
people escaped extreme poverty, 2.1 billion are now mainstream dimensions of any development<br />
discourse. And there is no denying that<br />
gained access to improved sanitation and more<br />
than 2.6 billion gained access to an improved with an intention to overcome them constructively,<br />
space for discussions and dialogues on<br />
source of drinking water. 5<br />
The global under-five mortality rate was more issues once taboo is slowly opening — as with<br />
than halved between 1990 and 2015— from sexual orientation; discriminations faced by lesbian,<br />
gay, bisexual, transgender and intersex peo-<br />
91 per 1,000 live births to 43. The incidence<br />
of HIV, malaria and tuberculosis declined between<br />
2000 and 2015. The proportion of seats Awareness of sustainability has been growing.<br />
ple; and female genital mutilation and cutting.<br />
held by women in parliaments worldwide rose The 2030 Agenda and the Paris Agreement on<br />
to 23 percent in <strong>2016</strong> — up 6 percentage points climate change are prime examples. They also<br />
over the preceding decade. The global net loss show that under the rumble of debate and gridlock,<br />
a nascent global consensus is emerging<br />
of forested areas fell from 7.3 million hectares<br />
a year in the 1990s to 3.3 million during around many global challenges and ensuring a<br />
2010–2015. 6 sustainable world for future generations.<br />
What humanity has<br />
achieved over 25<br />
years gives hope that<br />
fundamental changes<br />
are possible. Some<br />
of the impressive<br />
achievements have<br />
been in regions or<br />
areas that once<br />
were lagging<br />
Overview | 3
Closing the human<br />
development gaps<br />
is critical, but so is<br />
ensuring that future<br />
generations have<br />
the same, or even<br />
better, opportunities<br />
All these promising developments give the<br />
world the hope that things can be changed and<br />
that transformations are possible. The world<br />
has less than 15 years to achieve its inspirational<br />
agenda to leave no one behind. Closing the<br />
human development gaps is critical, but so is<br />
ensuring that future generations have the same,<br />
or even better, opportunities.<br />
And fulfilling the 2030 Agenda is a critical<br />
step towards enabling all people to reach their<br />
full potential. In fact, the human development<br />
approach and the 2030 Agenda have three<br />
common analytical links (figure 2):<br />
• Both are anchored in universalism — the human<br />
development approach by emphasizing<br />
the enhancement of freedoms for every human<br />
being and the 2030 Agenda by concentrating<br />
on leaving no one behind.<br />
• Both share the same fundamental areas of<br />
focus — eradicating extreme poverty, ending<br />
hunger, reducing inequality, ensuring gender<br />
equality and so on.<br />
• Both have sustainability as the core principle.<br />
The links among the human development approach,<br />
the 2030 Agenda and the Sustainable<br />
<strong>Development</strong> Goals are mutually reinforcing in<br />
three ways. First, the 2030 Agenda can see what<br />
analytical parts of the human development approach<br />
strengthen its conceptual foundation.<br />
Similarly, the human development approach<br />
can review the narrative of the 2030 Agenda<br />
and examine parts that can enrich it.<br />
Second, the Sustainable <strong>Development</strong> Goal<br />
indicators can use the human development<br />
indicators in assessing progress towards the<br />
Sustainable <strong>Development</strong> Goals. Similarly, the<br />
human development approach can supplement<br />
the Sustainable <strong>Development</strong> Goal indicators<br />
with additional indicators.<br />
Third, the <strong>Human</strong> <strong>Development</strong> <strong>Report</strong>s<br />
can be an extremely powerful advocacy instrument<br />
for the 2030 Agenda and the Sustainable<br />
<strong>Development</strong> Goals. And the Sustainable<br />
<strong>Development</strong> Goals can be a good platform<br />
FIGURE 2<br />
Analytical links between the human development approach and the 2030 Agenda<br />
The human<br />
development<br />
approach<br />
Review the narrative of the 2030 Agenda and examine parts that can enrich it<br />
Sustainability<br />
The core principle<br />
Common anchors<br />
Eradication of extreme poverty, ending hunger…<br />
Fundamental area of focus<br />
The 2030<br />
Agenda and<br />
the Sustainable<br />
<strong>Development</strong><br />
Goals<br />
Freedoms for every human being<br />
Principle of universalism<br />
Use analytical elements of human development to strengthen its conceptual foundation<br />
Leaving no one behind<br />
Source: <strong>Human</strong> <strong>Development</strong> <strong>Report</strong> Office.<br />
4 | HUMAN DEVELOPMENT REPORT <strong>2016</strong>
for the greater visibility of the human development<br />
approach and the <strong>Human</strong> <strong>Development</strong><br />
<strong>Report</strong> for the coming years.<br />
Yet basic deprivations abound<br />
among various groups of people<br />
One person in nine in the world is hungry, and<br />
one in three is malnourished. 7 About 15 million<br />
girls a year marry before age 18, one every<br />
two seconds. 8 Worldwide 18,000 people a day<br />
die because of air pollution, 9 and HIV infects<br />
2 million people a year. 10 Every minute an<br />
average of 24 people are displaced from their<br />
home. 11<br />
Such basic deprivations are common among<br />
various groups. Women and girls, ethnic minorities,<br />
indigenous peoples, persons with disabilities,<br />
migrants — all are deprived in the basic<br />
dimensions of human development.<br />
In all regions women have a longer life expectancy<br />
than do men, and in most regions girls’ expected<br />
years of schooling are similar to those of<br />
boys. Yet in all regions women consistently have,<br />
on average, a lower <strong>Human</strong> <strong>Development</strong> Index<br />
(HDI) value than do men. The largest difference<br />
is in South Asia, where the female HDI value is<br />
20 percent lower than the male HDI value.<br />
There are group-based disadvantages, as<br />
shown in Nepal. Brahmans and Chhetris have<br />
the highest HDI value (0.538), followed by<br />
Janajatis (0.482), Dalits (0.434) and Muslims<br />
(0.422). The greatest inequalities are in education,<br />
with pronounced long-lasting effects on<br />
capabilities. 12<br />
Shortfalls in basic human development<br />
among various groups often persist because<br />
of discrimination. Women are particularly<br />
discriminated against with respect to opportunities<br />
and end up with disadvantaged outcomes<br />
(figure 3). In many societies women are discriminated<br />
against with respect to productive<br />
assets, such as the right to land and property.<br />
As a result only 10–20 percent of landholders<br />
in developing countries are women. 13<br />
Ethnic minorities and other groups are often<br />
excluded from education, employment and administrative<br />
and political positions, resulting in<br />
poverty and higher vulnerability to crime, including<br />
human trafficking. In 2012, 51 percent<br />
of ethnic minorities in Viet Nam were living in<br />
multidimensional poverty, compared with only<br />
17 percent of Kinh or Hoa people, the ethnic<br />
majority. 14<br />
More than 370 million self-identified indigenous<br />
peoples in 70 countries also face discrimination<br />
and exclusion in the legal framework, in<br />
access to education in their own language and<br />
in access to land, water, forests and intellectual<br />
property rights. 15<br />
More than a billion people are estimated to<br />
live with some form of disability and are among<br />
the most marginalized in most societies. They<br />
face stigma, discrimination and inaccessible<br />
physical and virtual environments. 16<br />
Today 244 million people live outside their<br />
home countries. 17 Many are economic refugees<br />
hoping to enhance their livelihoods and send<br />
money back home. But many migrants, especially<br />
the world’s 65 million forcibly displaced<br />
people, face extreme conditions — lacking jobs,<br />
income and access to health care and social<br />
services beyond emergency humanitarian assistance.<br />
They often face harassment, animosity<br />
and violence in host countries.<br />
<strong>Human</strong> deprivations are also dynamic.<br />
Moving above the low human development<br />
threshold does not necessarily ensure that people<br />
will be protected from emerging and future<br />
threats. Even where people have more choices<br />
than before, there may be threats to the security<br />
of these choices.<br />
Epidemics, violence, climate change and<br />
natural disasters can quickly undermine the<br />
progress of those who have moved out of<br />
poverty. They can also generate new deprivations.<br />
Millions of people around the world are<br />
exposed to climate-related natural disasters,<br />
droughts and associated food insecurities, subsisting<br />
on degraded land.<br />
The deprivations of the current generation<br />
can carry over to the next generation. Parents’<br />
education, health and income can greatly affect<br />
the opportunities available to their children.<br />
Substantial barriers persist for<br />
universal human development<br />
Groups of people who remain deprived may<br />
be the most difficult to reach — geographically,<br />
politically, socially and economically.<br />
Surmounting the barriers may require greater<br />
<strong>Human</strong> deprivations<br />
are dynamic. Moving<br />
above the low human<br />
development threshold<br />
does not necessarily<br />
ensure that people<br />
will be protected<br />
from emerging and<br />
future threats<br />
Overview | 5
FIGURE 3<br />
Women are discriminated against with respect to opportunities<br />
18 countries<br />
Free from legal<br />
impediments<br />
100 countries<br />
Prevented from<br />
pursuing some<br />
careers only<br />
because of<br />
their gender<br />
(countries)<br />
100<br />
193<br />
32 countries<br />
Procedures to<br />
obtain a passport<br />
differ from those for men<br />
Women are<br />
discriminated against<br />
with respect<br />
to opportunities<br />
More than 150 countries<br />
Legally discriminated<br />
against<br />
18 countries<br />
Required to<br />
have husband’s<br />
approval<br />
to get a job<br />
Source: <strong>Human</strong> <strong>Development</strong> <strong>Report</strong> Office.<br />
Realizing universal<br />
human development<br />
in practice is possible,<br />
but the key barriers<br />
and forms of exclusion<br />
must first be overcome<br />
fiscal resources and development assistance,<br />
continuing gains in technology and better data<br />
for monitoring and evaluation.<br />
But some barriers are deeply embedded in<br />
social and political identities and relationships<br />
— such as blatant violence, discriminatory laws,<br />
exclusionary social norms, imbalances in political<br />
participation and unequal distribution of<br />
opportunities. Overcoming them will require<br />
putting empathy, tolerance and moral commitments<br />
to global justice and sustainability at<br />
the centre of individual and collective choices.<br />
People should consider themselves part of a<br />
cohesive global whole rather than a fragmented<br />
terrain of rival groups and interests.<br />
Moving towards universal human development<br />
requires an awareness and understanding<br />
of the drivers and dynamics of how groups are<br />
marginalized, which inevitably varies across<br />
countries and regions. Realizing universal human<br />
development in practice is possible, but<br />
the key barriers and forms of exclusion must<br />
first be overcome (figure 4).<br />
Whether intentional or unintentional,<br />
exclusion can have the same results — some<br />
people will be more deprived than others, and<br />
not all people will have equal opportunities to<br />
realize their full potential. Group inequalities<br />
reflect divisions that are socially constructed<br />
and sustained because they establish a basis for<br />
unequal access to valued outcomes and scarce<br />
resources. The dimensions and mechanisms of<br />
exclusion are also dynamic, as are the characteristics<br />
groups use as a basis for exclusion.<br />
6 | HUMAN DEVELOPMENT REPORT <strong>2016</strong>
FIGURE 4<br />
Barriers to universalism<br />
Intolerance<br />
and exclusion<br />
Discriminatory laws<br />
Social norms<br />
Violence<br />
Narrow<br />
self-identities<br />
Nationalism<br />
Identity politics<br />
Barriers to<br />
universalism<br />
Weak<br />
bargaining power<br />
Inequality<br />
Lack of voice<br />
Elite capture<br />
of institutions<br />
Rise of 1 percent<br />
Lack of pluralism<br />
Source: <strong>Human</strong> <strong>Development</strong> <strong>Report</strong> Office.<br />
Legal and political institutions can be used<br />
and abused to perpetuate group divisions. An<br />
extreme case relates to the rights of the lesbian,<br />
gay, bisexual, transgender and intersex community<br />
in the 73 countries and five territories<br />
where same-sex sexual acts are illegal. 18 Laws<br />
are discriminatory in other cases because they<br />
prevent certain groups from access to services<br />
or opportunities.<br />
Some social norms can be helpful for harmonious<br />
coexistence within societies, but others<br />
can be discriminatory, prejudicial and exclusive.<br />
Social norms in many countries reduce<br />
the choices and opportunities for women and<br />
girls, who are typically responsible for more<br />
than three-quarters of unpaid family work. 19<br />
The presence of women as customers in cafés<br />
or restaurants may also be discouraged, and in<br />
some cases it is taboo for women to travel in<br />
public without being accompanied by a man. 20<br />
Perhaps the most direct mechanism of<br />
exclusion is violence. Motivations include<br />
consolidating political power, safeguarding the<br />
well-being of elites, controlling the distribution<br />
of resources, seizing territory and resources and<br />
favouring ideologies based on the supremacy of<br />
one identity and set of values.<br />
The top 1 percent of the global wealth distribution<br />
holds 46 percent of the world’s wealth. 21<br />
Inequalities in income influence inequalities in<br />
other dimensions of well-being, and vice versa.<br />
Given today’s inequality, excluded groups are in<br />
a weak position to initiate the transformation<br />
of institutions. They lack agency and voice and<br />
so have little political leverage to influence policy<br />
and legislation through traditional means.<br />
At a time when global action and collaboration<br />
are imperative, self-identities are narrowing.<br />
Social and political movements linked to<br />
identity, whether nationalist or ethnopolitical,<br />
seem to be getting stronger. Brexit is one of the<br />
most recent examples of a retreat to nationalism<br />
when individuals feel alienated in a changing<br />
world.<br />
Inequalities in income<br />
influence inequalities<br />
in other dimensions<br />
of well-being,<br />
and vice versa<br />
Overview | 7
Voice and autonomy,<br />
as parts of freedom of<br />
agency and freedom of<br />
well-being, are integral<br />
to human development<br />
Intolerance of others in all its forms — legal,<br />
social or coercive — is antithetical to human<br />
development and to principles of universalism.<br />
<strong>Human</strong> development for<br />
everyone calls for refocusing<br />
some analytical issues<br />
<strong>Human</strong> development involves expanding<br />
choices, which determine who we are and what<br />
we do. Several factors underlie these choices:<br />
the wide range of options that we have to<br />
choose from — our capabilities; the social and<br />
cognitive constraints and social norms and influences<br />
that shape our values and choices; our<br />
own empowerment and the agency we exercise<br />
individually and as part of groups in shaping<br />
our options and opportunities; and the mechanisms<br />
that exist to resolve competing claims<br />
in ways that are fair and conducive to realizing<br />
human potential.<br />
The human development approach provides<br />
a systematic way to articulate these ideas. It<br />
can be especially powerful in illuminating the<br />
interplay among factors that can operate to<br />
the disadvantage of individuals and groups in<br />
different contexts.<br />
<strong>Human</strong> rights are the bedrock of human<br />
development. <strong>Human</strong> rights offer a useful<br />
perspective for analysing human development.<br />
Duty holders support and enhance human<br />
development and are accountable for a social<br />
system’s failures to deliver human development.<br />
These perspectives not only go beyond the<br />
minimal claims of human development, but<br />
can also serve as a powerful tool in seeking<br />
remedies.<br />
The notion of human security should<br />
emphasize a deep understanding of threats,<br />
risks and crises for joint action in the human<br />
development and human security approaches.<br />
The challenges are to balance the shock-driven<br />
response to global threats and the promotion of<br />
a culture of prevention.<br />
Voice and autonomy, as parts of freedom of<br />
agency and freedom of well-being, are integral<br />
to human development. The ability to deliberate,<br />
participate in public debates and be agents<br />
in shaping one’s life and environment is fundamental<br />
to human development for everyone.<br />
The primary focus of the human development<br />
approach has largely been on the freedom of<br />
well-being. But as well-being was realized, emphasizing<br />
freedom of agency has become more<br />
important.<br />
<strong>Human</strong> development is a matter of promoting<br />
not only the freedoms of individuals,<br />
but also the freedoms of groups or collectives.<br />
For the most marginalized and most deprived<br />
people collective agency can be much more<br />
powerful than individual agency. An individual<br />
is unlikely to achieve much alone, and power<br />
may be realized only through collective action.<br />
Identity influences agency and autonomy.<br />
People have the liberty of choosing their identities,<br />
an important liberty to recognize, value<br />
and defend. Individuals deserve options in<br />
choosing among different identities that they<br />
value. Recognizing and respecting such options<br />
are preconditions for peaceful coexistence in<br />
multiethnic and multicultural societies.<br />
Three identity issues have implications for<br />
universal human development. First, the space<br />
for multiple identities is more limited among<br />
people who are marginalized, and those people<br />
may lack the freedom to choose the identity<br />
they value. Second, the insistence on a single<br />
irrefutable identity and the denial of reasoning<br />
and choice in selecting identities may lead to<br />
extremism and violence and thus pose a threat<br />
to human development. Third, identity groups<br />
compete for limited economic and political<br />
resources and power, and deprived and marginalized<br />
people lose out. In most cases society’s<br />
values and norms go against the most disadvantaged,<br />
with preferences often formed by social<br />
traditions of privilege and subordination. But<br />
changing values and norms can transform this<br />
bias against disadvantaged people.<br />
Freedoms are interdependent, and such interdependence<br />
may be reinforcing. For example,<br />
a worker exercising the freedom to green the<br />
workspace may contribute to the freedom of<br />
co-workers to have clean air. But the freedom of<br />
one may also impinge on the freedom of others.<br />
A wealthy person has the freedom to construct<br />
a multistory house, but that may deprive a poor<br />
neighbour of sunlight and an airy environment.<br />
Limiting the freedom of others may not be<br />
the intended consequence of exercising one’s<br />
freedom, but some actions that curb others’<br />
freedom may be deliberate. Rich and powerful<br />
groups may try to curtail the freedom of others.<br />
8 | HUMAN DEVELOPMENT REPORT <strong>2016</strong>
This is reflected in the affluence bias of the policy<br />
options in many economies, in the way the<br />
legal system is built and in the way institutions<br />
work. All societies have to make tradeoffs and,<br />
following reasoned debate, determine the principles<br />
for settling issues, dynamically, as they<br />
develop and realize a more just society.<br />
Sustainable development is an issue of social<br />
justice. It relates to intergenerational equity —<br />
the freedoms of future generations and those<br />
of today. The human development approach<br />
thus considers sustainability to be a matter of<br />
distributional equity, both within and across<br />
generations.<br />
Specific assessment<br />
perspectives can ensure<br />
that everyone is reached<br />
<strong>Development</strong> practitioners agree in principle<br />
that enabling all people to benefit from<br />
progress in human development demands<br />
disaggregated data on such characteristics<br />
as region, gender, rural–urban location,<br />
socioeconomic status, race and ethnicity.<br />
But they are less clear about ensuring the<br />
availability of such data. Determining which<br />
lines of disaggregation are needed to reveal<br />
inequalities along particular dimensions can<br />
be difficult without already having some understanding<br />
of society’s processes of exclusion<br />
and marginalization. And political, social and<br />
cultural sensitivities can promote exclusions<br />
and deprivations.<br />
Disaggregating data by gender is crucial for<br />
gender equality and women’s empowerment.<br />
This is precisely why the 2030 Agenda, particularly<br />
Sustainable <strong>Development</strong> Goal 5 on<br />
achieving gender equality and empowering all<br />
women and girls, focuses on targets that facilitate<br />
gender-disaggregated data.<br />
Even though freedom of agency is an integral<br />
part of human development, the human development<br />
approach has traditionally focused<br />
more on well-being than on agency. Just look<br />
at the HDI. But agency is inherently more difficult<br />
to measure than well-being.<br />
The relationship between freedom of<br />
well-being and freedom of agency is generally<br />
positive. This supports the notion that the two<br />
aspects of human development, if not perfectly<br />
correlated, are complementary. In other words,<br />
societies might have achieved high average<br />
capabilities or well-being without achieving<br />
agency (in voice and autonomy).<br />
Other measures of human well-being, such as<br />
the Social Progress Index, 22 the World Happiness<br />
Index 23 and the Better Life Index, 24 can usefully<br />
assess whether well-being is reaching everyone.<br />
Some countries also support subjective measures<br />
of well-being or happiness, as with Bhutan’s<br />
Gross National Happiness Index. 25<br />
<strong>Human</strong> development for everyone also<br />
implies compiling and presenting data from<br />
innovative perspectives, such as real-time data<br />
and dashboards. A dashboard approach, in<br />
colour-coded tables, can show the levels and<br />
progress on various development indicators.<br />
It can thus be effective in assessing human<br />
well-being. It also implies an inclusive process<br />
bringing in more people to generate and disseminate<br />
information using new technologies.<br />
In 2013 the UN Secretary-General’s High-<br />
Level Panel on Sustainable <strong>Development</strong><br />
called for a Data Revolution for sustainable<br />
development, with a new international initiative<br />
to improve the quality of information<br />
and statistics available to citizens. 26 Big Data<br />
describes the large volume of data — both<br />
structured and unstructured — that various<br />
organizations collect using new technologies<br />
and can bring new perspectives to traditional<br />
data and statistics.<br />
Sustainable<br />
development is an<br />
issue of social justice<br />
Overview | 9
FIGURE 5<br />
National policies to care for those left out—<br />
a four-pronged strategy<br />
Addressing<br />
lifecycle<br />
capabilities<br />
Enhancing<br />
opportunities<br />
for women<br />
Reaching those left out using universal policies<br />
Pursuing<br />
inclusive<br />
growth<br />
Using<br />
affirmative<br />
action<br />
Pursuing measures for<br />
groups with special needs<br />
Promoting<br />
human<br />
development for<br />
marginalized<br />
groups<br />
Upholding<br />
human<br />
rights<br />
Mobilizing<br />
resources<br />
for human<br />
development<br />
priorities<br />
Promoting<br />
social<br />
protection<br />
Caring for those<br />
left out—national<br />
policy options<br />
Ensuring<br />
access<br />
to justice<br />
Promoting<br />
inclusion<br />
Empowering those left out<br />
Addressing<br />
epidemics,<br />
shocks and<br />
risks<br />
Combating<br />
violence and<br />
ensuring people’s<br />
security<br />
Making human development resilient<br />
Maintaining<br />
human well-being<br />
in postconflict<br />
situations<br />
Addressing<br />
climate<br />
change<br />
Ensuring<br />
accountability
Key policy options<br />
A four-pronged national policy approach<br />
can ensure that human development reaches<br />
everyone (figure 5). First, universal policies<br />
are needed to reach those left out, but practical<br />
universalism in policy is challenging.<br />
For example, a country may be committed to<br />
universal health care, but difficult geography<br />
may prevent it from establishing health care<br />
centres that are accessible to all localities. So<br />
universal human development policies need<br />
to be reoriented to reach those left out.<br />
Second, even with the new focus on universal<br />
policies, some groups of people have special<br />
needs that would not be met. Their situations<br />
require specific measures and attention. For<br />
example, persons with disabilities require measures<br />
to ensure their mobility, participation and<br />
work opportunities.<br />
Third, human development achieved does<br />
not mean human development sustained.<br />
Progress in human development may be slowed<br />
or even reversed because of shocks and vulnerabilities,<br />
with implications for people who have<br />
only achieved the basics in human development<br />
and for people who have yet to achieve<br />
the basics. Thus human development will have<br />
to be resilient.<br />
Fourth, people who have been left out will<br />
have to be empowered, so that if policies and<br />
the relevant actors fail to deliver, these people<br />
can raise their voice, demand their rights and<br />
seek to redress the situation.<br />
In a globalized world national policies<br />
for universal human development must be<br />
complemented and supplemented by a global<br />
system that is fair and that enriches human<br />
development.<br />
Reaching those left out using universal policies<br />
Appropriate reorientation of universal policies<br />
can narrow the deficits in human development<br />
among those left out. Essential to this are pursuing<br />
inclusive growth, enhancing opportunities<br />
for women, addressing lifecycle capabilies and<br />
mobilizing resources for human development<br />
priorities.<br />
Pursuing inclusive growth<br />
For human development to reach everyone,<br />
growth has to be inclusive, with four mutually<br />
supporting pillars —formulating an<br />
employment-led growth strategy, enhancing<br />
financial inclusion, investing in human development<br />
priorities and undertaking high- impact<br />
multidimensional interventions (win-win<br />
strategies).<br />
An employment-led growth strategy would<br />
focus on such measures as removing barriers to<br />
employment-centred development, designing<br />
and implementing a conducive regulatory framework<br />
to tackle informal work, strengthening the<br />
links between large and small and medium-size<br />
enterprises, focusing on sectors where poor<br />
people live and work, especially rural areas, and<br />
adjusting the distribution of capital and labour in<br />
public spending to create jobs.<br />
Several measures can enhance the financial<br />
inclusion of poor people, such as expanding<br />
banking services to disadvantaged and marginalized<br />
groups, relying on simple procedures<br />
and harnessing modern technology to<br />
promote financial inclusion. In Sub- Saharan<br />
Africa 12 percent of adults have mobile bank<br />
accounts, compared with 2 percent globally. 27<br />
Investments focused on human development<br />
priorities can provide low-cost but high-quality<br />
services and infrastructure to disadvantaged<br />
and marginalized groups.<br />
Effective access to services by poor people<br />
requires affordability in cost and adaptability<br />
in cultural practices. In Nicaragua low-cost<br />
ultrasonogram machines, which can be carried<br />
on bicycles, are monitoring the health of<br />
pregnant women. 28 The presence of only male<br />
doctors in rural mother and child care centres<br />
would be a disincentive for women and girls to<br />
use the centres.<br />
Some priority human development investments<br />
have strong and multiple impacts.<br />
Take school meal programmes, which provide<br />
multiple benefits: social protection by<br />
helping families educate their children and<br />
protect their children’s food security in times<br />
of crisis; nutrition, because in poor countries<br />
For human<br />
development to reach<br />
everyone, growth<br />
has to be inclusive<br />
Overview | 11
Because half of<br />
humanity is not<br />
enjoying progress in<br />
human development,<br />
such development<br />
is not universal<br />
school meals are often the only regular and<br />
nutritious meal; and strong incentive to<br />
send children to school and keep children<br />
in schools. Evidence from Botswana, Cabo<br />
Verde, Côte d’Ivoire, Ghana, Kenya, Mali,<br />
Namibia, Nigeria and South Africa bears<br />
testimony to these benefits. 29<br />
Rural infrastructure, especially roads and<br />
electricity, is another area. Building rural roads<br />
reduces transport costs, connects rural farmers<br />
to markets, allows workers to move more freely<br />
and promotes access to schools and health care<br />
clinics. Electrification in rural communities<br />
in Guatemala and South Africa has helped<br />
increase employment among marginalized<br />
groups. 30<br />
Redistributing assets can also bring those left<br />
out into the growth process. <strong>Human</strong> capital<br />
is an asset, and differences in educational attainment<br />
prevent poor people from becoming<br />
part of the high-productivity growth process.<br />
Democratizing education, particularly tertiary<br />
education, would benefit people from poorer<br />
backgrounds.<br />
Similarly, doing things locally may bring<br />
multiple development impacts. Providing autonomy<br />
to local governments in formulating<br />
and implementing local development plans<br />
allows the plans to reflect the aspirations of<br />
local communities. Fiscal decentralization can<br />
also empower local governments to collect<br />
their own revenues and depend less on central<br />
government grants. But if the local approach<br />
is to ensure human development for those left<br />
out, it will also require people’s participation<br />
and greater local administrative capacity.<br />
Enhancing opportunities for women<br />
Gender equality and women’s empowerment<br />
are fundamental dimensions of human development.<br />
Because half of humanity is not<br />
enjoying progress in human development, such<br />
development is not universal.<br />
Investing in girls and women has multidimensional<br />
benefits — for example, if all girls in developing<br />
countries completed secondary education,<br />
the under-five mortality rate would be halved. 31<br />
Women also need support to pursue higher education,<br />
particularly in science, technology, engineering<br />
and mathematics, where much future<br />
demand for high-level work will be.<br />
Women also have to juggle paid employment<br />
outside the home and unpaid care work inside<br />
the home as well as balance their productive<br />
and reproductive roles. Flexible working arrangements<br />
and enlarged care options, including<br />
daycare centres, afterschool programmes,<br />
senior citizen homes and long-term care facilities,<br />
can help women broaden their choices.<br />
Measures to encourage women’s entrepreneurship<br />
include establishing a legal framework<br />
that removes barriers to women owning land, a<br />
critical asset, especially in agriculture. So land<br />
policies, legislation and administration need to<br />
be changed to accommodate women — and the<br />
new rules must be enforced.<br />
The glass ceiling, though cracked in many<br />
places, is far from being shattered. Gender<br />
requirements in selection and recruitment<br />
and incentive mechanisms for retention can<br />
enhance women’s representation in the public<br />
and private sectors. The criteria for promoting<br />
men and women into senior management positions<br />
should be identical, based on equal pay<br />
for equal work. Mentoring, coaching and sponsoring<br />
can empower women in the workplace<br />
by using successful female senior managers as<br />
role models and as sponsors.<br />
Addressing lifecycle capabilities<br />
To ensure that human development reaches<br />
those left out, building capabilities should be<br />
seen through a lifecycle lens as people face various<br />
types of vulnerabilities in different phases<br />
of their lives.<br />
Sustained human development is more likely<br />
when all children can acquire the skills that<br />
match the opportunities open to young people<br />
joining the workforce. Much attention is correctly<br />
focused on what is needed to ensure that<br />
all children, everywhere, complete a full course<br />
of schooling, including preschooling. The<br />
World Bank has found that every dollar spent<br />
on preschool education earns $6–$17 in public<br />
benefits, in the form of a healthier and more<br />
productive workforce. 32 Ghana now includes<br />
two years of preschool in the education system.<br />
China is contemplating providing preschool<br />
facilities for all youngsters. 33<br />
Empowering young people requires actions<br />
on both the political and the economic fronts.<br />
On the political front at least 30 countries have<br />
12 | HUMAN DEVELOPMENT REPORT <strong>2016</strong>
FIGURE 6<br />
21st century skills<br />
Ways of thinking<br />
Tools for working<br />
Ways of working<br />
Skills for living in<br />
the world<br />
Creativity<br />
Critical thinking<br />
Problemsolving<br />
Decisionmaking<br />
Learning<br />
Information and<br />
communication<br />
technology<br />
Information literacy<br />
Communication<br />
Collaboration<br />
Citizenship<br />
Life and career<br />
Personal and social<br />
responsibility<br />
Source: <strong>Human</strong> <strong>Development</strong> <strong>Report</strong> Office.<br />
some kind of nonadult parliamentary structure,<br />
nationally or in cities, villages or schools. 34 So<br />
young people’s opinions in various forms of<br />
participation — in government-sponsored<br />
advisory roles, youth parliaments and roundtable<br />
discussions — are being integrated into<br />
policymaking.<br />
On the economic front creating new opportunities<br />
for young people and preparing<br />
young people with the skills they need to take<br />
advantage of the opportunities are required.<br />
More than one-third of the skills important in<br />
today’s economy will have changed by 2020. 35<br />
Acquiring skills for the 21st century has to<br />
be part of lifelong learning of the four C’s —<br />
critical thinking, collaborating, creating and<br />
communicating (figure 6).<br />
For the aged and infirm, key measures include<br />
establishing a combination of public and<br />
private provisioning of elder care, strengthening<br />
social protection for older people through<br />
basic noncontributory social pensions (as in<br />
Brazil) 36 and creating opportunities for the<br />
older people to work where they can contribute,<br />
including teaching children, care work and<br />
voluntary work.<br />
Mobilizing resources for human<br />
development priorities<br />
Options for mobilizing resources for human<br />
development priorities range from creating<br />
fiscal space to using climate finance, and from<br />
cutting subsidies not beneficial to poor people<br />
to using resources efficiently.<br />
Fiscal space has four pillars: official development<br />
assistance, domestic revenue, deficit<br />
financing (through domestic and external borrowing)<br />
and variations in spending priorities<br />
and efficiency. The choice of which pillar to<br />
use to increase or rebuild fiscal space depends<br />
mainly on country characteristics. In 2009<br />
Ghana considered improving revenue collection<br />
to increase the health budget, even though<br />
the share of the total government budget allocated<br />
to health was stable. 37<br />
Consolidating and streamlining remittances<br />
could make them a funding source for human<br />
development priorities. Remittance banks can<br />
be set up in countries where the flows are large,<br />
such as Bangladesh, Jordan and the Philippines.<br />
Easy and transparent legal remittance-sending<br />
mechanisms can be put in place in consultation<br />
with host countries.<br />
In the least developed countries, where<br />
emissions are low, climate finance can expand<br />
climate-resilient livelihoods, improve water and<br />
sanitation systems and ensure food security.<br />
These investments go beyond climate adaptation<br />
programmes in the narrow sense and focus<br />
more on achieving human development by<br />
increasing the long-term climate resilience of<br />
economies and societies.<br />
Ending subsidies for fossil fuels can free resources<br />
for human development. And efficiency<br />
in resource use is equivalent to generating additional<br />
resources. For example, telemedicine can<br />
deliver medical advice and treatment options<br />
to patients irrespective of their location — and<br />
reduce the cost of service provision.<br />
Options for mobilizing<br />
resources for human<br />
development priorities<br />
range from creating<br />
fiscal space to using<br />
climate finance, and<br />
from cutting subsidies<br />
not beneficial to<br />
poor people to using<br />
resources efficiently<br />
Overview | 13
Pursuing measures for groups with special needs<br />
Marginalized groups<br />
often face similar<br />
constraints, such as<br />
discrimination. But<br />
each group also has<br />
special needs that<br />
must be met if they<br />
are to benefit from<br />
progress in human<br />
development<br />
Because some social groups (ethnic minorities,<br />
indigenous peoples, persons with disabilities)<br />
are systematically discriminated against and<br />
thereby left out, specific measures are needed so<br />
they may achieve equitable outcomes in human<br />
development.<br />
Using affirmative action<br />
Affirmative action has been important in redressing<br />
historical and persistent group disparities<br />
and group discriminations. It may take the<br />
form of enrolment quotas for ethnic minorities<br />
in tertiary education or preferential treatment<br />
of female entrepreneurs in obtaining subsidized<br />
credit through the banking system.<br />
Affirmative action has made a difference<br />
in women’s representation in parliament.<br />
Following the Beijing Declaration and Platform<br />
for Action at the United Nations Fourth World<br />
Conference in 1995, some countries adopted<br />
a gender quota to increase the proportion of<br />
seats held by women, providing confidence and<br />
incentives for women to run for elected office<br />
and win. Rwanda, where women account for<br />
64 percent of representatives in the House of<br />
Deputies, is a shining example. 38<br />
Promoting human development<br />
for marginalized groups<br />
Despite the great diversity in identities and<br />
needs, marginalized groups such as ethnic<br />
minorities, indigenous peoples, persons with<br />
disabilities, people living with HIV and<br />
AIDS, and lesbian, gay, bisexual, transgender<br />
and intersex individuals often face similar<br />
constraints, such as discrimination, social<br />
stigma and risk of being harmed. But each<br />
group also has special needs that must be met<br />
if they are to benefit from progress in human<br />
development.<br />
For some vulnerable groups, such as ethnic<br />
minorities or persons with disabilities, antidiscrimination<br />
and other rights are guaranteed<br />
in constitutions and other legislation. Similarly,<br />
special provisions often protect indigenous<br />
peoples, as in Canada and New Zealand. 39<br />
Yet in many cases effective mechanisms for<br />
implementation and full equality in law are<br />
lacking. National human rights commissions<br />
or commissions for specific groups can provide<br />
oversight and ensure that the rights of these<br />
groups are not violated. And overcoming the<br />
discrimination and abuse of members of the<br />
lesbian, gay, bisexual, transgender and intersex<br />
community requires a legal framework that can<br />
defend their human rights.<br />
Participation in the processes that shape the<br />
lives of disadvantaged groups needs to be ensured.<br />
For example, quotas for ethnic minorities<br />
and representation of indigenous peoples in<br />
parliaments are ways to help them raise their<br />
concerns. Some indigenous peoples have their<br />
own parliaments or councils, which are consultative<br />
bodies. New Zealand has the longest history<br />
of indigenous representation in a national<br />
legislature. 40<br />
For persons with disabilities, inclusion and<br />
accommodation are critical to empowering<br />
them to live independently, find employment<br />
and contribute to society. Specific vocational<br />
training initiatives should be undertaken to<br />
develop their skills. Increasing access to productive<br />
resources, such as finance for self-employment,<br />
and providing information over<br />
mobile devices can help them in self-employment.<br />
Appropriate infrastructure including<br />
technology can enable persons with disabilities<br />
to be more mobile.<br />
Migrants and refugees are vulnerable in host<br />
countries, and national actions are needed to<br />
address the new nature of migration and its<br />
evolution. Countries should pass laws that<br />
protect refugees, particularly women and<br />
children, a big part of the refugee population<br />
and the main victims. Transit and destination<br />
countries should provide essential public goods<br />
in catering to the displaced, such as schooling<br />
refugee children. And destination countries<br />
should formulate temporary work policies and<br />
provisions for refugees.<br />
14 | HUMAN DEVELOPMENT REPORT <strong>2016</strong>
Making human development resilient<br />
Progress in human development often stagnates<br />
or dissipates if threatened by shocks<br />
— such as global epidemics, climate change,<br />
natural disasters, violence and conflicts.<br />
Vulnerable and marginalized people are major<br />
victims.<br />
Addressing epidemics,<br />
shocks and risks<br />
Much progress has been made in scaling up<br />
antiretroviral therapy, but 18 million people<br />
living with HIV still do not have access to<br />
it. 41 Young women, who may be exposed to<br />
gender-based violence and have limited access<br />
to information and health care, are among the<br />
most exposed, as are prisoners, sex workers,<br />
drug users and transgender people. Still, there<br />
have been successes in reducing infection rates<br />
among women and children and in expanding<br />
their access to treatment.<br />
In an increasingly interconnected world,<br />
being prepared for possible health crises<br />
has become a priority. The recent epidemic<br />
of the Zika virus provides a good example.<br />
Countries have reacted in different ways<br />
to the spread of the Zika virus. Countries<br />
with an ongoing virus transmission, such<br />
as Colombia, the Dominican Republic,<br />
Ecuador and Jamaica, have advised women to<br />
postpone pregnancy. 42 In Brazil a new mosquito<br />
strain was released to try to fight the<br />
Zika virus, and members of the armed forces<br />
were sent across the country to educate<br />
people about mosquito control and to warn<br />
them of the risks linked to the virus. 43<br />
More recently, the revised strategic response<br />
plan designed by the World Health<br />
Organization in collaboration with more than<br />
60 partners focuses on research, detection, prevention,<br />
and care and support. 44<br />
Building disaster resilience into policies and<br />
programmes at all levels can reduce the risk<br />
and mitigate the effects of disasters, particularly<br />
for poor people. Innovative programmes<br />
are at the heart of the Sendai Framework for<br />
Disaster Risk Reduction endorsed by the UN<br />
General Assembly following the 2015 Third<br />
UN World Conference on Disaster Risk<br />
Reduction.<br />
Combating violence and<br />
ensuring people’s security<br />
The drivers of violence are complex and thus<br />
call for a multipronged approach that includes<br />
promoting the rule of law based on fairness and<br />
zero tolerance for violence; strengthening local<br />
governments, community policing and law<br />
enforcement personnel in hotspots of violence;<br />
and developing response and support services<br />
to address violence and its victims.<br />
Viable policy options include developing<br />
high-quality infrastructure, improving public<br />
transit in high-crime neighbourhoods, building<br />
better housing in the poorest areas of cities and<br />
providing socioeconomic alternatives to violence,<br />
particularly to young people, engaging<br />
them in strengthening social cohesion.<br />
Maintaining human well-being<br />
in postconflict situations<br />
On the political front transformation of institutions<br />
is key. It would ensure people’s security<br />
through community policing, pursuing rapid<br />
governance actions (such as faster caseload<br />
processing) and reintegrating ex-combatants<br />
by disarming and demobilizing them.<br />
On the economic front reviving basic social<br />
services, supporting work in the health sector<br />
to cover many goals, initiating public works<br />
programmes and formulating and implementing<br />
targeted community-based programmes<br />
(such as makeshift schools so that children do<br />
not lose access education) are key for moving<br />
forward on the development continuum.<br />
Addressing climate change<br />
Climate change jeopardizes the lives and<br />
livelihoods of poor and marginalized people.<br />
Addressing it requires three initial policy<br />
measures. Putting a price on carbon pollution<br />
— through an emissions trading system or a<br />
carbon tax—brings down emissions and drives<br />
investment into cleaner options. Approximately<br />
40 countries and more than 20 cities, states and<br />
provinces use carbon pricing. 45<br />
Taxing fuel, removing fossil fuel subsidies and<br />
incorporating “social cost of carbon” regulations<br />
Progress in human<br />
development often<br />
stagnates or dissipates<br />
if threatened by<br />
shocks. Vulnerable and<br />
marginalized people<br />
are major victims<br />
Overview | 15
are more indirect ways of accurately pricing<br />
carbon. By phasing out harmful fossil fuel subsidies,<br />
countries can reallocate their spending<br />
to where it is most needed and most effective,<br />
including targeted support for poor people.<br />
Getting prices right is only one part of the<br />
equation. Cities are growing fast, particularly<br />
in developing countries. With careful planning<br />
in transport and land use and the establishment<br />
of energy efficiency standards, cities can<br />
avoid locking in unsustainable patterns. They<br />
can open access to jobs and opportunities for<br />
poor people, while reducing air pollution.<br />
Increasing energy efficiency and renewable<br />
energy is crucial. The Sustainable Energy for All<br />
initiative sets out three goals for 2030: achieve<br />
universal access to modern energy, double the<br />
rate of improvement in energy efficiency and<br />
double the share of renewable energy in the<br />
global energy mix. In many countries developing<br />
utility-scale renewable energy is now cheaper<br />
than, or on par with, fossil-fuel plants. 46<br />
Climate-smart agricultural techniques help<br />
farmers increase their productivity and resilience<br />
to the impacts of climate change while<br />
creating carbon sinks that reduce net emissions.<br />
Forests, the world’s lungs, absorb carbon and<br />
store it in soils, trees and foliage.<br />
Focusing on the poverty–environment nexus,<br />
which is complex but critical for marginalized<br />
people, is also important. Poor people<br />
bear the brunt of environmental damage, even<br />
though they seldom create it. Policies that protect<br />
community commons (such as common<br />
forests), ensure the rights and entitlements of<br />
poor people and provide renewable energy to<br />
poor people would improve biodiversity on<br />
which poor people’s lives depend and reverse<br />
the downward spiral of poverty and environmental<br />
damage.<br />
Promoting social protection<br />
Policy options to expand social protection to<br />
marginalized groups include pursuing social<br />
protection programmes, combining social protection<br />
with appropriate employment strategies<br />
and providing a living income.<br />
A social protection floor can secure minimum<br />
health care, pensions and other social<br />
rights for everyone. Creating jobs through a<br />
public works programme can reduce poverty<br />
through income generation, build physical<br />
infrastructure and protect poor people against<br />
shocks. The Rural Employment Opportunities<br />
for Public Assets programme in Bangladesh is a<br />
prime example. 47<br />
A guaranteed basic income for citizens, independent<br />
of the job market, is also a policy option<br />
that countries (such as Finland 48 ) are experimenting<br />
with as an instrument for social protection,<br />
particularly for disadvantaged groups.<br />
People will have to<br />
be empowered by<br />
upholding human<br />
rights, ensuring access<br />
to justice, promoting<br />
inclusion and ensuring<br />
accountability<br />
Empowering those left out<br />
If policies do not deliver well-being to marginalized<br />
and vulnerable people and if institutions<br />
fail to ensure that people are not left out, there<br />
must be instruments and redress mechanisms<br />
so that these people can claim their rights. They<br />
have to be empowered by upholding human<br />
rights, ensuring access to justice, promoting<br />
inclusion and ensuring accountability.<br />
Upholding human rights<br />
<strong>Human</strong> development for all requires strong<br />
national human rights institutions with the capacity,<br />
mandate and will to address discrimination<br />
and ensure the protection of human rights.<br />
<strong>Human</strong> rights commissions and ombudsmen<br />
handle complaints about rights abuses, educate<br />
civil society and states about human rights and<br />
recommend legal reforms.<br />
But state commitments to upholding these<br />
rights vary, national institutions have different<br />
implementation capacities, and accountability<br />
mechanisms are sometimes missing.<br />
Institutional shortcomings aside, treating<br />
development as a human right has been instrumental<br />
in reducing deprivations in some<br />
dimensions and contexts.<br />
In an integrated world the state-centred<br />
model of accountability must be extended to<br />
the obligations of nonstate actors and to the<br />
state’s obligations beyond national borders.<br />
<strong>Human</strong> rights cannot be realized universally<br />
without well established domestic mechanisms<br />
and stronger international action.<br />
16 | HUMAN DEVELOPMENT REPORT <strong>2016</strong>
Ensuring access to justice<br />
Access to justice is the ability of people to seek<br />
and obtain remedy through formal or informal<br />
judicial institutions.<br />
Poor and disadvantaged people face immense<br />
obstacles, including their lack of awareness and<br />
legal knowledge, compounded by structural<br />
and personal alienation. Poor people lack adequate<br />
access to public services, which are often<br />
expensive and cumbersome and have few resources,<br />
personnel and facilities. Police stations<br />
and courts may not be available in remote areas,<br />
and poor people can rarely afford the cost of<br />
legal processes. Quasi-judicial mechanisms may<br />
also be inaccessible or prejudicial.<br />
Obstacles to justice for indigenous peoples<br />
and for racial and ethnic minorities stem from<br />
their historically subordinate status and from<br />
sociopolitical systems that reinforce bias in the<br />
legal framework and the justice system.<br />
Promoting inclusion<br />
<strong>Human</strong> development for everyone requires<br />
inclusion of all in the development discourse<br />
and process.<br />
New global forms and methods of organization<br />
and communication are facilitated by<br />
technology and social media. They have mobilized<br />
grassroots activism and brought in people<br />
and groups to voice their opinions, as through<br />
cyberactivism. Improving the quality and scope<br />
of citizen engagement in public institutions<br />
involves civic education, capacity development<br />
and political dialogue.<br />
Ensuring accountability<br />
Accountability is central to ensuring that human<br />
development reaches everyone, especially<br />
in protecting the rights of those excluded.<br />
One major instrument for ensuring accountability<br />
of social institutions is the right<br />
to information. Since the 1990s more than 50<br />
countries have adopted new instruments that<br />
protect the right to information, often due to<br />
democratic transitions and to the active participation<br />
of civil society organizations in public<br />
life. 49<br />
The right to information requires the freedom<br />
to use that information to form public opinions,<br />
call governments to account, participate in decisionmaking<br />
and exercise the right to freedom<br />
of expression. Information and communication<br />
technology is increasingly being used to ensure<br />
accountability.<br />
Participatory exercises to hold state institutions<br />
accountable, such as public expenditure tracking<br />
surveys, citizen report cards, score cards, social<br />
audits and community monitoring, have all been<br />
used to develop direct accountability relationships<br />
between service users and service providers.<br />
Global institutional reforms and a fairer multilateral system<br />
would help attain human development for everyone<br />
We live in a globalized world where human development<br />
outcomes are determined not only<br />
by actions at the national level, but also by the<br />
structures, events and work at the global level.<br />
The shortcomings in the current architecture<br />
of global systems pose challenges for human<br />
development on three fronts. The distributional<br />
consequences of inequitable globalization<br />
have promoted the progress of some segments<br />
of the population, leaving poor and vulnerable<br />
people out. Globalization is also making those<br />
left out economically insecure. And people<br />
are suffering in lingering conflicts. In short,<br />
all these undermine and limit national efforts<br />
and pose as barriers to human development for<br />
everyone.<br />
Global institutional reforms should encompass<br />
the broader areas of regulation of global<br />
markets, the governance of multilateral institutions<br />
and the strengthening of global civil society<br />
with each area reflecting specific actions.<br />
Stabilizing the global economy<br />
Reforms should focus on regulating currency<br />
transactions and capital flows and coordinating<br />
macroeconomic policies and regulations. One<br />
option is a multilateral tax on cross-border<br />
Global institutional<br />
reforms should<br />
encompass the<br />
broader areas<br />
of regulation of<br />
global markets,<br />
the governance of<br />
multilateral institutions<br />
and the strengthening<br />
of global civil society<br />
Overview | 17
The time has come<br />
to examine the<br />
representation,<br />
transparency and<br />
accountability of<br />
multilateral institutions<br />
transactions; another is the use of capital controls<br />
by individual countries.<br />
Applying fair trade and<br />
investment rules<br />
The international agenda should be to set rules to<br />
expand trade in goods, services and knowledge to<br />
favour human development and the Sustainable<br />
<strong>Development</strong> Goals. The key reforms to advance<br />
this agenda include finalizing the World Trade<br />
Organization’s Doha Round, reforming the<br />
global intellectual property rights regime and<br />
reforming the global investor protection regime.<br />
Adopting a fair system of migration<br />
Measures are needed to strengthen strategies<br />
that protect the rights of and promote the opportunities<br />
for migrants, to establish a global<br />
mechanism to coordinate economic (voluntary)<br />
migration and to facilitate guaranteed asylum<br />
for forcibly displaced people. The International<br />
Organization for Migration officially joined the<br />
UN System in September <strong>2016</strong>, and its work<br />
and actions are expected to expand and advance.<br />
Assuring greater equity and legitimacy<br />
of multilateral institutions<br />
The time has come to examine the representation,<br />
transparency and accountability of multilateral<br />
institutions. Some policy options to move these<br />
institutions towards greater equity and legitimacy<br />
are increasing the voice of developing countries<br />
in multilateral organizations, improving<br />
transparency in appointing heads of multilateral<br />
organizations and increasing coordination and<br />
effectiveness to achieve people-centred goals.<br />
Coordinating taxes and<br />
monitoring finance globally<br />
A move towards a global automatic exchange of<br />
information (such as a global financial register)<br />
would facilitate the work of tax and regulatory<br />
authorities tracking income and detecting illicit<br />
financial flows, which may be mobilized for human<br />
development. This would require increasing<br />
technical capacity of countries to process information<br />
and implement active policies against tax<br />
evasion, tax avoidance and illicit flows.<br />
Making the global economy sustainable<br />
Sustainable development activities at the national<br />
level must be complemented with global actions.<br />
Curbing global warming is possible. Coordinated<br />
global action has worked well in the past, as in<br />
moves to halt ozone depletion in the 1990s.<br />
Continuing advocacy and communication on<br />
the need to address climate change and protect<br />
the environment are essential to gather support<br />
from various stakeholders (including multilateral<br />
development banks). The recently created<br />
New <strong>Development</strong> Bank has explicitly committed<br />
to giving priority to clean energy projects.<br />
Ensuring well funded<br />
multilateralism and cooperation<br />
Multilateral and regional development banks<br />
can do more to address several challenges of<br />
globalization. Increasing official development<br />
assistance from traditional donors, expanding<br />
the participation of developing countries<br />
through South–South and triangular cooperation,<br />
and exploring innovative options for<br />
financing would be useful.<br />
Globally defending people’s security<br />
From a human development perspective, assistance<br />
in human emergencies and crises is an<br />
ethical obligation. In such cases, proposed solutions<br />
include restructuring current mechanisms<br />
towards prevention in addition to short-term<br />
responses to shocks, prioritizing field operations<br />
and coordinating better internally and externally<br />
with civil society and the private sector.<br />
Promoting greater and better<br />
participation of global civil society<br />
Tapping civil society’s potential requires expanding<br />
mechanisms for it to participate in<br />
multilateral institutions; enhancing the transparency<br />
and accountability of multilateral institutions;<br />
promoting and supporting inclusive<br />
global civil society networks focused on such<br />
groups as women, young people and ethnic minorities;<br />
increasing the free flow of information<br />
and knowledge through active transparency<br />
mechanisms; and protecting the work of international<br />
investigative journalism.<br />
18 | HUMAN DEVELOPMENT REPORT <strong>2016</strong>
An action agenda<br />
<strong>Human</strong> development for everyone is not a<br />
dream; it is a realizable goal. We can build on<br />
what we have achieved. We can explore new<br />
possibilities to overcome challenges. We can<br />
attain what once seemed unattainable, for what<br />
seem to be challenges today can be overcome<br />
tomorrow. Realizing our hopes is within our<br />
reach. His Excellency Juan Manuel Santos,<br />
President of Colombia and the <strong>2016</strong> Nobel<br />
Peace Prize Laureate confirms the hope of attaining<br />
a peaceful and prosperous world (see<br />
special contribution).<br />
The 2030 Agenda and the Sustainable<br />
<strong>Development</strong> Goals are critical steps towards<br />
human development for everyone. Building on<br />
its analysis and findings, the <strong>Report</strong> suggests<br />
a five-point action agenda to ensure human<br />
development for everyone. The actions cover<br />
policy issues and global commitments.<br />
Identifying those who face<br />
human development deficits<br />
and mapping where they are<br />
Identifying those who have been left out<br />
of the progress in human development and<br />
mapping their locations are essential for<br />
useful advocacy and effective policymaking.<br />
Such mapping can help development activists<br />
demand action and guide policymakers in<br />
formulating and implementing policies to<br />
improve the well-being of marginalized and<br />
vulnerable people.<br />
Pursuing a range of available<br />
policy options with coherence<br />
<strong>Human</strong> development for everyone requires a<br />
multipronged set of national policy options:<br />
reaching those left out using universal policies,<br />
pursuing measures for groups with specialneeds,<br />
making human development resilient<br />
and empowering those left out.<br />
Country situations differ, so policy options<br />
have to be tailored to each country. Policies in<br />
every country have to be pursued in a coherent<br />
way through multistakeholder engagement, local<br />
and subnational adaptations and horizontal<br />
(across silos) and vertical alignment (for international<br />
and global consistency).<br />
Closing the gender gap<br />
Gender equality and women’s empowerment<br />
are fundamental dimensions of human development.<br />
Gender gaps exist in capabilities as well as<br />
opportunities, and progress is still too slow for<br />
realizing the full potential of half of humanity.<br />
At a historic gathering in New York in<br />
September 2015 some 80 world leaders committed<br />
to end discrimination against women by<br />
2030 and announced concrete and measurable<br />
actions to kickstart rapid changes. 50 Now is the<br />
time to act on what has been promised and<br />
agreed.<br />
Implementing the Sustainable<br />
<strong>Development</strong> Goals and other<br />
global agreements<br />
The Sustainable <strong>Development</strong> Goals, critical in<br />
their own right, are also crucial for human development<br />
for everyone; the 2030 Agenda and<br />
the human development approach are mutually<br />
reinforcing. Further, achieving the Sustainable<br />
<strong>Development</strong> Goals is an important step for all<br />
human beings to realize their full potential in life.<br />
The historic Paris Agreement on climate<br />
change is the first to consider both developed<br />
and developing countries in a common<br />
framework, urging them all to make their best<br />
efforts and reinforce their commitments in the<br />
coming years. The UN Summit for Refugees in<br />
September <strong>2016</strong> made bold commitments to<br />
address the issues facing refugees and migrants<br />
and to prepare for future challenges. The international<br />
community, national governments<br />
and all other parties must ensure that the<br />
agreements are honoured, implemented and<br />
monitored.<br />
Working towards reforms<br />
in the global system<br />
To move towards a fairer global system, the<br />
agenda for global institutional reforms should<br />
focus on global markets and their regulation,<br />
on the governance of multilateral institutions<br />
and on the strengthening of global civil society.<br />
That reform agenda should be advocated vigorously<br />
and consistently by bolstering public advocacy,<br />
building alliances among stakeholders<br />
and pushing through the agenda for reform.<br />
The 2030 Agenda<br />
and the Sustainable<br />
<strong>Development</strong> Goals are<br />
critical steps towards<br />
human development<br />
for everyone<br />
Overview | 19
SPECIAL CONTRIBUTION<br />
Peace in Colombia is also peace for the world<br />
In Colombia we are more determined than ever to end the longest running<br />
and only remaining internal armed conflict in the Americas.<br />
Colombians were divided over the agreement that was negotiated<br />
between the Government and the FARC guerrillas. And so, we undertook<br />
efforts to reach a new peace accord that would dispel doubts and garner<br />
nationwide support. Almost simultaneously we announced the beginning of<br />
peace talks with the ELN, the last remaining guerrillas. We hope this will<br />
bring a definitive end to the armed conflict in our country.<br />
For five decades the war has had a very high price for Colombia and has,<br />
undoubtedly, hurt the nation’s prospect. A study by Los Andes University<br />
estimates that households who have been victims of forced displacement<br />
and violence saw their income reduced by half. This is exacerbated when<br />
one considers that these people are likely to have difficulty recovering and<br />
are at risk of living in conditions of chronic poverty.<br />
Beyond the effect on our economy, the greatest impact of the war falls<br />
on 250,000 or more casualties — and their families — and the 8 million victims<br />
and internally displaced people. Every life lost, as well as each and<br />
every one of the personal and family tragedies of those who were affected<br />
by the armed conflict and survived, both saddens us and also strengthens<br />
our commitment.<br />
We agree with the spirit of this <strong>Human</strong> <strong>Development</strong> <strong>Report</strong>, which is<br />
that the “wealth of human lives” must be considered before the wealth of<br />
economies when judging the prosperity of society. In that sense we understand<br />
that peace is a basic condition for enriching the lives of Colombians.<br />
And I am referring to a broader concept of peace that transcends the end of<br />
the conflict and brings harmony and well-being.<br />
A family with insufficient income does not live in peace, nor does a<br />
family without decent housing or access to education. This is why we have<br />
focused on fostering economic growth that benefits everyone and that reduces<br />
social gaps.<br />
The progress we have made to date is in line with the Sustainable<br />
<strong>Development</strong> Goals that Colombia championed and began working towards,<br />
even before they were adopted by the United Nations. Indeed, we were the<br />
first country to include these goals in our National <strong>Development</strong> Plan.<br />
Thanks to our early efforts, we have been able to reap the benefits of<br />
our work ahead of schedule. For example, over the past five years we have<br />
reduced extreme poverty by nearly half — from 14.4 percent to 7.9 percent<br />
— a very significant achievement that allows us to envisage its eradication<br />
by 2025, if not sooner.<br />
That jump, beyond the numbers, means that millions of Colombians<br />
have improved their quality of life. We are certain of this because, together<br />
with traditional income-based measures of poverty, we have pioneered the<br />
Multidimensional Poverty Index, which assesses other variables, such as access<br />
to public services or the type of family housing. Today, without a doubt,<br />
more Colombians have a better life.<br />
We have also made early progress in the quality of education —<br />
another of the Sustainable <strong>Development</strong> Goals. Not only do all children and<br />
young people study in public schools for free, we are increasing their class<br />
hours and improving the quality of learning through different programmes<br />
and initiatives. As a result of these efforts, our students have significantly<br />
improved the average scores on tests that measure their knowledge and<br />
skills.<br />
With our focus on peacebuilding, the emphasis on education is perhaps<br />
the best example of what we can do in this new phase without the burden<br />
of the armed conflict. For the first time ever, the education budget is greater<br />
than that for security and defence, which is consistent with our goal to become<br />
the most educated country in Latin America by the year 2025.<br />
Peace, equity and education are three areas that Colombians have been<br />
deprived of historically. Peace, equity and education have been the three<br />
pillars of our main efforts over the past few years.<br />
However, if our goal is to achieve “human development for everyone,”<br />
our efforts cannot stop here: Climate change is the greatest threat ever<br />
faced by humankind.<br />
In this regard Colombia has decided to play an active part in tackling<br />
this phenomenon. As guardians of one of the most biodiverse regions on the<br />
planet, with exceptional forests, water resources and soil fertility, we have<br />
an enormous responsibility to both Colombians and the world.<br />
The concept of “green growth” is part of our economic development<br />
model and has been mainstreamed into all sectors of the economy. We<br />
are convinced that growth and environmental sustainability are perfectly<br />
compatible. In addition, the demarcation of our paramos (moorland ecosystems)<br />
and the declaration of protected areas — which by 2018 should<br />
reach 19 million hectares, an area larger than Uruguay — are proof of our<br />
resolve.<br />
Under the Paris Agreement on climate change, Colombia has set out a<br />
goal: to reduce projected greenhouse gas emissions by 20 percent by 2030.<br />
And we have already begun to take decisive action to achieve this ambitious<br />
objective: We have presented a bill to Congress for the creation of a carbon<br />
tax on various fuels. We will be the first Latin American country — and one<br />
of the first in the world — to apply such a measure. With this single initiative<br />
we expect to meet half of our commitment established in the Paris Climate<br />
Change Conference.<br />
Peace — understood, as I mentioned before, in the broader sense of<br />
well-being and harmony — opens the door to the possibility of a viable world<br />
for future generations, one in which their very existence is not threatened<br />
by global warming. We are proud to confirm that these efforts, in addition to<br />
the end of the armed conflict, improved education and increased equity, are<br />
a contribution to the world.<br />
With the end to the conflict, people from around the globe can enjoy<br />
the natural wonders and tourism in Colombia, which had been restricted for<br />
20 | HUMAN DEVELOPMENT REPORT <strong>2016</strong>
SPECIAL CONTRIBUTION<br />
decades — even for Colombians themselves. Also, foreign business people<br />
can discover new opportunities in sectors and regions that were previously<br />
off limits because of violence.<br />
In terms of equity we are strengthening the middle class that will create<br />
an opportunity for investors in search of new markets. And with quality<br />
education we are preparing a new generation that in the future will be able<br />
to put its skills and knowledge into practice anywhere in the world.<br />
“<strong>Human</strong> development for everyone” is a commitment that transcends<br />
our country, and we want our work to impact and enrich the lives of citizens<br />
from other nations. Similarly, we feel that the support of the international<br />
community has had a positive impact on Colombians. We are convinced<br />
that, in a spirit of solidarity and collaboration, we will continue working<br />
together, Colombians and non-Colombians, to build peace in Colombia and<br />
peace for the rest of the world.<br />
Juan Manuel Santos<br />
President of Colombia and <strong>2016</strong> Nobel Peace Prize Laureate<br />
* * *<br />
From a human development perspective,<br />
we want a world where all human beings have<br />
the freedom to realize their full potential in<br />
life so they can attain what they value. In the<br />
ultimate analysis, development is of the people,<br />
by the people and for the people. People have<br />
to partner with each other. There needs to be<br />
a balance between people and the planet. And<br />
humanity has to strive for peace and prosperity.<br />
<strong>Human</strong> development requires recognizing that<br />
every life is equally valuable and that human<br />
development for everyone must start with<br />
those farthest behind.<br />
The <strong>2016</strong> <strong>Human</strong> <strong>Development</strong> <strong>Report</strong> is<br />
an intellectual contribution to resolving these<br />
issues. We strongly believe that only after they<br />
are resolved will we all reach the end of the road<br />
together. And when we look back, we will see<br />
that no one has been left out.<br />
Overview | 21
Chapter 1<br />
<strong>Human</strong> development —<br />
achievements,<br />
challenges and hopes
Infographic 1.1 The world we want<br />
People<br />
End poverty and<br />
hunger in all forms<br />
and ensure dignity<br />
and equality<br />
Prosperity<br />
Ensure prosperity<br />
and fulfilling lives in<br />
harmony with nature<br />
Planet<br />
Protect our<br />
planet’s natural<br />
resources and<br />
climate for future<br />
generations<br />
The world<br />
we want<br />
Peace<br />
Foster peaceful,<br />
just and<br />
inclusive societies<br />
Partnership<br />
Implement the agenda<br />
through a solid<br />
global partnership
1.<br />
<strong>Human</strong> <strong>Development</strong><br />
<strong>Report</strong> <strong>2016</strong><br />
<strong>Human</strong> <strong>Development</strong> for Everyone<br />
<strong>Human</strong> development — achievements,<br />
challenges and hopes<br />
<strong>Human</strong> development is all about people — expanding their freedoms, enlarging their choices, enhancing their capabilities<br />
and improving their opportunities. It is a process as well as an outcome. Economic growth and income are means to human<br />
development but not ends in themselves — because it is the richness of people’s lives, not the richness of economies, that<br />
ultimately is valuable to people. With such a simple but powerful notion, the first <strong>Human</strong> <strong>Development</strong> <strong>Report</strong>, appearing<br />
in 1990, put people at the centre of the development discourse, changing the lens for assessing development policies and<br />
outcomes (box 1.1). 1<br />
Over the ensuing 10 years the <strong>Human</strong><br />
<strong>Development</strong> <strong>Report</strong>s extended the frontiers<br />
of thought leadership, public policy advocacy<br />
and influence on development agendas. The<br />
1994 <strong>Human</strong> <strong>Development</strong> <strong>Report</strong> introduced<br />
the notion of human security, going<br />
beyond the traditional concept of national<br />
and territorial security. 2 The 1995 <strong>Human</strong><br />
<strong>Development</strong> <strong>Report</strong> —which strongly argued<br />
that development, if not engendered, is endangered—contributed<br />
to the Beijing Declaration<br />
and Platform of Action at the Fourth World<br />
Conference on Women. 3 The 1997 <strong>Human</strong><br />
<strong>Development</strong> <strong>Report</strong> introduced a multidimensional<br />
concept of poverty, known as<br />
human poverty, and an associated composite<br />
measure — the <strong>Human</strong> Poverty Index, an analytical<br />
breakthrough to elevate the discussion of<br />
human deprivations beyond income poverty. 4<br />
In addition to contributing to development<br />
thinking, these reports, with their policy<br />
recommendations and innovative data presentations,<br />
had policy impacts. The proposal<br />
to create Honesty International in the 1992<br />
<strong>Human</strong> <strong>Development</strong> <strong>Report</strong> led to the establishment<br />
of Transparency International. 5<br />
And the disaggregation of Egypt’s <strong>Human</strong><br />
<strong>Development</strong> Index (HDI) value in the<br />
1994 <strong>Human</strong> <strong>Development</strong> <strong>Report</strong> led to<br />
an increased allocation of public resources to<br />
Upper Egypt, a less well developed area of the<br />
country. 6<br />
At the turn of the century 189 heads<br />
of state and government endorsed the<br />
Millennium Declaration and the Millennium<br />
<strong>Development</strong> Goals to overcome basic<br />
human deprivations by 2015, all solidly anchored<br />
in the human development approach.<br />
The <strong>Human</strong><br />
<strong>Development</strong> <strong>Report</strong>s<br />
have extended the<br />
frontiers of thought<br />
leadership, public<br />
policy advocacy<br />
and influence on<br />
development agendas<br />
BOX 1.1<br />
<strong>Human</strong> development — a people-centred approach<br />
<strong>Human</strong> development is about acquiring more capabilities<br />
and enjoying more opportunities to use those capabilities.<br />
With more capabilities and opportunities,<br />
people have more choices, and expanding choices is at<br />
the core of the human development approach. But human<br />
development is also a process. Anchored in human<br />
rights, it is linked to human security. And its ultimate<br />
objective is to enlarge human freedoms.<br />
<strong>Human</strong> development is development of the people<br />
through the building of human resources, for the people<br />
through the translation of development benefits in their<br />
lives and by the people through active participation in the<br />
processes that influence and shape their lives. Income is<br />
a means to human development but not an end in itself.<br />
The human development approach in the 1990<br />
<strong>Human</strong> <strong>Development</strong> <strong>Report</strong> also introduced a composite<br />
index, the <strong>Human</strong> <strong>Development</strong> Index (HDI), for assessing<br />
achievements in the basic dimensions of human<br />
development. Those dimensions of human development<br />
are to lead a long and healthy life, measured by life expectancy<br />
at birth; to acquire knowledge, measured by<br />
mean years of schooling and expected years of schooling;<br />
and to achieve a decent standard of living, measured<br />
by gross national income per capita.<br />
Source: <strong>Human</strong> <strong>Development</strong> <strong>Report</strong> Office.<br />
Chapter 1 <strong>Human</strong> development — achievements, challenges and hopes | 25
Every developing<br />
region’s HDI value<br />
increased considerably<br />
between 1990 and<br />
2015, although<br />
progress has been<br />
slowing since 2010<br />
During the last decade <strong>Human</strong> <strong>Development</strong><br />
<strong>Report</strong>s covered such themes as deepening<br />
democracy (2002), cultural diversity (2004),<br />
climate change (2008), sustainability and equity<br />
(2011) and work for human development<br />
(2015). 7<br />
The global reports have been complemented<br />
over the years by more than three dozen regional<br />
and subregional <strong>Human</strong> <strong>Development</strong><br />
<strong>Report</strong>s and more than 700 national <strong>Human</strong><br />
<strong>Development</strong> <strong>Report</strong>s. 8 Subnational reports<br />
have also been produced, including 19<br />
state-level reports in India and a municipal<br />
HDI in Brazil. 9<br />
Over the last quarter century all these reports<br />
have added momentum to human progress,<br />
and thus some of what seemed to be a daunting<br />
challenge in 1990 was largely achieved by 2015.<br />
Extreme poverty is estimated to have been below<br />
11 percent globally in 2013, a drop of more<br />
than two-thirds since 1990. 10 So even though<br />
the global population increased by 2 billion —<br />
from 5.3 billion in 1990 to 7.3 billion in 2015<br />
— the number of people in extreme poverty fell<br />
by more than a billion.<br />
Yet not all the news is good news.<br />
Substantial human deprivations persist despite<br />
the progress. One person in nine in the<br />
world is hungry, and one person in three is<br />
malnourished. 11 Eleven children under age 5<br />
die every minute, and 35 mothers die during<br />
childbirth every hour. 12 About 15 million<br />
girls a year marry before age 18, one every<br />
two seconds. 13 Worldwide 18,000 people<br />
a day die because of air pollution, and HIV<br />
infects 2 million people a year. 14 Every minute<br />
an average of 24 people are displaced from<br />
their home. 15<br />
And new development challenges have<br />
emerged. Conflicts, disasters and natural resources<br />
can no longer be considered national<br />
concerns; they have become global concerns.<br />
More than 21.3 million people — roughly the<br />
population of Australia — are refugees. 16 More<br />
than 100 million people could be affected<br />
by the combined impact of El Niño and La<br />
Niña, a double shock. 17 Insecurity because of<br />
violent extremism has spread throughout the<br />
globe. The cost of violence globally is about<br />
$1,900 per person. 18 Water scarcity and climate<br />
change have added to international tensions.<br />
Epidemics such as Ebola and Zika pose serious<br />
threats to people, and about 20,000 children<br />
have become Ebola orphans. 19<br />
<strong>Human</strong> ingenuity has opened promising<br />
new arenas, but human suffering also abounds.<br />
Violence, not dialogue, has become a common<br />
human language. Isolationism, not diversity,<br />
is gaining currency. Despite the challenges,<br />
what humanity has achieved over the past 25<br />
years and our desire to aspire to even more<br />
give us hope on many fronts. Challenges also<br />
offer rays of hope, and hopes face daunting<br />
challenges before they can be realized. This<br />
link needs to be kept in mind as we pursue our<br />
goal to overcome the challenges and realize<br />
the hopes.<br />
The achievements we have made<br />
The levels of human development have improved<br />
all over the world. Every developing<br />
region’s HDI value increased considerably between<br />
1990 and 2015, although progress has<br />
been slowing since 2010 (figure 1.1). This reflects<br />
important advances not only in income,<br />
but also in health and education. Between<br />
1990 and 2015 the aggregate HDI value<br />
of the least developed countries increased<br />
46 percent, and the aggregate HDI value for<br />
low human development countries increased<br />
40 percent. 20<br />
Reduced poverty and hunger<br />
The global extreme poverty rate ($1.90 a day)<br />
was estimated at less than 11 percent in 2013,<br />
a drop of more than two-thirds from the<br />
35 percent in 1990. 21 The decrease has been<br />
particularly remarkable in East Asia and the<br />
Pacific, where the proportion of people living<br />
on less than $1.90 a day fell from 60.2 percent<br />
in 1990 to 3.5 percent in 2013, and in South<br />
Asia, where the proportion fell from 44.6 percent<br />
to 15 percent. 22 China’s extreme poverty<br />
rate plummeted from 66.5 percent in 1990 to<br />
1.9 percent in 2013. The working poor, who<br />
work and live on less than $1.90 a day, accounted<br />
for 10 percent of workers worldwide<br />
in 2015, nearly two-thirds less than in 2000. 23<br />
The global population suffering from hunger<br />
declined from 15 percent in 2000–2002 to<br />
11 percent in 2014–<strong>2016</strong>. 24<br />
26 | HUMAN DEVELOPMENT REPORT <strong>2016</strong>
FIGURE 1.1<br />
Regional trends in <strong>Human</strong> <strong>Development</strong> Index values<br />
<strong>Human</strong> development classification<br />
(<strong>Human</strong> <strong>Development</strong> Index value)<br />
Very high<br />
(0.800 or<br />
greater)<br />
High<br />
(0.700–<br />
0.799)<br />
Medium<br />
(0.550–<br />
0.699)<br />
Europe & Central Asia<br />
Latin America &<br />
the Caribbean<br />
East Asia & the Pacific<br />
Arab States<br />
South Asia<br />
Low<br />
(less than<br />
0.550)<br />
Sub-Saharan Africa<br />
1990 1995 2000 2005 2010 2015<br />
Source: <strong>Human</strong> <strong>Development</strong> <strong>Report</strong> Office.<br />
Decreased mortality<br />
The global under-five mortality rate was more<br />
than halved between 1990 and 2015. 25 The<br />
steepest decline was in Sub- Saharan Africa,<br />
where the challenge was the greatest. While<br />
children in the poorest households are far less<br />
likely to survive to their fifth birthdays, the<br />
mortality rate is declining faster for children<br />
in poor households than for other children.<br />
Maternal mortality rates have also declined<br />
considerably since 1990: 45 percent globally<br />
and 64 percent in South Asia, as of 2013. 26<br />
Access to professional health care has improved:<br />
in 2014 more than 71 percent of births<br />
worldwide were attended by skilled health personnel,<br />
up from 59 percent in 1990. In North<br />
Africa the proportion of pregnant women who<br />
receive at least four antenatal medical visits rose<br />
from 50 percent in 1990 to 89 percent in 2014,<br />
the largest improvement worldwide. 27 Globally,<br />
nearly two-thirds of women ages 15–49 who<br />
are married or in union use contraception, up<br />
from 55 percent in 1990.<br />
Global health is also improving. In developing<br />
regions the proportion of undernourished<br />
people has been nearly halved since 1990. 28<br />
In 2013 measles-containing vaccines reached<br />
84 percent of children worldwide. Global<br />
coverage of two doses of the measles vaccine increased<br />
from 15 percent in 2000 to 53 percent<br />
in 2013, resulting in a 67 percent decline in the<br />
number of annual reported measles cases. An<br />
estimated 15.6 million lives were saved through<br />
measles vaccination between 2000 and 2013. 29<br />
These positive developments have led to a dramatic<br />
decline in preventable child deaths.<br />
Overall mortality rates are falling in part because<br />
of actions to tackle malaria, tuberculosis,<br />
measles, and HIV and AIDS. Between 2001<br />
and 2015 more than 6.8 million malaria deaths,<br />
many of them in children, were prevented. 30 The<br />
number of new HIV infections also fell, from<br />
an estimated 3.5 million in 2000 to 2.1 million<br />
in 2013. From 1995 to 2013 increasing use of<br />
antiretroviral therapy averted 7.6 million deaths<br />
from AIDS. 31 Tuberculosis mortality rates also<br />
fell in response to efforts to prevent, diagnose<br />
and treat the disease, with 37 million lives saved<br />
between 2000 and 2013. 32<br />
Improved access to basic<br />
social services<br />
Access to basic social services has been greatly<br />
expanded worldwide. Between 1990 and 2015,<br />
While children in the<br />
poorest households<br />
are far less likely to<br />
survive to their fifth<br />
birthdays, the mortality<br />
rate is declining faster<br />
for children in poor<br />
households than<br />
for other children<br />
Chapter 1 <strong>Human</strong> development — achievements, challenges and hopes | 27
Communication and<br />
information on the<br />
impact of climate<br />
change have reached<br />
more people than<br />
ever before, raising<br />
awareness in every<br />
corner of the world<br />
2.1 billion people gained access to improved<br />
sanitation, halving the number of people resorting<br />
to open defecation, a major source of<br />
transmittable diseases such as cholera. 33 More<br />
than 2.6 billion people gained access to an<br />
improved source of water, and the Millennium<br />
<strong>Development</strong> Goal target of halving the<br />
proportion of the population without access<br />
to safe drinking water was reached five years<br />
ahead of schedule. 34 The improvement has been<br />
impressive in Sub- Saharan Africa, where the<br />
proportion of the population with access to<br />
an improved drinking water source rose from<br />
48 percent in 1990 to 68 percent in 2015, and<br />
in East Asia, where the proportion rose from<br />
68 percent in 1990 to 96 percent in 2015. And<br />
despite rapid urbanization across the globe, the<br />
proportion of the urban population living in<br />
slums fell almost 10 percentage points between<br />
2000 and 2014 in developing regions. 35<br />
In developing regions 91 percent of primary<br />
school–age children were enrolled in 2015,<br />
up from 83 percent in 2000, and the number<br />
of out-of-school children worldwide fell by<br />
almost half over the same period. 36 The greatest<br />
progress has been in Sub- Saharan Africa, where<br />
the net primary school enrolment rate rose<br />
from 52 percent in 1990 to 80 percent in 2015.<br />
As a result, a larger proportion of young people<br />
can now read and write: The global literacy rate<br />
among people ages 15–24 was 91 percent in<br />
2015, up from 83 percent in 1995. The gap in<br />
literacy between young men and young women<br />
has also narrowed, to an estimated 3 percentage<br />
points in 2015. North Africa and South Asia<br />
showed the greatest improvement in youth<br />
literacy, pushed by a strong increase in literacy<br />
among young women.<br />
Increased people’s participation<br />
People’s participation in public and political<br />
life, another essential aspect of human development,<br />
has also improved over the past 25 years.<br />
The average share of parliamentary seats held by<br />
women worldwide rose from 11 percent in 1995<br />
to 22 percent in 2015, and two-thirds of developing<br />
countries have achieved gender parity in<br />
primary education, allowing girls and women to<br />
better voice their concerns and interests. 37 Civil<br />
society organizations have expanded considerably,<br />
helping individuals exercise agency, express<br />
their opinion and defend their interests on the<br />
national and international scenes.<br />
Improved environmental sustainability<br />
Environmental protection, which has become<br />
a key global issue, has shown encouraging<br />
successes as well. The degradation of the ozone<br />
layer, a major concern in the 1990s, has been<br />
halted, and by 2050 the ozone layer will have<br />
fully recovered from the damages caused by<br />
ozone-depleting substances. 38 The share of<br />
marine biodiversity areas that are protected<br />
increased from 15 percent in 2000 to 19 percent<br />
in <strong>2016</strong>. 39 The global net loss in forest area<br />
declined from 7.3 million hectares a year in the<br />
1990s to 3.3 million in 2010–2015, and the<br />
share of terrestrial areas that are protected increased<br />
from 16.5 percent in 2000 to 19.3 percent<br />
in <strong>2016</strong>. Communication and information<br />
on the need to protect nature and the impact of<br />
climate change have reached more people than<br />
ever before, raising awareness in every corner of<br />
the world.<br />
Advances in technology<br />
New technologies are one of the most apparent<br />
changes in our current lives. They have lifted<br />
economies up, facilitated transportation and<br />
communication, led to major advances in health<br />
and education, expanded information and<br />
participation and created new security tools.<br />
Green technologies may be the key to a more<br />
sustainable future, where resources are available<br />
to all without harming the environment.<br />
Information and communication technology<br />
has spread exponentially. In <strong>2016</strong>, 94.1 percent<br />
of the population in developing countries own<br />
a mobile phone, and 40.1 percent have access to<br />
the Internet, up from 7.8 percent in 2005. 40 In<br />
developed countries access to the Internet and<br />
to smartphones is nearly universal.<br />
The impact of technology on the economy<br />
is undeniable. Global high-technology exports<br />
have more than doubled in the last 15 years,<br />
from $987 billion in 1999 to $2,147 billion in<br />
2014. 41 Cloud technology, three- dimensional<br />
printing, advanced robotics, energy storage<br />
and digital assistants hold great potential<br />
for creating new jobs and new areas of work.<br />
People with the skills and resources to use<br />
28 | HUMAN DEVELOPMENT REPORT <strong>2016</strong>
technology and create value can thrive in<br />
today’s digital world, as discussed in the 2015<br />
<strong>Human</strong> <strong>Development</strong> <strong>Report</strong>.<br />
New technologies have also changed the<br />
way governments interact with their citizens,<br />
increasing the reach and efficiency of public<br />
service delivery. 42 Several countries use mobile<br />
phones to extend basic social services, including<br />
health care and education, to hard-to-reach<br />
populations. 43 The Internet allows much more<br />
information to be shared than any other means<br />
of communication has. The amount of digital<br />
data has doubled every three years since 2000,<br />
and today less than 2 percent of stored information<br />
is offline. 44<br />
Though there is far to go before all people<br />
can live their lives to their full potential, cooperation<br />
and commitments to eliminating<br />
deprivations and promoting sustainable human<br />
development have improved the lives of billions<br />
of people over the past 25 years. The Republic<br />
of Korea has sustained progress in human development<br />
for even longer (box 1.2).<br />
The challenges we face<br />
Some challenges are lingering (deprivations),<br />
some are deepening (inequalities) and some are<br />
emerging (violent extremism). Some are global<br />
(gender inequality), some are regional (water<br />
stress) and some are within national boundaries<br />
(natural disasters). Most are mutually reinforcing:<br />
Climate change reduces food security, and<br />
rapid urbanization marginalizes poor people<br />
in urban areas. Whatever their nature or reach,<br />
these challenges have an impact on people’s<br />
well-being.<br />
Lingering deprivations and inequalities<br />
Even with all the impressive progress in reducing<br />
poverty over the past 25 years, 766 million<br />
people, 45 385 million of them children, 46 lived<br />
on less than $1.90 a day in 2013. Poor nutrition<br />
causes 45 percent of the deaths among children<br />
under age 5. 47 Children born in developing<br />
countries in <strong>2016</strong> will lose nearly $177 billion<br />
in potential lifetime earnings because of stunting<br />
and other delays in physical development. 48<br />
Yet one-third of the world’s food is wasted<br />
every year. 49 If one-fourth of the food wasted<br />
across the globe could be recovered, it could<br />
feed 870 million people. 50 Unless the world<br />
tackles deprivation today, 167 million children<br />
will live in extreme poverty by 2030,<br />
and 69 million children under age 5 will die<br />
of preventable causes. 51 These outcomes will<br />
definitely shrink the capabilities of future generations.<br />
About 758 million adults, including<br />
Even with all the<br />
impressive progress<br />
in reducing poverty<br />
over the past 25 years,<br />
766 million people,<br />
385 million of them<br />
children, lived on less<br />
than $1.90 a day in 2013<br />
BOX 1.2<br />
<strong>Human</strong> development in the Republic of Korea — a longer term perspective<br />
The Republic of Korea has travelled a highly successful<br />
path of human development over the past six decades.<br />
And the major drivers behind the country’s sustained<br />
trajectory of high human development include successful<br />
land reforms, rural development, extensive human<br />
resources development and rapid equitable economic<br />
growth. Export orientation, sustainable domestic resource<br />
mobilization with strong redistribution policies,<br />
and public infrastructure development also played major<br />
roles. Needless to say, effective institutions and governance<br />
were also key.<br />
The main dynamics of the Republic of Korea’s progress<br />
was a virtuous cycle between economic and social<br />
policies, which — while maintaining the primacy of the<br />
growth objective — adapted flexibly to evolving constraints<br />
and opportunities and successfully harnessed<br />
major currents in the human development space, such<br />
as globalization, technological change and urbanization.<br />
The Republic of Korea attained a critical mass of<br />
policies conducive to human development in the face<br />
of multiple challenges. Doing so allowed the country<br />
to remain on a path of rapid and socially inclusive human<br />
development for so long — and to serve as a model<br />
for other countries. The country, assisted by the United<br />
Nations <strong>Development</strong> Programme Seoul Policy Centre<br />
for Global <strong>Development</strong> Partnerships, is already conveying<br />
its knowhow (such as that gleaned from the Seoul<br />
government’s Clean Construction System) to partner<br />
countries, duly adapted to the realities of partner countries,<br />
whose policymakers and political leaders are aiming<br />
for similarly rapid and sustained improvements in<br />
human development.<br />
Source: UNDP Seoul Policy Centre for Global <strong>Development</strong> Partnerships.<br />
Chapter 1 <strong>Human</strong> development — achievements, challenges and hopes | 29
Poverty is no longer a<br />
problem of developing<br />
regions only; it is<br />
also on the rise in<br />
developed countries<br />
114 million young people, still lack basic reading<br />
and writing skills. 52 Lingering deprivations<br />
are evident in various aspects of human development<br />
(figure 1.2).<br />
Poverty is no longer a problem of developing<br />
regions only; it is also on the rise in<br />
developed countries. The International Labour<br />
Organization estimates that in 2012 more than<br />
300 million people in developed countries<br />
lived in poverty. 53<br />
Children and women are the most affected<br />
by poverty, and 36 percent of children in developed<br />
countries live under the relative poverty<br />
line, in households with an income below<br />
60 percent of the national median household<br />
income. In the United States 32 million adults<br />
are functionally illiterate, and in the United<br />
Kingdom 8 million. 54<br />
Rising incomes around the world have been<br />
accompanied by widening inequality. Measures<br />
of the gaps in income equality include the<br />
Gini coefficient (where a value of 0 means that<br />
everyone has the same income, and a value of 1<br />
means that one person has all the income) and<br />
quintile ratios (the ratio of the average income<br />
of the wealthiest 20 percent of the population<br />
to the average income of the poorest 20 percent<br />
of the population).<br />
Although income inequality across households<br />
has risen in many countries, some<br />
estimates show that it has narrowed across<br />
the world as a whole because the incomes of<br />
developing and developed regions have been<br />
converging. Relative global inequality has declined<br />
steadily over the past few decades, from<br />
a relative Gini coefficient of 0.74 in 1975 to<br />
FIGURE 1.2<br />
<strong>Human</strong> deprivation lingers in some indicators of well-being<br />
Poverty and hunger<br />
Income poor<br />
Chronic hunger<br />
766 million (2013)<br />
795 million (2014–<strong>2016</strong>)<br />
Children stunted<br />
Children underweight<br />
159 million (2014)<br />
90 (million 2015)<br />
Health, mortality and education<br />
Children dying before age 5<br />
Maternal mortality<br />
People living with HIV<br />
6 million (2015)<br />
303,000 (2015)<br />
36 million (2015)<br />
Illiterate adults<br />
758 million (2014)<br />
Illiterate young people<br />
Functionally illiterate people in OECD countries<br />
Children not at school at primary level<br />
Children not learning basic skills<br />
114 million (2014)<br />
160 million (2009)<br />
61 million (<strong>2016</strong>)<br />
250 million (2014)<br />
Access to basic social services<br />
People who lack access to an improved<br />
water source<br />
People who lack access to an improved<br />
sanitation facility<br />
People resorting to open defecation<br />
People living in urban slums<br />
663 million (2015)<br />
2.4 billion (2015)<br />
946 million (2015)<br />
880 million (2015)<br />
Source: <strong>Human</strong> <strong>Development</strong> <strong>Report</strong> Office.<br />
30 | HUMAN DEVELOPMENT REPORT <strong>2016</strong>
0.63 in 2010, driven by declining inequality<br />
between countries arising from the extraordinary<br />
economic growth in, primarily, China and<br />
India. 55 This happened despite an increasing<br />
trend towards inequality within countries. By<br />
contrast, absolute inequality, measured by the<br />
absolute Gini coefficient, has increased dramatically<br />
since the mid-1970s (figure 1.3). To<br />
understand the absolute and the relative, take<br />
an example. In 2000 one person in a country<br />
earns $1 a day and another person $10 a day.<br />
With economic growth, in <strong>2016</strong> the first<br />
person earns $8 a day, and the second person<br />
$80 a day. The relative difference between the<br />
two remains the same (the second person has<br />
10 times more than the first person), but the<br />
absolute difference has gone up from $7 to $72.<br />
The World Bank reports that between 2008<br />
and 2013 income gaps widened in 34 of the<br />
83 countries monitored as income grew more<br />
quickly for those in the wealthiest 60 percent<br />
of the income distribution than for those in the<br />
poorest 40 percent. 56 And in 23 countries people<br />
in the poorest 40 percent saw their income<br />
decline.<br />
Increases in income have been particularly<br />
sharp at the top of the income distribution.<br />
Some 46 percent of the total increase in income<br />
between 1988 and 2011 went to the wealthiest<br />
10 percent (figure 1.4). Since 2000, 50 percent<br />
of the increase in global wealth benefited only<br />
the wealthiest 1 percent of the world’s population.<br />
Conversely, the poorest 50 percent of the<br />
world’s population received only 1 percent of<br />
the increase. 57<br />
Global wealth has become far more concentrated.<br />
The wealthiest 1 percent of the population<br />
had 32 percent of global wealth around<br />
2000 and 46 percent around 2010 (figure 1.5).<br />
The super-rich — the wealthiest 0.1 percent —<br />
loom larger. The share of national wealth among<br />
the super-rich in the United States increased<br />
from 12 percent in 1990 to 19 percent in 2008<br />
(before the financial crisis) and to 22 percent in<br />
2012 (critics pointed to inequality as one of the<br />
key causes of the crisis). 58<br />
Access to the benefits of the digital revolution<br />
is uneven globally. Almost 2 billion<br />
people still do not use a mobile phone, and<br />
only 15 percent of the world population has<br />
high-speed Internet access. 59 Some 89 percent<br />
of the planet’s urban population has access to<br />
3G mobile broadband, compared with only<br />
29 percent of the rural population. 60<br />
The inequality discussion often focuses on<br />
vertical inequality — such as the inequality between<br />
wealthiest 10 percent of the population<br />
and the poorest 10 percent — and rarely on<br />
horizontal inequality — such as the inequality<br />
across ethnic groups. Analysis of horizontal<br />
inequality can bring critical insights to the inequality<br />
discourse (box 1.3).<br />
Global wealth has<br />
become far more<br />
concentrated. The<br />
wealthiest 1 percent<br />
of the population<br />
had 32 percent of<br />
global wealth around<br />
2000 and 46 percent<br />
around 2010<br />
FIGURE 1.3<br />
Relative global inequality has declined steadily over the past few decades, but absolute inequality has<br />
increased dramatically<br />
Relative Gini coefficient<br />
0.75<br />
0.70<br />
Absolute Gini coefficient<br />
8,000<br />
Absolute<br />
6,000<br />
0.65<br />
4,000<br />
0.60<br />
Relative<br />
2,000<br />
0.55<br />
1975<br />
1985<br />
1995 2000 2005<br />
2010<br />
0<br />
Source: Niño-Zarazúa, Roope and Tarp <strong>2016</strong>.<br />
Chapter 1 <strong>Human</strong> development — achievements, challenges and hopes | 31
FIGURE 1.4<br />
Some 46 percent of the total increase in income between 1988 and 2011 went to the wealthiest 10 percent<br />
2005 PPP $ (billions)<br />
6,000<br />
Increase in income, 1988–2011<br />
Top 1 percent<br />
5,000<br />
4,000<br />
2,000<br />
1,000<br />
0<br />
1 2 3 4 5 6 7 8 9<br />
Global income decile<br />
10<br />
Note: PPP is purchasing power parity.<br />
Source: Lawson <strong>2016</strong>.<br />
Urbanization has been<br />
described as a new<br />
frontier of development<br />
because it is not a<br />
passive outcome of<br />
development, but a<br />
creator of value<br />
FIGURE 1.5<br />
Global wealth has become far more concentrated<br />
Wealthiest<br />
1 percent<br />
99%<br />
Population<br />
32%<br />
68%<br />
Global wealth<br />
2000<br />
46%<br />
54%<br />
Global wealth<br />
2011<br />
Source: <strong>Human</strong> <strong>Development</strong> <strong>Report</strong> Office estimates based on Milanović (<strong>2016</strong>).<br />
Lingering deprivations and inequalities<br />
present serious challenges to human development<br />
on at least three fronts. First, they stunt<br />
the capabilities of people — not only their<br />
well-being, but also their voice and autonomy.<br />
Second, they initiate and reinforce a process<br />
of exclusion whereby poor people and others<br />
at the bottom of the social ladder are excluded<br />
from influencing the processes that shape their<br />
lives. Third, they create a society where rights<br />
and opportunities are denied to poor people—<br />
and that is unjust.<br />
Multidimensional population dynamics<br />
The planet’s surging population is projected to<br />
grow to 9.7 billion in 2050 (figure 1.6), with<br />
five main implications: widespread urbanization,<br />
an ageing population, a growing middle<br />
class, migration and a youth bulge.<br />
In 2014 more than half the world’s people<br />
lived in urban areas, a share expected to reach<br />
two-thirds by 2050, when cities will have swollen<br />
by another 2.5 billion people. 61 The world<br />
is projected to have 41 megacities by 2030,<br />
each with more than 10 million inhabitants. 62<br />
Urbanization has been described as a new frontier<br />
of development because it is not a passive<br />
outcome of development, but a creator of value<br />
— the more than half of humanity living in<br />
cities generates more than 80 percent of global<br />
gross domestic product (GDP). 63<br />
Not all urbanization is positive, however,<br />
especially if it is unplanned. It puts pressure<br />
on infrastructure and may lower residents’<br />
quality of life. More than 1 billion people live<br />
in housing that is below minimum standards<br />
of comfort and sanitation, and new houses<br />
have to be built for 3 billion people by 2030. 64<br />
Some 880 million people live in slums, and<br />
nearly 40 percent of the world’s future urban<br />
expansion may occur in slums. 65 Almost<br />
700 million urban slumdwellers lack adequate<br />
sanitation, which — along with lack of safe<br />
32 | HUMAN DEVELOPMENT REPORT <strong>2016</strong>
BOX 1.3<br />
Insights based on horizontal inequalities<br />
A common argument in discussions about horizontal inequality<br />
is that people would be more favourable to redistribution<br />
within their own group and less favourable<br />
to redistribution between groups because the former is<br />
perceived by the group as just and fair.<br />
But Ghana and Uganda showed far higher approval<br />
ratings for redistribution between ethnic groups, even<br />
though ethnic identity was just as strong as in other<br />
countries. High approval for redistribution is clearly<br />
compatible with a strong ethnic identification.<br />
Redistribution is critical in addressing horizontal inequality<br />
and can form the core of public policy to ensure<br />
rights, justice and equality in a multiethnic society. Such<br />
policies would have constitutive benefits (such as enhancing<br />
human capabilities in various groups) as well as consequential<br />
benefits (such as improving social cohesion).<br />
Deprivation is a denial of human rights (which have<br />
intrinsic value), and overcoming it is also instrumental<br />
in enjoying other rights and freedoms. Equality has intrinsic<br />
value (anchored in the notion of justice) as well<br />
as instrumental value because it affects other accepted<br />
objectives. Inequality is justified only if it improves the<br />
position of the poorest or if it arises through legitimate<br />
processes.<br />
Source: Cornia and Stewart 2014.<br />
FIGURE 1.6<br />
The planet’s surging population is projected to<br />
grow to 9.7 billion in 2050<br />
World population (billions)<br />
9<br />
6<br />
3<br />
0<br />
5.0<br />
Source: UNDESA 2015b.<br />
7.3<br />
1990 2015<br />
2050<br />
85 percent are<br />
projected to live<br />
in currently<br />
developing<br />
regions<br />
drinking water — raises the risk of communicable<br />
diseases such as cholera and diarrhoea, particularly<br />
among children. 66 Violence, drugs and<br />
crime also increase with rapid urbanization.<br />
And urbanization is linked to climate change.<br />
Along with prosperity and innovation, global<br />
cities are the principal sources of the carbon<br />
dioxide emissions that are warming the earth. 67<br />
Many larger cities are in low-lying coastal areas,<br />
9.7<br />
leaving them exposed to the dangers of flooding<br />
associated with rising sea levels and storm<br />
surges.<br />
As a result of declining fertility and greater<br />
longevity, older people now make up an increasing<br />
proportion of national populations.<br />
The number of people ages 60 and older is<br />
expected to reach 1.4 billion in 2030 and<br />
2.1 billion in 2050. 68 That would raise the<br />
global old-age dependency ratio (the ratio of<br />
the number of people ages 65 and older to<br />
the number of people of working age, generally<br />
ages 15–64) in developing countries from<br />
13 percent in 2015 to 26 percent in 2050. 69<br />
And that will have major implications for<br />
retirement ages, health services, elder care,<br />
social protection and family relationships. In<br />
developed countries ageing populations are<br />
challenging retirement systems and requiring<br />
adaptations to work arrangements and longterm<br />
care services. 70<br />
The global middle class — households with<br />
a daily expenditure of $10–$100 per capita in<br />
purchasing power parity terms — is expected<br />
to expand to 3.2 billion people in Asia and the<br />
Pacific and to 1.7 billion people elsewhere by<br />
2030. 71 Its rapid expansion stems from the rise<br />
in countries such as China, where middle-class<br />
households (with an annual income of<br />
$11,500–$43,000) increased from 5 million in<br />
2000 to 225 million in 2015. 72 But country definitions<br />
of the middle class differ, both through<br />
the lenses of income and expenditure and in<br />
relative terms compared with a societal mean. 73<br />
The global middle class<br />
is expected to expand<br />
to 3.2 billion people in<br />
Asia and the Pacific<br />
and to 1.7 billion people<br />
elsewhere by 2030<br />
Chapter 1 <strong>Human</strong> development — achievements, challenges and hopes | 33
Population shifts<br />
associated with<br />
migration will<br />
change not only the<br />
demographic profile<br />
of societies, but also<br />
their values, norms,<br />
culture and political<br />
and social institutions<br />
How might the growth of the middle class<br />
affect human development? The larger middle<br />
class is more of an economic middle class than<br />
the traditional intellectual middle class, and its<br />
approach to social debate, intellectual leadership<br />
and social cohesion may differ from that of<br />
its predecessors, which acted as the conscience<br />
of society, provided intellectual leadership in<br />
social and cultural movements and championed<br />
the poor and the marginalized. In most<br />
societies younger people will constitute an economic<br />
middle class that strives for innovation<br />
and creativity in life as well as in work. They<br />
are also more likely to see themselves as global<br />
citizens, with positive implications for human<br />
capabilities and opportunities.<br />
But the new middle class may show consumption<br />
patterns that have adverse impacts on sustainable<br />
consumption. It may have its own social<br />
agenda (such as social entrepreneurship) but be<br />
motivated more by personal economic advancement.<br />
It may also be more insular and be more<br />
intimately linked to a Twitter community or a<br />
Facebook community than to a physical community<br />
or neighbourhood. It may have many<br />
digital connections but few human connections.<br />
Population dynamics will continue to change<br />
because of migration to developed countries.<br />
The population of the European Union was<br />
507 million in 2013. Without migration it<br />
would drop to 399 million by 2080, but with<br />
migration it would rise to 520 million. 74 The<br />
population of the United States was 324 million<br />
in 2015. Without migration it would<br />
have risen to 338 million by <strong>2016</strong>, but with<br />
migration it reached 441 million. Population<br />
shifts associated with migration will change not<br />
only the demographic profile of these and other<br />
societies, but also their values, norms, culture<br />
and political and social institutions, possibly<br />
creating tensions and conflicts. One human development<br />
challenge will thus involve forging<br />
peaceful and cohesive multicultural societies in<br />
many parts of the world.<br />
Today young people ages 10–24 account for<br />
about 1.8 billion of the world’s 7.3 billion people.<br />
75 Around 90 percent of these young people<br />
live in developing countries. A third of the<br />
world’s population is under age 20, and in about<br />
40 African countries more than half the population<br />
is under age 20. 76 There are more young<br />
people alive today than at any other time in<br />
human history. 77 Young people are active users<br />
of information and communication technology,<br />
and 30 percent are digital natives, young people<br />
ages 15–24 who have been using the Internet<br />
for five years or more. 78<br />
Yet 73.3 million young people are out of<br />
work, and 40 percent of young people in the<br />
global labour force are either unemployed or<br />
poorly paid. 79 Young people are three times<br />
more likely than adults to be out of work. 80<br />
Nearly 156 million young people in emerging<br />
and developing countries are working poor —<br />
working but living in extreme poverty on less<br />
than $1.90 a day or in moderate poverty on<br />
$1.90–$3.10 a day. 81 In the next 15 years young<br />
people worldwide will need 600 million jobs. 82<br />
Millennials — people ages 18–34 in 2015<br />
— are expected to work longer hours (nearly a<br />
quarter work more than 50 hours a week) and<br />
retire much later (a quarter expect to retire after<br />
age 70) than their grandparents — the silent generation,<br />
mostly in their 70s and 80s (box 1.4). 83<br />
Globalization — a double-edged sword<br />
Globalization has been heralded over the years<br />
as an engine of growth. In China and India<br />
opening up the economy to the world accelerated<br />
growth, which in turn helped address<br />
human development challenges — reducing<br />
poverty, improving health outcomes and extending<br />
access to basic social services. Thanks<br />
largely to China, the extreme poverty rate in<br />
East Asia dropped from 60 percent in 1990 to<br />
3.5 percent in 2013. 84 In 40 countries analysed<br />
BOX 1.4<br />
Millennials versus the silent generation<br />
• Millennials are better educated.<br />
• Female millennials are much more likely to be<br />
working.<br />
• Millennials face tougher job markets.<br />
• Millennials are less likely to marry.<br />
• Millennials are more likely to be an ethnic<br />
minority.<br />
• Millennials are far less likely to be war veterans.<br />
• Female millennials are better educated than<br />
male millennials.<br />
Source: Patten and Fry 2015.<br />
34 | HUMAN DEVELOPMENT REPORT <strong>2016</strong>
in 2013, 453 million people — 190 million of<br />
them women — were working in global value<br />
chains, up from 296 million in 1995. 85 A<br />
study of 40 countries, 13 of them developing<br />
countries, found that trade generally favours<br />
the poorest people because they spend more in<br />
traded sectors. 86<br />
Globalization has been accelerated by the<br />
technological revolution, particularly the digital<br />
revolution. Global trade in merchandise<br />
and services amounted to almost $24 trillion<br />
in 2014, up from $13 trillion in 2005. 87 And<br />
knowledge-intensive flows increased 1.3 times<br />
faster than labour-intensive flows. 88<br />
But globalization has not delivered the expected<br />
shared prosperity. Unskilled workers<br />
lost jobs in many economies, and manufacturing<br />
jobs disappeared. Productivity may have<br />
increased, but this did not always translate<br />
into higher wages, and the inequality in pay<br />
between unskilled and highly skilled labour has<br />
widened considerably. 89<br />
People have struggled during the process of<br />
globalization: Those who have recently crossed<br />
the poverty line in developing countries face<br />
vulnerable employment and informality, and<br />
the traditional middle class in high-income<br />
countries faces stagnant wages and reductions<br />
in social services. This pattern is shaping global<br />
social attitudes towards globalization: People<br />
self-defined as part of the lower middle class and<br />
working class feel less engaged by the concept<br />
of global citizenship (figure 1.7). The causes<br />
are invisible in indicators such as overall GDP<br />
growth or progress out of poverty by extremely<br />
poor people, yet the frustration can create political<br />
and institutional instability if left addressed.<br />
There seems to be a widespread view that globalization<br />
is good for a small elite but not for the<br />
broad masses of people. 90 Even many academics<br />
and policymakers who welcomed globalization<br />
are revising their opinion. It was always thought<br />
that globalization would not benefit everyone<br />
but that the benefits would eventually outweigh<br />
the losses. 91 The backlash against globalization<br />
is reshaping politics in various countries. But<br />
it cannot be rolled back, so the challenge is to<br />
ensure that globalization leaves no one behind.<br />
People on the move<br />
Millions of people are on the move because of<br />
conflicts, disasters or a search for better economic<br />
opportunities. Conflicts, violence and human<br />
rights violations have prompted massive displacements<br />
of people within or outside their countries.<br />
At the end of 2015 more than 65 million<br />
people worldwide had been forcibly displaced<br />
(internally displaced persons, refugees and<br />
asylumseekers) — the most since the Second<br />
World War and more than the population<br />
of France or the combined populations of<br />
Australia, Canada and New Zealand (figure<br />
1.8). 92 Some 86 percent of them are hosted in<br />
developing countries, making refugees less of a<br />
burden on developed countries (box 1.5). 93<br />
Globalization cannot<br />
be rolled back, so<br />
the challenge is to<br />
ensure that it leaves<br />
no one behind<br />
FIGURE 1.7<br />
People self-defined as part of the lower middle class and working class feel less engaged by the concept<br />
of global citizenship<br />
Upper class<br />
80.8%<br />
Upper middle class<br />
77.9%<br />
Lower middle class<br />
75.0%<br />
Working class<br />
74.4%<br />
Lower class<br />
75.8%<br />
(% strongly agree or agree with “I see myself as a world citizen”)<br />
Note: Data are for 59 countries.<br />
Source: <strong>Human</strong> <strong>Development</strong> <strong>Report</strong> Office estimates based on World Values Survey, wave 6, (www.worldvaluessurvey.org/wvs.jsp).<br />
Chapter 1 <strong>Human</strong> development — achievements, challenges and hopes | 35
Children are among<br />
the major victims of<br />
forced displacement<br />
FIGURE 1.8<br />
At the end of 2015 there were more than 65 million<br />
people worldwide who had been forcibly displaced<br />
40.8 million<br />
internally<br />
displaced<br />
persons<br />
21.3 million<br />
refugees<br />
Source: Statista <strong>2016</strong>.<br />
BOX 1.5<br />
65.3 million<br />
forcibly displaced worldwide<br />
Five common myths about refugees<br />
3.2 million<br />
asylumseekers<br />
Refugees are a European problem<br />
Europe is home to only 6 percent of global refugees;<br />
86 percent are in developing countries. The<br />
six richest nations host only 9 percent of refugees<br />
worldwide.<br />
Refugees are not desperate — they are<br />
choosing to migrate<br />
By definition refugees are people who flee across borders<br />
to escape violent conflict or persecution.<br />
Most refugees are young, able-bodied men<br />
Worldwide nearly 50 million children have migrated<br />
or been forcibly displaced. These children may be<br />
refugees, interally displaced persons or migrants.<br />
Refugees and migrants bring terrorism<br />
Over the past few years the deadliest terrorist attacks<br />
around the world have been perpetrated by citizens<br />
born in the targeted countries.<br />
Developed countries are overcrowded and<br />
cannot take any more people<br />
The size of the population in most developed countries<br />
is actually declining, and the demographic dividend<br />
in these countries is being exhausted. Migration<br />
can be crucial in addressing this issue.<br />
Children are among the major victims of<br />
forced displacement. Of the nearly 50 million<br />
children who have migrated across borders or<br />
been forcibly displaced, 28 million fled violence<br />
and insecurity. 94 More than 98,000 children<br />
are unaccompanied in migration or have<br />
been separated from their family. 95<br />
People on the move also face dangers during<br />
their journeys and afterwards. The global count<br />
of migrant deaths was more than 10,000 in<br />
2014 and 2015, and many more were unaccounted<br />
for.<br />
Widespread conflict and<br />
violent extremism<br />
Widespread conflict and violent extremism have<br />
become a challenge of our time. Conflict-related<br />
deaths are a proxy measure for the absence of<br />
peace. Since the end of the Second World War<br />
there has been a downward trend in such deaths,<br />
except in 2000, when the Eritrean– Ethiopian<br />
war alone caused at least 50,000 deaths. 96 With<br />
the escalation of conflict and extreme violence<br />
in the Syrian Arab Republic, 2014 saw the highest<br />
number of battle-related deaths since 1989:<br />
more than 50,000 (figure 1.9). 97 In 17 countries<br />
affected by prolonged conflicts, more than<br />
FIGURE 1.9<br />
2014 saw the highest number of battle-related<br />
deaths since 1989: more than 50,000<br />
Syrian Arab Republic<br />
Afghanistan<br />
Iraq<br />
Ukraine<br />
Nigeria<br />
Pakistan<br />
South Sudan<br />
Israel<br />
Yemen, Rep.<br />
Somalia<br />
3,140<br />
4,352<br />
3,793<br />
1,674<br />
1,665<br />
1,660<br />
1,103<br />
12,250<br />
11,933<br />
54,600<br />
Source: <strong>Human</strong> <strong>Development</strong> <strong>Report</strong> Office.<br />
Source: Purdie and Khaltarkhuu <strong>2016</strong>.<br />
36 | HUMAN DEVELOPMENT REPORT <strong>2016</strong>
56 million people are trapped in a vicious cycle<br />
of violence and hunger. 98<br />
In 2000 UN Security Council resolution<br />
1325 recognized that war affects women differently<br />
and stressed the need to increase women’s<br />
participation in peace talks. 99 But from 1992 to<br />
2011 only 9 percent of participants in peace negotiations<br />
were women. 100 Globally, fewer than<br />
5 percent of peacekeepers are women. 101<br />
Incidents of violent extremism and terrorism<br />
worldwide rose from fewer than 5,000 in 2006 to<br />
nearly 15,000 in 2014. 102 There has been a nearly<br />
tenfold increase in deaths from violent extremism<br />
and terrorism since 2000— from 3,329 victims to<br />
32,685 in 2014. 103 And the death toll keeps rising.<br />
In Iraq an estimated 50,000 people have died<br />
since 2003. 104 In <strong>2016</strong> more than 20,000 people<br />
died during internal conflict in Afghanistan, and<br />
more than 10,000 died in Yemen. 105<br />
Economic losses from conflict are estimated<br />
at $742 billion a year, dwarfing the $167 billion<br />
in annual gross disbursements of official development<br />
assistance. 106 But the costs of conflicts<br />
and violence are not limited to economic costs.<br />
People are uprooted because of conflicts and<br />
violence, they lose their belongings, they are on<br />
the run, their families are broken up — and too<br />
many die. About 600 million young people live<br />
in fragile and conflict-affected situations with<br />
no work and little hope. 107 Despair sometimes<br />
leads them to violent extremism. Refugee children<br />
and adolescents are five times more likely<br />
than nonrefugee children and adolescents to<br />
be out of school, with serious implications for<br />
building their capabilities. 108<br />
Broader peace, stability and security are<br />
linked not only to the end of wars and conflicts,<br />
but also to the end of violence within societies<br />
and human security in personal and community<br />
life. Violence has become a human language<br />
in many societies, and intolerance has become<br />
the reaction (box 1.6).<br />
Rising shocks, expanding vulnerabilities<br />
Although human beings are extremely resilient,<br />
the system in which they live and<br />
operate has to be resilient as well. Pandemics,<br />
natural disasters, climate change, economic<br />
and financial crises and other shocks can slow,<br />
reverse or completely derail human development.<br />
The effects on human development are<br />
BOX 1.6<br />
<strong>Human</strong> security, as people see it<br />
<strong>Human</strong> security to me means that my children and<br />
grandchildren will never see killing of human beings<br />
because of their colour or tribe as I witnessed in 1994<br />
during the genocide of Tutsi in Rwanda.<br />
—A female professional from Rwanda<br />
<strong>Human</strong> security to me means that I can walk on any<br />
street, anywhere, at any time using any clothes that I<br />
want — and with no fear. —A man from Brazil<br />
To me personally, human security means being free to<br />
be myself as a transwoman who came from the very<br />
oppressive continent of Africa, to be free from that<br />
violence and feeling safe and functional.<br />
—A former student from the United States<br />
<strong>Human</strong> security is good nutrition, health and education,<br />
stability and peace, prosperity of the country and<br />
a robust state, freedoms, justice, democratic government.<br />
—A male government official from Yemen<br />
For me, human security means equality between<br />
people no matter what age, race, gender, social status<br />
or preferences they have. It means mutual respect<br />
between the people in the whole wide world.<br />
—A female student from Belarus<br />
<strong>Human</strong> security for me is to have a voice. It means<br />
the right to participate in political process, the right to<br />
criticize injustice. —A male professor from India<br />
<strong>Human</strong> security is not to worry or think about my dayto-day<br />
needs and safety.<br />
—A gay male government official from the Philippines<br />
<strong>Human</strong> security for me is the future health and wellbeing<br />
of my children and grandchildren.<br />
—A female retired social worker from New Zealand<br />
Source: <strong>Human</strong> <strong>Development</strong> <strong>Report</strong> Office.<br />
not transitory; they may become permanent.<br />
Recovering from shocks takes a long time. Even<br />
six years after the economic and financial crisis<br />
of 2008–2009, at least 61 million fewer jobs<br />
were available globally than expected. 109 Five<br />
years of war in the Syrian Arab Republic and<br />
the spillover in Egypt, Iraq, Jordan, Lebanon<br />
and Turkey have cost close to $35 billion —<br />
equivalent to the GDP of the Syrian Arab<br />
Republic in 2007. 110 It will take time to return<br />
to the prewar GDP. 111 Restoring Libya’s infrastructure<br />
will cost an estimated $200 billion<br />
over the next 10 years. 112<br />
Broader peace,<br />
stability and security<br />
are linked not only<br />
to the end of wars<br />
and conflicts, but<br />
also to the end of<br />
violence within<br />
societies and human<br />
security in personal<br />
and community life<br />
Chapter 1 <strong>Human</strong> development — achievements, challenges and hopes | 37
The combined effects<br />
of growing populations,<br />
rising incomes and<br />
expanding cities will<br />
cause the demand<br />
for water to rise<br />
exponentially, while<br />
supply becomes more<br />
erratic and uncertain<br />
Eighteen million people living with HIV,<br />
mostly young and adolescent, do not receive<br />
antiretroviral treatment. 113 Young women ages<br />
15–24 are at higher risk of HIV infection and<br />
account for 20 percent of new HIV infections<br />
among adults globally. 114 About 1.8 million<br />
children live with HIV, and only half of them<br />
receive lifesaving treatment. 115 More than<br />
50 percent of people living with HIV do<br />
not know that they are infected, 116 and only<br />
30 percent of young women have comprehensive<br />
and correct knowledge about HIV. 117<br />
Noncommunicable diseases lead to 38 million<br />
deaths a year, 28 million of them in lowand<br />
middle-income countries. 118 Cancer causes<br />
8.2 million deaths a year, 5.7 million of them<br />
in developing countries. 119 Almost 2.1 billion<br />
people worldwide are overweight or obese,<br />
62 percent of them in developing countries. 120<br />
The number of overweight children is projected<br />
to double by 2030. 121<br />
Ebola and Zika have emerged as epidemics<br />
going beyond a country or group of countries.<br />
And infectious diseases are developing resistance<br />
to the antimicrobial drugs used to treat<br />
them. Overprescription and failure to complete<br />
courses of treatment allow resistance to develop<br />
and microbial infections to become a human<br />
health threat. Some 700,000 deaths are attributed<br />
to antimicrobial resistance each year; 122<br />
that number could skyrocket to 10 million a<br />
year by 2050 and cause global GDP to drop<br />
1.1–3.8 percent. Some 28 million more people<br />
are projected to slide into poverty because of<br />
antimicrobial resistance. 123<br />
Some 218 million people a year are touched<br />
by natural disasters. 124 The total direct costs<br />
of disasters and major diseases are equivalent.<br />
Between 1980 and 2012 an estimated 42 million<br />
human life-years were lost to disasters, and<br />
80 percent of them in developing countries. 125<br />
Fragile and conflict-affected states are home<br />
to more than 1.4 billion people and half the<br />
world’s extremely poor, a number that will grow<br />
82 percent by 2030 if no action is taken. 126<br />
Imbalances between the needs of<br />
people and the capacity of the planet<br />
Every year, 24 billion tonnes of fertile soils are<br />
lost to erosion, and 12 million hectares of land<br />
are lost to drought and desertification, affecting<br />
the lives and livelihoods of 1.5 billion people. 127<br />
Desertification could displace up to 135 million<br />
people by 2045. 128 Biodiversity is below safe<br />
levels across more than half the world’s lands. 129<br />
Every year, 300 million tonnes of plastic are<br />
manufactured, but only 15 percent is recycled,<br />
leaving 46,000 floating pieces of plastic per<br />
square mile of ocean. 130 But this is a minuscule<br />
fraction of the total amount of waste held in the<br />
seas, which affects nearly 700 marine species. 131<br />
In 2012 an estimated 8.4 million people died<br />
from air, water or land pollution. 132 At least<br />
6.5 million people a year are believed to be dying<br />
from air pollution, with many more injured. 133<br />
The cost of air pollution in welfare losses has<br />
been estimated at $5 trillion, 60 percent of<br />
which is in developing regions. 134 About 2.7 billion<br />
people still depend on wood or waste fires<br />
that cause indoor air pollution, affecting women<br />
and children the most. 135 Indoor air pollution<br />
leads to around 3.5 million deaths a year. 136<br />
Forests and trees provide vital resources to<br />
1.3 billion people, and in developing countries,<br />
forest income is second only to farm income<br />
among rural communities. 137 Between 60 million<br />
and 200 million indigenous peoples rely<br />
on forests for survival. 138 Acting as the lungs of<br />
the world, forests also slow climate change, and<br />
acting as carbon sinks, they increase resilience.<br />
Yet in tropical countries the annual net forest<br />
loss is 7 million hectares — the size of Ireland. 139<br />
Water stress is a major challenge affecting<br />
more than 4 billion people worldwide. 140 The<br />
combined effects of growing populations, rising<br />
incomes and expanding cities will cause the<br />
demand for water to rise exponentially, while<br />
supply becomes more erratic and uncertain.<br />
Water is becoming scarcer in the Arab States<br />
and in the African Sahel, where it is already<br />
in short supply, and may start disappearing in<br />
Central Africa or East Asia, where it is currently<br />
abundant. These regions could see declines of<br />
as much as 6 percent of GDP by 2050 because<br />
of water-related impacts on agriculture, health<br />
and income. 141<br />
In 2012 more than 80 percent of the world’s<br />
primary energy supply came from fossil fuels,<br />
and only 16 percent came from renewable<br />
energy. 142 In 2015 fossil fuels accounted for<br />
55 percent of global energy investment, and<br />
today fossil fuel companies benefit from global<br />
subsidies of $10 million a minute. 143 About<br />
38 | HUMAN DEVELOPMENT REPORT <strong>2016</strong>
1 billion people worldwide lack access to electricity.<br />
144 By 2040 the planet’s energy system<br />
will need to serve 9 billion people, and much of<br />
the energy will have to be renewable.<br />
Climate change will aggravate land<br />
degradation — especially in drylands, which<br />
occupy 40 percent of global land area, are inhabited<br />
by some 2 billion people and support<br />
half the world’s livestock. 145 By 2030 climate<br />
change is expected to cause an additional<br />
250,000 deaths a year from malaria, diarrhoea,<br />
heat stress and malnutrition. 146<br />
The poorest people are more exposed than<br />
the average population to climate-related<br />
shocks and are at high risk of floods, droughts<br />
and heat waves; crop failures from reduced rainfall;<br />
spikes in food prices after extreme weather<br />
events; and increased incidence of diseases after<br />
heat waves and floods. Poor people are also<br />
more exposed to higher temperatures and live<br />
in countries where food production is expected<br />
to decrease. If climate-smart action is not taken<br />
now, more than 100 million additional people<br />
could be living in poverty by 2030. 147 Climate<br />
change can have the most disastrous effects on<br />
indigenous peoples, who rely more on natural<br />
resources and agriculture.<br />
The hopes we have<br />
What humanity has achieved over 25 years despite<br />
all the challenges it has faced gives hope that<br />
fundamental change is possible. Yes, progress on<br />
many fronts has been uneven and deprivations<br />
linger, yet what has been achieved can become<br />
a foundation for progress in many areas. We can<br />
explore new possibilities for overcoming challenges<br />
and attain what once seemed unattainable.<br />
Realizing our hopes is within our reach.<br />
Rapid progress is possible<br />
Some of the impressive achievements in human<br />
development over the last 25 years have been<br />
in regions and areas that once were lagging.<br />
South Asia, where extreme poverty is rampant,<br />
reduced the extreme poverty rate from<br />
44.5 percent in 1990 to 15 percent in 2013. 148<br />
Average incomes rose among the poorest<br />
40 percent between 2008 and 2013 despite the<br />
financial crisis. 149 And between 2011 and 2014,<br />
700 million people worldwide became account<br />
holders in banks, other financial institutions or<br />
mobile money service providers. 150<br />
Africa boosted life expectancy by six years in<br />
the 2000s. Latin America and the Caribbean<br />
reduced the under-five mortality rate by<br />
70 percent between 1990 and 2015. 151 The<br />
Americas have been declared free of measles.<br />
152 Guatemala has joined three other Latin<br />
American countries that were already free of<br />
river blindness. 153 Southeast Asia cut the share<br />
of the population living in slums from 40 percent<br />
in 2000 to 27 percent in 2014. 154<br />
In 2005 India aimed to connect every<br />
community with more than 1,000 people<br />
(and every community with more than 500<br />
people in hilly, tribal and desert areas) to an<br />
all-weather road. 155 Four years later, 70 percent<br />
of the target communities were connected. In<br />
2005 Ethiopia launched Sub- Saharan Africa’s<br />
largest social protection programme. 156 Four<br />
years later 7.5 million people were supported in<br />
times of food insecurity. In 2010 Senegal targeted<br />
191 rural villages for improved access to<br />
electricity, boosting the number of people with<br />
access from 17,000 to 90,000 in 2012. 157<br />
All these gains are reasons for hope that rapid<br />
progress is possible, even in areas previously lagging.<br />
The world has the resources, the technology<br />
and the expertise to overcome human deprivations.<br />
And the notion of sharing prosperity gives<br />
us hope that we are ready to tackle human deprivations<br />
together. Inaction is not an option.<br />
The resounding voices of the people<br />
People everywhere want to influence the processes<br />
that shape their lives. They are vocal in<br />
raising concerns —such as those related to<br />
waste recycling and extractive industries, ethical<br />
sourcing and fair practices in trade, citizen<br />
safety and the public health implications of<br />
agribusiness and pharmaceuticals . Other examples<br />
include antiglobalization protests and the<br />
Occupy movement against wealth and income<br />
inequality. Technology and social media have<br />
mobilized grassroots activism and included<br />
people and groups previously unable to exercise<br />
voice and opinion (box 1.7).<br />
The Internet brings people together through<br />
offline protests as well. In 2014 the platform<br />
Avaaz.org coordinated a gathering of more than<br />
The world has the<br />
resources, the<br />
technology and<br />
the expertise to<br />
overcome human<br />
deprivations. And<br />
the notion of sharing<br />
prosperity gives us<br />
hope that we are<br />
ready to tackle human<br />
deprivations together<br />
Chapter 1 <strong>Human</strong> development — achievements, challenges and hopes | 39
As more people<br />
raise their voices to<br />
express their hopes<br />
and aspirations as<br />
well as their despair<br />
and frustration,<br />
mobilizing to demand<br />
what they want will<br />
become easier<br />
400,000 people in Manhattan — and hundreds<br />
of thousands more in other cities — for the “biggest<br />
climate march in history.” 158 Crowdfunding<br />
allows individuals to contribute small amounts<br />
of money towards a philanthropic project that<br />
requires larger funds. Donors can fund local<br />
projects through civic crowdfunding or projects<br />
in other countries through charity crowdfunding.<br />
159 Spacehive, a civic crowdfunding platform<br />
in the United Kingdom, specializes in raising<br />
funds for small community projects such as improving<br />
a playground or renovating a school. It<br />
has raised nearly £5 million (more than $6 million)<br />
since its launch in 2011. 160<br />
Although petitions, protests, fundraising and<br />
political publications have always existed, the<br />
Internet has allowed them to reach an unprecedented<br />
level and bring together people across<br />
the world. Mobile phones have multiplied the<br />
impact of popular movements. The broadcasting<br />
on Facebook of police attacks during prodemocracy<br />
demonstrations was instrumental<br />
in the 2011 Arab Spring. 161 Smartphones and<br />
subscription-free mobile phones will likely accelerate<br />
this trend, creating new opportunities<br />
for people to express themselves freely, even<br />
under authoritarian regimes.<br />
As more people raise their voices to express<br />
their hopes and aspirations as well as their despair<br />
and frustration, mobilizing to demand what they<br />
want will become easier. People’s voices can thus<br />
become a more powerful force, giving others<br />
hope in shaping the world they want.<br />
Expanding human ingenuity<br />
and creativity<br />
<strong>Human</strong> ingenuity and creativity have initiated<br />
technological revolutions and translated these<br />
revolutions into the way we work, think and<br />
behave. Technology is all around us, and sometimes<br />
in us — biotech, digital tech, nanotech,<br />
neurotech, green tech and so on. The digital<br />
revolution has been going on for some time.<br />
The number of connected devices worldwide<br />
was projected to increase from 9 billion in<br />
2012 to 23 billion in <strong>2016</strong>. 162 Some estimates<br />
put the Internet’s contribution to global GDP<br />
at as much as $4.2 trillion in <strong>2016</strong>. 163<br />
The innovations of the technological revolution<br />
have ranged from three-dimensional<br />
technology to digital banking, from e-books<br />
to e-commerce, from the sharing economy to<br />
crowdworking. Economies have become individualized<br />
to match demand and supply peerto-peer.<br />
The labour market does not require<br />
a traditional workplace, and the process has<br />
opened opportunities for many while making<br />
work precarious or even vulnerable for many<br />
others.<br />
Mobile phones and mobile Internet<br />
services offer many new opportunities for<br />
BOX 1.7<br />
Cyberactivism — a new form of participation<br />
Cyberactivism is political engagement by means of the<br />
Internet. Netizens are individuals who work to create<br />
online communities to realize social or political goals.<br />
But the Internet also brings together individuals who do<br />
not otherwise engage in political or public life and simply<br />
feel concerned by a specific issue.<br />
On several occasions in recent years, large numbers<br />
of people have signed online petitions to draw<br />
the attention of policymakers to their opinions. In 2010,<br />
2 million petitioners succeeded in banning politicians<br />
convicted of crimes from running for office in Brazil. In<br />
2012 an online petition received 1.8 million signatures<br />
in support of the recognition of Palestine as a state by<br />
the United Nations. In 2014, 2.3 million people signed<br />
an online petition to oppose the eviction of the Maasai<br />
people from their ancestral lands by the Tanzanian government.<br />
Since 2010 the United Kingdom has provided<br />
the opportunity for citizens to petition Parliament on an<br />
issue by gathering 100,000 signatures.<br />
In 2003 online mobilization led protests in several<br />
countries against the war in Iraq. Over the past<br />
10 years this trend has encompassed protests by civil<br />
society organizations and protests prompted by individuals<br />
who join together over a specific issue and<br />
then disengage from political discourse. An important<br />
aspect of these protests is their geographic scope,<br />
sometimes spanning several cities and sometimes<br />
several countries.<br />
Source: <strong>Human</strong> <strong>Development</strong> <strong>Report</strong> Office.<br />
40 | HUMAN DEVELOPMENT REPORT <strong>2016</strong>
people — access to dynamic price information<br />
(as in Niger), productivity gains (as in<br />
Morocco), job creation in technology-based<br />
industries and labour-market services. They<br />
have helped poor female entrepreneurs through<br />
marketing information (as in Bangladesh) and<br />
contributed to the financial inclusion of poor<br />
people through mobile banking (as in Kenya). 164<br />
The digital revolution raises the hope of addressing<br />
such daunting challenges as ensuring<br />
food security, overcoming health concerns,<br />
combating climate change and meeting energy<br />
needs. The development of immunotherapy has<br />
opened opportunities for successfully battling<br />
different types of cancers, such as breast cancer.<br />
Three-dimensional printing can produce<br />
industrial prototypes and human tissue. Cloud<br />
technology has the potential to improve access<br />
to online information technology services for<br />
businesses and governments at low cost and to<br />
enable new online products and services for<br />
millions of producers and billions of consumers.<br />
Continuing the progress in<br />
women’s empowerment<br />
Women have made major strides in all walks of<br />
life. Gender equality and women’s empowerment<br />
are not add-on issues in the development dialogue,<br />
but a mainstream dimension of the development<br />
discourse locally, nationally and globally.<br />
Women have proved to be productive<br />
economic actors, prudent decisionmakers, visionary<br />
leaders, compassionate volunteers and<br />
constructive peacekeepers. And many women<br />
are expanding their horizons.<br />
Focusing primarily on girls and disadvantaged<br />
groups, Nepal’s Welcome to School<br />
Initiative led to an increase in net enrolment<br />
of 470,000 children, 57 percent of them girls,<br />
within a year of its implementation in 2005. 165<br />
Nepal’s policy on adolescent girls was initially<br />
centred on health and education but now encompasses<br />
needs in employment, skills development<br />
and civic participation. 166<br />
Access to employment opportunities and<br />
to finance has opened opportunities for many<br />
poor women. The Women <strong>Development</strong> Act in<br />
the Philippines allows women to borrow money,<br />
obtain loans, execute security and credit arrangements<br />
and access loans in agrarian reform<br />
and land resettlement programmes under the<br />
same conditions as men. 167 Financial services in<br />
South Africa and the United States are similarly<br />
regulated to avoid gender discrimination. 168<br />
Romania’s Order No. 473/2014 supports<br />
female entrepreneurs by financing their best<br />
business plans. 169 It aims to cultivate entrepreneurship<br />
among woman-owned businesses.<br />
Bangladesh is encouraging female participation<br />
in the workforce, with the ambition of bringing<br />
the share of women in the workforce up<br />
from 34 percent to 82 percent by 2026, thus<br />
adding 1.8 percentage points to GDP. 170 In the<br />
Democratic Republic of Congo a new family<br />
code is being drafted to support women in business.<br />
171 All these efforts contribute to women’s<br />
economic empowerment, which needs to be<br />
appropriately conceptualized (box 1.8).<br />
Women have become active in areas where<br />
they were not traditionally active, and they<br />
have excelled in every aspect of life where they<br />
are engaged, even in societies where women<br />
have faced great obstacles in overcoming their<br />
traditional roles. Consider the success of Kimia<br />
Alizadeh, the Iranian female athlete at the <strong>2016</strong><br />
Olympics, who not only competed but won a<br />
medal. 172 There is now a female fighter pilot in<br />
the United Arab Emirates. 173<br />
Women are demanding gender equality in<br />
all walks of life. Nearly 15,000 people recently<br />
signed an online petition in Saudi Arabia calling<br />
on the government to abolish the country’s<br />
guardianship system, which prevents women<br />
from engaging in fundamental tasks without<br />
the permission of a male relative or without<br />
being accompanied. 174<br />
Society is gradually accepting and appreciating<br />
what women can achieve and contribute. Norms,<br />
values and legal frameworks are evolving. Côte<br />
d’Ivoire is tackling legal discrimination against<br />
women. 175 While in the 1990s very few countries<br />
legally protected women from violence, today<br />
127 do. This is partly the result of successful<br />
awareness- raising on the human and economic<br />
cost of such violence. 176 Lebanon now penalizes<br />
domestic violence. Peru prohibits sexual harassment<br />
in public spaces. Hungary criminalized economic<br />
violence as a form of domestic violence.<br />
Cabo Verde adopted a new law in 2011 to fight<br />
gender-based violence. 177 The State of Palestine<br />
recently elaborated the Arab region’s first national<br />
strategy to fight violence against women, with<br />
the participation of survivors of violence.<br />
Women have become<br />
active in areas<br />
where they were<br />
not traditionally<br />
active, and they have<br />
excelled in every<br />
aspect of life where<br />
they are engaged<br />
Chapter 1 <strong>Human</strong> development — achievements, challenges and hopes | 41
BOX 1.8<br />
Five misconceptions about women’s economic empowerment<br />
• Women’s economic contribution is limited when<br />
women are not employed. Globally, women are<br />
less engaged in paid employment than men. In<br />
2015, 36 percent of women and 44 percent of men<br />
worked full time for an employer. However, women’s<br />
economic contribution in unpaid care and domestic<br />
work is remarkable: a 2011 survey in 46<br />
countries found that, on average, 28 percent of<br />
women and 6 percent of men spent three to five<br />
hours a day on household work.<br />
• Women’s economic participation equals women’s<br />
economic empowerment. Increasing the number<br />
of women in the workforce is an important objective,<br />
but if they enter it under poor conditions, their<br />
empowerment may not be improved. Exploitation,<br />
dangerous or stigmatized work, low pay and job insecurity<br />
are unfavourable terms often encountered<br />
by women.<br />
• There is an automatic win-win between gender<br />
equality and wider development outcomes.<br />
Gender equality has been found to promote economic<br />
growth, household poverty reduction and<br />
human development. But the reverse is not always<br />
true. This means that governments need to pay<br />
dedicated attention to gender equality and not rely<br />
solely on growth to achieve it.<br />
• What works for one group of women will work for<br />
another. Women across the world often face similar<br />
obstacles, such as limited access to property<br />
and financial services, lack of social protection and<br />
unpaid care burden. Yet demographic, economic<br />
and cultural contexts also contribute to these barriers<br />
and make each woman’s experience different<br />
from others’. Policymakers cannot consider women<br />
to be a homogeneous group and apply standardized<br />
solutions to gender issues. Tailored approaches are<br />
required.<br />
• Increasing women’s individual skills and aspirations<br />
is the main challenge. Women’s capacity<br />
to seize economic opportunities can be substantially<br />
improved through individual support such<br />
as training in business management skills, but<br />
structural causes of gender inequality must be<br />
addressed simultaneously. A survey of 67 countries<br />
in 2009 showed that 20 percent of men believed<br />
that women should not be allowed to hold<br />
any job that they are qualified for outside of their<br />
home.<br />
Source: Hunt and Samman <strong>2016</strong>.<br />
Countries where the<br />
rule of law is applied<br />
also have more<br />
gender-equal laws<br />
El Salvador obtained its first conviction in<br />
a case of femicide after a national protocol<br />
to guide investigations was adopted. 178 In<br />
Latin America and the Caribbean the United<br />
Nations Entity for Gender Equality and the<br />
Empowerment of Women is working with the<br />
Office of the High Commissioner for <strong>Human</strong><br />
Rights to promote the adoption of a regional<br />
model protocol for investigating femicide. 179<br />
Gambia and the United Republic of Tanzania<br />
have banned child marriage, raising the legal age<br />
of marriage for both boys and girls to 18. 180 And<br />
in Mozambique, marrying the survivor of rape is<br />
no longer a defence option for rapists. 181<br />
Countries where the rule of law is applied<br />
also have more gender-equal laws. 182 Specialized<br />
courts that tackle acts of violence against<br />
women can help provide effective legal action.<br />
Domestic and family violence courts were<br />
created in Brazil through the Maria da Penha<br />
Law. The Indian inheritance law reform improved<br />
the economic freedom of women, who<br />
were thereby able to double their spending on<br />
their daughters’ education thanks to increased<br />
savings.<br />
Slowly opening the space for<br />
action on some taboos<br />
Several issues that were once rarely discussed and<br />
poorly addressed have received increased attention<br />
from the general public, civil society and<br />
policymakers over the last two decades. Among<br />
the groups of people who have benefited from<br />
breaking these taboos are lesbian, gay, bisexual,<br />
transgender and intersex people, women and<br />
girls who suffered female genital mutilation and<br />
cutting, and survivors of gender-based violence.<br />
Same-sex marriage is performed in nearly two<br />
dozen countries. 183 Numerous countries recognize<br />
civil unions, registered partnership and<br />
unregistered cohabitation. Even though lesbian,<br />
gay, bisexual, transgender and intersex people<br />
have equal constitutional rights in only five countries,<br />
at least their existence is recognized and<br />
their problems are discussed in various platforms,<br />
42 | HUMAN DEVELOPMENT REPORT <strong>2016</strong>
including the United Nations. 184 According to a<br />
report by GLSEN, the situation of lesbian, gay,<br />
bisexual, transgender and intersex students in the<br />
United Sates may be gradually improving, but it<br />
remains troublesome. 185 Many civil society organizations<br />
such as OutRight Action International<br />
have been working to address these issues.<br />
Several countries have implemented legal reforms<br />
to reduce female genital mutilation and<br />
cutting, femicide, acid violence and honour<br />
violence. Gambia has outlawed female genital<br />
mutilation and cutting. 186 El Salvador and<br />
Mexico have enacted legal reforms that define<br />
femicide as a criminal offence and have adopted<br />
measures to prevent and punish the crime. 187<br />
The first law banning acid violence was passed<br />
in Bangladesh in 2002, and the death penalty was<br />
introduced later as punishment for the crime. 188<br />
Acid attacks in Bangladesh fell from 494 incidents<br />
in 2002 to 59 in 2015. The Indian Penal Code<br />
was amended in 2013 to recognize acid violence<br />
as a criminal act. 189 Female parliamentarians, political<br />
leaders and nongovernmental advocates in<br />
Pakistan have actively supported new legislation to<br />
prevent acid attacks against women. 190 About 100<br />
acid attacks in Colombia occur each year, so the<br />
country strengthened its legislative framework and<br />
enacted a law in January <strong>2016</strong> to impose sentences<br />
of 12–50 years imprisonment for perpetrators. 191<br />
The Acid Survivor Foundation, active in<br />
Bangladesh, Cambodia and India, provides<br />
support to acid violence survivors. 192 A dedicated<br />
helpline in the State of Palestine, including<br />
online counselling and referral mechanisms,<br />
has already provided information to and potentially<br />
saved the lives of 18,000 callers. 193<br />
Increasing awareness of sustainability<br />
Awareness of sustainability has been increasing.<br />
It is much more visible in the global development<br />
agenda today than it was in the 1990s<br />
(box 1.9). Both the 2030 Agenda and the Paris<br />
Agreement on climate change bear this out.<br />
This increased visibility results from changes<br />
in the environment, natural resources and the<br />
climate that we can now all perceive. These<br />
changes have made it necessary to transform<br />
the way we produce, consume and function to<br />
protect our ability — and the ability of future<br />
generations — to live on the planet.<br />
Realization is growing that natural resources<br />
are everybody’s responsibility, from individuals to<br />
global institutions. They are global common-pool<br />
resources, meaning that they are limited (overuse<br />
reduces the availability for other users) and that<br />
anyone can access them relatively freely (regulating<br />
their consumption is difficult). So their<br />
management must be global, but national and<br />
local actions can have considerable impacts. The<br />
pollution of a river by a single factory can deplete<br />
natural resources along the riverbanks for kilometres<br />
downstream and pollute underground<br />
water reserves over an even larger area. Positive<br />
individual actions, if repeated by millions of people,<br />
can likewise make a difference.<br />
Several countries<br />
have implemented<br />
legal reforms to<br />
reduce female genital<br />
mutilation and cutting,<br />
femicide, acid violence<br />
and honour violence<br />
BOX 1.9<br />
The growing recognition of the importance of environmental sustainability<br />
In 1992 a milestone summit was organized in Rio de<br />
Janeiro that led to the United Nations Framework<br />
Convention on Climate Change. In 2000 environmental<br />
sustainability was included as one of the eight<br />
Millennium <strong>Development</strong> Goals and subsequently integrated<br />
into most international and national development<br />
strategies. At the World Summit on Social <strong>Development</strong><br />
in 2005, environmental sustainability was recognized as<br />
one of the three pillars of sustainable development, along<br />
with economic development and social development.<br />
The year 2015 was a turning point with the adoption<br />
of the 2030 Agenda, which gives unprecedented<br />
attention to environmental sustainability and climate<br />
change, and the Paris Agreement on climate change,<br />
through which 195 member states committed to reducing<br />
carbon emissions. Three of 17 Sustainable<br />
<strong>Development</strong> Goals are dedicated to environmental<br />
sustainability, and all of the others call for environmentally<br />
sustainable practices in their respective fields.<br />
Increasingly perceptible resource depletion and climate<br />
change highlight the importance of integrating environmental<br />
sustainability in development strategies for the<br />
good of present and future generations.<br />
Source: <strong>Human</strong> <strong>Development</strong> <strong>Report</strong> Office.<br />
Chapter 1 <strong>Human</strong> development — achievements, challenges and hopes | 43
SPECIAL CONTRIBUTION<br />
The power of culture to prompt action<br />
My son recently asked me whether he had saved much CO 2<br />
from being emitted<br />
into the air by using the Little Sun solar lamp I designed. He also wanted<br />
to know why, if a tonne of CO 2<br />
weighs so much, it does not drop to the<br />
ground. And where is it? To him, a tonne is heavy and physical and not an<br />
intangible mass distributed in the atmosphere. His questions made me realize<br />
how little I myself know about CO 2<br />
.<br />
When I was my son’s age, back in the late seventies, there was no<br />
discussion of climate change. Nature was where I spent my summers, in a<br />
tent in the Icelandic highlands, a stark contrast to the Copenhagen I lived<br />
in. These natural and manmade realms could not be more separate. But<br />
today, there is no nature outside of human activity. Our survival and future<br />
depend on understanding the effects of CO 2<br />
consumption and acting on that<br />
understanding.<br />
But what do we understand? What, for instance, is a tonne of CO 2<br />
? Is it<br />
hot or cold, wet or dry? Perhaps it would help to know that one tonne of CO 2<br />
could be imagined as a cube the size of a three-storey house or that, when<br />
frozen, it would form a block of dry ice about 0.67 cubic metres in size. But<br />
what does that actually tell me if I do not know how much CO 2<br />
I produce in<br />
a year or on an average day? What does it tell me if I do not sense my interrelationship<br />
with planet Earth?<br />
We need science to tell us that the weight of CO 2<br />
is based on the atomic<br />
mass of the molecules. A scientist can tell me that a tonne of CO 2<br />
is equal to<br />
the energy expenditure of a house for about a month, a small car driven for<br />
two days nonstop or a 747 flying for less than two minutes and that because<br />
of the greenhouse effect, excessive amounts of CO 2<br />
in the atmosphere lead<br />
to global warming.<br />
But for many people, science alone is not enough to compel action. It<br />
struck me, when I was looking up this data, that it was familiar, that I had seen<br />
it more than once in the media and that I somehow knew most of it. So I asked<br />
myself why does knowing not translate into doing when so much is at stake?<br />
This is where culture has something to offer. Culture can help us make<br />
sense of abstract concepts and information in ways which resonate. The<br />
visual arts, theatre, poetry, literature, dance, architecture and creativity in a<br />
broad sense help us build a relationship with abstract ideas, making them<br />
concrete, felt. Culture can add motivational impetus to the knowledge we<br />
gain from science. Importantly, however, culture can bring people to the<br />
point of action without prescribing the actual action. It does not tell us what<br />
to do or how to feel, but rather empowers us to find out for ourselves. Today,<br />
in politics, we are bombarded with emotional appeals, often linked to polarizing,<br />
populist ideas. The great thing about the arts and culture, on the other<br />
hand, is that they allow spaces to emerge in which people can disagree and<br />
still be together, where they can share individual and collective experiences,<br />
and, in the process, form diverse communities based on inclusion rather<br />
than exclusion. Experiences like these can become exercises in democracy,<br />
inspiring trust, in ourselves and in society.<br />
When I work in my studio, I draw inspiration from the fact that neuroscientists<br />
and psychologists recognize that the brain has two different systems<br />
for processing perceptions: one is analytical and deals with facts and data,<br />
and the other is experiential and deals with emotions and instincts. The experiential<br />
system — activated when you encounter art, for instance — tends<br />
to be the stronger motivator. Much of the communication on climate change,<br />
however, is focused on the analytical, attempting to reason with people to<br />
change their behaviour. Although it is clearly important to ground action in<br />
knowledge and rational thought, we also need to understand the central role<br />
of our experiential system in motivating action.<br />
Ice Watch, an artistic intervention that I created with Minik Rosing, a<br />
geologist and expert on Greenland, takes an experiential approach by bringing<br />
people into direct contact with the physical reality of climate change.<br />
In 2015, during COP21 in Paris, we brought almost 100 tonnes of glacial<br />
ice from Greenland to the Place du Panthéon. Visitors touched the blocks<br />
of ice as they melted, put their ear to them and even tasted the ice. When<br />
we asked people about their responses, most described feelings; they felt<br />
touched. Some spoke about the sounds of the melting ice, like miniature<br />
explosions — as if the small pockets of compressed air, frozen inside the turquoise<br />
ice for millennia, were speaking to us from the past. Contact with the<br />
ice afforded an experience of its fragility, of time and of the distant Arctic. It<br />
was both concrete, physical and spatial as well as abstract and contemplative.<br />
Together, the emotional and intellectual experience allowed each of us<br />
to host the climate debate in our bodies, paving the way for an embodied<br />
understanding of our changing environment and planet.<br />
Culture can inspire people to move from thinking to doing, and it holds<br />
the potential to inspire great social change. It is only by connecting the head<br />
and the heart that we will succeed in building a future for the planet shaped<br />
by positive, powerful climate action.<br />
Olafur Eliasson<br />
Artist and founder of Little Sun<br />
Climate-smart agriculture and climate-smart<br />
development are gaining currency. For example,<br />
about 500,000 solar panels were installed every<br />
day in 2015, an unprecedented growth that<br />
meant that renewable energy had become the<br />
world’s top source of installed power capacity. 194<br />
On a single day — 11 July <strong>2016</strong> — India planted<br />
50 million trees to take on climate change. 195<br />
In 2015, 247,000 electric cars were sold in<br />
China. 196 Globally, 13 percent of greenhouse<br />
44 | HUMAN DEVELOPMENT REPORT <strong>2016</strong>
gas emissions are now covered by carbon pricing<br />
initiatives. 197 The value of the trade in environmental<br />
goods almost tripled between 2001<br />
and 2012, from $231 billion to $656 billion. 198<br />
According to some estimates, the value of the<br />
environmental goods and services market will<br />
reach $1.9 trillion by 2020. Trade can also do<br />
more to spread green technology. A clear shift<br />
in spending towards cleaner energy was seen in<br />
2015 — $313 billion in renewable energy sources<br />
and $221 billion in energy efficiency. 199<br />
But awareness about sustainability has to take<br />
a broader view. For example, climate change is<br />
not only an environmental issue or a science<br />
issue. Olafur Eliasson, artist and founder of<br />
Little Sun, argues that to internalize and act<br />
on the vital data of climate change, culture has<br />
something to offer (see special contribution).<br />
Stronger global commitments<br />
Over the years people have grown accustomed<br />
to heated debates leading to bitter gridlock<br />
at the national, regional and global levels.<br />
But through the rubble the tender shoots of<br />
a global consensus are emerging to ensure a<br />
sustainable world for future generations. The<br />
2030 Agenda adopted by 193 member states<br />
of the United Nations on 25 September 2015<br />
is among the most important platforms for<br />
efforts to end poverty by 2030 and pursue a<br />
sustainable future. 200 The agenda includes 17<br />
Sustainable <strong>Development</strong> Goals, 169 targets<br />
and 230 indicators (box 1.10).<br />
Similarly, parties to the United Nations<br />
Framework Convention on Climate Change<br />
reached a landmark agreement on 12<br />
December 2015 in Paris, charting a fundamentally<br />
new course in the two-decade-old global<br />
climate efforts. After four years of negotiations<br />
the treaty is the first to consider both developed<br />
and developing countries in a common<br />
framework, urging them all to make their best<br />
efforts and reinforce their commitments in<br />
the coming years. 201 All parties should now<br />
report regularly on emissions and on efforts to<br />
implement their commitments and submit to<br />
international review. The Paris Agreement on<br />
climate change came into force on 4 November<br />
<strong>2016</strong>. More than 70 countries, which account<br />
for nearly 60 percent of global emissions, have<br />
ratified it. 202<br />
The first UN Summit for Refugees, held<br />
in September <strong>2016</strong>, brought member states<br />
together to agree on a more humane and coordinated<br />
way to respond to the risks faced<br />
by refugees and migrants and to prepare for<br />
future challenges. It resulted in the New York<br />
Declaration, a series of national and international<br />
commitments (see chapter 6).<br />
A recent groundbreaking ruling by the<br />
International Criminal Court in The Hague<br />
sentenced an Islamic militant from Mali who<br />
helped destroy the fabled shrines of Timbuktu<br />
to imprisonment for nine years. 203 The trial was<br />
unique on two fronts: it was the first at the<br />
court to focus solely on cultural destruction as<br />
a war crime, and it was the court’s first prosecution<br />
of an Islamic militant.<br />
The human development<br />
approach and the 2030 Agenda<br />
The human development approach and the<br />
2030 Agenda have three common analytical<br />
links (figure 1.10):<br />
• Both are anchored in universalism — the human<br />
development approach by emphasizing<br />
the enhancement of freedoms for every human<br />
being and the 2030 Agenda by concentrating<br />
on leaving no one behind.<br />
• Both share the same fundamental areas of<br />
focus — eradicating extreme poverty, ending<br />
hunger, reducing inequality, ensuring gender<br />
equality and so on.<br />
• Both have sustainability as the core principle.<br />
The links among the human development approach,<br />
the 2030 Agenda and the Sustainable<br />
<strong>Development</strong> Goals are mutually reinforcing<br />
in three ways. First, the conceptual foundation<br />
of the 2030 Agenda is strengthened by the<br />
analytical elements of the human development<br />
approach strengthen its conceptual foundation.<br />
Similarly, the human development approach is<br />
enriched by elements in the narrative of the<br />
2030 Agenda.<br />
Second, the Sustainable <strong>Development</strong> Goal<br />
indicators can be used with the human development<br />
indicators in assessing progress towards<br />
the Sustainable <strong>Development</strong> Goals. Similarly,<br />
the human development approach can supplement<br />
the Sustainable <strong>Development</strong> Goal<br />
indicators with additional indicators.<br />
In spite of heated<br />
debates leading to<br />
bitter gridlock at the<br />
national, regional<br />
and global levels,<br />
through the rubble<br />
the tender shoots of a<br />
global consensus are<br />
emerging to ensure a<br />
sustainable world for<br />
future generations<br />
Chapter 1 <strong>Human</strong> development — achievements, challenges and hopes | 45
BOX 1.10<br />
Sustainable <strong>Development</strong> Goals<br />
Goal 1<br />
End poverty in all its forms everywhere<br />
Goal 2<br />
End hunger, achieve food security and improved nutrition<br />
and promote sustainable agriculture<br />
Goal 3<br />
Ensure healthy lives and promote well-being for all at<br />
all ages<br />
Goal 4<br />
Ensure inclusive and equitable quality education and<br />
promote lifelong learning opportunities for all<br />
Goal 5<br />
Achieve gender equality and empower all women and girls<br />
Goal 10<br />
Reduce inequality within and among countries<br />
Goal 11<br />
Make cities and human settlements inclusive, safe,<br />
resilient and sustainable<br />
Goal 12<br />
Ensure sustainable consumption and production patterns<br />
Goal 13<br />
Take urgent action to combat climate change and its<br />
impacts 1<br />
Goal 14<br />
Conserve and sustainably use the oceans, seas and marine<br />
resources for sustainable development<br />
The links among the<br />
human development<br />
approach, the<br />
2030 Agenda and<br />
the Sustainable<br />
<strong>Development</strong> Goals are<br />
mutually reinforcing<br />
Goal 6<br />
Ensure availability and sustainable management of water<br />
and sanitation for all<br />
Goal 7<br />
Ensure access to affordable, reliable, sustainable and<br />
modern energy for all<br />
Goal 8<br />
Promote sustained, inclusive and sustainable economic<br />
growth, full and productive employment and decent<br />
work for all<br />
Goal 9<br />
Build resilient infrastructure, promote inclusive and sustainable<br />
industrialization and foster innovation<br />
Third, the <strong>Human</strong> <strong>Development</strong> <strong>Report</strong> can<br />
be an extremely powerful advocacy instrument<br />
for the 2030 Agenda and the Sustainable<br />
<strong>Development</strong> Goals. And the Sustainable<br />
<strong>Development</strong> Goals can be a good platform<br />
for the greater visibility of the human development<br />
approach and the <strong>Human</strong> <strong>Development</strong><br />
<strong>Report</strong> through 2030.<br />
Universalism is at the core of human development.<br />
And given the progress in human<br />
Goal 15<br />
Protect, restore and promote sustainable use of terrestrial<br />
ecosystems, sustainably manage forests, combat<br />
desertification, and halt and reverse land degradation<br />
and halt biodiversity loss<br />
Goal 16<br />
Promote peaceful and inclusive societies for sustainable<br />
development, provide access to justice for all and build<br />
effective, accountable and inclusive institutions at all<br />
levels<br />
Goal 17<br />
Strengthen the means of implementation and revitalize<br />
the Global Partnership for Sustainable <strong>Development</strong><br />
1. Acknowledging that the United Nations Framework Convention on Climate Change is the primary international, intergovernmental forum for negotiating the global<br />
response to climate change.<br />
Source: United Nations 2015c.<br />
development over the past 25 years and the<br />
hope it presents, human development for everyone<br />
must be and can be attained. But there are<br />
considerable challenges and barriers to universal<br />
human development So universalism of human<br />
development must not remain a philosophical<br />
tenet. It must become a practical reality to<br />
analyse the who and where of why human development<br />
not reaching everyone — a task for<br />
chapter 2.<br />
46 | HUMAN DEVELOPMENT REPORT <strong>2016</strong>
FIGURE 1.10<br />
Analytical links between the human development approach and the 2030 Agenda<br />
The human<br />
development<br />
approach<br />
Review the narrative of the 2030 Agenda and examine parts that can enrich it<br />
Sustainability<br />
The core principle<br />
Common anchors<br />
Eradication of extreme poverty, ending hunger…<br />
Fundamental area of focus<br />
The 2030<br />
Agenda and<br />
the Sustainable<br />
<strong>Development</strong><br />
Goals<br />
Freedoms for every human being<br />
Principle of universalism<br />
Use analytical elements of human development to strengthen its conceptual foundation<br />
Leaving no one behind<br />
Source: <strong>Human</strong> <strong>Development</strong> <strong>Report</strong> Office.<br />
Chapter 1 <strong>Human</strong> development — achievements, challenges and hopes | 47
Chapter 2<br />
Universalism—<br />
from principles<br />
to practice
Infographic 2.1 Barriers to universalism<br />
Intolerance<br />
and exclusion<br />
Discriminatory laws<br />
Social norms<br />
Violence<br />
Narrow<br />
self-identities<br />
Nationalism<br />
Identity politics<br />
Barriers to<br />
universalism<br />
Weak<br />
bargaining power<br />
Inequality<br />
Lack of voice<br />
Elite capture<br />
of institutions<br />
Rise of 1 percent<br />
Lack of pluralism
<strong>Human</strong> <strong>Development</strong><br />
2.<br />
<strong>Report</strong> <strong>2016</strong><br />
<strong>Human</strong> <strong>Development</strong> for Everyone<br />
Universalism—from principles<br />
to practice<br />
The progress in human development over the past 25 years has been impressive on many fronts. More children are going to<br />
school, people are living longer, incomes are higher and people have greater potential to shape their societies and their future<br />
under democratic forms of government. But the gains have not been universal, and not all lives have been lifted. This reality<br />
was the impetus for the intergovernmental agreement on the 2030 Agenda, which aims to leave no one behind. Millions of<br />
people are indeed unable to reach their full potential in life because they suffer deprivations in multiple dimensions of human<br />
development — lacking income and secure livelihoods, experiencing hunger and malnutrition, having no or limited access to<br />
social services, fearing violence and discrimination and being marginalized from the political processes that shape their lives.<br />
There are imbalances across countries; socioeconomic, ethnic and racial groups; urban and rural areas; and women and men.<br />
Some groups are more deprived than others, and the most deprived individuals belong to multiple disadvantaged groups — an<br />
older, ethnic minority woman in a least developed country, for example.<br />
The absolute deprivations in basic human development<br />
remain pronounced and demand urgent<br />
attention. But being left behind is a dynamic and<br />
relative process, so universalism — human development<br />
for everyone — requires a forward-looking<br />
approach. As gains are achieved, other<br />
deprivations may become more critical, and new<br />
groups may bear the burden of being left behind.<br />
Many people appear to be doing well according<br />
to measures such as minimum schooling and income,<br />
but the quality of education and of work<br />
conditions are low for many millions of people.<br />
Likewise, people are living longer and healthier<br />
lives, but many face deficits in political freedom<br />
and in opportunities for political participation.<br />
Demographic shifts, transitions from peace<br />
to insecurity and other macro threats such as<br />
epidemics, financial crises, natural disasters<br />
and climate change all generate new forms of<br />
advantage and disadvantage. In this digital age<br />
a lack of reliable access to information, infrastructure<br />
or technology can severely curtail<br />
opportunities, even in developed countries,<br />
reshaping patterns of deprivation. And even as<br />
restrictive social norms—such as restrictions<br />
on women working outside the home—lose<br />
force in some societies, others—such as discrimination<br />
against older people—become<br />
more powerful. Who is left behind, how and<br />
why are questions with different answers in<br />
different places at different times.<br />
Enabling all human beings to realize their full<br />
potential demands urgent attention to inequality<br />
and to relative capabilities and opportunities.<br />
It is not enough to enable those with the least<br />
capabilities to move above minimum thresholds.<br />
For instance, even if extreme poverty were<br />
to be eradicated globally or universal primary<br />
school enrolment attained, the wealthy and<br />
highly educated could simultaneously accrue<br />
enormous economic resources or achieve higher<br />
tertiary enrolment rates, thereby maintaining or<br />
even widening gaps in key capabilities. Despite<br />
absolute gains for all people, the possibilities<br />
for those with the least wealth and education to<br />
realize their full potential would continue to lag.<br />
Because the starting points vary widely<br />
across individuals, more equitable outcomes<br />
may require greater attention and support<br />
for the people who are farthest behind. It is<br />
particularly important to close the gaps in<br />
voice and agency. Institutions and policies may<br />
otherwise disproportionately reflect the values<br />
and interests of elites, who often have greater<br />
voice. There is a risk that gaps could become<br />
self-perpetuating and ever more difficult to<br />
eradicate. And extreme inequalities in voice<br />
and agency can breed economic, social and<br />
political instability and conflict.<br />
<strong>Human</strong> development embodies a commitment<br />
to ensure rights, voice, security and<br />
freedom — not to most, but to all people in<br />
every corner of the world. It also stresses the<br />
importance of sustaining capabilities and opportunities<br />
throughout an individual’s lifecycle<br />
and for subsequent generations.<br />
As gains are achieved,<br />
other deprivations may<br />
become more critical,<br />
and new groups may<br />
bear the burden of<br />
being left behind<br />
Chapter 2 Universalism—from principlesto practice | 51
One of the main<br />
challenges of<br />
practical universalism<br />
is reaching those<br />
who experience<br />
the most extreme<br />
deprivations and those<br />
who are the most<br />
socially marginalized<br />
and excluded<br />
One of the main challenges of practical<br />
universalism — advancing from ideas to actions<br />
and institutions — is reaching those who experience<br />
the most extreme deprivations and those<br />
who are the most socially marginalized and<br />
excluded. Technical and financial barriers can<br />
be overcome, and there are indeed strong collective<br />
efforts in this direction. But deep-seated<br />
barriers to universalism, including discriminatory<br />
social norms and laws and inequalities in<br />
agency and voice, require more attention. There<br />
is also a need to appreciate the dynamic nature<br />
of deprivations and exclusion — that gains can<br />
be reversed by health or financial shocks, that<br />
new barriers can emerge if conflict erupts or<br />
community security and services deteriorate<br />
and that new groups without reliable access<br />
to the Internet can be marginalized when that<br />
access becomes central to livelihoods.<br />
The goal is not only to reach the most deprived<br />
and ensure that no one is left behind<br />
today, but also to protect those at risk of being<br />
left behind tomorrow. Universalism is a principle<br />
of the human development approach, and<br />
now is the time to translate it into practice by<br />
identifying and breaking down barriers that<br />
exclude certain groups, narrowing the wide<br />
gaps in life chances among different groups,<br />
proposing policy options that fit contexts<br />
and levels of development and identifying<br />
institutional shortcomings. This is practical<br />
universalism.<br />
Momentum towards universalism<br />
Space is opening for the practice of universalism<br />
and the extension of human development to<br />
everyone. The 2030 Agenda takes a universal approach.<br />
Its Sustainable <strong>Development</strong> Goals embody<br />
a shared vision of progress towards a safe,<br />
just and sustainable world in which all human<br />
beings can thrive. The goals reflect principles<br />
of universality that no one and no country<br />
should be excluded and that everyone and every<br />
country share a common — albeit differentiated<br />
— responsibility for the outcomes of all. Global<br />
momentum is thus in place to enable policymakers<br />
and advocates to move in ways that may have<br />
been much more difficult in the past.<br />
Translating principle into policy and institutional<br />
practice requires mapping out who the<br />
deprived are, where they live, what the extent<br />
of their deprivation is and what the risks of new<br />
deprivations are. The <strong>Report</strong> on the World Social<br />
Situation <strong>2016</strong> noted that universalism is possible<br />
only after those who are being left behind<br />
have been identified. 1 With this reasoning, this<br />
chapter:<br />
• Looks beyond national averages and existing<br />
measures.<br />
• Comprehends the development barriers that<br />
often block particular groups, such that some<br />
groups are disproportionately marginalized<br />
and more at risk of emerging threats.<br />
• Contextualizes human development, identifying<br />
deprivations and inequalities across the<br />
spectrum of countries with different incomes<br />
and human development profiles and mapping<br />
out how new barriers can emerge, even<br />
as some deprivations are overcome.<br />
• Analyses the barriers to practical universalism<br />
so that steps can be taken to eliminate them.<br />
Beyond averages — using<br />
the family of human<br />
development indices<br />
<strong>Human</strong> development is about improving the<br />
life chances of individuals. However, the measures<br />
used to monitor progress in human development<br />
often cover only countries and not<br />
individuals or groups. Disaggregated measures<br />
are therefore needed that show who is deprived,<br />
where they live and the nature of their deprivations.<br />
National, subregional and regional<br />
<strong>Human</strong> <strong>Development</strong> <strong>Report</strong>s have identified<br />
deprivations by analysing data disaggregated<br />
by age, gender, subnational units, ethnicity and<br />
other parameters. Disaggregating and analysing<br />
the family of human development indices —<br />
the <strong>Human</strong> <strong>Development</strong> Index (HDI), the<br />
Inequality-adjusted <strong>Human</strong> <strong>Development</strong><br />
Index (IHDI), the Gender <strong>Development</strong> Index<br />
(GDI), the Gender Inequality Index (GII) and<br />
the Multidimensional Poverty Index (MPI) —<br />
are early steps towards quantifying the scale of<br />
deprivations globally.<br />
<strong>Human</strong> <strong>Development</strong> Index<br />
The HDI is one tool for identifying deprivations<br />
in a selection of essential capabilities (a<br />
52 | HUMAN DEVELOPMENT REPORT <strong>2016</strong>
long and healthy life, knowledge and a decent<br />
standard of living). Country-level trends on<br />
the HDI have been impressive over the past<br />
25 years: Between 1990 and 2015 the number<br />
of countries classified as having low human<br />
development fell from 62 to 41, and those<br />
classified as having very high human development<br />
rose from 11 to 51. 2 These shifts reflect<br />
improvements in the life conditions of millions<br />
of people. But the trends also reflect average<br />
national progress. The unfortunate reality is<br />
that millions of people fall on the wrong side of<br />
the average and struggle with hunger, poverty,<br />
illiteracy and malnutrition, among other deprivations.<br />
Making human development work for<br />
everyone requires a greater understanding of<br />
who these people are and where they live.<br />
Disaggregated HDI values within countries<br />
confirm that many people live with unacceptably<br />
high deprivation, even though their country<br />
appears to have improved in HDI value and<br />
rank. Panama is classified as having high human<br />
development, but 2 of its 12 provinces are classified<br />
as having low human development, while<br />
the capital province is classified as having very<br />
high human development. 3 Ethiopia is classified<br />
as having low human development, as are<br />
9 of its 11 regions, but 2 regions are classified as<br />
FIGURE 2.1<br />
having medium human development. 4 In both<br />
countries the split is between capital provinces<br />
and more rural areas.<br />
Disaggregation at the global level suggests<br />
that a third of the world’s population lives in<br />
low human development (figure 2.1). Many of<br />
these people are severely deprived in education,<br />
health and income. Medium, high and very<br />
high human development countries are home<br />
to hundreds of millions of people living in low<br />
human development. 5 Many people are being<br />
left behind in countries across the development<br />
spectrum.<br />
Inequality-adjusted <strong>Human</strong><br />
<strong>Development</strong> Index<br />
Unequal concentrations of well-being mean<br />
that indicators of average human development<br />
like the HDI do not reflect the well-being of<br />
a vast portion of the population. The IHDI<br />
quantifies the effects of inequality on human<br />
development, measured in terms of the HDI.<br />
Some 22 percent of the world’s human development<br />
is lost because of inequality. 6 Inequality<br />
in education contributes the most to overall<br />
inequality, followed by inequality in income<br />
and inequality in life expectancy. Sub-Saharan<br />
Disaggregated<br />
HDI values within<br />
countries confirm<br />
that many people live<br />
with unacceptably<br />
high deprivation,<br />
even though their<br />
country appears to<br />
have improved in<br />
HDI value and rank<br />
A third of the world’s population lives in low human development<br />
7.4 billion people<br />
in the world<br />
Where they live<br />
One-third live<br />
in low human<br />
development<br />
22%<br />
Very high<br />
and high human<br />
development<br />
countries<br />
45%<br />
Medium human<br />
development<br />
countries<br />
33%<br />
Low human<br />
development<br />
countries<br />
Source: <strong>Human</strong> <strong>Development</strong> <strong>Report</strong> Office.<br />
Chapter 2 Universalism—from principlesto practice | 53
The deprivations<br />
facing women are the<br />
most extreme barrier<br />
to global progress in<br />
human development<br />
Africa has the highest loss of human development<br />
because of inequality (32 percent). 7<br />
At the country level unequal distribution of<br />
human development occurs both in low human<br />
development countries, such as Comoros<br />
(where 46 percent of human development is lost<br />
because of inequality) and in very high human<br />
development countries, such as Chile (where 18<br />
percent of human development is lost because of<br />
inequality). 8 The IHDI indicates that human development<br />
for everyone will require considerable<br />
interventions to overcome unequal distributions<br />
in key capabilities within countries.<br />
Gender <strong>Development</strong> Index and<br />
Gender Inequality Index<br />
Women are more likely than men to suffer from<br />
low human development. 9 Many groups are<br />
disadvantaged, but the systemic deprivations of<br />
women relative to men deserve to be highlighted<br />
because women constitute half the world’s<br />
population. The deprivations facing women are<br />
the most extreme barrier to global progress in<br />
human development.<br />
Despite the fact that in all regions women<br />
have longer life expectancy than do men and<br />
the fact that in most regions the expected number<br />
of years of schooling for girls is similar to<br />
that for boys, women consistently have a lower<br />
HDI value than do men. The largest differences<br />
captured by the GDI are in South Asia, where<br />
the HDI value for women is 17.8 percent lower<br />
than the HDI value for men, followed by the<br />
Arab States with a 14.4 percent difference and<br />
Sub-Saharan Africa with 12.3 percent.<br />
Much of the variation in HDI between<br />
women and men is due to lower income among<br />
women relative to men and to lower educational<br />
attainment among women relative to men. Part<br />
of the variation in the HDI between men and<br />
women is generated by barriers to women working<br />
outside the home, to accessing education,<br />
to voicing their concerns in political arenas, to<br />
shaping policies and to receiving the benefits of<br />
high-quality and accessible health care.<br />
The GII is a composite index that captures<br />
the inequality that many women face in reproductive<br />
health, secondary education, political<br />
representation and the labour market (figure<br />
2.2). Women are the most disadvantaged in low<br />
human development countries. 10<br />
FIGURE 2.2<br />
Women are the most disadvantaged in low human<br />
development countries<br />
Low<br />
human<br />
development<br />
.590<br />
Very high<br />
human development<br />
.174<br />
.491<br />
Medium<br />
human development<br />
.291<br />
A challenge to global progress in human development<br />
across all regions and groups, gender<br />
inequality is most severe in low and medium<br />
human development countries and in the Arab<br />
States, South Asia and Sub-Saharan Africa. 11<br />
As countries’ human development improves,<br />
women’s choices and opportunities must be<br />
equal to those of men so that everyone benefits<br />
from advances in human development.<br />
Multidimensional Poverty Index<br />
High<br />
human<br />
development<br />
Note: 1 indicates absolute inequality, as measured by the Gender Inequality<br />
Index, and 0 indicates perfect equality.<br />
Source: <strong>Human</strong> <strong>Development</strong> <strong>Report</strong> Office.<br />
Deprived people often lack capabilities and<br />
opportunities across multiple dimensions. The<br />
MPI, which is calculated for 102 developing<br />
countries, reveals more about the depth and<br />
overlapping nature of people’s nonincome deprivations<br />
than do one-dimensional measures of<br />
poverty. Based on 10 indicators, the MPI identifies<br />
households that are acutely deprived by<br />
their health, education and standard of living.<br />
Almost 1.5 billion people in the developing<br />
countries for which the MPI is calculated live<br />
in multidimensional poverty, 53.9 percent of<br />
them in South Asia and 33.5 percent in Sub-<br />
Saharan Africa. 12 People are also deprived in<br />
developed countries (box 2.1).<br />
Some systematic patterns of deprivation can<br />
be inferred from poverty measures. People in<br />
rural areas are far more likely than people in<br />
urban areas to be multidimensionally poor (29<br />
54 | HUMAN DEVELOPMENT REPORT <strong>2016</strong>
BOX 2.1<br />
Poverty is also a developed country problem<br />
Deprivations are a universal problem afflicting people in<br />
developed and developing countries alike. An average of<br />
11 percent of the population in Organisation for Economic<br />
Co-operation and <strong>Development</strong> (OECD) countries were<br />
below the income poverty line in 2014. 1 As of 2012 there<br />
were 633,000 homeless people in the United States and<br />
284,000 in Germany. 2 OECD countries have the highest<br />
incarceration rates of any group of countries: an average<br />
of 274 people per 100,000, isolated from society in<br />
prison. 3 An average of 15 percent of young people ages<br />
15–29 are neither employed nor in education or training<br />
and are struggling to find their place in society. 4 Health<br />
deprivations caused by obesity are also high. The most recent<br />
survey data indicate that an average of 53.8 percent<br />
of the adult population in OECD countries is overweight<br />
or obese and faces high risks of cardiovascular disease,<br />
respiratory illnesses, diabetes and other diseases. 5<br />
The data make clear that not all people in countries<br />
classified as having very high human development are<br />
able to achieve their full life potential. Poverty can take<br />
different forms in developed countries and in developing<br />
countries, but it is no less debilitating to the choices and<br />
the future of individuals and households experiencing<br />
the deprivations.<br />
Notes<br />
1. OECD <strong>2016</strong>a. 2. OECD 2015a. 3. Based on UNODC (<strong>2016</strong>). 4. OECD <strong>2016</strong>e. 5. OECD 2015b.<br />
Source: <strong>Human</strong> <strong>Development</strong> <strong>Report</strong> Office.<br />
percent versus 11 percent), though there is variation<br />
across regions (figure 2.3).<br />
Nearly half of people in rural areas worldwide<br />
lack access to improved sanitation facilities,<br />
compared with a sixth of people in urban areas.<br />
13 And twice as many rural children as urban<br />
children are out of school. 14 At the same time,<br />
slumdwellers account for 48 percent of the<br />
FIGURE 2.3<br />
urban population in developing countries and<br />
are deprived of many services and opportunities<br />
— the very benefits that many deprived people<br />
migrated from rural areas to obtain. 15<br />
There is a high likelihood that if a household<br />
is deprived in one of the 10 indicators used to<br />
calculate the MPI, it will also be deprived in<br />
others. To improve the conditions of the most<br />
People in rural areas are far more likely than people in urban areas to be multidimensionally poor<br />
There is a high<br />
likelihood that if<br />
a household is<br />
deprived in one of<br />
the 10 indicators<br />
used to calculate the<br />
MPI, it will also be<br />
deprived in others<br />
Population in multidimensional poverty (%)<br />
74<br />
Rural population<br />
Urban population<br />
64<br />
29<br />
31<br />
25<br />
29<br />
19<br />
11<br />
8<br />
3<br />
8<br />
2<br />
Developing<br />
countries<br />
Sub-Saharan<br />
Africa<br />
South Asia<br />
Arab States<br />
Latin America<br />
& the Caribbean<br />
East Asia &<br />
the Pacific<br />
3<br />
1<br />
Europe and<br />
Central Asia<br />
Source: <strong>Human</strong> <strong>Development</strong> <strong>Report</strong> Office.<br />
Chapter 2 Universalism—from principlesto practice | 55
Viewing the nation<br />
as the primary<br />
unit of analysis<br />
for policymaking<br />
and measurement<br />
has value, but<br />
looking directly at<br />
the conditions of<br />
individuals is essential<br />
for identifying who<br />
is being left behind<br />
deprived, a more comprehensive cross-sectoral<br />
approach to policy may thus be more effective<br />
than interventions that separately target particular<br />
elements of poverty.<br />
Poverty rates differ between men and women.<br />
Although at the global level households<br />
headed by men and those headed women are<br />
almost equally likely to be multidimensionally<br />
poor — 29 percent of man-headed households<br />
and 28 percent of woman-headed households<br />
are multidimensionally poor — there is considerable<br />
variation across countries and regions. 16<br />
Because the MPI is calculated at the household<br />
level rather than at the individual level, complementary<br />
research may be needed to clarify<br />
the relationship between gender and poverty.<br />
People are more likely to fall into multidimensional<br />
poverty during conflict, and people<br />
in conflict areas face particular barriers to<br />
moving out of multidimensional poverty. An<br />
average of 49 percent of the population in 24<br />
countries in conflict for which the MPI is calculated<br />
lives in multidimensional poverty, and<br />
another 16 percent live in near-poverty. An average<br />
of 27 percent of people in these countries<br />
live in severe multidimensional poverty.<br />
Deprivations also vary across socioeconomic<br />
groups. In Sub-Saharan Africa poor people,<br />
especially women attending school in rural<br />
communities, are far less likely than nonpoor<br />
people to be learning critical skills such as<br />
reading, writing and mathematics. 17 In Chad<br />
the richest quintile of the population averages<br />
6.7 years of schooling, compared with 1.0 for<br />
the poorest quintile. The story is similar in<br />
Ethiopia — 7.5 years for the richest quintile<br />
and 1.6 years for the poorest quintile — and<br />
in Madagascar — 9.8 years and 1.7 years. 18 In<br />
South Africa HIV prevalence is higher among<br />
the poorest socioeconomic groups. Access to<br />
basic social services of acceptable quality is<br />
often limited among people living in poverty,<br />
intensifying the disparities in well-being. In<br />
Zambia poor people are less likely to use public<br />
hospitals because of financial and physical<br />
barriers, despite having greater need than other<br />
income groups. 19<br />
Too many people are still missing out<br />
The HDI, GII, GDI and MPI indicate that not<br />
everyone is lifted as countries progress on these<br />
average measures. Despite the overall progress,<br />
about one-third of people in the world live in<br />
unacceptably low human development. Many<br />
of them — especially women and girls, people in<br />
rural areas and people in countries in conflict—<br />
suffer multiple and overlapping deprivations.<br />
Viewing the nation as the primary unit of<br />
analysis for policymaking and measurement<br />
has value, but looking directly at the conditions<br />
of individuals is essential for identifying<br />
who is being left behind. Countries’ human<br />
development may improve, but this does not<br />
mean that entire populations are better off<br />
or benefit equally. Supplementing national<br />
measures with subnational measures is important<br />
for policymaking. Data disaggregation is<br />
critical for identifying the integrated actions<br />
needed to support universalism and the full<br />
realization of life potential among all people<br />
(see chapter 3). Melinda Gates, co-chair of<br />
the Bill & Melinda Gates Foundation, argues<br />
that getting a clearer picture of poverty<br />
and deprivation is a fundamental first step<br />
towards designing and implementing more effective<br />
policies and interventions (see special<br />
contribution).<br />
A look at disadvantaged groups<br />
All people in all circumstances are not equally<br />
disadvantaged. People with certain characteristics,<br />
in certain locations or at particularly<br />
vulnerable stages of the lifecycle are more<br />
likely than other people to lack access to<br />
capability-enhancing resources and opportunities<br />
to suffer deprivations. These groups are<br />
also disproportionately exposed and vulnerable<br />
to emerging threats such as epidemics, climate<br />
change and natural disasters, so progress<br />
may be less sustainable among these groups<br />
even when gains in human development are<br />
achieved. Group distinctions such as ethnicity<br />
or religion can serve as dividing lines to support<br />
discrimination and restrict access to resources<br />
and opportunities. The result can be differences<br />
in the human development outcomes of<br />
particular groups. The following subsections<br />
identify some of the groups that are missing out<br />
on progress in human development and show<br />
how deprivations may take shape in particular<br />
contexts and conditions.<br />
56 | HUMAN DEVELOPMENT REPORT <strong>2016</strong>
SPECIAL CONTRIBUTION<br />
Getting a clearer picture of poverty<br />
I was asked last year to select one photograph that has profoundly influenced<br />
my life. I chose an image known as Migrant Mother — a haunting picture of<br />
a woman named Florence Owens Thompson sitting with three of her children<br />
in their makeshift home, a rudimentary tent. The photograph was taken<br />
in California in 1936 as millions of American families struggled through the<br />
Great Depression. Florence and her family are destitute and desperate.<br />
That iconic photograph, which I first came across in high school, still<br />
comes to mind whenever poverty is the topic of conversation. Poverty as a<br />
category of analysis is an abstraction. Migrant Mother captures its harsh,<br />
biting reality better than any other image — and any dictionary definition or<br />
economic indicator — that I have ever seen. And what motivates me is that,<br />
70 years on, this struggle is still daily life for more than a billion people<br />
around the world.<br />
In my work I have seen that struggle firsthand. I have seen how lack of<br />
family planning advice and contraceptives leaves parents with more mouths<br />
to feed than they can afford; how not getting the right food and nutrients<br />
leaves people unable to fulfil their potential; and how disease leaves adults<br />
too weak to work, and children too sick for school.<br />
So while there are robust and legitimate debates going on about the<br />
methodology and measurements we use to classify poverty, first and foremost<br />
we must remember what it actually means to be poor. Essentially,<br />
being poor is about deprivation. Poverty not only deprives people of food,<br />
shelter, sanitation, health, income, assets and education, it also deprives<br />
them of their fundamental rights, social protections and basic dignity.<br />
Poverty also looks different in different places. While in East Africa it is<br />
related mostly to living standards, in West Africa child mortality and lack of<br />
education are the biggest contributors.<br />
All this complexity and variation is impossible to capture in a definition<br />
of poverty as simplistic as living on less than $1.90 a day. If we really<br />
mean to “end poverty in all its forms everywhere,” as laid out in the first<br />
Sustainable <strong>Development</strong> Goal (SDG), then it fits that we have to know what<br />
all those forms are. We need to have a far clearer picture of the most marginalized<br />
and most vulnerable. Not just those who are financially poor, but<br />
those facing a number of distinct disadvantages, such as gender, race and<br />
ethnicity, that taken together deprive them of the chance to lead healthy,<br />
productive lives.<br />
One of the reasons I find Migrant Mother so powerful is that it focuses<br />
on the plight of a woman and how she is scarred by deprivation, at a time<br />
when their hardship and suffering was sometimes overlooked by politicians<br />
and policymakers. It is critical to know more about the lives of today’s<br />
Florence Owens Thompsons since women and girls are widely recognized as<br />
one of the most disregarded and disenfranchised groups in many developing<br />
countries. Indeed, the World Bank argues that a “complete demographic<br />
poverty profile should also include a gender dimension,” given that most<br />
average income measurements miss the contribution and consumption of<br />
women and girls within households entirely.<br />
For a long time, for example, when data collectors in Uganda conducted<br />
labour force surveys, they only asked about a household’s primary earner. In<br />
most cases, the main breadwinner in Ugandan households was the man, so<br />
the data made it look like barely any women were participating in the workforce.<br />
When the data collectors started asking a second question — who<br />
else in the household works? — Uganda’s workforce immediately increased<br />
by 700,000 people, most of them women. Obviously, these women had existed<br />
all along. But until their presence was counted and included in official<br />
reports, these women and the daily challenges they faced were ignored by<br />
policymakers. Similarly, because many surveys tend to focus solely on the<br />
head of household — and assume that to be the man — we have less idea of<br />
the numbers of women and children living in poverty and the proportion of<br />
woman-headed households in poverty.<br />
Getting a clearer picture of poverty and deprivation is a fundamental<br />
first step towards designing and implementing more effective policies and<br />
interventions, as well as better targeting scarce resources where they will<br />
have the greatest impact. That’s why our foundation is supporting partners<br />
to better identify who and where the poorest and most vulnerable are, collect<br />
better information on what they want and need to improve their lives<br />
and develop a better understanding of the structural barriers they face. The<br />
findings will then be used to develop strategies that specifically target those<br />
identified within the first 1,000 days of SDG implementation.<br />
This report is a welcome contribution to these efforts, along with the<br />
United Nations <strong>Development</strong> Programme’s ongoing work to revamp the <strong>Human</strong><br />
<strong>Development</strong> Index (HDI), including an explicit focus on women and girls.<br />
Since its creation in 1990 the HDI has been a central pillar of multidimensional<br />
poverty and a key instrument to measure both how much we have achieved<br />
and the challenges ahead. The report is also a timely addition to the calls<br />
made by the Commission on Global Poverty, the Organisation for Economic<br />
Co-Operation and <strong>Development</strong> and others for incorporating quality of life<br />
dimensions into the way we understand and determine human deprivation.<br />
I am excited by the prospect of a broader, more sophisticated approach<br />
to determining poverty. But all the best data in the world won’t do us much<br />
good if they sit on a shelf collecting dust. They must be used to influence<br />
decisionmaking and accountability, and ultimately to transform the lives of<br />
the world’s most vulnerable people. The last 15 years have shown us that<br />
progress on poverty is possible. But we also know that it is not inevitable —<br />
nor has it been universal. My hope is that this report will catalyse the global<br />
community to ensure that, this time, no one is left behind. Let’s not squander<br />
this momentum.<br />
Melinda Gates<br />
Co-chair of the Bill & Melinda Gates Foundation<br />
Chapter 2 Universalism—from principlesto practice | 57
Gender disparities in<br />
human development,<br />
while narrowing<br />
slowly, are embedded<br />
in social norms<br />
and long-standing<br />
patterns of exclusion<br />
from household<br />
and community<br />
decisionmaking<br />
that limit women’s<br />
opportunities<br />
and choices<br />
Women and girls<br />
Women and girls are not able to live their<br />
lives to their full potential in many countries.<br />
Gender disparities in human development,<br />
while narrowing slowly, are embedded in social<br />
norms and long-standing patterns of exclusion<br />
from household and community decisionmaking<br />
that limit women’s opportunities and<br />
choices (box 2.2).<br />
Gender-based discrimination starts before<br />
school, even before birth. The preference for a<br />
son can lead to sex-selective abortions and missing<br />
women, particularly in some South Asian<br />
countries. Discrimination continues in families<br />
through intrahousehold resource allocation.<br />
The gender politics of food — nurtured by the<br />
assumptions, norms and values about women<br />
needing fewer calories — can push women into<br />
a perpetual state of malnutrition and protein<br />
deficiency. Women and girls sometimes eat last<br />
and least within the household. Early marriage<br />
among girls limits their long-term capabilities<br />
and potential. Each year, 15 million girls in<br />
developing countries marry before age 18, and<br />
if there is no reduction in the incidence of early<br />
marriage among girls, by 2050, 18 million girls<br />
will be married before age 18. 20 Worldwide, one<br />
out of eight age-eligible girls does not attend<br />
primary or secondary school. 21 Only 62 of 145<br />
countries have achieved gender parity in primary<br />
and secondary education. 22<br />
As highlighted in the 2015 <strong>Human</strong><br />
<strong>Development</strong> <strong>Report</strong>, women face numerous<br />
disadvantages in paid and unpaid work. The<br />
global labour force participation rate is 49.6<br />
percent among women and 76.2 percent<br />
among men. 23 Women employed in vulnerable<br />
work or the informal economy may lack decent<br />
work conditions, social security and voice and<br />
have lower earnings than do other workers.<br />
Women also suffer discrimination in relation to<br />
productive assets, such as the right to land and<br />
property. Women are barred from owning land<br />
because of customary laws and social norms and<br />
practices. Only 10–20 percent of landholders<br />
BOX 2.2<br />
Gender-based inequalities in South Asian households<br />
Women in South Asia are often excluded from decisionmaking,<br />
have limited access to and control over resources,<br />
are restricted in their mobility and are often under<br />
threat of violence from male relatives. These deprivations<br />
are linked strongly to patriarchal social norms and<br />
attitudes that impede equitable gender relationships<br />
within households. They have consequences for health,<br />
education and community participation.<br />
Discrimination at each stage of the female lifecycle<br />
contributes to health disparities—from sexselective<br />
abortions (particularly common in India and<br />
Pakistan) to lower nutrition intake and the neglect of<br />
health care among girls and women. A girl between<br />
her first and fifth birthdays in India or Pakistan has<br />
a 30–50 percent greater chance of dying than a boy.<br />
The maternal mortality ratio in South Asia is also<br />
stubbornly high, second only to that in Sub-Saharan<br />
Africa. This is partly because many births are not<br />
attended by skilled health personnel (44 percent in<br />
Bangladesh). Decisions about seeking care are made<br />
largely by husbands or older male and female household<br />
members, and mistrust or misinformation about<br />
modern health facilities for child delivery restricts access<br />
by women.<br />
Inequality in work and education begins in childhood.<br />
Girls in South Asia learn domestic skills in the<br />
household and begin to take on domestic duties and<br />
child care. There are strong beliefs in rural areas that<br />
sons should be educated because they will remain in the<br />
family and support ageing parents, while daughters are<br />
likely to serve other families after marriage. Cultural beliefs<br />
that the role of a woman is to be a wife and mother<br />
have direct consequences on parents’ incentives to invest<br />
in expanding their daughters’ capabilities through<br />
education and preparation for paid work. Another common<br />
perception is that education for girls beyond primary<br />
school will make it harder for a woman to find a husband.<br />
Legislation promoting gender equality is vital for<br />
women in South Asia. But households are where most<br />
decisionmaking takes place, and norms and values<br />
continue to perpetuate inequalities between men and<br />
women across generations, even when such laws are<br />
in place. If women are not encouraged to work outside<br />
the home, labour laws will not reach them. If families do<br />
not allow girls to attend school, scholarships and school<br />
gender quotas will not support them. And if violence<br />
against women is overlooked in the home, women will<br />
not feel empowered to voice their concerns.<br />
Source: Banu <strong>2016</strong>.<br />
58 | HUMAN DEVELOPMENT REPORT <strong>2016</strong>
in developing countries are women. 24 Women<br />
take on a disproportionate amount of unpaid<br />
work in the home, forgoing opportunities for<br />
other activities, including education, visits to<br />
health centres and work outside the home.<br />
There are more women than men living in<br />
poverty. In 2012 in Latin America and the<br />
Caribbean there were 117 women in poor<br />
households for every 100 men, an 8 percent<br />
increase since 1997. 25<br />
In many countries outcomes in educational<br />
attainment and health are worse for girls than<br />
for boys. Globally, 60.3 percent of adult women<br />
have at least some secondary education, compared<br />
with 69.2 percent of adult men. 26 Maternal<br />
mortality ratios and adolescent birth rates are<br />
declining but remain high in Sub-Saharan<br />
Africa, at 551 deaths per 100,000 live births and<br />
103 births per 1,000 women ages 15–19. 27<br />
One of the most brutal forms of women’s<br />
disempowerment is violence against women,<br />
including in the home, in all societies, among all<br />
socioeconomic groups and at all levels of education.<br />
According to a 2013 global review, onethird<br />
of women — and more than two-thirds in<br />
some countries — have experienced physical or<br />
sexual violence inflicted by an intimate partner<br />
or sexual violence inflicted by a nonpartner.<br />
Some 20 percent of women experienced sexual<br />
violence as children. 28 Nearly a quarter of girls<br />
ages 15–19 worldwide reported having been<br />
victims of violence after turning 15. 29<br />
Violence against women can be perpetuated<br />
through social norms. For example,<br />
female genital mutilation and cutting remain<br />
widespread. New estimates indicate that 200<br />
million women and girls living today have<br />
undergone female genital mutilation, even<br />
though the majority of men and women oppose<br />
the practice in many countries where it is<br />
performed. 30 Acid attacks against women are<br />
a heinous form of violence common in communities<br />
where patriarchal gender orders are<br />
used to justify violence against women. In the<br />
last 15 years more than 3,300 acid-throwing<br />
attacks have been recorded in Bangladesh,<br />
Colombia, Pakistan, Uganda and the United<br />
Kingdom. 31 The true number is likely much<br />
higher because many cases go unrecorded.<br />
In some societies women are also targets of<br />
honour-based violence, where the concept of<br />
honour and shame is fundamentally bound<br />
up with the expected behaviours of women,<br />
as dictated by their families or societies.<br />
Worldwide, 5,000 women a year are murdered<br />
in such honour killings. 32<br />
When women are discriminated against, society<br />
suffers. Even in a narrow economic sense,<br />
gender gaps in women’s entrepreneurship and<br />
labour force participation account for estimated<br />
economywide income losses of 27 percent in<br />
the Middle East and North Africa, 19 percent<br />
in South Asia, 14 percent in Latin America and<br />
the Caribbean and 10 percent in Europe. 33 In<br />
Sub-Saharan Africa annual economic losses<br />
because of gender gaps in effective labour (the<br />
labour force participation rate and years of<br />
schooling) are estimated at $95 billion. 34<br />
Ethnic minorities<br />
In many developing and developed countries<br />
ethnic minority status is associated with lower<br />
capabilities and opportunities. More than 250<br />
million people worldwide face discrimination<br />
solely on the basis of caste or inherited status. 35<br />
In Viet Nam there are gaps between the capabilities<br />
of ethnic or linguistic minorities and<br />
the Kinh-Hoa majority. In 2012, 50.9 percent<br />
of the ethnic minority population was living<br />
in multidimensional poverty, compared with<br />
only 16.5 percent of the Kinh-Hoa population.<br />
In 2008 the poverty rate was 51 percent<br />
among ethnic minorities and 54 percent among<br />
non-Vietnamese speakers, compared with only<br />
26 percent among the Kinh-Hoa population.<br />
Some 84.6 percent of Kinh-Hoa children ages<br />
12–23 months were fully immunized in 2014,<br />
compared with 69.4 percent of ethnic minority<br />
children. 36<br />
Evidence from Nepal shows similar patterns<br />
of disadvantages among ethnic minority groups.<br />
The 2014 Nepal National <strong>Human</strong> <strong>Development</strong><br />
<strong>Report</strong> found wide variations in HDI values<br />
across population groups, although the trends<br />
are towards less inequality. The Newar people<br />
have the highest HDI value, 0.565, followed<br />
by the Brahman-Chhetris (0.538), followed by<br />
Janajatis (0.482), Dalits (0.434) and Muslims<br />
(0.422; figure 2.4). The variations in HDI<br />
values are significant within these groups, depending<br />
on location. The highest inequalities<br />
are in education, and this may have pronounced<br />
long-term effects on capabilities later in life.<br />
In many developing<br />
and developed<br />
countries ethnic<br />
minority status is<br />
associated with<br />
lower capabilities<br />
and opportunities<br />
Chapter 2 Universalism—from principlesto practice | 59
FIGURE 2.4<br />
Variations in <strong>Human</strong> <strong>Development</strong> Index values are wide across population groups in Nepal<br />
All Brahman/Chhetri<br />
Hill Brahman<br />
Hill Chhetri<br />
Madhesi Brahman/Chhetri<br />
Madhesi other castes<br />
All Dalits<br />
Hill Dalit<br />
Madhesi Dalit<br />
Newar<br />
All Janajatis excluding Newar<br />
Hill Janajati<br />
Tarai Janajati<br />
Muslim/Musalman<br />
All Hill/Mountain groups<br />
All Tarai/Madhesi groups<br />
Others<br />
0.400<br />
0.460<br />
0.434<br />
0.446<br />
0.482<br />
0.473<br />
0.422<br />
0.454<br />
0.507<br />
0.509<br />
0.511<br />
0.538<br />
0.557<br />
0.536<br />
0.565<br />
0.586<br />
<strong>Human</strong> <strong>Development</strong> Index value, 2011<br />
Source: UNDP 2014e.<br />
Deprivations among<br />
ethnic minorities<br />
are also apparent<br />
in very high human<br />
development countries<br />
Deprivations among ethnic minorities are<br />
also apparent in countries classified as having<br />
very high human development. Measure of<br />
America produces an HDI value that is disaggregated<br />
by ethnic group for each state in the<br />
United States. The country’s average HDI value<br />
(scaled from 0 to 10) is 5.03; the HDI value for<br />
Latinos (4.05), African Americans (3.81) and<br />
Native Americans (3.55) are below this average,<br />
while the HDI values for Whites (5.43) and<br />
Asian Americans (7.21) are above it (figure<br />
2.5). Box 2.3 focuses on the issue of human<br />
FIGURE 2.5<br />
In the United States the <strong>Human</strong> <strong>Development</strong> Index value is below the country average for some ethnic<br />
groups but above it for others<br />
<strong>Human</strong> <strong>Development</strong> Index value, 2010 (0–10)<br />
7.21<br />
Subgroup national average<br />
Subgroup lowest state average<br />
5.69<br />
5.43<br />
3.97<br />
4.05<br />
3.35<br />
3.81<br />
2.62<br />
3.55<br />
Overall<br />
US average 5.03<br />
1.27<br />
Asian<br />
Americans<br />
Whites Latinos African<br />
Americans<br />
Native<br />
Americans<br />
Note: Data refer to the <strong>Human</strong> <strong>Development</strong> Index produced by Measure of America, which differs from teh <strong>Human</strong> <strong>Development</strong> Index produced by hte <strong>Human</strong><br />
Developme <strong>Report</strong> Office.<br />
Source: <strong>Human</strong> <strong>Development</strong> <strong>Report</strong> Office estimates based on Lewis and Burd-Sharps (2013).<br />
60 | HUMAN DEVELOPMENT REPORT <strong>2016</strong>
BOX 2.3<br />
<strong>Human</strong> development among African Americans in the United States<br />
African Americans’ life expectancy is shorter than that<br />
of other ethnic and racial groups in the United States.<br />
African Americans also trail Whites and Asian Americans<br />
in education and wages: Whites earn 27 percent<br />
more on average. In some metropolitan areas the disparity<br />
is particularly striking. The life expectancy of African<br />
Americans in Baltimore, Chicago, Detroit, Pittsburgh, St.<br />
Petersburg and Tampa is now close to the national average<br />
in the late 1970s. 1 The reasons are complex but<br />
linked to a long history of legal and social discrimination.<br />
Policies that improve educational achievement can<br />
expand opportunities for African Americans and other<br />
racial and ethnic minorities in work and other areas.<br />
Equalizing educational achievement could reduce disparities<br />
in employment between African Americans and<br />
Whites by 53 percent, incarceration by 79 percent and<br />
health outcomes by 88 percent. 2<br />
Differences in wages between African Americans<br />
and Whites are also related to discrimination in the<br />
job market. Discrimination accounts for an estimated<br />
one-third of wage disparities, all else (including education)<br />
being equal. 3 This indicates that policies are<br />
needed to ensure that skills and education are rewarded<br />
equally. Social pressures within the African American<br />
community can limit choices and later life chances<br />
among adolescents. Being labelled as “acting White”<br />
— whereby high-achieving African American students<br />
are shunned in some contexts by their peers for doing<br />
well academically — can discourage good performance<br />
in school. 4 Reducing the stigmatization of academic<br />
achievement among African American youth could be<br />
a step towards reducing inequalities in human development<br />
outcomes.<br />
Notes<br />
1. Lewis and Burd-Sharps 2013. 2. Curto, Fryer and Howard 2011. 3. Fryer, Pager and Spenkuch 2013. 4. Fryer 2006.<br />
Source: <strong>Human</strong> <strong>Development</strong> <strong>Report</strong> Office.<br />
development among African Americans in the<br />
United States.<br />
Deprivations in capabilities linked to ethnicity<br />
can be exacerbated by greater exposure to<br />
external pressures such as climate change. In<br />
Cambodia indigenous peoples are disadvantaged<br />
by higher poverty rates, limited access<br />
to education and health, and fewer representatives<br />
in national and subnational decisionmaking<br />
institutions. The same groups are doubly<br />
deprived because their livelihoods rely more<br />
heavily on natural resources and agriculture<br />
than those of other population groups, and the<br />
impact of climate change on their livelihoods<br />
has been high.<br />
People in vulnerable locations<br />
Where individuals are born has an immense<br />
effect on their potential capabilities and opportunities.<br />
People born in the least developed<br />
countries, fragile states and countries in conflict<br />
suffer huge disadvantages relative to people<br />
born in stable, highly developed countries.<br />
Citizenship, an ascribed group characteristic,<br />
can tie individuals to place-based conditions of<br />
violence and insecurity, under-resourced public<br />
programmes or vulnerability to environmental<br />
change and economic shocks, with devastating<br />
effects on life chances (box 2.4).<br />
The resources available to individuals to<br />
enhance their capabilities vary by country. For<br />
example, public spending on health care programmes<br />
and insurance in Organisation for<br />
Economic Co-operation and <strong>Development</strong><br />
(OECD) countries averages 7.7 percent of<br />
GDP, while public health expenditures in<br />
the least developed countries average only<br />
1.8 percent of GDP. 37 Public expenditure on<br />
education is 5.1 percent of GDP in OECD<br />
countries but 3.3 percent in the least developed<br />
countries. 38 In 2010 the share of the<br />
population living on degraded land (land with<br />
limited productive capacity) was only 3.4<br />
percent in OECD countries but 23.5 percent<br />
in the least developed countries. 39 These statistics<br />
suggest why people in different countries<br />
face different means of reaching their full<br />
potential.<br />
Individuals born into communities that are<br />
geographically isolated, predominantly home<br />
to politically and socially excluded minorities<br />
or disproportionately exposed to environmental<br />
pressures have fewer opportunities. Whole<br />
communities risk being left behind unless unbalanced<br />
service distribution is rectified.<br />
Individuals born into<br />
communities that<br />
are geographically<br />
isolated, predominantly<br />
home to politically<br />
and socially excluded<br />
minorities or<br />
disproportionately<br />
exposed to<br />
environmental<br />
pressures have<br />
fewer opportunities<br />
Chapter 2 Universalism—from principlesto practice | 61
BOX 2.4<br />
Limitations in opportunities among young people in small island developing states<br />
Small island developing states face several economic<br />
challenges stemming from the limited resource base,<br />
remoteness from markets and barriers to economies of<br />
scale. Extreme vulnerabilities to climate change place<br />
additional stress on economic activity, particularly in<br />
tourism, fisheries and agriculture. The economic vulnerabilities<br />
translate into limited choices and opportunities<br />
among citizens. The obstacles are especially<br />
high for young people looking for decent work. The<br />
youth unemployment rate ranges from 18 percent to 47<br />
percent among countries in the Caribbean, with the exception<br />
of Trinidad and Tobago, and the jobs available<br />
to working young people are often in low-skill areas<br />
with limited mobility. 1 Likewise, in the Pacific Islands,<br />
youth unemployment is estimated at 23 percent but<br />
reaches 63 percent in the Republic of the Marshall<br />
Islands, 54 percent in Kiribati and 46 percent in the<br />
Solomon Islands. 2 The lack of stable employment opportunities<br />
is detrimental to income generation and<br />
poverty reduction efforts and negatively affects security<br />
by exacerbating crime and violence. Indeed, in 2012,<br />
17–24 percent of male school-age young people in 10<br />
Caribbean countries admitted to having been involved<br />
in gangs. 3 High rates of crime and violence can contribute<br />
to a vicious cycle whereby youth imprisonment<br />
and declines in revenues from tourism reduce overall<br />
economic activity and opportunities.<br />
There are formidable challenges to expanding choices<br />
among young people and other vulnerable groups in<br />
small island developing states, but some of these challenges<br />
could be transformed into opportunities with the<br />
right mix of policies. Investments in climate-resilient infrastructure<br />
could turn climate change into a generator<br />
of employment. Investments in high-quality education<br />
and youth training programmes could increase entrepreneurship<br />
and remittances from labour migration and<br />
invigorate sectors such as telecommunication, tourism<br />
and creative industries. 4<br />
Notes<br />
1. UNDP <strong>2016</strong>b. 2. ILO 2014b. 3. UNDP <strong>2016</strong>b. 4. ILO 2014b.<br />
Source: <strong>Human</strong> <strong>Development</strong> <strong>Report</strong> Office.<br />
The ability to access<br />
health care, education,<br />
water and housing<br />
can vary greatly by<br />
region in a country,<br />
as can the quality<br />
of these services<br />
People in conflict-affected countries experience<br />
severe and immediate impacts on<br />
human development. Modelling of the losses<br />
in each dimension of the HDI by the United<br />
Nations Relief and Works Agency for Palestine<br />
Refugees in the Near East in 2013 suggested<br />
that over two conflict years the Syrian Arab<br />
Republic lost the equivalent of 35 years of progress<br />
in human development. 40<br />
Conflict limits the availability of essential<br />
human development–enhancing services such<br />
as health care and education. Children in<br />
conflict-affected countries accounted for half<br />
of all children denied an education in 2011,<br />
even though they made up only 22 percent<br />
of the world’s primary school–age children. 41<br />
The United Nations Educational, Scientific<br />
and Cultural Organization reported in 2013<br />
that 28.5 million children in conflict-affected<br />
countries were out of school. 42 Livelihoods are<br />
similarly disrupted when violence interferes<br />
with trade, infrastructure and service provision.<br />
The distribution of opportunities and social<br />
services is uneven between and within countries.<br />
The ability to access health care, education,<br />
water and housing can vary greatly by region in<br />
a country, as can the quality of these services. 43<br />
Financial support — national and official development<br />
assistance — also varies across regions,<br />
with different effects on development outcomes.<br />
Thus, a far greater proportion of people are poor<br />
in rural areas than in urban areas, and in urban<br />
areas poor people are often clustered in slums.<br />
Health care in India exemplifies the extreme<br />
geographic differences in health services. In the<br />
mid-2000s, 39 percent of children overall and<br />
59 percent in urban areas benefited from full<br />
immunization coverage, theoretically provided<br />
by the public sector. Kerala had one public hospital<br />
bed per 1,299 people, but Uttar Pradesh<br />
only one bed per 20,041. Almost all births in<br />
Kerala were attended by health personnel, compared<br />
with just 27 percent in Uttar Pradesh. 44<br />
Geography in Tunisia counts much more<br />
than wealth, gender or the education level of<br />
the household head in determining access to<br />
some opportunities. Whether a person was<br />
born in a rural or urban area explains 30 percent<br />
of the inequality in school attendance and<br />
almost 50 percent of the inequality in access to<br />
sanitation. The pattern is similar in other Arab<br />
States, including Egypt and Morocco. 45 And in<br />
62 | HUMAN DEVELOPMENT REPORT <strong>2016</strong>
Sudan in the mid-2000s the use of antenatal<br />
health care services was five times greater in<br />
urban areas than in rural areas. 46<br />
The <strong>2016</strong> Mongolia National <strong>Human</strong><br />
<strong>Development</strong> <strong>Report</strong> highlights differences in<br />
levels of inequality in human development across<br />
aimags, first-level administrative subdivisions. 47<br />
Likewise, the HDI in China varies considerably<br />
across regions: from the equivalent of a medium<br />
human development country in some provinces<br />
(for example, Gansu, at 0.689) to the equivalent<br />
of a high human development country in other<br />
provinces (for example, Fujian, at 0.758) and to<br />
the equivalent of a very high human development<br />
country in Beijing (at 0.869). 48<br />
Migrants and refugees<br />
Individuals born into disadvantage — in<br />
conflict-affected situations, countries at risk<br />
of environmental disaster or areas with few<br />
economic opportunities — have few strategies<br />
available to better their conditions. One option<br />
may be to leave their home and community in<br />
search of more physically and economically secure<br />
environments despite the risks the journey<br />
presents and the potential obstacles to be faced.<br />
The United Nations Population Fund reported<br />
in 2015 that 244 million people were living<br />
outside their home countries. 49 Many are seeking<br />
better economic opportunities and hope to<br />
enhance their livelihoods and send money back<br />
home. A 2012 survey in Somalia reported that<br />
more than 60 percent of young people intended<br />
to leave the country in search of better work<br />
opportunities. 50 In 2010/2011 one person in<br />
nine born in Africa who had obtained a tertiary<br />
diploma lived in an OECD country. 51<br />
Not all migrants move because of hardship,<br />
and not all move because of a lack of choices<br />
at home. Many migrants return with new skills<br />
and experience as opportunities for employment<br />
at home increase, particularly in emerging<br />
economies. But many migrants, especially the<br />
world’s nearly 23 million refugees, asylumseekers<br />
and stateless people, are fleeing extreme<br />
conditions. 52 And there are 50 million irregular<br />
migrants who seek better conditions at great<br />
risk, often relying on smugglers for travel. 53<br />
People migrating to flee conflict and insecurity<br />
usually experience declines in their overall human<br />
development, but migration is still a better<br />
choice than exposure to the harms they would<br />
face by staying home. Migrants who leave without<br />
the push of violence typically improve their<br />
human development potential by migrating. 54<br />
Migrants fleeing conflict are cut off from their<br />
main sources of income and may lack access to<br />
health care and social services beyond emergency<br />
humanitarian assistance (box 2.5). They frequently<br />
face harassment, animosity and violence<br />
in receiving countries. Trying to find work and<br />
earn an income is the single greatest challenge.<br />
In many countries refugees are not permitted to<br />
work; when they are, they see few opportunities.<br />
Many also lack identification papers, limiting<br />
access to formal jobs and services. People fleeing<br />
conflict are especially vulnerable to trafficking,<br />
forced labour, child labour, sex work and work<br />
in other exploitative, high-risk activities.<br />
Migrants also confront barriers to participation<br />
in political and public life. Numerous<br />
countries impose restrictions on noncitizens<br />
in voting and holding elected public office.<br />
The restrictions may be based on the duration<br />
of the stay of the migrants, reciprocal laws<br />
in the country of origin or the scope of the<br />
election — most countries grant noncitizens the<br />
right to vote at communal but not regional or<br />
national elections. Language barriers can also<br />
be a key obstacle to community engagement.<br />
Newspapers, websites, television and radio programmes<br />
covering host country political and<br />
public issues in the migrants’ native language<br />
can encourage civil participation.<br />
As migrant and refugee flows surge, the infrastructure<br />
and services of host countries are<br />
challenged to absorb the newcomers. The pressure<br />
is especially intense in Jordan, Lebanon and<br />
Turkey, which have taken in the vast majority<br />
of refugees from the conflict in the Syrian Arab<br />
Republic. 55 All basic services in Lebanon are under<br />
stress, especially the education system, which<br />
has welcomed refugee children from the Syrian<br />
Arab Republic but is now stretched thin. 56<br />
Indigenous peoples<br />
Indigenous peoples are characterized by distinct<br />
cultures and close relationships with the<br />
land they inhabit. There are more than 370 million<br />
self-identified indigenous peoples in some<br />
70 countries. Latin America alone numbers<br />
more than 400 groups, and Asia and the Pacific<br />
Individuals born into<br />
disadvantage have few<br />
strategies available to<br />
better their conditions.<br />
One option may be to<br />
leave their home and<br />
community in search<br />
of more physically<br />
and economically<br />
secure environments<br />
Chapter 2 Universalism—from principlesto practice | 63
BOX 2.5<br />
Disadvantages facing migrants<br />
Migrants face barriers in accessing services to maintain<br />
their capabilities. They may not have the legal or<br />
financial resources to access health care in their host<br />
countries and may therefore develop physical or mental<br />
problems that are aggravated by poor transit and living<br />
conditions. When they are able to access health care,<br />
they may not find health practitioners experienced in<br />
treating diseases that are uncommon in the host country,<br />
such as tropical diseases in northern latitudes or the<br />
psychological trauma associated with migration. They<br />
may also face discrimination from health practitioners or<br />
be unable to express themselves in the same language.<br />
Health care provided in refugee camps is not always of<br />
adequate quality and quantity, and people in transit may<br />
not be available for long-term treatments. The poor living<br />
conditions and the high population density in most<br />
camps can propagate communicable diseases. Women<br />
often confront threats of violence and physical insecurity.<br />
Education is another challenge among migrants.<br />
Migrant children often have difficulty adapting in the<br />
host country’s classrooms, where the teaching methods,<br />
curriculum and language are unfamiliar. An Organisation<br />
for Economic Co-operation and <strong>Development</strong> study in 23<br />
countries showed that first-generation immigrant students<br />
have much lower scores than do local students;<br />
second-generation immigrant students do slightly better.<br />
1 The variations across host countries are important,<br />
which may indicate that policies to integrate migrant<br />
students affect these students’ outcomes. Migrant children<br />
may be experiencing school for the first time in the<br />
host country at an age when their peers have already<br />
been in school. Besides the stress of adapting to a new<br />
country, migrant children must catch up to become integrated<br />
in their new schools. Some migrant children<br />
do not have access to education in their host country,<br />
especially if they are undocumented.<br />
Note<br />
1. Keeley 2009.<br />
Source: <strong>Human</strong> <strong>Development</strong> <strong>Report</strong> Office.<br />
Because indigenous<br />
self-determination is<br />
explicitly limited by<br />
the right of states to<br />
territorial integrity,<br />
the representation<br />
of indigenous groups<br />
in parliament is a<br />
powerful symbol of<br />
self-determination<br />
and of inclusion<br />
more widely<br />
an estimated 705. 57 Indigenous peoples account<br />
for around 5 percent of the world’s population<br />
but 15 percent of people living in poverty. 58<br />
Indigenous peoples face deprivations caused<br />
by social, economic and political exclusion. In<br />
Africa indigenous peoples are more vulnerable<br />
to HIV and AIDS because of a range of factors,<br />
including stigmatization, structural racism and<br />
discrimination, and individual and community<br />
disempowerment. 59 In the United States Native<br />
Americans die at rates higher than the national<br />
average, especially as a result of liver disease,<br />
diabetes, accidents, homicide, suicide and<br />
chronic lower respiratory diseases. 60<br />
Indigenous children are challenged in education<br />
systems by daily schedules that do not<br />
accommodate nomadic movement, and curricula<br />
rarely incorporate their history, culture<br />
and language. 61 In many countries this leads to<br />
substantial gaps in years of schooling between<br />
indigenous children and nonindigenous children<br />
(table 2.1). In Guatemala nonindigenous<br />
children average twice as many years of schooling<br />
as indigenous children. Income-generating<br />
opportunities are more difficult to access when<br />
indigenous young people have low educational<br />
attainment.<br />
Calls for self-determination through self-government<br />
have been at the forefront of the<br />
relationship between states and indigenous<br />
communities since the mid-20th century.<br />
Because indigenous self-determination is explicitly<br />
limited by the right of states to territorial integrity,<br />
the representation of indigenous groups<br />
in parliament is a powerful symbol of self-determination<br />
and of inclusion more widely.<br />
In some cases, indigenous peoples have established<br />
their own parliaments or councils that<br />
act as consultative bodies — for example, the<br />
Sami people of Finland, Norway and Sweden.<br />
In other cases, such as the Maori in New<br />
Zealand, parliamentary seats are allocated for<br />
indigenous representatives. 62<br />
Lesbian, gay, bisexual, transgender<br />
and intersex individuals<br />
In many countries people who are lesbian, gay,<br />
bisexual, transgender and intersex suffer extreme<br />
discrimination and insecurity that deprive<br />
them of dignity, basic rights and opportunities.<br />
Statistics on sexual orientation are scarce, especially<br />
in countries where same-sex sexual acts are<br />
illegal or socially invisible. But recent surveys in<br />
64 | HUMAN DEVELOPMENT REPORT <strong>2016</strong>
TABLE 2.1<br />
Years of schooling, indigenous and nonindigenous children, selected countries<br />
Country Nonindigenous Indigenous Difference<br />
Bolivia 9.6 5.9 3.7<br />
Ecuador 6.9 4.3 2.6<br />
Guatemala 5.7 2.5 3.2<br />
Mexico 7.9 4.6 3.3<br />
Peru 8.7 6.4 2.3<br />
Source: UNDESA 2009.<br />
developed countries give some indication of the<br />
size of the population. In Australia 3 percent of<br />
the adult population self-identified as gay, lesbian<br />
or “other” in 2014. 63 In the United Kingdom<br />
545,000 adults identified as gay or lesbian, and<br />
220,000 identified as bisexual in 2012. 64 In the<br />
United States 3.4 percent of adults identified as<br />
lesbian, gay, bisexual or transgender. 65 In these<br />
surveys younger respondents were more likely<br />
than older respondents to self-report as lesbian,<br />
gay, bisexual, transgender or intersex, suggesting<br />
that social norms influence the likelihood of<br />
higher response rates.<br />
Same-sex sexual acts are illegal among men<br />
in 73 countries and among women in 45. In<br />
13 countries people who engage in such acts<br />
can face the death penalty. 66 Even in countries<br />
where lesbian, gay, bisexual, transgender and<br />
intersex people are not considered criminals,<br />
their prospects for human development are limited<br />
by discrimination in social and economic<br />
life. Unlike other minorities the lesbian, gay,<br />
bisexual, transgender and intersex community<br />
is often hidden. Sexual minorities may not disclose<br />
their identity for fear of legal punishment,<br />
social abuse, hostility and discrimination by<br />
society or by close friends and family members.<br />
Because differences in sexual orientation are<br />
not openly recognized in many societies, data<br />
on discrimination are not widely available, and<br />
evidence-based policymaking is difficult.<br />
For 25 countries with data, attitudes towards<br />
the lesbian, gay, bisexual, transgender and intersex<br />
community have become more tolerant<br />
since the 1990s (figure 2.6). Social acceptance<br />
has increased as the adoption of antidiscrimination<br />
legislation has moved forward. Social<br />
norms and legislation have positively reinforced<br />
one another. Where intolerance remains high,<br />
legislation is critical to pushing back against<br />
hostile and discriminatory behaviour that limits<br />
the choices of a large global population.<br />
Older people<br />
Given that many countries have an ageing population,<br />
what are the deprivations facing older<br />
people? By 2020 the number of people ages<br />
60 and older will be greater than the number<br />
of children under age 5. The proportion of<br />
the world’s population over age 60 will double<br />
between 2015 and 2050, to 22 percent. 67<br />
Few countries are prepared to cope with this<br />
demographic transition. Without adequate<br />
health systems, social protection, and work<br />
and retirement schemes in place, older people<br />
are deprived of opportunities to maintain and<br />
expand their capabilities. They also suffer from<br />
prejudicial attitudes and discriminatory policies<br />
and practices, often referred to as ageism. 68<br />
These issues may be particularly pertinent for<br />
women, because the life expectancy of women<br />
usually exceeds that of men. Pensions may be<br />
unavailable to women who have performed<br />
unpaid care work for much of their lives or who<br />
have worked in the informal sector. Older men<br />
are more likely to have pensions as a benefit of<br />
their paid formal work. Poverty rates are higher<br />
among older women than among older men. 69 In<br />
the European Union older women are 37 percent<br />
more likely than older men to live in poverty. 70<br />
Women are often expected to continue well<br />
into old age unpaid care work for spouses and<br />
grandchildren. This can be a source of fulfilment<br />
but also takes a physical toll and may come<br />
with little recognition. Many older people,<br />
Even in countries<br />
where lesbian, gay,<br />
bisexual, transgender<br />
and intersex people<br />
are not considered<br />
criminals, their<br />
prospects for<br />
human development<br />
are limited by<br />
discrimination in social<br />
and economic life<br />
Chapter 2 Universalism—from principlesto practice | 65
FIGURE 2.6<br />
Since the 1990s attitudes towards the lesbian, gay, bisexual, transgender and intersex community have<br />
become more tolerant, and the number of antidiscrimination laws has increased<br />
% of the population that does not want homosexuals as neighbours<br />
70<br />
No antidiscrimination laws<br />
Antidiscrimination laws approved<br />
60<br />
Country group I<br />
No antidiscrimination laws<br />
50<br />
40<br />
30<br />
Country group II<br />
Antidiscrimination laws<br />
approved in the 2010s<br />
Country group III<br />
Antidiscrimination laws<br />
approved in the 2000s<br />
20<br />
10<br />
1990s 2000s 2010s<br />
Country group IV<br />
Antidiscrimination laws<br />
approved in the 1990s<br />
Source: <strong>Human</strong> <strong>Development</strong> <strong>Report</strong> Office estimates based on ILGA (<strong>2016</strong>a) and WVSA (<strong>2016</strong>).<br />
Deprivations suffered<br />
in old age are generally<br />
accumulated through<br />
the lifecycle<br />
particularly women, are also constrained by<br />
psychological and physical abuse that reduces<br />
their sense of security and dignity. A HelpAge<br />
International study found that two-thirds of older<br />
people who experience emotional, economic<br />
and physical abuse in Moldova are women. 71<br />
The general increase in life expectancy means<br />
that older people have many healthy, productive<br />
years ahead of them. In 2014, 11 percent of<br />
entrepreneurs in the United States were in the<br />
55–64 age group. 72 Many older people are still<br />
capable and willing to work, and many need<br />
to continue working if adequate retirement<br />
schemes are not in place. But hiring practices<br />
that discriminate against older people limit<br />
their opportunities for work, and a mandatory<br />
retirement age may force older people to leave<br />
the labour market.<br />
Deprivations suffered in old age are generally<br />
accumulated through the lifecycle. Children<br />
in poorer households may suffer from malnutrition,<br />
have poorer health, have less schooling<br />
and end up in a low-skilled, low-paid job<br />
without health insurance or retirement benefits.<br />
In the United Kingdom people in wealthier<br />
neighbourhoods live six years longer than<br />
people in poor neighbourhoods and spend 13<br />
more years without disability. 73<br />
Persons with disabilities<br />
Physical and social barriers may deprive persons<br />
with disabilities of the chance to achieve<br />
their full life potential. Special facilities allow<br />
persons with disabilities, older people and<br />
other groups with limited mobility to fully<br />
participate in public life. Although around 1<br />
billion people worldwide live with some form<br />
of disability, adequate infrastructure for persons<br />
with disabilities is still underdeveloped, making<br />
independent mobility a challenge for many. 74<br />
Remote rural areas present severe mobility challenges.<br />
Additional impediments may remain<br />
even when infrastructure is in place — such as<br />
discriminatory hiring practices that limit access<br />
to jobs for persons with disabilities .<br />
66 | HUMAN DEVELOPMENT REPORT <strong>2016</strong>
People with mental health conditions are<br />
particularly vulnerable to social exclusion. In<br />
27 European countries the gap in unemployment<br />
rates between individuals with mental<br />
health conditions and those without widened<br />
between 2006 and 2010 (before and after<br />
the financial crisis), and social stigmatization<br />
was an important factor contributing to job<br />
insecurity. 75 In Germany the unwillingness<br />
to recommend an individual with depression<br />
for a job increased between 1990–2000 and<br />
2000–2010. 76 An estimated 350 million<br />
people worldwide are affected by depression,<br />
about 60 million are affected by bipolar affective<br />
disorders, 21 million by schizophrenia and<br />
other psychoses and 47.5 million by dementia.<br />
77 The fact that half a billion people suffer<br />
from these conditions means that the exclusion<br />
of people with mental health conditions from<br />
work and social activities is a major barrier to<br />
universalism. 78<br />
Deprivations in human<br />
development as a<br />
dynamic process<br />
The universal achievement of some basic capabilities<br />
will not enable all people to realize their<br />
full life potential. Many dimensions of human<br />
development may still be lacking, including<br />
agency, security and sustainability. And the<br />
capabilities that matter most vary in different<br />
contexts and at different stages of the life cycle.<br />
Security may be at the top of the list for a<br />
household in a conflict-affected country, while<br />
interesting work opportunities may be the top<br />
priority of an educated young person. Nor<br />
does rising above the low human development<br />
threshold ensure that people are protected<br />
from emerging and future threats to human<br />
development. Indeed, 900 million people live<br />
close to the threshold of multidimensional<br />
poverty and risk falling into poverty after even<br />
a minor setback in health, education or livelihood.<br />
79 The condition of being deprived is<br />
therefore dynamic.<br />
Deprivations can materialize when development<br />
leads to new needs and new mechanisms<br />
of exclusion. Political transitions, demographic<br />
shifts and outbreaks of violence put pressure on<br />
achieved gains. Climate change, financial crises<br />
and epidemics push people into multidimensional<br />
poverty. People in developed countries<br />
can lack opportunities for work, education and<br />
access to information, despite extensive information<br />
and communication technology infrastructure<br />
because broadband Internet systems<br />
do not reach some rural areas or carry prohibitive<br />
costs. This section elaborates on important<br />
but perhaps underemphasized issues of human<br />
development — quality, information access,<br />
security, and lifecycle and intergenerational<br />
deprivations — that are increasingly central to<br />
people’s life potential.<br />
From quantity to quality in<br />
human development<br />
Over the last quarter-century, assessments of<br />
human development have focused primarily<br />
on quantitative achievements. But with<br />
substantial progress in human development<br />
linked to measures of quantity, such as years of<br />
schooling or life expectancy, there are questions<br />
about whether quality has also improved. Has<br />
quality in education, health and standards of<br />
living been enhanced? Quality is an important<br />
yardstick against which the progress in human<br />
development across countries and individuals<br />
should be examined. Large variations in the<br />
quality of human development across groups<br />
can become the basis for inequality and the<br />
perpetuation of deprivations throughout an<br />
individual’s lifecycle and across generations.<br />
Within the human development approach, the<br />
concept of quality can be explored in opportunities<br />
for public participation, the enforcement<br />
of rights and the quality of work. As a starting<br />
point, the analysis is directed at the quality of<br />
education, health and living standards — the dimensions<br />
of human development that compose<br />
the HDI.<br />
Many countries have made gains in access<br />
to education, but improvements in the quality<br />
of education have not kept pace. One-third of<br />
primary school–age children are not learning<br />
basic mathematics and reading even though<br />
half of them have spent at least four years in<br />
school. 80 Girls’ enrolment in primary education<br />
has increased, but the results in terms of literacy<br />
are not encouraging. In half of 53 developing<br />
countries with data, the majority of adult<br />
women who completed four to six years of<br />
Deprivations can<br />
materialize when<br />
development leads<br />
to new needs and<br />
new mechanisms<br />
of exclusion<br />
Chapter 2 Universalism—from principlesto practice | 67
People are living<br />
longer but also<br />
spending more years<br />
suffering because of<br />
illness and disability<br />
primary school are illiterate. 81 These outcomes<br />
are linked partly to the quality of teaching. The<br />
number of primary school teachers trained<br />
according to national standards is below 75<br />
percent in around a third of the countries for<br />
which data are available. 82 High pupil–teacher<br />
ratios are also a challenge to quality of education.<br />
Ratios in primary education were above<br />
40 to 1 in 26 countries (23 in Sub-Saharan<br />
Africa) in 2011. 83 Such lack of support diminishes<br />
the prospects of learning and raises the<br />
likelihood of dropping out of school.<br />
Health is improving worldwide. People are<br />
living longer. Life expectancy at birth globally<br />
was four years longer in 2015 than in 2000. 84<br />
This is due in part to declines in death and<br />
illness caused by HIV and AIDS and malaria in<br />
the past decade as well as to advances in treating<br />
communicable, maternal, neonatal and nutritional<br />
disorders. Improvements in sanitation<br />
and indoor air quality, greater access to immunization<br />
and better nutrition have also enabled<br />
children in poor countries to live longer. 85 But<br />
are the added years of life expectancy healthy<br />
years or years with illnesses and disability?<br />
The World Health Organization has examined<br />
healthy life expectancy by measuring the<br />
years lived in good health without disability.<br />
Analysis for 188 countries in 1990, 2005 and<br />
2013 indicates that there have been increases<br />
in healthy life expectancy but that they have<br />
not been as dramatic as the increase in overall<br />
life expectancy. 86 The difference between life<br />
expectancy and healthy life expectancy can<br />
be interpreted as years that are burdened with<br />
illness and disability. In 2015 the difference was<br />
more than 10 years in nine countries (table 2.2).<br />
People are living longer but also spending more<br />
years suffering because of illness and disability.<br />
It is assumed that people’s living standards improve<br />
when incomes rise. However, the quality<br />
of people’s lives can vary greatly even as per capita<br />
income rises. Per capita income measures can<br />
rise when goods and services that are consumed<br />
in response to social malaise and problems —<br />
such as police protection, prison systems, legal<br />
services and mental health services — increase.<br />
Per capita income likewise excludes some goods<br />
and services that may raise the quality of people’s<br />
lives, such as unpaid care work and ecological<br />
services. Qualitative improvements in people’s<br />
standard of living thus need to be assessed beyond<br />
quantitative growth in per capita income.<br />
Inequality in access to advanced, highquality<br />
education, health care and other services<br />
restricts the ability of some people to expand<br />
their capabilities. It also affects the distribution<br />
of income in the long run. Inequality in the<br />
quality and quantity of education is directly<br />
related to unequal income. Segregated education<br />
systems can reinforce class distinctions<br />
and the intergenerational perpetuation of<br />
inequalities. 87 Governments can take steps to<br />
reduce differences in service quality between<br />
TABLE 2.2<br />
The difference between life expectancy and healthy life expectancy in selected countries<br />
Country<br />
Relative difference between life expectancy<br />
and healthy life expectancy (percent)<br />
Absolute difference between life expectancy<br />
and healthy life expectancy (years)<br />
Nicaragua 14.8 11.1<br />
Qatar 13.4 10.5<br />
Saudi Arabia 13.4 10.0<br />
Australia 13.2 10.9<br />
United States 12.9 10.2<br />
Sweden 12.6 10.4<br />
Spain 12.6 10.4<br />
Chile 12.5 10.1<br />
Finland 12.5 10.1<br />
Source: <strong>Human</strong> <strong>Development</strong> <strong>Report</strong> Office estimates based on WHO (<strong>2016</strong>e).<br />
68 | HUMAN DEVELOPMENT REPORT <strong>2016</strong>
private and public providers and standardize<br />
costs, including by taxing private suppliers to<br />
support public services (box 2.6). The key is to<br />
build the support across all population groups<br />
for good-quality, universal services so that all<br />
classes, genders and ethnicities have an interest<br />
in fair and adequate provision to all.<br />
Expanding digital access<br />
Broadband coverage and variations in access<br />
to computers and smartphones could generate<br />
new forms of exclusion. Inexpensive and reliable<br />
access to the Internet is becoming essential<br />
to the development of capabilities in other<br />
areas, such as education, work and political participation.<br />
Access to information is crucial for<br />
high-quality education and thus for expanding<br />
opportunities among children and youth. The<br />
biggest challenge is to make these benefits<br />
available to all people everywhere. However,<br />
the digital divide continues to impede universal<br />
benefits and could push people who are already<br />
deprived in other areas further behind.<br />
Less than half the world’s population (47 percent)<br />
uses the Internet. Only 25 percent of people<br />
in Sub-Saharan Africa are users, and only<br />
42 percent of people in Asia and the Pacific and<br />
the Arab States are. In contrast, two-thirds of<br />
the population is online in the Americas and<br />
in the Commonwealth of Independent States.<br />
The rate in Europe is 79 percent. 88<br />
Prices in many regions make connecting to<br />
the Internet prohibitively expensive. Basic mobile<br />
or fixed broadband plans cost much more<br />
in developing countries than in developed<br />
countries and cost the most in the least developed<br />
countries (figure 2.7). But digital divides<br />
exist even in developed countries.<br />
To enable all people to benefit from the<br />
opportunities that information and communication<br />
technology holds for human development,<br />
striving for universal access to free<br />
Wi-Fi may be needed. Combined with access<br />
The digital divide<br />
continues to impede<br />
universal benefits and<br />
could push people<br />
who are already<br />
deprived in other<br />
areas further behind<br />
BOX 2.6<br />
The challenge of a two-tier public and private system for universal access to quality services<br />
Despite advances towards universal public education,<br />
health care and social protection in many countries,<br />
people are still being left behind in accessing highquality<br />
services. Quality differs greatly between public<br />
and private services in some cases. Access to highquality<br />
services is too often a privilege reserved for<br />
well-off populations. Highly unequal societies face the<br />
risk of segmentation between a universal public system<br />
and a smaller private system for elites.<br />
Take Argentina. Despite expanded investment in<br />
public schools between 2003 and 2011, enrolment in private<br />
schools increased from 22 percent to 39 percent. 1<br />
In Latin America and the Caribbean on average 50 percent<br />
of children of households in the highest income<br />
quintile attended private primary and secondary schools<br />
in 2010, compared with less than 4 percent of children<br />
of households in the lowest income quintile. 2 In Turkey<br />
expansion among private health care providers has resulted<br />
in more social stratification in the consumption<br />
of health services because higher income patients are<br />
abandoning public services for private services that are<br />
often better in quality. 3<br />
The use of private services by middle and upper<br />
segments of the welfare distribution across countries<br />
increases the likelihood of poor-quality public services<br />
because large segments of the population do not have a<br />
vested interest in public service quality, social pressure is<br />
insufficient to maintain good-quality, universally accessible<br />
public services and public services are becoming less<br />
cost-efficient because of user flight. The sustainability<br />
of funding for public programmes is at risk if the middle<br />
class does not have a vested interest in the programmes.<br />
A two-tier public and private service system is not<br />
inherently negative. It is problematic only if there are<br />
extreme variations in quality between the two options<br />
that reinforce inequalities in opportunity among those<br />
who can pay and those who cannot. There are wide disparities<br />
in quality between public and private education<br />
services in many developing countries. A recent review<br />
of 21 studies in Ghana, India, Kenya, Nepal, Nigeria and<br />
Pakistan found that students in private schools tend to<br />
achieve better learning outcomes than do students in<br />
state schools. Teaching is also often better in private<br />
schools than in state schools — for example, in India,<br />
Kenya, Nigeria, Pakistan, South Africa and Tanzania. 4<br />
Notes<br />
1. Martinez-Franzoni and Sánchez-Ancochea <strong>2016</strong>. 2. Daude 2012. 3. Agartan 2012. 4. Day Ashley and others 2014.<br />
Source: <strong>Human</strong> <strong>Development</strong> <strong>Report</strong> Office.<br />
Chapter 2 Universalism—from principlesto practice | 69
Epidemics, violence,<br />
climate change and<br />
natural disasters can<br />
quickly undermine<br />
progress in human<br />
development<br />
FIGURE 2.7<br />
Basic mobile or fixed broadband plans cost much<br />
more in developing countries than in developed<br />
countries and cost the most in the least developed<br />
countries<br />
Monthly cost, 2015 (PPP $)<br />
140<br />
120<br />
100<br />
80<br />
60<br />
40<br />
20<br />
0<br />
World<br />
Source: ITU <strong>2016</strong>b.<br />
to high-quality education, universal Internet<br />
access could greatly increase opportunities and<br />
reduce inequalities everywhere.<br />
Security threats<br />
Fixed broadband plan<br />
Mobile broadband plan<br />
Developed<br />
countries<br />
Developing<br />
countries<br />
Least<br />
developed<br />
countries<br />
There may be threats to the security of the more<br />
abundant choices and opportunities available<br />
to people today. Epidemics, violence, climate<br />
change and natural disasters can quickly undermine<br />
the progress of individuals who have exited<br />
poverty and push poor people into more extreme<br />
poverty. They can also generate new deprivations.<br />
Millions of people around the world are exposed<br />
to climate-related natural disasters, droughts and<br />
associated food insecurities and subsist on degraded<br />
land. Between 1995 and 2014 more than<br />
15,000 extreme weather events resulted in more<br />
than 525,000 deaths worldwide and economic<br />
losses of more than $2.97 trillion. 89<br />
Some groups are more exposed to threats than<br />
others. Many women depend on agriculture for<br />
their livelihoods and are therefore disproportionately<br />
exposed to climate pressures on food<br />
production. Children are physiologically and<br />
metabolically less able than adults to adapt to<br />
heat and other climate-related exposure and are<br />
more likely to be injured or killed during natural<br />
disasters. 90 They may also be kept out of school<br />
following disasters. During the Ebola outbreak<br />
in 2014 an estimated 5 million children were deprived<br />
of education in Guinea, Liberia and Sierra<br />
Leone because schools were closed for months. 91<br />
Women were also disproportionately affected by<br />
the Ebola outbreak: they faced higher risks of<br />
infection because of their role caring for the sick,<br />
and they suffered from less antenatal, perinatal<br />
and postnatal care. In Sierra Leone’s Kenema<br />
District avoidance of hospitals and birthing<br />
centres for fear of exposure to Ebola resulted<br />
in 29 percent fewer antenatal care visits and 21<br />
percent fewer postnatal care visits. 92<br />
Voicing concerns about these emerging<br />
threats can carry risk. Defenders of land and<br />
the environment around the world suffer from<br />
threats and physical violence, criminalization<br />
and restrictions on their freedoms. As environmental<br />
pressures have increased, so have physical<br />
threats against environmental activists. A<br />
record number of environmentalists were killed<br />
in 2015 — 185 in 16 countries, up 59 percent<br />
from 2014. Members of indigenous groups,<br />
who accounted for 40 percent of the deaths in<br />
2015, are among the most at risk. 93<br />
The physical insecurity of those who speak<br />
out about environmental pressures is part of<br />
a larger condition of physical insecurity and<br />
violence that severely restrict the choices and<br />
freedoms of individuals around the world.<br />
Many people feel insecure in their homes and<br />
communities. One billion girls and boys ages<br />
2–17 worldwide experienced physical, sexual or<br />
psychological violence in the prior year, according<br />
to one study. 94 Some 25 percent of children<br />
suffer physical abuse, and nearly 20 percent of<br />
girls are sexually abused at least once in their<br />
life. 95 Elder abuse remains a hidden problem: 96<br />
10 percent of older adults were abused in the<br />
prior month. 97 Homicide is also a major social<br />
concern. In 2012, 437,000 people worldwide<br />
were the victims of intentional homicide. 98<br />
Average homicide rates in Latin America and<br />
the Caribbean between 2010 and 2014 exceeded<br />
20 per 100,000 people. 99<br />
Freedom from violence was one of the most<br />
frequently cited concerns among respondents<br />
70 | HUMAN DEVELOPMENT REPORT <strong>2016</strong>
to a survey on human security carried out<br />
by the <strong>Human</strong> <strong>Development</strong> <strong>Report</strong> Office.<br />
Physical security and freedom from the threat<br />
of violence were particular concerns among<br />
female respondents (box 2.7). For women, real<br />
or perceived physical and emotional violence<br />
is a major barrier to meeting their full human<br />
potential and feeling free to move about.<br />
Deprivations throughout the<br />
lifecycle and across generations<br />
Lifelong deprivations among children and<br />
adults can begin even before birth (figure 2.8).<br />
Starting at conception, the environment to<br />
which pregnant women are exposed and the<br />
choices available to them shape the future skills<br />
and abilities of their children in ways that are<br />
difficult to alter as the children grow. A lack of<br />
medical attention, poor nutrition and heavy<br />
physical demands put unborn children at risk.<br />
Poor children are more likely than their more<br />
affluent peers to experience myriad environmental<br />
risks before birth, including household<br />
disruption, pollution and violence. These antenatal<br />
exposures to stress have been found to<br />
mould life trajectories in health and cognitive<br />
and socioemotional development — precisely<br />
the areas of development that might otherwise<br />
allow individuals to be productive members<br />
of society (box 2.8). For instance, children in<br />
Canada who had been exposed in the womb<br />
to a strong winter storm in 1998 later exhibited<br />
lower levels of cognitive development,<br />
language functioning and motor functioning<br />
than did children who had not been exposed.<br />
Antenatal exposure to a 2005 earthquake in<br />
Chile has been negatively associated with children’s<br />
future cognitive ability. Such exposure<br />
to stress can play a role in the intergenerational<br />
transmission of disadvantage by constraining<br />
development potential early in life. 100<br />
Lifelong deprivations<br />
among children and<br />
adults can begin<br />
even before birth<br />
BOX 2.7<br />
<strong>Human</strong> security from a woman’s point of view<br />
A survey conducted by the <strong>Human</strong> <strong>Development</strong> <strong>Report</strong><br />
Office asked women of all ages and occupational backgrounds<br />
around the world, “What does human security<br />
mean to you?” Many women responded that they were<br />
concerned with physical and psychological violence.<br />
“<strong>Human</strong> security is the right to move freely in your town<br />
without worrying about whether you will return home<br />
unharmed and unthreatened.”<br />
—A female teacher from Brazil<br />
“It is impossible to feel safe as a human being if our<br />
own existence is not recognized or respected, even if<br />
we have access to all sorts of opportunities.”<br />
—A female economist from Mauritania<br />
“<strong>Human</strong> security means being able to go about alone<br />
outside any time of the day or night and not fear any<br />
possible violence. It means that I should not consider my<br />
gender, religion or any other distinctive features when<br />
making a decision to spend time outdoors for fear of<br />
malicious intent.”<br />
—A female development worker from Kazakhstan<br />
“<strong>Human</strong> security for me is freedom from fear, fear of<br />
being looked down at because of being a woman and<br />
being assaulted and disrespected because of the same”<br />
—A female student from India<br />
“<strong>Human</strong> security is being able to sleep peacefully, not<br />
being afraid of getting home late at night because of<br />
violators, not driving with closed windows for fear that<br />
someone will grab my bag, going to the supermarket<br />
without being afraid of having my belongings stolen<br />
from the car, going to the Yaoundé market without<br />
hiding my money in my bra, and walking freely along<br />
Kennedy Avenue.” —A woman from Cameroon<br />
“<strong>Human</strong> security is the freedom to live your life free<br />
from hate crimes, sexism, racism and other kinds of oppression,<br />
freedom to express yourself and be active in<br />
society.”<br />
—A female activist from Sweden<br />
“<strong>Human</strong> security means freedom from abuse and violence,<br />
particularly child abuse, domestic violence, interpersonal<br />
violence and intimate partner violence. It is<br />
about the protection of children, youth, elderly, persons<br />
with disabilities and women from violence and crime.”<br />
—A female researcher from Trinidad and Tobago<br />
Source: <strong>Human</strong> <strong>Development</strong> <strong>Report</strong> Office.<br />
Chapter 2 Universalism—from principlesto practice | 71
FIGURE 2.8<br />
Deprivations among women can accumulate throughout life<br />
Female infanticide<br />
and neglect<br />
Low primary and<br />
secondary school enrollment<br />
Insufficient access to health care<br />
High maternal mortality risk<br />
High burden of care work<br />
Low labour force particiaption<br />
Insufficient pensions and<br />
protection in old age<br />
Source: <strong>Human</strong> <strong>Development</strong> <strong>Report</strong> Office.<br />
Educational attainment<br />
is a central mechanism<br />
for perpetuating<br />
socioeconomic<br />
stratification across<br />
generations<br />
BOX 2.8<br />
Antenatal stress and intergenerational deprivation<br />
Educational attainment is a central mechanism for perpetuating<br />
socioeconomic stratification across generations.<br />
Advantaged parents can afford more and better<br />
education for their children, which has many benefits in<br />
the labour market. There is also a direct transmission of<br />
economic advantage through inheritance and the use of<br />
job referral networks to favour children. These mechanisms<br />
affect later stages of the lifecycle, when children<br />
have reached school age or working age. But a growing<br />
body of research suggests that the intergenerational<br />
perpetuation of deprivation begins before birth and that<br />
the intergenerational transmission of advantage may<br />
already be advanced when children enter the education<br />
system.<br />
Exposure to environmental stressors in the womb<br />
has been connected to poor birth outcomes such as<br />
lower birthweight and higher probability of preterm<br />
birth. It has also been connected to children’s developmental<br />
outcomes such as motor skills, cognitive ability,<br />
emotional stability, attention deficit disorder and early<br />
educational achievement. Given that birth outcomes<br />
and early childhood development predict educational<br />
and economic attainment in adulthood, the higher<br />
probability that poor people will be exposed to risks<br />
in the womb may constitute the first injustice and may<br />
play a central role in the persistence of disadvantage<br />
across generations.<br />
Why does antenatal exposure have such persistent<br />
effects over the lifecycle? The antenatal period includes<br />
critical and sensitive developmental stages in which<br />
the effect of the environment on future capabilities is<br />
especially strong and potentially irreversible, regardless<br />
of subsequent interventions. During the antenatal period<br />
the central nervous system and the brain undergo<br />
a cascade of critical developmental processes that are<br />
particularly susceptible to the environment and that<br />
shape later abilities in a cumulative fashion. An antenatal<br />
shock can result in reduced language ability in the<br />
first years of life, which may affect the ability to read<br />
and to succeed in school overall.<br />
Abundant research in the biological and behavioural<br />
sciences highlights the importance of investing<br />
in the well-being of populations in the early stages of<br />
life, starting at conception. An economic perspective<br />
suggests that investments in capabilities early in life<br />
are much more cost-effective than investments later on.<br />
Source: Torche <strong>2016</strong>.<br />
72 | HUMAN DEVELOPMENT REPORT <strong>2016</strong>
Parents’ educational attainment and earnings<br />
are strong predictors of children’s educational<br />
attainment. 101 A study in South Africa found<br />
that fathers with high educational attainment<br />
pass on three-fifths of their earnings advantage<br />
to sons. 102 Daughters who inherit the low educational<br />
attainment of their parents are more<br />
disadvantaged as adults: They are 9 percent<br />
more likely to be in the bottom of the occupation<br />
distribution relative to the overall population.<br />
103 In the United Kingdom people whose<br />
father had low educational attainment are 7.5<br />
times more likely to have little education than<br />
are people with a highly educated father; in<br />
turn, people with low educational attainment<br />
are 11 times more likely to be deprived of material<br />
assets than are people with higher educational<br />
attainment. 104<br />
As the 2015 <strong>Human</strong> <strong>Development</strong> <strong>Report</strong><br />
stressed, increasing women’s access to education<br />
and paid work may have effects on the<br />
choices of subsequent generations of girls. Girls<br />
are more likely to be employed and to earn<br />
more as adults if their mother was employed.<br />
In the United States the daughters of mothers<br />
who are employed earn 23 percent more than<br />
the daughters of mothers who do not work<br />
outside the home. 105 In Senegal the parents’<br />
education is positively associated with the<br />
offspring’s adult living standards, and maternal<br />
education has a much larger positive effect than<br />
does paternal education. 106 Interventions to<br />
overcome deprivations today need to be viewed<br />
as opportunities to prevent deprivations among<br />
future generations.<br />
Interventions for women early in life can<br />
prevent deprivations later in the lifecycle (figure<br />
2.9). When investments in life capabilities<br />
occur sooner rather than later, as through early<br />
childhood education and care, the prospects<br />
improve for education and work. 107 This is<br />
because capabilities at any stage in life are<br />
path dependent and reflect the challenges and<br />
opportunities encountered at earlier stages.<br />
Children who do not have access to early childhood<br />
education may not do as well in primary<br />
and secondary school. Young people who have<br />
an education but live in an area with a sluggish<br />
labour market may resort to informal work<br />
or remain unemployed, which can lead to an<br />
insufficient pension in old age. Older people<br />
may suffer illnesses and disabilities accumulated<br />
over years of strenuous physical labour and<br />
insufficient preventive health care. The barriers<br />
facing marginalized groups may emerge at various<br />
points throughout the lifecycle and lead to<br />
Interventions<br />
to overcome<br />
deprivations today<br />
need to be viewed<br />
as opportunities to<br />
prevent deprivations<br />
among future<br />
generations<br />
FIGURE 2.9<br />
Interventions for women early in life can prevent deprivations later in the lifecycle<br />
Lower likelihood of child marriage<br />
and adolescent pregnancies<br />
Equitable access to primary and<br />
secondary education for girls<br />
More women in parliament and<br />
upper managment positions<br />
Higher likelihood of labour force<br />
participation and paid work<br />
More sufficient pensions and social<br />
protection for women in old age<br />
Source: <strong>Human</strong> <strong>Development</strong> <strong>Report</strong> Office.<br />
Chapter 2 Universalism—from principlesto practice | 73
Fulfilling basic needs<br />
is an essential part of<br />
expanding capabilities<br />
but is insufficient to<br />
enable people to reach<br />
their full potential<br />
severe deprivations in old age. Early interventions<br />
can prevent subsequent limitations, along<br />
with interventions that help individuals recover<br />
from past deprivation.<br />
What do people value in human<br />
development beyond the basics?<br />
Fulfilling basic needs is an essential part of<br />
expanding capabilities but is insufficient to<br />
enable people to reach their full potential.<br />
This is especially so in a world characterized by<br />
new and often more precarious forms of work,<br />
escalating violence and mounting environmental<br />
crises. Many people are deprived of a<br />
sense of security that they will be able to retain<br />
tomorrow the gains they have made today.<br />
Many are deprived of voice and opportunities<br />
to participate in the collective valuation of<br />
policies and priorities. Others lack access to<br />
good-quality services and to information and<br />
communication technology. Practical universalism<br />
requires attention to these and other<br />
dimensions of human development in which<br />
people in both developed and developing<br />
countries remain deprived.<br />
<strong>Development</strong> in some of these dimensions<br />
may not have appeared so urgent in the past<br />
simply because of the scale of the deprivation in<br />
basic needs. Parents of children who lack access<br />
to schooling may not worry about the quality<br />
of secondary education. Families that are trying<br />
to get by on less than $1.90 a day may not prioritize<br />
the prevention of environmental crises.<br />
But as the types of deprivations captured in<br />
the HDI and MPI are reduced for individuals<br />
and societies, other deprivations become more<br />
prominent. People have more choices and freedoms,<br />
but there are still constraints that limit<br />
life potential.<br />
Surveys based on subjective evaluations provide<br />
insights into the diversity of values across<br />
populations and suggest links between the<br />
surroundings and the development priorities of<br />
individuals. For example, the My World global<br />
survey being conducted by the United Nations<br />
in support of the 2030 Agenda assessed development<br />
issues that matter most to people. 108<br />
More than 9 million responses have prioritized<br />
action issues from 16 options, ranging from<br />
securing a good education and ensuring political<br />
freedom to tackling climate change. The<br />
top three priorities are good education, better<br />
health care and better job opportunities. A<br />
disaggregation of the survey data by development<br />
status, age, gender, citizenship and region<br />
shows more variation in the top priorities.<br />
There are thus differences in the aggregate<br />
priorities of individuals in countries at different<br />
levels of human development (figure 2.10).<br />
Good education is the top priority across all<br />
human development groups, and the top three<br />
priorities are similar in the low, medium and<br />
high human development countries. But an<br />
honest and responsive government and access<br />
to clean water and sanitation are among the<br />
top three priorities in very high human development<br />
countries, where better health care and<br />
better job opportunities are not even among<br />
the top five priorities.<br />
A survey by the Pew Research Center reinforces<br />
the context specificity of people’s<br />
priorities and concerns. Some 83 percent<br />
of respondents in 34 developing countries<br />
considered crime to be the biggest problem<br />
in their country. 109 Corruption, lack of health<br />
care, poor schools and water pollution were<br />
also viewed as major problems. The percentage<br />
of respondents who listed crime as a concern<br />
was 93 percent) in Tunisia, compared with<br />
only 31 percent in Poland, where 59 percent<br />
of respondents listed health care as a very big<br />
problem (which compares with only 17 percent<br />
in China).<br />
Income can also shape people’s priorities.<br />
Respondents in a nationwide opinion survey<br />
in Chile were asked what was most important<br />
to them in order to have a happy life. The<br />
answers of respondents in the highest and<br />
lowest income quintiles varied substantially.<br />
Respondents in the highest income quintile<br />
most often cited the achievement of life goals<br />
and targets, whereas respondents in the lowest<br />
income quintile cited a peaceful life without<br />
much disruption (figure 2.11). Leading a<br />
meaningful life and enjoying the good things in<br />
life were less of a priority among respondents in<br />
the lowest income quintile.<br />
People’s priorities and values appear to be<br />
context specific. In Algeria, where youth unemployment<br />
rates are high, a young woman<br />
may value employment most. Once integrated<br />
into the labour market and at the peak of her<br />
career, she may value free time the most. A<br />
74 | HUMAN DEVELOPMENT REPORT <strong>2016</strong>
FIGURE 2.10<br />
There are differences in the aggregate priorities of individuals in countries at different levels of human<br />
development<br />
Low<br />
human<br />
development<br />
Medium<br />
human<br />
development<br />
High<br />
human<br />
development<br />
Very high<br />
human<br />
development<br />
A good education<br />
1 1 1<br />
1<br />
Better health care<br />
2 2<br />
3<br />
Better job opportunities<br />
3 3<br />
2<br />
An honest and responsive government<br />
Affordable and nutritious food<br />
4 5 4<br />
2<br />
5 5<br />
Access to clean water and sanitation<br />
4<br />
3<br />
Protection against crime and violence<br />
5<br />
4<br />
Source: <strong>Human</strong> <strong>Development</strong> <strong>Report</strong> Office estimates based on United Nations (2015b).<br />
FIGURE 2.11<br />
The priorities of Chileans vary by income<br />
%<br />
40<br />
Poorest 20 percent<br />
Richest 20 percent<br />
30<br />
20<br />
10<br />
0<br />
Leading a<br />
meaningful life<br />
Sharing<br />
with others<br />
Leading a<br />
peaceful life without<br />
much disruption<br />
That loved ones<br />
have a good life<br />
Achieving life<br />
goals and targets<br />
Enjoying the<br />
good things in life<br />
Source: UNDP 2012a.<br />
healthy older man in Norway may value good<br />
interpersonal relationships with friends and<br />
family the most, despite having valued free time<br />
more when he was younger and working, like<br />
Most important to have a happy life<br />
his Algerian counterpart. Because values evolve<br />
and shift according to the context, the human<br />
development approach remains relevant even<br />
as basic needs are met.<br />
Because values evolve<br />
and shift according to<br />
the context, the human<br />
development approach<br />
remains relevant even<br />
as basic needs are met<br />
Chapter 2 Universalism—from principlesto practice | 75
Whether intentional<br />
or unintentional, the<br />
exclusion from the<br />
opportunities of one<br />
group by another<br />
group is often the<br />
root of deprivation<br />
and disadvantage<br />
Barriers to universalism<br />
Deprivations can be eliminated. The progress<br />
since the first <strong>Human</strong> <strong>Development</strong> <strong>Report</strong> in<br />
1990 demonstrates this. The global HDI value<br />
has increased 20 percent since then, from 0.597<br />
to 0.717. The increase in the HDI value for the<br />
least developed countries is 46 percent. 110<br />
Progress has not come easily, but the path to<br />
progress may have been easier than the path to<br />
the goal of leaving no one behind. Individuals<br />
who are still deprived may be the most difficult<br />
to reach — geographically, politically, socially<br />
and economically. It is time to push to eradicate<br />
the remaining deprivations not only in access to<br />
health care, education and livelihoods, but also<br />
in other dimensions of well-being, such as security,<br />
freedom of participation in political life<br />
and access to advanced, high-quality services.<br />
The realization of this vision will face challenges.<br />
Some barriers may require technical<br />
solutions — greater fiscal resources and development<br />
assistance, gains in technology and<br />
improved data resources for monitoring and<br />
evaluation (see chapter 3). These barriers can be<br />
addressed, albeit not easily, through changes in<br />
national policies (see chapter 4) and in international<br />
systems (see chapter 5).<br />
Other barriers are deeply embedded in social<br />
and political relationships and identities.<br />
The context in which many individuals make<br />
choices is fraught with insecurity, glaring<br />
inequalities and competition for scarce resources.<br />
Discriminatory laws, exclusionary<br />
social norms, violence, imbalances in political<br />
participation and unequal distribution of<br />
opportunities all stand in the way of progress.<br />
Exclusion can be intentional or unintentional,<br />
but the results are the same — some people<br />
will be more deprived than others, and not<br />
all people will have an equal chance to realize<br />
their full potential. Men have more choices<br />
than women, rich people have more choices<br />
than poor people, citizens have more choices<br />
than migrants and some ethnicities have more<br />
choices than others.<br />
Progress towards universal human development<br />
requires a deep awareness and understanding<br />
of the drivers and dynamics of these<br />
groups’ exclusion. The drivers and the dynamics<br />
inevitably vary across countries and regions.<br />
Universalism in practice is possible, but key<br />
barriers and types of exclusion must be overcome<br />
(see infographic 2.1 at the beginning of<br />
the chapter).<br />
Intolerance and exclusion and<br />
the related mechanisms<br />
Whether intentional or unintentional, one<br />
group excluding another group from opportunities<br />
is often the root of deprivation and<br />
disadvantage. Membership in a group fulfils a<br />
basic desire to belong to a family, a community,<br />
a religion or a race. Individuals have multiple<br />
group affiliations at any one time and belong to<br />
different groups throughout life. Groups allow<br />
individuals to identify with others based on a<br />
shared characteristic or interest, but they also<br />
permit exclusion.<br />
Group inequalities reflect divisions that are<br />
socially constructed and sustained because they<br />
establish a basis for unequal access to valued<br />
outcomes and scarce resources. Once inequalities<br />
are established, the organizational focus<br />
becomes how to maintain the distinctions<br />
and ensure group loyalty and solidarity so that<br />
those who benefit from membership in the<br />
group are able to maintain their advantageous<br />
positions. At the same time the dimensions<br />
and mechanisms of exclusion are dynamic,<br />
as are the characteristics that groups use as a<br />
basis for exclusion. An ethnic minority group<br />
may penetrate the political space that has been<br />
occupied by the majority — a success from the<br />
perspective of equity in political participation<br />
— but the members of the ethnic minority who<br />
occupy the space may then use class divisions<br />
to exclude others in the same ethnic minority<br />
from participating in policy decisions. It is thus<br />
important to recognize that group identity and<br />
barriers of exclusion tend to shift under strategies<br />
to protect advantages.<br />
Many dynamics have a bearing on group formation<br />
and protection strategies. Today, trends<br />
in global income distribution present challenges<br />
to collective agreements and cooperation<br />
across countries and population segments.<br />
Voters in the lower middle class in developed<br />
countries are frustrated with the lower than<br />
average growth in their living standards relative<br />
to elites (box 2.9). The frustration is coupled<br />
with an awareness of high income growth in<br />
emerging economies such as China and India,<br />
76 | HUMAN DEVELOPMENT REPORT <strong>2016</strong>
BOX 2.9<br />
From the champagne glass to the elephant curve<br />
The 1992 <strong>Human</strong> <strong>Development</strong> <strong>Report</strong> showed that global income distribution<br />
followed a champagne glass pattern, where the bulk of income is concentrated<br />
at the top of the distribution, and the global income distribution in 1998 and<br />
2008 reflected that pattern (see left panel of figure). One might conclude that<br />
the people who are not at the top of the distribution have a collective interest<br />
in redistributing resources. But there seems to be a different lived experience<br />
across the stem of the glass. The rate of change in the real income between<br />
1988 and 2008 follows an elephant curve (see right panel of figure). 1 The percentage<br />
change in real income favoured those who were in the bottom half and<br />
the top declie of the global income distribution, whereas the real income of the<br />
lower middle class in developed countries—grew only modestly. For example,<br />
in Germany the real income of the poorest 50 percent grew 0–7 percent, in the<br />
United States the poorest 50 percent saw real income growth of slightly over 20<br />
percent and in Japan the poorest 10 percent saw real income decline.<br />
Income gains from 1998 to 2008 have not been even across income deciles<br />
P80–P90<br />
P70–P80<br />
P60–P70<br />
2008<br />
“Champagne glass”<br />
Global income distribution,<br />
1988 and 2008<br />
(2005 PPP $)<br />
50,000 40,000 30,000 20,000 10,000 0<br />
Richest 1% 39%<br />
P95–P99<br />
27%<br />
P90–P95<br />
17%<br />
1988<br />
“Champagne glass”<br />
The bulk of global income<br />
is concentrated at the very top of<br />
the distribution<br />
5%<br />
Real income growth,<br />
1988–2008 (%)<br />
12%<br />
The real incomes of the<br />
lower middle class in<br />
developed countries have<br />
seen only modest growth<br />
58%<br />
P50–P60<br />
P40–P50<br />
P30–P40<br />
62%<br />
72%<br />
70%<br />
P20–P30<br />
P10–P20<br />
46%<br />
53%<br />
Poorest 10%<br />
25%<br />
Note<br />
1. Milanović <strong>2016</strong>.<br />
Source: <strong>Human</strong> <strong>Development</strong> <strong>Report</strong> Office estimates based on Milanović (<strong>2016</strong>) and UNDP (1992).<br />
which may become a source of resentment<br />
against trade with and migration from developing<br />
countries.<br />
The pace of change is rapid and unpredictable,<br />
and many people are struggling to find<br />
their way. With globalization and greater human<br />
mobility, come changes in demographic<br />
structures, languages and cultural diversity.<br />
From a human development perspective,<br />
diversity should be celebrated as a powerful<br />
ingredient of human creativity. But there are<br />
also risks that social cohesion, mutual respect<br />
and tolerance of differences can be strained or<br />
break down altogether, resulting in xenophobia,<br />
nationalism, discrimination and violence.<br />
There can be a lack of recognition or appreciation<br />
for different beliefs and views, norms<br />
and cultures, and lifestyles. Historically, people<br />
have navigated periods of widespread change<br />
and unpredictability, but these periods are<br />
often characterized by immense suffering and<br />
conflict. Strict and extreme beliefs and views<br />
— whether religious or political — breed intolerance<br />
and prevent flexibility and adjustability<br />
to change. It is therefore crucial to identify and<br />
reverse patterns of intolerance during such<br />
times, whether discriminatory laws, exclusionary<br />
social norms or violence and coercion and<br />
to instead respond to emerging global challenges<br />
through mutual respect and collaboration.<br />
Discrimination, exclusion and intolerance run<br />
counter to universalism — the centrepiece of<br />
human development and the cornerstone of<br />
the world we want.<br />
Chapter 2 Universalism—from principlesto practice | 77
Legal and political<br />
institutions can be<br />
used and abused<br />
to perpetuate<br />
group divisions<br />
Discriminatory laws<br />
Legal and political institutions can be used<br />
and abused to perpetuate group divisions. An<br />
extreme case relates to the rights of the lesbian,<br />
gay, bisexual, transgender and intersex community<br />
in the 73 countries and five territories<br />
where same-sex sexual acts are illegal, including<br />
13 where such acts are punishable by death. 111<br />
Only 10 countries grant lesbian, gay, bisexual,<br />
transgender and intersex people equal constitutional<br />
rights. 112 Laws are discriminatory in<br />
other cases because they prevent certain groups<br />
from accessing services or opportunities, such<br />
as when host countries legally bar refugees<br />
from working. State policies can be discriminatory<br />
as well — such as denying citizenship or the<br />
right to vote or run for political office. National<br />
borders thus become legal instruments that<br />
can reinforce inequalities between the citizens<br />
of different countries. Within-country inequalities<br />
are wide, but the laws and practices<br />
in countries of birth can also determine life<br />
chances and opportunities.<br />
In some cases women do not have the same<br />
legal rights as men. Women’s opportunities are<br />
impeded by law in 155 out of 173 countries<br />
with data. In 100 countries women are prevented<br />
from engaging in some professions because<br />
of their gender. In 32 countries the procedures<br />
that women face to obtain a passport differ<br />
from those that men face. In 18 countries women<br />
need their husband’s approval to take a job.<br />
And in 46 countries laws do not protect women<br />
from domestic violence. 113 Women also face discrimination<br />
if their opportunities and choices<br />
are restricted because appropriate protective<br />
laws have not been enacted — for example, when<br />
paid maternity leave is not mandated or when<br />
discriminatory hiring practices are tolerated.<br />
As the 2015 <strong>Human</strong> <strong>Development</strong> <strong>Report</strong><br />
highlighted, far more women would become<br />
active in the labour market and have better<br />
wages and positions of influence if regulations<br />
were in place to reduce workplace harassment<br />
against women, ensure equal wages and hiring<br />
practices and provide care options for children<br />
and older people. 114 Discriminatory laws and<br />
the lack of legislation restrict women’s freedoms<br />
and impede their full participation in public life<br />
as equal members of society. These outcomes are<br />
linked to the fact that women are often excluded<br />
from the political spaces where policies and legislation<br />
are agreed. Globally women hold only<br />
22 percent of the seats in parliament, 26 percent<br />
of the seats on the highest courts and 18 percent<br />
of ministerial positions.<br />
Regulations and the nature of institutions<br />
can also indirectly limit the access poor people<br />
have to services and resources. For example,<br />
banks that require minimum deposits limit<br />
access to financial services for poor people.<br />
Around 2 billion people worldwide are still<br />
unbanked — lacking accounts at banks, other<br />
financial institutions or mobile money service<br />
providers. 115 Similarly, the absence of birth<br />
registrations and lack of identity cards can prevent<br />
poor people from gaining access to many<br />
public services.<br />
Social norms<br />
Social norms are implicitly established rules of<br />
behaviour. Some may be helpful in promoting<br />
harmonious coexistence, but others may be<br />
discriminatory, prejudicial and exclusive.<br />
For example, prejudice and social perceptions<br />
often lead to unequal outcomes among different<br />
groups in job markets, which reduces livelihood<br />
opportunities for minorities. In employment<br />
recruitment in the United States White job<br />
applicants are often systematically selected over<br />
African American and Latino job applicants,<br />
even when the minorities have equal or higher<br />
qualifications. African Americans are often rejected<br />
solely on the basis of their names (which<br />
employers glean from resumes) and receive only<br />
half as many job offers as White candidates.<br />
Despite Nepal’s laws against untouchability, individuals<br />
considered of lower caste continue to<br />
be excluded from certain jobs and services, and<br />
Dalits earn considerably less than non-Dalits.<br />
Discriminatory treatment of persons with disabilities<br />
is widespread and has implications for<br />
their livelihoods. In Mauritius, Panama, Peru,<br />
the Russian Federation and the United States<br />
the employment gap between persons with disabilities<br />
and persons without disabilities is more<br />
than 40 percentage points. 116<br />
In many countries social norms reduce choice<br />
and opportunities for women and girls. As the<br />
2015 <strong>Human</strong> <strong>Development</strong> <strong>Report</strong> highlighted,<br />
norms and traditions that distribute the<br />
bulk of unpaid work in the home to women<br />
78 | HUMAN DEVELOPMENT REPORT <strong>2016</strong>
limit women’s participation in the labour market<br />
and can prevent girls from attending<br />
school. 117 Women are typically responsible for<br />
more than three-quarters of unpaid care work<br />
in the household. 118 The presence of women as<br />
customers in cafés or restaurants may also be<br />
discouraged by social norms, and in some cases<br />
it is taboo for women to travel in public without<br />
being accompanied by a man. 119 Practices such<br />
as female genital mutilation and cutting, performed<br />
on 200 million girls and women alive<br />
today, are also linked to social norms and put<br />
girls at extreme and unnecessary health risk. 120<br />
Social norms in marriage can reduce opportunities<br />
and reinforce inequalities. Child<br />
marriage is a fundamental violation of human<br />
rights, yet it continues because of customs and<br />
other normative factors. 121 In South Asia 46<br />
percent of girls become child brides, and many<br />
marry before age 15 (figure 2.12). Early marriage<br />
limits a girl’s future development because<br />
it increases the likelihood of early pregnancy,<br />
social isolation and leaving school early.<br />
There is also evidence that the choices people<br />
make in marriage reinforce socioeconomic<br />
hierarchies and ethnic divisions because people<br />
tend to marry within their own socioeconomic<br />
or ethnic group. A study in the United<br />
FIGURE 2.12<br />
In South Asia many girls marry before age 18—<br />
some before age 15<br />
%<br />
60<br />
40<br />
20<br />
0<br />
Bangladesh India Sri Lanka Pakistan<br />
Source: Banu <strong>2016</strong>.<br />
Under age 15<br />
Under age 18<br />
Kingdom found that 56 percent of the current<br />
generation of women have married a partner<br />
in the same social class, a rising trend. 122 Some<br />
11 percent of the increase in inequality in<br />
developed countries since the 1980s is due to<br />
people’s choice to marry at a similar socioeconomic<br />
level — doctors marrying lawyers, for<br />
instance. 123 Marriage also perpetuates social<br />
norms and traditions linked to ethnic groups.<br />
The preference in Mauritius for marrying within<br />
the same ethnic group overrides even classbased<br />
considerations. 124<br />
Violence<br />
Perhaps the most direct and radical mechanism<br />
of exclusion is violence. Coercive tools enable<br />
one group to force its vision of society on<br />
another and to protect its access to resources,<br />
outcomes and the power to make decisions.<br />
Motivations include consolidating political<br />
power, safeguarding the well-being of elites,<br />
controlling the distribution of resources, seizing<br />
territory and resources and favouring ideologies<br />
based on the supremacy of one identity<br />
and set of values. 125<br />
Exclusion breeds violence. One study drawing<br />
on global data since 1945 found that a 30<br />
percent increase in the size of the politically<br />
excluded population boosted the chance of<br />
civil war by 25 percent. 126 Another study found<br />
that countries with higher inequality among<br />
ethnic groups have lower incomes overall and<br />
a more uneven distribution of services and infrastructure<br />
and are more prone to conflict and<br />
violence. 127<br />
Intolerance of others — legal, social or<br />
coercive — is antithetical to human development<br />
and to universalism. Intolerance, exclusion<br />
and inequality are nonetheless common<br />
and are on the rise in some cases. Overcoming<br />
these barriers will require finding ways to link<br />
collective interests to equity and justice (see<br />
chapter 3).<br />
Elite capture of institutions<br />
Some thrive in a global labour market owing to<br />
their advanced skills and education. They retire<br />
comfortably with private pension funds and<br />
savings. They send their children to the best<br />
schools for advanced tertiary education. They<br />
Intolerance of<br />
others — legal, social<br />
or coercive — is<br />
antithetical to human<br />
development and<br />
to universalism<br />
Chapter 2 Universalism—from principlesto practice | 79
Extreme inequality<br />
and the concentration<br />
of capabilities and<br />
opportunities among<br />
a narrow elite are part<br />
of a vicious circle<br />
live in the safest communities. And they have<br />
the means to influence the political process in<br />
their favour.<br />
There are links among income inequality,<br />
inequalities in education and health care and<br />
inequalities in political participation and influence.<br />
The top 1 percent of the wealth distribution<br />
holds 46 percent of the world’s wealth. 128<br />
Much of the income gain in recent decades<br />
has been at the top: 44 percent of the income<br />
earned between 1988 and 2008 went to only<br />
5 percent of the population. 129 Such income<br />
inequalities influence inequalities in other dimensions<br />
of well-being.<br />
Extreme inequality and the concentration of<br />
capabilities and opportunities among a narrow<br />
elite are part of a vicious circle. As inequalities<br />
become wider, marginalized and excluded<br />
groups face growing deficiencies in opportunities<br />
to expand and apply their capabilities and<br />
to influence the institutions and policies that<br />
determine the subsequent distribution. Positive<br />
opportunities for political participation and<br />
influence are central to breaking the vicious<br />
circle.<br />
The interests of the middle class may also<br />
sometimes lead to policy decisions that perpetuate<br />
deprivations and the exclusion of<br />
poorer groups. Antipoverty programmes have<br />
been opposed in some countries because they<br />
do not benefit the middle class, an important<br />
political constituency. 130 One result is that<br />
redistribution programmes can have limited<br />
coverage among the poorest population and<br />
exhibit substantial leakage to the middle class<br />
and elites. Some programmes tie eligibility for<br />
transfers to employment in the formal sector in<br />
order to gain the support of the middle class. 131<br />
In Tanzania distributing vouchers for agricultural<br />
inputs disproportionately benefited the<br />
households of village officials, who received 60<br />
percent of the vouchers. 132 These approaches<br />
increase political support, but miss those who<br />
are most in need of support.<br />
Conditional cash transfers have generated<br />
impressive reductions in poverty, but their<br />
reach has extended beyond poor people. In<br />
some cases this has been to ensure that people<br />
who are near poverty and people who are<br />
vulnerable have access to funds, but there is<br />
also leakage to those with less need. The share<br />
of nonpoor beneficiaries of conditional cash<br />
transfers increased from 46 percent in 2004<br />
to 65 percent in 2010 in Ecuador and from<br />
40 percent in 2002 to 61 percent in 2010 in<br />
Mexico. 133<br />
Elite capture of the benefits of development<br />
and the institutions — markets, states and civil<br />
society — that guide the distribution of opportunities<br />
can widen and perpetuate divisions<br />
in capabilities in highly unequal societies. 134<br />
The extreme concentration of capabilities and<br />
opportunities at the top can erode democratic<br />
governance and reduce pluralism in decisionmaking.<br />
Equity and justice take a back seat to<br />
rules that perpetuate divides.<br />
Weak bargaining power<br />
Excluded groups are in a weak position to<br />
instigate the transformation of institutions<br />
because of the extent of inequality and elite<br />
capture. They lack agency and voice and have<br />
little political leverage to influence policy<br />
outcomes and legislation through traditional<br />
means. Over the past three decades, various<br />
measures have shown a decline in rights of free<br />
association and collective bargaining (figure<br />
2.13). 135 The increasingly flexible and part-time<br />
nature of work reduces the ability of traditional<br />
worker organizations, such as trade unions, to<br />
counter elite interests.<br />
Other, sometimes dangerous and debilitating<br />
means of participating become more attractive<br />
in highly unequal societies. There has been a<br />
steady increase in local and global protests in<br />
recent years, including demonstrations and<br />
rallies, campaigns of social and political movements<br />
and unorganized crowd actions such<br />
as riots (843 worldwide between 2006 and<br />
2013). 136 This suggests that people do not feel<br />
sufficiently empowered by established political<br />
processes and are choosing to voice their concerns<br />
in alternative ways.<br />
Groups may be organizing and participating<br />
in peaceful marches and rallies, but they are also<br />
using civil disobedience to magnify their voices<br />
by blocking roads and occupying city streets<br />
and public spaces. They are using technology<br />
to leak government and corporate data. The<br />
global circulation of the Panama Papers drew<br />
attention to grievances against offshore tax<br />
havens and hidden wealth accumulation among<br />
the world’s political and corporate leaders.<br />
80 | HUMAN DEVELOPMENT REPORT <strong>2016</strong>
FIGURE 2.13<br />
Over the past three decades there has been a<br />
decline in rights of free association and collective<br />
bargaining<br />
Freedom of Association and Collective Bargaining Index<br />
9<br />
were being fought by nationalists seeking to<br />
establish separate nation-states or between ethnicities<br />
over ethnic balances of power within<br />
existing states. 137 The Brexit is one of the most<br />
recent examples of a retreat to nationalism<br />
among individuals who are feeling alienated in<br />
a changing world. This shift towards support<br />
for nationalism might have been foreseen.<br />
8<br />
7<br />
6<br />
5<br />
1985<br />
1990 1995 2000 2005 2010<br />
Note: Data are for 73 countries.<br />
Source: <strong>Human</strong> <strong>Development</strong> <strong>Report</strong> Office estimates based on Marx, Soares<br />
and Van Acker (2015).<br />
Narrow self-identities<br />
Economic, ecological and technological systems<br />
extend across national borders. Decisions<br />
in one nation or region can affect individuals<br />
on the opposite side of the world. Trade<br />
policies in Europe can affect agricultural livelihoods<br />
in Latin America. Carbon emissions<br />
in Asia can generate climate vulnerabilities in<br />
Africa. Financial policies in the United States<br />
can shift global capital flows. Universal human<br />
development and ensuring opportunities for<br />
all thus require a united global effort to reduce<br />
inequalities and empower marginalized groups.<br />
At a time when global action and collaboration<br />
are imperative, self-identities are narrowing.<br />
Social and political movements linked to<br />
identity, whether nationalist or ethno political,<br />
seem to be increasing in frequency and<br />
strength. Identity politics are on the rise. Data<br />
from 1816 to 2001 show a peak in 2001 when<br />
almost 90 percent of the conflicts in the world<br />
Breaking down barriers<br />
Divisions and exclusions, while often deep, are<br />
not static. Shocks, disasters, crises, political<br />
shifts, the spread of technologies, the globalization<br />
of information, business and social<br />
networks — all open space for new alignments<br />
and the redistribution of political and material<br />
resources across groups. This is why we need to<br />
understand emerging trends that can unite, empower<br />
and motivate people to push for change<br />
and the potential collective interests of groups<br />
that may stand to gain influence and leverage.<br />
The 2030 Agenda is momentous in that it<br />
focuses on the universal reduction of deprivations.<br />
If this intergovernmental agreement can<br />
be harnessed to truly shift institutions onto a<br />
path that promotes justice, equity and sustainability,<br />
remaining deprivations and inequalities<br />
can be overcome.<br />
The human development approach has always<br />
advocated for the expansion of capabilities and<br />
freedoms to the fullest for all people regardless<br />
of gender, nationality, ethnicity, sexual orientation<br />
or any other group identity. But translating<br />
universalism from principle to practice will have<br />
to rely on more than mapping the groups that<br />
have been bypassed in the human development<br />
journey and identifying the barriers to ensure<br />
that human development reaches everyone. It<br />
will also require refocusing on some elements<br />
of the human development analytical approach<br />
that have so far been insufficiently considered,<br />
such as voice and participation, identity and<br />
diversity, inclusion and social justice. Chapter 3<br />
is devoted to such analysis.<br />
Divisions and<br />
exclusions, while often<br />
deep, are not static<br />
Chapter 2 Universalism—from principlesto practice | 81
Chapter 3<br />
Reaching everyone—<br />
analytical and<br />
assessment issues
Infographic 3.1 <strong>Human</strong> development represents freedom<br />
of well-being as well as freedom of agency<br />
Functionings<br />
Things a person<br />
values being or doing<br />
Capabilities<br />
Set of combinations<br />
of functionings that<br />
can be achieved<br />
<strong>Human</strong><br />
development<br />
Agency to do or achieve<br />
what is valued<br />
Voice and autonomy
<strong>Human</strong> <strong>Development</strong><br />
3.<br />
<strong>Report</strong> <strong>2016</strong><br />
<strong>Human</strong> <strong>Development</strong> for Everyone<br />
Reaching everyone —<br />
analytical and assessment issues<br />
The human development approach is anchored in the idea of universalism, whereby all people — present and future — can<br />
realize their full potential. Two issues stand out. First, practical universalism shows that progress in human development is<br />
unbalanced across and within countries, socioeconomic groups, ethnic and racial groups, women and men, and generations<br />
and have not always reached the most deprived. Second, the world of today differs from the world of 25 years ago and<br />
presents new opportunities and challenges. It is thus necessary to map out those who have been left out of the progress in<br />
human development and to understand why. It is equally important — as this chapter outlines — to address analytical and<br />
assessment issues that, once resolved, may help the barriers to universal human development be overcome.<br />
The human development approach is based on<br />
two fundamental freedoms — the freedom of<br />
well-being, including functionings and capabilities,<br />
and the freedom of agency, including<br />
voice and autonomy. Functionings are the various<br />
things that a person may value being and<br />
doing, and capabilities are the combinations<br />
of functionings that a person can achieve.<br />
Agency is related to “what a person is free to<br />
do and achieve in pursuit of whatever goals<br />
or values he or she regards as important” (see<br />
infographic 3.1 on the preceding page). 1<br />
What aspects need<br />
to be analysed<br />
Over the years the <strong>Human</strong> <strong>Development</strong><br />
<strong>Report</strong> has emphasized that human development<br />
is about expanding choices. This remains<br />
true. Choices determine who we are and what<br />
we do. Those choices rest on four foundations:<br />
the wide range of options that we have to<br />
choose from — our capabilities; the social and<br />
cognitive constraints and social norms and influences<br />
that shape our values and choices; our<br />
own empowerment and the agency we exercise<br />
individually and as part of groups in shaping<br />
our options and opportunities; and the mechanisms<br />
that exist to resolve competing claims<br />
in ways that are fair and conducive to realizing<br />
human potential (figure 3.1).<br />
Examining these foundations is particularly<br />
important to ensuring human development for<br />
everyone. The human development approach,<br />
grounded in the capability approach, provides<br />
a systematic way to articulate these ideas. It<br />
can be especially powerful in illuminating the<br />
interplay among factors that can operate to<br />
the disadvantage of individuals and groups in<br />
different contexts.<br />
This chapter highlights ideas from the human<br />
development approach that need to be<br />
re-emphasized to ensure that human development<br />
reaches everyone. It also presents specific<br />
analytical perspectives for examination.<br />
The human development approach has<br />
shown continuity but also resilience. It has<br />
proven robust but also adaptable to changes in<br />
the world over the past quarter-century. The<br />
core definitions of the approach have been<br />
used in diverse ways. They have been used<br />
to describe whether and how much people<br />
have a say in matters that concern their lives,<br />
a meaningful opportunity to contribute to<br />
development and a chance to obtain a fair<br />
share of the fruits of development. And they<br />
have been simplified by attributing to human<br />
development any improvement in the human<br />
condition that allows people to live longer<br />
and healthier lives. The human development<br />
approach is ultimately “simple yet rich, full yet<br />
open-ended, flexible yet responsible, normative<br />
yet visionary, inspiring yet practical.” 2<br />
<strong>Human</strong> rights — the bedrock of the<br />
human development approach<br />
The definition of human rights consistently<br />
used in the <strong>Human</strong> <strong>Development</strong> <strong>Report</strong> is<br />
that of the Universal Declaration of <strong>Human</strong><br />
Rights of 1948, which considers political and<br />
The human<br />
development approach<br />
can be especially<br />
powerful in illuminating<br />
the interplay among<br />
factors that can<br />
operate to the<br />
disadvantage of<br />
individuals and groups<br />
in different contexts<br />
Chapter 3 Reaching everyone — analytical and assessment issues | 85
FIGURE 3.1<br />
Choices rest on four foundations<br />
Foundations underlying choices<br />
The wide range of<br />
options that we have to<br />
choose from—<br />
our capabilities<br />
The social and cognitive<br />
constraints and social<br />
norms and influences<br />
that shape our values<br />
and choices<br />
Our own empowerment<br />
and the agency we<br />
exercise individually and<br />
as part of groups in<br />
shaping our options and<br />
opportunities<br />
The mechanisms that<br />
exist to resolve<br />
competing claims in<br />
ways that are fair and<br />
conducive to realizing<br />
human potential<br />
Source: <strong>Human</strong> <strong>Development</strong> <strong>Report</strong> Office.<br />
Focusing on<br />
accountability for<br />
failures within a social<br />
system broadens the<br />
outlook beyond the<br />
minimum claims of<br />
human development<br />
and can be a powerful<br />
tool in seeking remedy<br />
socioeconomic rights as well as civil and cultural<br />
rights. 3 <strong>Human</strong> rights thus include the right to<br />
life, liberty and security; the freedom of assembly,<br />
thought, religion and opinion; the right<br />
to work; the right to an adequate standard of<br />
living, food, clothing, housing and education;<br />
and the right to participate in community life.<br />
<strong>Human</strong> development and human rights are<br />
closely related. The best way to secure human<br />
rights may be to consider rights in terms of<br />
capabilities. The right to bodily integrity, to<br />
associate freely, to political participation and<br />
all other rights are secured when the relevant<br />
capabilities are available. To secure a right is to<br />
enable people to be or do something that they<br />
have reason to value. Yet certain fundamental<br />
rights may be recognized on paper but not<br />
implemented or available in practice. 4 Women<br />
may have the right to vote by law but be threatened<br />
with violence if they leave the house. They<br />
thus lack the capability to exercise the human<br />
right of political participation.<br />
<strong>Human</strong> rights offer a useful perspective for<br />
analysing human development such as “the idea<br />
that others have duties to facilitate and enhance<br />
human development.” 5 The 2000 <strong>Human</strong><br />
<strong>Development</strong> <strong>Report</strong> highlighted that “to have<br />
a particular right is to have a claim on other<br />
people or institutions that they should help<br />
or collaborate in ensuring access to some freedom.”<br />
6 With invoked duties come the notions<br />
of accountability, culpability and responsibility.<br />
For example, recognizing the human right<br />
to free basic education means much more than<br />
merely agreeing that it is a good thing for everyone<br />
to have a basic education — or even that<br />
everyone should have an education. Rather,<br />
asserting this right is claiming that all people<br />
are entitled to a free elementary education and<br />
that if some lack access to it, there must be<br />
accountability somewhere in the social system.<br />
This focus on accountability for failures within<br />
a social system broadens the outlook beyond<br />
the minimum claims of human development.<br />
This broader perspective can be a powerful tool<br />
in seeking remedy, and the analysis of human<br />
development can profit from it. Such a perspective<br />
spotlights the strategies and actions of<br />
various duty bearers to contribute to fulfilling<br />
human rights and advancing the corresponding<br />
aspects of human development. It also leads to<br />
an analysis of the responsibilities of actors and<br />
institutions when rights go unfulfilled. This analysis<br />
and understanding are essential to achieving<br />
progress inhuman development for everyone.<br />
Voice, participation and<br />
democratic practice —an integral<br />
part of human development<br />
The ability to deliberate, participate in public<br />
debates and be agents in shaping their own<br />
lives and environments is a fundamental value<br />
of most people. There are three main reasons<br />
within the human development approach to<br />
value voice and participation (box 3.1). Voice<br />
86 | HUMAN DEVELOPMENT REPORT <strong>2016</strong>
and participation are both a means and an end.<br />
Truly functional, participatory democracy,<br />
which is much broader than a voting process,<br />
leads to a virtuous circle. Political freedoms<br />
empower people to demand policies that expand<br />
their opportunities to hold governments<br />
accountable. Debate and discussion help<br />
communities shape priorities. A free press, a<br />
vibrant civil society and the political freedoms<br />
guaranteed by a constitution underpin inclusive<br />
institutions and human development. The<br />
human development approach views people<br />
not only as beneficiaries of development, but<br />
also as architects of their own lives. 7<br />
Related to this is the notion of agency. People<br />
who enjoy high levels of agency are engaged<br />
in actions congruent with their values. When<br />
people are coerced into an action, are submissive<br />
or desirous to please or are simply passive,<br />
they are not exercising agency. 8<br />
Well-being and agency — the two fundamental<br />
freedoms in the human development<br />
approach — are related yet distinct. An agent<br />
is someone who acts and brings about change.<br />
Agency can advance one’s own well-being, but<br />
it can also further the well-being of others.<br />
People may thus volunteer for causes that do<br />
not advance their own well-being, such as protecting<br />
the rights or improving the conditions<br />
of vulnerable groups or conserving ecosystems,<br />
landmarks or historical monuments. People<br />
may put themselves in gruelling situations,<br />
working to promote causes they believe in at<br />
the cost of their own health or security. They<br />
are exercising their agency. <strong>Human</strong> agency<br />
thus advances any goals that are important to<br />
individuals — for themselves, for their communities<br />
or for other entities.<br />
The exponential spread of information and<br />
communication technologies, along with rising<br />
education and literacy rates, has provided<br />
individuals with new tools for participation<br />
(box 3.2). Online participation can have a<br />
major impact on agency and empowerment.<br />
But new forms of participation also face challenges<br />
and risks that must be addressed. Equal<br />
access to the Internet for all people must be<br />
pursued between and within countries. And<br />
people must be protected from the risks of<br />
misinformation and online violence — such as<br />
cyberbullying, online sexual abuse, harassment<br />
or hate speech — that target mostly children<br />
and women. 9<br />
The primary focus of the human development<br />
approach and of the <strong>Human</strong> <strong>Development</strong><br />
<strong>Report</strong> has largely been on the freedom of<br />
well-being. This is reflected in the way the<br />
<strong>Human</strong> <strong>Development</strong> Index (HDI) has been<br />
constructed. This focus may have arisen because<br />
basic deprivations were once more widespread,<br />
attracting the preponderance of analysis, measurement<br />
and policy response. But as well-being<br />
was realized, emphasizing freedom of agency has<br />
become more important. That freedom has an independent,<br />
intrinsic worth, in addition to an instrumental<br />
value because it enhances well-being.<br />
Agency can advance<br />
one’s own wellbeing,<br />
but it can<br />
also further the<br />
well-being of others<br />
BOX 3.1<br />
Voice and participation—intrinsic, instrumental and constructive<br />
Voice and participation are intrinsically important, make<br />
instrumental contributions and play a constructive role<br />
in the human development approach:<br />
• Intrinsic. Voice and participation have high intrinsic<br />
value to people as key functionings.<br />
• Instrumental. Voice and participation enhance democratic<br />
political freedoms and thus have instrumental<br />
value in expanding capabilities. The functionings<br />
of being well fed and free of disease or having an<br />
adequate education may appear basic. In practice,<br />
even these are difficult to achieve without the ability<br />
to participate in society. Being excluded and shut<br />
off and not possessing voice are usually the reasons<br />
that people and groups lack basic capabilities,<br />
sometimes generation after generation.<br />
• Constructive. Societies and nations must deliberate<br />
and decide, through give and take, their common<br />
priorities and agendas. Effective participation ensures<br />
that all groups sit at the table. Broad, truly<br />
representative participation in civic dialogue is the<br />
way to ensure that societies advance towards realizing<br />
the concept of justice, the principles of universalism<br />
and sustainability, and other values that<br />
they hold collectively.<br />
Source: <strong>Human</strong> <strong>Development</strong> <strong>Report</strong> Office.<br />
Chapter 3 Reaching everyone — analytical and assessment issues | 87
BOX 3.2<br />
Facilitating participation through new technologies<br />
The spread of the Internet over the past decades has<br />
facilitated the rise of new forms of civil participation.<br />
These include e-government, online petitions,<br />
mass demonstrations, crowdfunding and blogging.<br />
Although petitions, protests, fundraising and political<br />
publications have long existed, the Internet has<br />
allowed them to achieve unprecedented coverage,<br />
bringing people together across physical borders with<br />
enormous speed.<br />
Activists can now gather support from millions of<br />
people in a few weeks and with limited resources, permitting<br />
them to have an impact on public and political<br />
life that would have been impossible through traditional<br />
means of participation. This has challenged government<br />
and party monopolies in politics and effectively broadened<br />
civil participation. New technologies have also<br />
helped previously excluded groups—such as people<br />
with limited mobility, people living in secluded areas and<br />
young people—participate in public and political life.<br />
Source: <strong>Human</strong> <strong>Development</strong> <strong>Report</strong> Office.<br />
Looking at the world<br />
only through the lens<br />
of threats sometimes<br />
imposes the tyranny<br />
of the urgent over<br />
the essential<br />
<strong>Human</strong> security — a precondition<br />
for human development<br />
The concept of human security shifts the<br />
attention from interstate conflicts towards<br />
people’s feelings of insecurity. It encompasses<br />
concerns about jobs, income, health, the environment<br />
and crime. It also means protection<br />
from sudden and harmful disruptions in life.<br />
According to the 1994 <strong>Human</strong> <strong>Development</strong><br />
<strong>Report</strong>, “human security is not a concern with<br />
weapons — it is a concern with human life and<br />
dignity.” 10<br />
Millions of people around the world must<br />
cope with the impacts of climate change,<br />
natural disasters, economic and health crises,<br />
and intolerance and violence (see chapter 1).<br />
Because of these new realities and the aspiration<br />
of leaving no one behind, the concept<br />
of human security remains highly relevant.<br />
The emphasis should be on achieving a deep<br />
understanding of threats, risks and crises and<br />
addressing them through joint action based on<br />
the crucial concepts and approaches of human<br />
development and human security. 11 Two ideas<br />
are relevant:<br />
• Countering the shock-driven response to global<br />
threats. There is no denying that an inevitable<br />
short-term security imperative exists requiring<br />
an emergency response. This is understandable<br />
from a human agency perspective. The effect<br />
of shocks on global attention nonetheless<br />
has significance in responding to questions<br />
about who is being left behind and why. This<br />
is because precisely these forgotten or difficult<br />
to reach populations are usually the most at<br />
risk to shocks. But looking at the world only<br />
through the lens of threats sometimes imposes<br />
the tyranny of the urgent over the essential.<br />
Peaks in attention to emergencies fail to<br />
address the gradual and complex process of<br />
vulnerability that builds between shocks.<br />
The human development and human security<br />
approaches, while remaining available to confront<br />
short-term security imperatives, should<br />
become involved in aligning efforts to shift the<br />
emphasis away from shock-driven responses to<br />
global threats. People are also left behind when<br />
threats are protracted and require a long-term<br />
commitment to crisis management.<br />
• Promoting a culture of prevention. How<br />
should we understand and practise prevention<br />
as part of the development process?<br />
If one sees the world through the prism of<br />
threats, it may appear normal for crises to be<br />
considered opportunities. A return to business<br />
as usual once the emergency has passed<br />
may appear equally normal. Yet, while crisis<br />
prevention may receive the least attention in<br />
the cycle of crisis management, it is the component<br />
that, everybody agrees, should be the<br />
most important.<br />
To shift from a shock-driven response to crisis<br />
to a needs-driven one, human development<br />
strategies must be anchored in the everyday<br />
and not rooted in emergencies. <strong>Human</strong> security<br />
emphasizes the centrality of people in the<br />
calculations that make us assign importance to<br />
some threats over others. This emphasis should<br />
also encourage us to pay attention to the full<br />
cycle of relief, recovery and prevention in crisis<br />
management.<br />
88 | HUMAN DEVELOPMENT REPORT <strong>2016</strong>
<strong>Human</strong> decisionmaking — to<br />
be examined more closely<br />
The functionings that individuals realize<br />
through their capabilities flow from a confluence<br />
of conscious or subconscious choices. In<br />
making choices, people often fail to take into<br />
account the spillovers and long-term consequences.<br />
They may follow the herd or fail to<br />
correct for cognitive bias. They may simply<br />
be overwhelmed and unable to process all the<br />
available information — with important implications<br />
for human development. Examples<br />
include the failure to save for retirement or<br />
taking on bad loans although better options are<br />
available. Such mistakes are well documented<br />
in the literature on behavioural and cognitive<br />
science. 12<br />
People face many decisions, ranging from the<br />
trivial to the consequential. They face multiple<br />
options and have to make choices, sometimes<br />
as part of a group. <strong>Development</strong> economists<br />
and practitioners use standard models to assess<br />
how people make choices. Psychologists and<br />
experimental and behavioural economists,<br />
meanwhile, have been documenting the mistakes<br />
in how people make choices. 13 People’s<br />
decisions seem to be swayed by considerations<br />
that should not matter — the default option,<br />
the order in which options are presented and<br />
sometimes seemingly irrelevant options. Some<br />
researchers say that people are irrational or that<br />
they make (predictably) irrational choices. 14<br />
Dan Ariely, James B. Duke Professor at Duke<br />
University and a leading authority on behavioural<br />
economics, shares his thoughts on how<br />
to advance human development in a less than<br />
rational world (see special contribution).<br />
What seems like irrational behaviour by<br />
a group, such as poor people, may at times<br />
simply reflect a lack of access to services that<br />
everyone else takes for granted. People with<br />
stable incomes may fail to save and ensure future<br />
financial security. This may appear to be<br />
irrational behaviour. But it may simply be that<br />
these people lack access to basic services such<br />
as savings accounts. In the Philippines about<br />
30 percent of people who were offered a savings<br />
account with no option to make a withdrawal<br />
for six months accepted. Individuals who used<br />
the accounts increased their savings 82 percent<br />
more than the control group did. 15<br />
Some choices seem to irrationally depend on<br />
considerations that should not matter — how<br />
healthy and unhealthy foods are arranged in<br />
the supermarket or whether a company signs<br />
up employees automatically for a retirement<br />
savings plan. In all walks of life, how the options<br />
are presented and experienced can have<br />
an effect on the choices made. 16<br />
In some cases understanding how and under<br />
what conditions choices are made may suggest<br />
straightforward policy fixes. 17 In many other<br />
cases there may be no easy policy fixes. So being<br />
aware of the vagaries of human behaviour is<br />
essential. Only by being aware of how people<br />
make choices can planners design programmes<br />
and policies to support decisionmaking appropriately<br />
among people who may otherwise<br />
be especially prone to mistakes. Policy design<br />
involves judgements about default options,<br />
how much information to introduce and how<br />
the information is framed, presented and disseminated.<br />
Understanding how people make<br />
choices can enhance the process. 18 Some of<br />
these insights are integrated into policymaking.<br />
Others are novel, and a large number of<br />
researchers around the world are working on<br />
uncovering them. 19<br />
Collective capabilities — helping<br />
marginalized groups<br />
<strong>Human</strong> development is not only a matter of<br />
promoting the freedoms that individuals have<br />
and have reason to choose and value. It is also<br />
a matter of promoting the freedoms of groups<br />
or collective entities. Individuals are not the<br />
only unit of moral concern; structures of living<br />
together are, too. 20 The failure to explicitly<br />
include them in evaluating the state of affairs<br />
leads to the loss of important information.<br />
Take the example of a society that makes<br />
explicit arrangements to include persons with<br />
disabilities in the mainstream, allowing them<br />
to lead full lives as individuals and members<br />
of society. Or a society that is open towards<br />
and accepting of refugees, allowing them to<br />
find work and integrate in the mainstream.<br />
Conversely, a community that discourages lesbian,<br />
gay, bisexual, transgender or intersex individuals<br />
from marrying or having children limits<br />
the fulfilment of these people’s lives. Societies<br />
vary in the number, functions and effectiveness<br />
<strong>Human</strong> development<br />
is also a matter<br />
of promoting the<br />
freedoms of groups<br />
or collective entities<br />
Chapter 3 Reaching everyone — analytical and assessment issues | 89
SPECIAL CONTRIBUTION<br />
Predictably irrational—helping advance human development in a less than rational world<br />
How did you get into studying how individuals make decisions or<br />
choices? Was this a rational decision?<br />
I got into this following my experience of being in hospital for a very long<br />
time. I was badly injured when young. While in hospital, there were a number<br />
of things that I thought were very wrong, and I didn’t like. One was how<br />
the bandages were replaced for burn patients. What is the right approach<br />
for doing this—ripping them fast, or taking them out slowly? What is the<br />
best way to minimize the pain? The nurses said they knew the best approach,<br />
which was to rip them off fast. They followed their intuition. I didn’t<br />
agree that this was the right way. Despite good intentions, the nurses were<br />
wrong about this.<br />
After leaving the hospital, I thought about doing experiments to understand<br />
how we sometimes have bad intuitions. Where do these fail us the<br />
most? What is the right model of human behaviour? I wanted to understand<br />
how people behave, how we make mistakes and also how we can do better.<br />
This was not a “rational” decision. I did not consider all my options and<br />
think about them. I found something I liked to do and felt passionate about.<br />
I jumped right into it without thinking too much and without thinking for too<br />
long.<br />
What have we learned from behavioural economics about how<br />
individuals and groups make decisions? How has this changed how<br />
economists think about decisionmaking? What are the implications in<br />
terms of policies for health, education and well-being?<br />
People, in general, don’t make very thoughtful, rational decisions. For example,<br />
take texting and driving and our general addiction to cellphones. This<br />
is quite irrational. Most of the messages and emails we get do not need<br />
immediate attention.<br />
There is the concept of random reinforcement. A rat gets food every<br />
100th time he presses a lever. If the food is given on any random press<br />
between 1 and 200, the rat will go on pressing for much longer in hope of<br />
a reward. This is why we are addicted to our phones. From time to time we<br />
get an email or message that is very exciting, and hence we are hooked. We<br />
check our phones way too often, including when we are driving.<br />
Take overeating, underexercising, financial decisionmaking, and there<br />
are millions of other places where we fail. In terms of relevant policies, this<br />
is not always an information problem. With smoking, for example, the barrier<br />
is not lack of good information.<br />
A policy is a tool to get people to behave in a different way. If the model<br />
that the policy is based on is wrong, the policy will fail. There are some<br />
assumptions in standard models that have to be questioned. For example,<br />
people do not usually think long term.<br />
And then, with banking regulation there is a need to understand the<br />
model. Bankers are not bad people, but there are conflicts of interest.<br />
Policies are introduced, for example, to increase transparency, but they do<br />
not achieve much. What is needed is a better theory of how people behave,<br />
what the conflicts of interest are and what can be done to bring down these<br />
conflicts of interest.<br />
Being able to lead a long and healthy life, being well informed and<br />
being able to participate and make decisions are the foundations of<br />
well-being in the human development approach. This view holds that<br />
the expansion of individuals’ choices should be the goal of development.<br />
Given what we know from behavioural economics, would you say this<br />
view can be qualified, or nuanced, in some way?<br />
This is a beautiful but naïve perspective. Choices are all good when they<br />
have no cost. Having choices can lead to what has been called the burden<br />
of choice.<br />
We have to ask ourselves: Are we helping people by giving choices? Is<br />
it fair? Do you want to choose when to end your parent’s life, when to pull<br />
life support?<br />
There are tiny choices—where to drink coffee, eat. People have no time<br />
to think about those choices. People take what is easily available. They don’t<br />
make these choices with full agency. There are the middle-range choices,<br />
for example, which camera or stereo system to buy. These are the decisions<br />
where people can make the right choice—given the right information, if<br />
they have the time and they think about it.<br />
Then there are the really huge choices, involving marriage, house, savings,<br />
etc. When people get bad news, say about a health condition, they<br />
“shut down.” Studies show that with people who have prostate cancer, the<br />
course of treatment depends on which doctor they see first. If they see a<br />
surgeon, they have surgery. If they see a different doctor, they have a different<br />
treatment plan, not surgery.<br />
It is with the very small and the very big choices that we have to help<br />
people.<br />
We want to explore how individuals act as part of groups. How much<br />
are individual decisions impacted by social norms, values, stereotypes<br />
and prejudices? How do norms such as those of fairness, cooperation<br />
and honesty come to be, and how are they sustained?<br />
With honesty, we have to think about rationalization. There are different<br />
aspects of honesty. People ask, how dishonest can I be and yet feel good<br />
about myself? This has to do with social norms. In some countries, bribery<br />
is ok. People ask themselves, what is acceptable here? They end up saying,<br />
ok, this is acceptable. If you live in a country where giving a bribe to<br />
a public official is common practice, you tell yourself that this is perfectly<br />
acceptable.<br />
In the United States everyone gets away with illegal downloads. This<br />
is corruption! There is a big social element to it. People know it is illegal.<br />
Because everyone does it, this empties the moral content of it.<br />
90 | HUMAN DEVELOPMENT REPORT <strong>2016</strong>
SPECIAL CONTRIBUTION<br />
How important is self-image, or how we view ourselves, in making<br />
decisions? What are some applications of this and some implications<br />
for policy design?<br />
Experiments show that people are not completely dishonest. People cheat<br />
less than what the theory of rational individuals would suggest. People ask<br />
themselves what they will be comfortable with (not what they can get away<br />
with). There is a range of goodness. People have a self-image, an internal<br />
standard for good behaviour, which is very much a social construct.<br />
Policies that take advantage of the impact of social norms can be very<br />
effective. They had this problem in Bogotá, where people would not stop<br />
at red lights. The city hired mimes (clowns) to stand at intersections and<br />
to make fun of people who wouldn’t stop at traffic signals. People started<br />
behaving better. If you think about it, it was a beautiful intervention. This<br />
underlines the importance of understanding social constructs, changing the<br />
words and terms that people use and to get people to start thinking of themselves<br />
in different ways.<br />
Dan Ariely<br />
James B. Duke Professor of Psychology and Behavioral Economics at Duke University<br />
of social institutions and thus in the range of<br />
social competencies that can promote human<br />
freedoms. 21<br />
What social institutions — family, community,<br />
nongovernmental organizations, neighbourhood<br />
or social clubs, and cooperatives — can<br />
be or do reflects collective capabilities. Such<br />
capabilities enhance human development, particularly<br />
among people who are marginalized<br />
or deprived and whose freedom cannot be enhanced<br />
through the actions of individuals alone.<br />
The collective capabilities of social institutions<br />
are essential in many cases. Every individual<br />
values freedom from hunger, but few<br />
individuals have the capability to achieve this<br />
freedom through their own efforts. Society<br />
must organize resources, technology, expertise,<br />
policies and institutions in a way that enables<br />
individuals to take action to achieve the freedom.<br />
Similarly, people in forced labour may<br />
not escape it without collective capabilities or<br />
the capabilities of institutions.<br />
Groups and coalitions are a means of exercising<br />
collective agency, which is much more<br />
powerful than people exercising individual<br />
agency. Groups to which individuals belong,<br />
including groups that individuals may establish,<br />
can expand individual capabilities and afford<br />
individuals new freedoms. A leading example<br />
is the Grameen Bank experience in Bangladesh,<br />
where groups of destitute women helped empower<br />
individual woman economically and socially,<br />
which individual efforts might not have<br />
achieved. Informal workers in many economies<br />
have organized to demand their rights to better<br />
conditions. Through organization and collective<br />
action since 2002, waste pickers in Buenos<br />
Aires transformed a hazardous activity based<br />
on poor technology into a cooperative system<br />
of urban recycling based on decent work conditions,<br />
appropriate technology and reduced<br />
incidence of child labour. 22<br />
Social values and norms — key<br />
impacts on universalism<br />
Social values and norms influence the parameters<br />
of the freedoms that are enhanced through<br />
human development. Societies may limit the<br />
freedoms that are recognized among individuals<br />
who are, say, women, gay, transgender, with<br />
disabilities or of a particular race or religion<br />
(see chapter 2). For example, a society that expects<br />
women to perform only unpaid care work<br />
explicitly or implicitly discourages girls from<br />
attaining higher education and fulfilling their<br />
full potential.<br />
The norms and values of a society may not support<br />
the most disadvantaged. Prejudice against<br />
some groups is sometimes deeply ingrained in<br />
culture and practice. Women face explicit and<br />
implicit discrimination in school and working<br />
life. 23 This discrimination is found even in environments<br />
that would be expected to reward<br />
merit objectively, such as higher education and<br />
the scientific community. 24 In advanced countries<br />
groups may face discrimination and lack of<br />
opportunities based on race. In the United States<br />
the bias of educators against African American<br />
children has an impact as early as preschool. 25<br />
Bias and prejudice thus play a role in almost all<br />
important aspects of life. What individuals do<br />
and how they act are dictated largely by social<br />
traditions of privilege and subordination.<br />
Society must organize<br />
resources, technology,<br />
expertise, policies<br />
and institutions in<br />
a way that enables<br />
individuals to take<br />
action to achieve<br />
human freedom<br />
Chapter 3 Reaching everyone — analytical and assessment issues | 91
People should have<br />
the liberty of choosing<br />
their identities<br />
Groups are governed by social norms that<br />
also influence the behaviour of individuals and<br />
often shape the freedoms individuals articulate,<br />
particularly agency. The effect on freedom has<br />
been analysed in terms of adaptive preferences,<br />
the mechanism people use to adjust their<br />
preferences according to their circumstances.<br />
The frequently unconscious adaptation of preferences<br />
distorts perceptions of freedom so that<br />
individuals may not notice that their freedom<br />
of choice has been constrained.<br />
The concept of adaptive preferences is especially<br />
applicable to the gender debate. 26 The<br />
deprivation in agency associated with social<br />
norms and culture is evident in the practice<br />
of early marriage, the lack of women’s control<br />
over household resources and the attitudes<br />
that expose women to the risk of gender-based<br />
violence. Almost half the women surveyed<br />
in Africa report agency-related deprivation<br />
in more than one area of their lives. Women<br />
who are educated, who work or who live in<br />
urban areas have more voice and autonomy. In<br />
Africa almost 20 percent of women who live<br />
in rural areas and have no more than a primary<br />
education experience three major deprivations,<br />
compared with 1 percent of women who live in<br />
urban areas and have higher education. 27<br />
Social norms, rules and conventions are not<br />
created in a vacuum. Norms and expected and<br />
accepted behaviour evolve. The circumstances<br />
that may have given rise to particular norms<br />
may change, but the norms themselves may<br />
not. Traditions and norms tend to become<br />
entrenched. Once established, a norm can be<br />
difficult to dislodge. Many anachronistic and<br />
sometimes perverse social norms persist for<br />
generations. Traditions, including dowry from<br />
the families of brides and child marriage, are<br />
maintained by households under social pressure.<br />
Violating a norm can cause psychological discomfort,<br />
financial loss or worse. In these cases<br />
the focus should be how the norms can influence<br />
the effects of healthy policies and the identification<br />
of ways to alter the norms (box 3.3).<br />
Multiple identities — how they<br />
influence agency and well-being<br />
Multiple identities influence an individual’s<br />
agency and well-being (functionings and capabilities):<br />
citizenship, residence, geographic<br />
origin, class, gender, politics, profession, employment,<br />
social commitments and so on. Each<br />
of these groups is associated with a specific<br />
aspect of an individual’s identity. Group affiliations<br />
and identities are more fluid than fixed.<br />
Each person belongs to a number of groups at<br />
one time. People are born into some groups<br />
— a woman, an Asian, lefthandedness. Other<br />
groups may be abandoned, such as religion.<br />
Still others may be joined, such as citizenship.<br />
No single identity can completely define an<br />
individual throughout her or his life.<br />
People have the liberty of choosing their<br />
identities. Individuals have reason to recognize,<br />
value and defend the freedom to choose identities.<br />
Liberty is important and valuable because<br />
all individuals deserve the space to consider the<br />
various facets, nuances and choices associated<br />
with their identity. Liberty is also a precondition<br />
for peaceful coexistence in multiethnic<br />
and multicultural societies.<br />
Three identity issues have implications for<br />
human development. First, the space for multiple<br />
identities is more limited among people<br />
who are marginalized, and those people may<br />
lack the freedom to choose the identity they<br />
BOX 3.3<br />
Strategies for changing social norms<br />
• Rectify mistaken beliefs about what others do or think.<br />
• Use the mechanisms of social pressure.<br />
• Change the symbolic meaning of a social norm.<br />
• Create or exploit conflicts among different norms.<br />
• Change the signalling function of norm compliance.<br />
• Change the incentives for supporting norms among<br />
key actors.<br />
• Send countermessages through appropriate<br />
messengers.<br />
• Adjust how norms interact with laws.<br />
Source: World Bank 2014.<br />
92 | HUMAN DEVELOPMENT REPORT <strong>2016</strong>
value. This absence can be a serious deprivation<br />
in their lives because it limits their agency.<br />
Second, many people favour a single identity<br />
to the disadvantage of all others and deny reasoning<br />
and choice in selecting identities. Much<br />
extremism and hatred can be undermined by<br />
promoting the acceptance of multiple identities<br />
over a single identity, such as ethnicity,<br />
religion or caste. Embracing single identities<br />
may make other groups or identities appear as<br />
rivals or even enemies. It misses all the multiple<br />
identities that may be shared, such as humanity,<br />
parents or neighbours. Multiple identities are<br />
essential to the freedom of agency because they<br />
provide people with the chance to explore different<br />
functionings and capabilities, and they<br />
can ensure autonomy.<br />
Third, identity groups interact and compete<br />
with each other over limited economic<br />
and political resources and power. Groups<br />
often seek to obtain more power at the cost of<br />
other groups. They are often able to become<br />
entrenched in positions of power. The resulting<br />
concentration of economic and political<br />
control within a single group can be difficult to<br />
unravel (see chapter 2). In this process, marginalized<br />
groups experiencing deprivations — such<br />
as indigenous groups, older people and ethnic<br />
minorities — lose out and may become excluded<br />
from progress in human development.<br />
Yet groups have the space to interact and<br />
share their concerns in a participatory democratic<br />
system. They should seek a common<br />
understanding of a fair society through negotiation<br />
and discussion so all people possess<br />
the freedom to explore different identities and<br />
choose their own path. Collective values and<br />
collective aspirations can be fostered through a<br />
collective discourse in which all constituencies<br />
truly and effectively participate.<br />
The interdependence of freedoms<br />
— the inevitability of tradeoffs<br />
According to the human development approach,<br />
all people should be able to lead the<br />
kind of life that they have reason to value.<br />
But the freedom of one person or group may<br />
interfere with the freedom of another person or<br />
group. This can be an unintended outcome or a<br />
deliberate goal. Given the political economy of<br />
societies, there may be attempts by richer and<br />
more powerful groups to restrict the freedom<br />
of others. This is reflected in the affluence bias<br />
of the policy matrix, the way the legal system<br />
functions and the way institutions operate in<br />
many economies. This elite capture represents<br />
an attempt of the rich and the powerful to curb<br />
the opportunities of poor and deprived people.<br />
The human development approach recognizes<br />
that more must be done than merely calling<br />
for the expansion of capabilities and freedoms.<br />
All societies need to make tradeoffs, decide<br />
among the claims of competing groups on finite<br />
resources and establish priorities in a context<br />
of unequal distribution of income and wealth,<br />
voice and participation, inclusion and diversity,<br />
and so on. Following reasoned debate, societies<br />
need to determine the principles for settling<br />
these issues to realize a more just society.<br />
Sustainable development<br />
as social justice<br />
Interdependent freedoms and choices are also<br />
characteristic of intergenerational equity — the<br />
freedoms of future generations in relation to<br />
the freedoms of the present generation. The<br />
2011 <strong>Human</strong> <strong>Development</strong> <strong>Report</strong> defines<br />
sustainable human development as “the expansion<br />
of the substantive freedoms of people<br />
today while making reasonable efforts to<br />
avoid seriously compromising those of future<br />
generations.” 28<br />
This is similar to many conventional notions<br />
of environmental sustainability. But it also<br />
reflects the concept of universalism, which<br />
goes deeper. Universalism argues that the life<br />
experiences of all individuals within and across<br />
generations are equally important. The human<br />
development approach therefore considers<br />
sustainability as a matter of distributional<br />
equity both within and across generations.<br />
<strong>Human</strong> <strong>Development</strong> <strong>Report</strong>s have consistently<br />
advanced this integrated approach to<br />
sustainability.<br />
The human development approach reiterates<br />
that sustainable development is much broader<br />
than the protection of natural resources and<br />
the environment; that environmental degradation<br />
exerts larger, unequal impacts on poor,<br />
marginalized and vulnerable people; and that<br />
climate change affects the people and countries<br />
the most that have least contributed to it. From<br />
Interdependent<br />
freedoms and choices<br />
are also characteristic<br />
of intergenerational<br />
equity<br />
Chapter 3 Reaching everyone — analytical and assessment issues | 93
The more command<br />
women have over<br />
household income,<br />
the more they<br />
participate in the<br />
economy, the more<br />
girls are enrolled in<br />
secondary school and<br />
the larger the benefits<br />
for their families,<br />
their communities<br />
and their countries<br />
a human development perspective, sustainable<br />
development thus embodies social justice.<br />
Gender equality and women’s<br />
empowerment — vital markers<br />
If human development must reach everyone,<br />
gender equality and women’s empowerment<br />
need to be central. When women are allowed<br />
to work in a profession of their choice, when<br />
they have access to financial services and when<br />
they are protected by law from domestic violence,<br />
they are able to lead lives to their full<br />
potential. The more command women have<br />
over household income, the more they participate<br />
in the economy, the more girls are enrolled<br />
in secondary school and the larger the benefits<br />
for their families, their communities and their<br />
countries.<br />
Gender equality and women’s empowerment<br />
need to be addressed in a mainstreamed and integrated<br />
way. Sustainable <strong>Development</strong> Goal 5<br />
covers gender equality and the empowerment<br />
of all women and girls, and it proposes relevant<br />
targets and indicators. But gender equality and<br />
women’s empowerment should not be limited<br />
to a single goal. Gender-focused targets are<br />
also covered by Sustainable <strong>Development</strong> Goal<br />
3 (good health and well-being) and Goal 4<br />
(quality education). These goals and targets<br />
have catalysing effects on achieving the other<br />
Sustainable <strong>Development</strong> Goals.<br />
Gender parity is often mistaken for gender<br />
equality. Gender parity is an equality of numbers.<br />
Gender equality, by contrast, refers to the<br />
social relationship between men and women<br />
and has deeper dimensions. Take the example<br />
of women’s participation in peacebuilding<br />
efforts to end conflicts. At times, female<br />
representatives are invited to negotiations in<br />
order to meet a formal requirement for equal<br />
participation. However, when women are empowered<br />
to be effective participants, they can<br />
have a great impact. 29 In the recently completed<br />
Colombia peace process, one-third of participants<br />
in the negotiations were women. Their<br />
lobbying ensured that those who committed<br />
sexual violence in the conflict would not be<br />
eligible for pardons. The women also advocated<br />
for economic support for women in rural<br />
areas for new development activities. 30 When<br />
women are included in the peace process, there<br />
is a 20 percent increase in the probability of an<br />
agreement lasting at least 2 years and a 35 percent<br />
increase in the probability of an agreement<br />
lasting at least 15 years. 31<br />
Checking whether progress<br />
in human development<br />
reaches everyone —<br />
assessment requirements<br />
Averages are not adequate for determining<br />
whether everyone benefits from progress in<br />
human development; a disaggregated approach<br />
is needed. Nor will a purely quantitative assessment<br />
succeed; qualitative aspects are needed,<br />
too. Data on freedom of agency also need to<br />
be reviewed, particularly on voice and accountability.<br />
Other indicators of human well-being<br />
can provide insights, such as the social progress<br />
index. 32 Finally, good generation and dissemination<br />
of data are important and require<br />
additional in-depth research, experimentation,<br />
consultations and alliance-building among<br />
stakeholders.<br />
The disaggregated perspective<br />
An assessment of whether progress in human<br />
development is reaching everyone requires disaggregated<br />
data by region, gender, rural–urban<br />
location, socioeconomic status, race, ethnicity<br />
and so on. Disaggregated data unmask the averages<br />
and show who has been bypassed, where<br />
they are and why.<br />
<strong>Development</strong> barriers often fall along group<br />
lines. People with certain characteristics, in<br />
certain locations and with certain identities are<br />
more likely to lack access to essential services<br />
and opportunities and are more prone to be<br />
victims of discrimination and other forms of<br />
social exclusion.<br />
To include everyone in progress in human<br />
development, the excluded and marginalized, as<br />
well as the depth of their deprivations, need to<br />
be identified, often through data disaggregated<br />
in National <strong>Human</strong> <strong>Development</strong> <strong>Report</strong>s.<br />
For example, Ethiopia’s 2014 National <strong>Human</strong><br />
<strong>Development</strong> <strong>Report</strong> presented HDI values disaggregated<br />
by region, Mexico’s 2010 National<br />
<strong>Human</strong> <strong>Development</strong> <strong>Report</strong> presented HDI<br />
values disaggregated by indigenous group and<br />
94 | HUMAN DEVELOPMENT REPORT <strong>2016</strong>
Somalia’s 2012 National <strong>Human</strong> <strong>Development</strong><br />
<strong>Report</strong> presented Multidimensional Poverty<br />
Index values disaggregated by area (nomadic,<br />
rural, urban and the like). 33 The 2030 Agenda<br />
stipulates that progress towards achieving the<br />
Sustainable <strong>Development</strong> Goals will depend<br />
on high-quality, accessible, timely and reliable<br />
data disaggregated by income, gender, age, race,<br />
ethnicity, migration status, disability, geographic<br />
location and other characteristics relevant in<br />
national contexts. 34<br />
While there is agreement in principle that<br />
enabling all people to benefit from progress in<br />
human development demands disaggregated<br />
data, there is less clarity about how to ensure<br />
data availability. Which survey instruments<br />
are the most accurate and cost-effective for<br />
collecting these data? And there are questions<br />
about how to gather data that may be culturally<br />
or politically sensitive but extremely important.<br />
Many groups may remain largely invisible in<br />
data because of such sensitivities — for example,<br />
the lesbian, gay, bisexual, transgender and intersex<br />
community. Any group that suffers extreme<br />
discrimination or criminalization may hide<br />
their identity, making the collection of accurate<br />
data nearly impossible. Likewise, data disaggregated<br />
by indigenous population or ethnic group<br />
may be discouraged. Overcoming these cultural<br />
and political barriers to open self-identification<br />
is a great challenge in reaching the most excluded<br />
and marginalized groups.<br />
Data on health, education and other aspects<br />
of well-being are already available in disaggregated<br />
form by gender, age, location and income<br />
decile through household surveys, including<br />
Demographic and Health Surveys, Multiple<br />
Indicator Cluster Surveys and the Living<br />
Standards Measurement Study. 35 More can be<br />
done to increase the frequency of these surveys<br />
and improve their comparability, but using the<br />
disaggregated data that already exist is a start<br />
towards understanding patterns of exclusion.<br />
Investments in national statistical capacities,<br />
more financing to support longer and more detailed<br />
surveys that target the individual rather<br />
than the household and greater use of big data<br />
will be needed to strengthen and extend survey<br />
coverage.<br />
Disaggregated data can also be mobilized<br />
through perception surveys. A 2015 field<br />
survey in Nigeria revealed that people’s perceptions<br />
of threats to security in such areas as<br />
ability to support oneself or losing one’s bank<br />
savings were much more intense in the Federal<br />
Capital Territory than in the South-South region<br />
(figure 3.2). Such information alerts policymakers<br />
to the barriers to a sense of security in<br />
the Federal Capital Territory and to the need to<br />
undertake remedial action. 36<br />
Investments in national<br />
statistical capacities,<br />
more financing<br />
to support longer<br />
and more detailed<br />
surveys that target<br />
the individual rather<br />
than the household<br />
and greater use of big<br />
data will be needed to<br />
strengthen and extend<br />
survey coverage<br />
FIGURE 3.2<br />
People’s perceptions of threats to security were much more intense in Nigeria’s Federal Capital Territory<br />
than in the South-South region<br />
(%)<br />
90<br />
60<br />
30<br />
0<br />
South-South<br />
Federal Capital Territory<br />
Being unable to support oneself<br />
Inability to pay for one’s children’s or one’s own education<br />
Inability to pay one’s rent or other household bills<br />
Losing one’s saving in the bank<br />
Needing to bribe someone in order to obtain a service<br />
Source: UNDP 2015b.<br />
Chapter 3 Reaching everyone — analytical and assessment issues | 95
Disparities in one<br />
area may reinforce<br />
disparities in other<br />
areas and create a<br />
dynamic whereby<br />
people are left further<br />
and further behind in<br />
human development<br />
Determining the types of disaggregation<br />
needed to reveal inequalities along particular dimensions<br />
can be difficult without understanding<br />
the processes of exclusion and marginalization<br />
in a society. It is thus important that decisions<br />
about data collection be rooted in qualitative<br />
and historical research on these processes in<br />
each context. For example, in Mongolia, data<br />
have been disaggregated by disability. In 2010<br />
the share of people ages 10 or older with no<br />
education was three times higher among persons<br />
with disabilities than among the rest of the population,<br />
and persons with disabilities were also<br />
less likely to obtain higher education (8 percent<br />
versus 18 percent of the rest of the population). 37<br />
Disparities in one area may reinforce disparities<br />
in other areas and create a dynamic whereby<br />
people are left further and further behind<br />
in human development. For example, women<br />
are generally disadvantaged relative to men in<br />
obtaining the benefits of human development.<br />
If such women are living in ecologically fragile<br />
areas, they are doubly deprived: because of<br />
their gender and because of their location. The<br />
deprivations may pile up if these women are<br />
also poor. The assessment perspective should<br />
thus address these dynamics and focus first on<br />
those who are furthest behind.<br />
One key dimension of data disaggregation is<br />
gender, yet this dimension is missing or opaque<br />
in most development indicators. The 2030<br />
Agenda, particularly Sustainable <strong>Development</strong><br />
Goal 5, focuses on targets that will require<br />
gender-disaggregated data, including: 38<br />
• Ending all forms of discrimination against all<br />
women and girls everywhere.<br />
• Eliminating all forms of violence against all<br />
women and girls in the public and private<br />
spheres, including trafficking and sexual and<br />
other types of exploitation.<br />
• Eliminating all harmful practices, such as<br />
child, early and forced marriage and female<br />
genital mutilation.<br />
• Recognizing and valuing unpaid care and domestic<br />
work through the provision of public<br />
services.<br />
• Ensuring women’s full and effective participation<br />
and equal opportunities for leadership<br />
at all levels of decisionmaking in political,<br />
economic and public life.<br />
• Ensuring universal access to sexual and reproductive<br />
health and reproductive rights as<br />
agreed in accordance with the Programme<br />
of Action of the International Conference<br />
on Population and <strong>Development</strong> (1994)<br />
and the Beijing Platform for Action (1995)<br />
and the outcome documents of their review<br />
conferences.<br />
Qualitative assessment<br />
Progress in human development has often been<br />
widespread and impressive quantitatively but is<br />
less impressive when the quality of outcomes<br />
is factored in. The differences in quality across<br />
groups can also be stark. In terms of people<br />
and their lives, low quality implies a lack of the<br />
tools necessary to reach one’s full potential and<br />
express all one’s capabilities.<br />
More children are enrolled in and attending<br />
school than ever. But 250 million children<br />
worldwide do not learn basic skills, even though<br />
half of them have spent at least four years in<br />
school. 39 In most countries class size, the number<br />
of qualified teachers and the availability of improved<br />
facilities are more desirable in better-off<br />
neighbourhoods than in poorer neighbourhoods,<br />
leading to wide differences in learning.<br />
International testing has been conducted<br />
since the 1950s to compare cognitive achievement<br />
at various levels of schooling across countries<br />
and to identify the causes of measured<br />
differences (box 3.4). Most of these attempts<br />
to assess the quality of education reflect the<br />
principle that cognitive development is the<br />
main objective of education and thus measure<br />
the success of education systems based on this<br />
concept. Scholastic test scores provide a gauge<br />
of how well the curriculum is learned and of<br />
students’ learning achievements at the main<br />
exit points of school systems.<br />
Global health is also improving. People are<br />
living longer. Global life expectancy at birth<br />
was 4.9 years longer in 2015 than in 2000,<br />
though there were wide variations across regions<br />
and countries. The increase in life expectancy<br />
at birth from 2000 to 2015 was greatest<br />
in Sub- Saharan Africa (8.8 years), followed by<br />
South Asia (5.5 years) and Latin America and<br />
the Caribbean (3.8 years). 40 But are the added<br />
years of life expectancy healthy years or years<br />
characterized by illness and disability? The<br />
notion of healthy life expectancy helps answer<br />
this question (see chapter 2). The increase in<br />
96 | HUMAN DEVELOPMENT REPORT <strong>2016</strong>
BOX 3.4<br />
Test score methods for assessing the quality of education<br />
More than 60 countries and other education systems<br />
participate in the Trends in International Mathematics<br />
and Science Study, which covers mathematics and<br />
science, and 55 education systems took part in the<br />
2011 round of the Progress in International Reading<br />
Literacy Study. 1 In 2015 the Organisation for Economic<br />
Co-operation and <strong>Development</strong>’s Programme for<br />
International Student Assessment (PISA) was conducted<br />
in 72 countries and economies, mainly industrialized<br />
and middle-income countries. Other initiatives include<br />
the 16 country Southern and Eastern African Consortium<br />
for Monitoring Educational Quality and the 15 country<br />
Latin American Laboratory for the Assessment of Quality<br />
in Education.<br />
The question is whether these international tests<br />
provide a useful assessment of the quality of education<br />
outcomes in a country or remain mainly a measure of<br />
how well students have learned a curriculum. PISA is<br />
the only one that uses tests not directly linked to curricula.<br />
National PISA scores are averages and so conceal<br />
variations within a country. PISA and the Latin American<br />
Laboratory assessment provide more detail on distribution,<br />
such as quartiles, and on standard deviations and<br />
scores by parent income quintile.<br />
Note<br />
1. U.S. Department of Education’s Trends in International Mathematics and Science Study website (https://nces.ed.gov/timss/) and Progress in International Reading Literacy<br />
Study website (https://nces.ed.gov/surveys/pirls/).<br />
Source: <strong>Human</strong> <strong>Development</strong> <strong>Report</strong> Office.<br />
healthy life expectancy has not been as dramatic<br />
as the increase in life expectancy, so people<br />
are generally living more years, but those years<br />
are not free from illness and disability. 41<br />
Urban-based health facilities provide better<br />
health services than do rural health centres.<br />
The upshot is that not everyone or every group<br />
enjoys high-quality human development; there<br />
are differences in the quality of the capabilities<br />
achieved and the opportunities available.<br />
Data on freedom of agency<br />
Even though freedom of agency has always<br />
been an integral component of the concept of<br />
human development, the <strong>Human</strong> <strong>Development</strong><br />
<strong>Report</strong> has usually been much more concerned<br />
with well-being than with agency. This is true<br />
of the HDI, which does not accord intrinsic<br />
value — as distinct from instrumental value — to<br />
freedom of agency. The omission is mitigated<br />
to some extent by the Gender Empowerment<br />
Index and related measures, but agency is not<br />
only a gender issue.<br />
One of the problems in assessing freedom<br />
of agency is that it is inherently much more<br />
difficult than well-being to measure. However,<br />
a good deal can be learned about the progress<br />
in achieving freedom of agency (or not) around<br />
the world without precise measurements. This<br />
is particularly relevant to examining who is<br />
being left behind and why and who is likely<br />
to be left behind as a result of ongoing trends.<br />
Groups that suffer absolute and relative deprivations<br />
in outcomes are often also deprived in<br />
voice, participation and process freedoms.<br />
The extent of agency and participation<br />
enjoyed by different groups may change.<br />
Advances in technology, government regimes,<br />
economic structures and legal frameworks may<br />
affect freedom of agency.<br />
There is generally a positive relationship between<br />
well-being (measured by the HDI) and<br />
agency and participation (as measured by the<br />
World Bank’s voice and accountability indicator;<br />
box 3.5). But it is possible for a country to have a<br />
high HDI value and a low score on the voice and<br />
accountability index (figure 3.3). This supports<br />
the notion that the two measures, if not perfectly<br />
correlated, are complementary. In other words,<br />
societies may achieve high average freedom of<br />
well-being but not freedom of agency. If human<br />
development is to reach everyone in its various<br />
aspects, freedom of agency must be enhanced.<br />
An assessment that combines well- being with<br />
agency and participation at the political level<br />
may be a more complete assessment of human<br />
development.<br />
One aspect of freedom of agency is the<br />
extent of women’s agency and the extent to<br />
which women are able to shape decisions that<br />
affect their lives. This is extremely important<br />
from a human development perspective but<br />
difficult to capture quantitatively in all its<br />
An assessment that<br />
combines well-being<br />
with agency and<br />
participation at the<br />
political level may<br />
be a more complete<br />
assessment of human<br />
development<br />
Chapter 3 Reaching everyone — analytical and assessment issues | 97
BOX 3.5<br />
Voice and accountability indicator—the World Bank’s approach<br />
The voice and accountability indicator is one of six aggregate<br />
governance indicators constructed by the World Bank<br />
to capture the dimensions of governance in a country—<br />
voice and accountability, political stability and absence<br />
of violence, government effectiveness, regulatory quality,<br />
rule of law and control of corruption. Each indicator is<br />
based on information from several data sources, ranging<br />
from household and firm surveys to the subjective assessments<br />
of multilateral organizations, nongovernmental<br />
organizations and providers of commercial business information.<br />
The voice and accountability indicator aggregates<br />
data from surveys to capture perceptions of “the extent to<br />
which a country’s citizens are able to participate in selecting<br />
their government, as well as freedom of expression,<br />
freedom of association and a free media.” 1<br />
The individual variables from the various data sources<br />
are rescaled to run from zero to one, with higher values indicating<br />
better outcomes, and the rescaled values are then<br />
used to construct estimates of voice and accountability.<br />
Estimates are available for 214 countries and territories<br />
from 1996 to 2015 in units of a standard normal distribution<br />
ranging from approximately –2.5 to 2.5. Updated annually,<br />
the indicator was first used by the <strong>Human</strong> <strong>Development</strong><br />
<strong>Report</strong> Office in the 2002 <strong>Human</strong> <strong>Development</strong> <strong>Report</strong>. 2<br />
Notes<br />
1. World Bank 2007, p. 262. 2. UNDP 2002.<br />
Source: <strong>Human</strong> <strong>Development</strong> <strong>Report</strong> Office.<br />
FIGURE 3.3<br />
It is possible for a country to have a high <strong>Human</strong> <strong>Development</strong> Index value and a low score on the voice<br />
and accountability index<br />
<strong>Human</strong> <strong>Development</strong> Index, 2015<br />
1.0<br />
0.9<br />
0.8<br />
0.7<br />
0.6<br />
0.5<br />
0.4<br />
0.3<br />
–2.0 –1.0 0<br />
Voice and accountability, 2015<br />
Arab States<br />
East Asia & the Pacific<br />
Europe and Central Asia<br />
Latin America & the Caribbean<br />
OECD<br />
South Asia<br />
Sub-Saharan Africa<br />
1.0 2.0<br />
One dimension<br />
that lends itself to<br />
measurement is<br />
women’s participation<br />
in national political life<br />
and decisionmaking<br />
Source: The World Bank’s Worldwide Governance Indicators website (www.govindicators.org); <strong>Human</strong> <strong>Development</strong> <strong>Report</strong> Office.<br />
dimensions. One dimension that lends itself<br />
to measurement is women’s participation in<br />
national political life and decisionmaking,<br />
which is measured using women’s share of seats<br />
in the national parliament. (This indicator is<br />
included in the Gender Inequality Index.) By<br />
shedding light on a key dimension of women’s<br />
agency, this indicator complements the HDI<br />
and provides a more complete picture of a<br />
nation’s progress.<br />
98 | HUMAN DEVELOPMENT REPORT <strong>2016</strong>
FIGURE 3.4<br />
The trend in nonincome <strong>Human</strong> <strong>Development</strong> Index values and in women’s and men’s shares of seats in<br />
parliament is moving in the desired direction in every region<br />
<strong>Human</strong> <strong>Development</strong> Index, 1997 and 2015<br />
1.0<br />
Arab States<br />
East Asia & the Pacific<br />
Europe and Central Asia<br />
Latin America & the Caribbean<br />
South Asia<br />
Sub-Saharan Africa<br />
0.9<br />
0.8<br />
Female<br />
Male<br />
0.7<br />
0.6<br />
0.5<br />
0.4<br />
0.3<br />
0 25 50<br />
Share of seats in parliament, 1997 and 2015 (%)<br />
75 100<br />
Source: <strong>Human</strong> <strong>Development</strong> <strong>Report</strong> Office.<br />
HDI values can be estimated separately for<br />
women and men by estimating education,<br />
health and income outcomes among women<br />
and men separately. The gender-based differences<br />
in well-being outcomes tend to be more<br />
pronounced in the education and health outcomes.<br />
They are also measured more clearly, are<br />
better understood and reflect more robust data.<br />
So estimates of nonincome HDI values among<br />
women and men are used — that is, HDI values<br />
constructed from the education and health<br />
dimensions alone.<br />
The trend in nonincome HDI values and<br />
in women’s and men’s shares of seats in parliament<br />
is moving in the desired direction in<br />
every region, even if initial points and changes<br />
over time vary (figure 3.4). Yet all regions<br />
have made progress in closing the gap in<br />
representation in parliament between women<br />
and men. Latin America and the Caribbean<br />
has one of the strongest performances, while<br />
East Asia and the Pacific has made little<br />
progress.<br />
Other measures of well-being<br />
Various measures of human well-being have<br />
been proposed and constructed over the years.<br />
In the context of human development reaching<br />
everyone, this section examines whether some<br />
of these measures can provide an assessment<br />
framework for capturing universal well-being.<br />
Social progress index<br />
The social progress index ranks countries by<br />
social progress — how societies improve in social,<br />
political and economic structures so that everyone<br />
benefits. 42 Gains may derive from direct<br />
human action, such as through social enterprise<br />
or social activism, or as a natural progression in<br />
sociocultural evolution. The index measures the<br />
extent to which countries provide for the social<br />
and environmental needs of their citizens. Fiftythree<br />
indicators on basic human needs, the foundations<br />
of well-being and opportunity to progress<br />
show the relative performance of nations.<br />
All regions have made<br />
progress in closing the<br />
gap in representation<br />
in parliament between<br />
women and men<br />
Chapter 3 Reaching everyone — analytical and assessment issues | 99
Various measures<br />
of human well-being<br />
have been proposed<br />
and constructed<br />
over the years<br />
World happiness index<br />
The world happiness index annually surveys numerous<br />
people in various countries around the<br />
world to identify the country with the happiest<br />
population. 43 Rankings are based on responses<br />
to a life evaluation questionnaire that is based<br />
on Cantril’s ladder. It asks respondents to think<br />
of a ladder on which their best possible life<br />
would be step 10, while their worst possible life<br />
would be step 0. Respondents are then asked to<br />
rate their lives at the present moment as a step<br />
on the ladder. The researchers identify the result<br />
as the perception respondents have of their<br />
own happiness. The responses are weighted<br />
based on six other factors: level of gross domestic<br />
product (GDP), life expectancy, generosity,<br />
social support, freedom and corruption.<br />
Better life index<br />
The better life index is a composite index computed<br />
for the 35 Organisation for Economic<br />
Co-operation and <strong>Development</strong> countries<br />
plus Brazil, the Russian Federation and South<br />
Africa. It measures well-being according to 11<br />
themes in living conditions (housing, income<br />
and jobs) and quality of life (community, education,<br />
environment, civic engagement, health,<br />
life satisfaction, safety and work–life balance). 44<br />
It involves citizens in constructing the index, so<br />
people have a say in its value.<br />
Subjective measures of well-being<br />
Some countries support subjective measures of<br />
well-being or happiness. For example, Bhutan has<br />
a gross national happiness index. 45 The United<br />
Kingdom, through the Office for National<br />
Statistics, is one of the first countries to officially<br />
embrace the measurement of life satisfaction and<br />
happiness, with measures of national well-being.<br />
46 Proponents note that a single measure of<br />
happiness, which arguably summarizes people’s<br />
feelings about many aspects of well-being, avoids<br />
the need to weight components. Others note<br />
that an individual’s happiness may also be related<br />
to his or her relative — rather than absolute —<br />
level of well-being in a society, which may hinder<br />
cross-country comparisons. Many people, including<br />
young people, are thinking of a long-term vision<br />
of the future in terms of achieving a life that<br />
can be graded “good” (box 3.6).<br />
<strong>Human</strong> development indicators and<br />
Sustainable <strong>Development</strong> Goal indicators<br />
<strong>Human</strong> development indicators and<br />
Sustainable <strong>Development</strong> Goal indicators may<br />
support each other (figure 3.5). For example,<br />
BOX 3.6<br />
A long-term vision of the future—the Leimers List<br />
In 1967 Martin Luther King, Jr., called for a world perspective.<br />
The young people of HOPE XXL are trying to<br />
answer that call. HOPE XXL wants to ensure that all<br />
people can achieve a life they grade as “good” (at least<br />
a 8 on a scale of 0 to 10).<br />
HOPE XXL started in 2009 in The Netherlands. Ten<br />
young people from the Liemers region developed the first<br />
version of the Liemers List: a long-term vision of the future.<br />
HOPE XXL has since grown into an international movement<br />
with thousands of young people joining and sharing<br />
their ideas. During a series of international events, including<br />
the 2012 European conference with Kofi Annan, the<br />
Liemers List was developed further. The Liemers List was<br />
finalized by young people from all over the world at the<br />
HOPE XXL Global Summit in Costa Rica in January 2015<br />
and presented to the United Nations in February 2015.<br />
HOPE XXL challenges everyone to contribute.<br />
To implement the Liemers List, HOPE XXL has proposed<br />
a new approach to international cooperation<br />
called the People’s Partnership. It is an essential element<br />
in the young people’s vision of the future and a new<br />
approach to international cooperation. In the People’s<br />
Partnership all countries are paired together to realize<br />
the goal of all persons grading their lives as good. HOPE<br />
XXL believes that the number 8 encompasses the greater<br />
goal of the UN Global Goals and is therefore the perfect<br />
symbol to communicate to reach a wider audience.<br />
The first partnership is between Bangladesh and<br />
The Netherlands, and HOPE XXL is focusing on strengthening<br />
the relationship between the two countries.<br />
Source: HOPE XXL 2015.<br />
100 | HUMAN DEVELOPMENT REPORT <strong>2016</strong>
FIGURE 3.5<br />
<strong>Human</strong> development indicators and Sustainable <strong>Development</strong> Goal indicators may support each other—an<br />
example in health<br />
Sustainable <strong>Development</strong><br />
Goal 3—promoting<br />
long and healthy<br />
well-being at all ages<br />
Sustainable <strong>Development</strong> Goal<br />
indicators<br />
Indicator 3.1.1<br />
Maternal mortality ratio<br />
Indicator 3.2.1<br />
Under-five mortality rate<br />
Indicator 3.4.2<br />
Suicide mortality rate<br />
Indicator 3.7.2<br />
Adolescent birth rate<br />
<strong>Human</strong> development indicators<br />
A component of<br />
Gender Inequality Index Table 5<br />
In health outcomes Table 8<br />
In human security Table 12<br />
A component of<br />
Gender Inequality Index Table 5<br />
Data need to be<br />
generated and<br />
disseminated on the<br />
basis of innovative<br />
perspectives to<br />
encourage the<br />
participation of more<br />
people, use of new<br />
technologies and<br />
reliance on more<br />
aspects of people’s<br />
perceptions<br />
Source: <strong>Human</strong> <strong>Development</strong> <strong>Report</strong> Office.<br />
Sustainable <strong>Development</strong> Goal indicator 3.2.1<br />
on the under-five mortality rate can draw on<br />
data in the <strong>Human</strong> <strong>Development</strong> <strong>Report</strong><br />
(see Statistical table 8) and be used to track<br />
progress. Similar examples can be drawn from<br />
such areas as poverty and inequality, education<br />
and gender equality. <strong>Human</strong> development<br />
indicators in the <strong>Human</strong> <strong>Development</strong> <strong>Report</strong><br />
may also identify and integrate Sustainable<br />
<strong>Development</strong> Goal indicators in the <strong>Human</strong><br />
<strong>Development</strong> <strong>Report</strong> statistical tables, particularly<br />
those on sustainability, urbanization and<br />
governance.<br />
New ways to generate and<br />
disseminate data<br />
Data need to be generated and disseminated<br />
on the basis of innovative perspectives — to<br />
encourage the participation of more people,<br />
use of new technologies and reliance on more<br />
aspects of people’s perceptions. In a survey of<br />
existing projects that use new sources of data<br />
and their suitability for measurement of the<br />
Sustainable <strong>Development</strong> Goals, the most<br />
common sources of new data were mobile<br />
phones, satellite imagery and social media<br />
(figure 3.6). 47<br />
FIGURE 3.6<br />
New data sources for Sustainable <strong>Development</strong><br />
Goals<br />
Mobile phone<br />
Satellite imagery<br />
Other social networks<br />
Web<br />
Scanner<br />
Twitter<br />
Financial transactions<br />
Facebook<br />
Sensors<br />
Smart meter<br />
Source: Ballivian 2015.<br />
Number of projects by data source<br />
One issue in the data generation and the<br />
dissemination process is Big Data. Big Data is<br />
about data characterized by high volume, high<br />
velocity, great variety and often also significant<br />
veracity. 48 It is as much associated with how,<br />
where and why it is generated, whether collected<br />
purposely by official or private entities<br />
or as byproducts of data generated for other<br />
5<br />
6<br />
8<br />
11<br />
11<br />
11<br />
12<br />
12<br />
18<br />
20<br />
Chapter 3 Reaching everyone — analytical and assessment issues | 101
A true data revolution<br />
would draw on<br />
existing and new<br />
sources of data to<br />
integrate statistics<br />
into decisionmaking<br />
purposes. Granularity — detail — is a particular<br />
strength, enabling deeper, more nuanced analysis<br />
and tracking, but it is also associated with<br />
elements of risk, particularly pertaining to the<br />
protection of individuals or groups who may<br />
not be aware that they are being monitored.<br />
The World Economic Forum obtained data<br />
from LinkedIn to add granularity to analysis<br />
of tertiary education for its <strong>2016</strong> <strong>Human</strong><br />
Capital <strong>Report</strong>. 49 In the international context<br />
Big Data has wide application in humanitarian<br />
situations and for data on community<br />
behaviour as part of programme and project<br />
implementation.<br />
The UN Secretary-General’s High-Level<br />
Panel on Sustainable <strong>Development</strong> called for<br />
a data revolution for sustainable development<br />
in 2013 through a new international initiative<br />
to improve the quality of statistics and information<br />
available to citizens. 50 It asked stakeholders<br />
to take advantage of new technology,<br />
crowdsourcing and improved connectivity to<br />
empower people with information on the<br />
progress towards the Sustainable <strong>Development</strong><br />
Goal targets. It maintained that better data<br />
and statistics would help governments track<br />
progress and ensure that decisions were based<br />
on evidence. These enhanced data and statistics<br />
can also strengthen accountability. A true data<br />
revolution would draw on existing and new<br />
sources of data to integrate statistics into decisionmaking,<br />
promote open access to and use of<br />
data and ensure increased support for statistical<br />
systems.<br />
Particularly important in the call for a data<br />
revolution is the focus on empowering citizens<br />
through information, including through the<br />
transparency and openness of official statistics<br />
and through government accountability. The<br />
call was also recognition that the trajectory<br />
of progress in internationally available official<br />
statistics was inadequate and needed new momentum,<br />
despite the efforts of the Partnership<br />
in Statistics for <strong>Development</strong> in the 21st<br />
Century and other bilateral, regional and global<br />
initiatives.<br />
A dashboard approach has become a common<br />
approach for measuring development<br />
outcomes. It provides colour-coded tables<br />
that show the levels and progress of humanity<br />
on various development indicators. Such an<br />
approach can be effective in presenting data<br />
on well-being. This edition of the <strong>Human</strong><br />
<strong>Development</strong> <strong>Report</strong> experiments with<br />
two dashboards, one on the environmental,<br />
economic and social aspects of sustainable<br />
development and one on gender equality and<br />
women’s empowerment (see the statistical annex).<br />
A dashboard does not convey a definitive<br />
conclusion on country achievements, merely an<br />
indication. But if useful, dashboards could be<br />
extended to other areas of human development.<br />
* * *<br />
The human development approach recognizes<br />
that the choices people make are the ways in<br />
which they realize their aspirations, though<br />
the claims of individuals are interdependent<br />
and can compete with one another. A practical<br />
realization of universal outcomes thus requires<br />
considering not only the ways choices are made,<br />
but also the ways those choices can be enhanced<br />
not for a few, not for the most, but for<br />
everyone. And that is where policies become<br />
important — a theme taken up in chapter 4.<br />
102 | HUMAN DEVELOPMENT REPORT <strong>2016</strong>
Chapter 4<br />
Caring for those<br />
left out —national<br />
policy options
Infographic 4.1 National policies to care for those left out —<br />
a four-pronged strategy<br />
Addressing<br />
lifecycle<br />
capabilities<br />
Enhancing<br />
opportunities<br />
for women<br />
Reaching those left out using universal policies<br />
Pursuing<br />
inclusive<br />
growth<br />
Pursuing measures for<br />
groups with special needs<br />
Using<br />
affirmative<br />
action<br />
Promoting<br />
human<br />
development for<br />
marginalized<br />
groups<br />
Upholding<br />
human<br />
rights<br />
Mobilizing<br />
resources<br />
for human<br />
development<br />
priorities<br />
Promoting<br />
social<br />
protection<br />
Caring for those<br />
left out—national<br />
policy options<br />
Ensuring<br />
access<br />
to justice<br />
Promoting<br />
inclusion<br />
Empowering those left out<br />
Addressing<br />
epidemics,<br />
shocks and<br />
risks<br />
Combating<br />
violence and<br />
ensuring people’s<br />
security<br />
Making human development resilient<br />
Maintaining<br />
human well-being<br />
in postconflict<br />
situations<br />
Addressing<br />
climate<br />
change<br />
Ensuring<br />
accountability
<strong>Human</strong> <strong>Development</strong><br />
4.<br />
<strong>Report</strong> <strong>2016</strong><br />
<strong>Human</strong> <strong>Development</strong> for Everyone<br />
Caring for those left out —<br />
national policy options<br />
Basic human development has progressed well on average in all regions of the world. But not everyone has benefited from<br />
this progress—at least not equitably. Some have been left out, and some have been left behind. Given the challenges<br />
of today’s world, this chapter identifies the key national policies and strategies that need to be pursued to achieve basic<br />
human development for everyone and to protect the gains that have been made.<br />
Ensuring that human development reaches<br />
everyone calls for a four-pronged policy<br />
approach (see infographic 4.1 on the facing<br />
page). First, universal policies are needed to<br />
reach those left out. There are three important<br />
aspects of universal policies. One, universalism<br />
is an idea, but as chapter 2 shows, practical<br />
universalism is another matter, particularly in<br />
policy areas. For example, a country may be<br />
committed to universal health care, but difficult<br />
geography may prevent it from establishing<br />
health care centres that are accessible to all<br />
localities. Two, even with universal outcomes,<br />
there may be disparities. For instance, a country<br />
may attain universal primary education,<br />
but the quality of learning may vary between<br />
schools in rich neighbourhoods and schools in<br />
poor neighbourhoods. Three, because of these<br />
factors, universal human development policies<br />
need to be reoriented to reach those left out.<br />
Thus, economic growth is an important means<br />
to achieve human development, but if the<br />
benefits of growth are to reach disadvantaged<br />
and marginalized people, growth will have to<br />
be inclusive such that poor and disadvantaged<br />
people actively participate in the generation<br />
of growth and have an equitable share in the<br />
outcome.<br />
Second, even with the new focus on universal<br />
policies, some groups of people have special<br />
needs that would not be met (see chapter 2).<br />
Their situations require specific measures and<br />
attention. For example, persons with disabilities<br />
require measures to ensure their mobility,<br />
participation and work opportunities.<br />
Third, human development achieved does<br />
not mean human development sustained.<br />
Particularly in today’s world, with all the risks<br />
and vulnerabilities (see chapter 1), progress in<br />
human development may be slowed or even<br />
reversed. This makes it essential to protect the<br />
gains and avoid reversal, especially for people<br />
who have achieved only the basics in human<br />
development and for people who have yet<br />
to achieve the basics. The first group could<br />
fall back below the threshold of basic human<br />
development, and the second might make no<br />
headway towards reaching it. Thus human<br />
development has to be resilient.<br />
Fourth, people who have been left out will<br />
have to be empowered so that if policies and<br />
the relevant actors fail to deliver, these people<br />
can raise their voice, demand their rights and<br />
seek to redress the situation. That requires<br />
a framework for human rights and access to<br />
justice, a space for dialogue and effective participation,<br />
and a mechanism for demanding<br />
accountability.<br />
Reaching those left out<br />
using universal policies<br />
Some policies that enhance human development,<br />
especially universal ones, can have more<br />
than proportionally positive impacts on marginalized<br />
and vulnerable people. Identifying<br />
and reorienting these policies can narrow<br />
the human development deficits of those left<br />
out. Essential in this are pursuing inclusive<br />
growth, enhancing opportunities for women,<br />
addressing lifecycle capabilities and mobilizing<br />
resources for human development priorities<br />
— because universal policies are resource<br />
intensive.<br />
Pursuing inclusive growth<br />
For human development to reach everyone,<br />
growth has to be inclusive. This means that<br />
Some policies that<br />
enhance human<br />
development,<br />
especially universal<br />
ones, can have more<br />
than proportionally<br />
positive impacts on<br />
marginalized and<br />
vulnerable people<br />
Chapter 4 Caring for those left out — national policy options | 105
Lack of access to<br />
finance has been<br />
identified as a<br />
major constraint<br />
to an inclusive<br />
growth process<br />
people who are willing and able to participate<br />
in the growth process must be able to do so and<br />
to derive equitable benefits. Inclusive growth<br />
has four mutually supporting pillars: formulating<br />
an employment-led growth strategy with<br />
an emphasis on creating productive and remunerative<br />
employment opportunities in sectors<br />
where poor people live and work; enhancing<br />
inclusion in productive resources, especially<br />
finance; investing in human development<br />
priorities relevant to those who are left out;<br />
undertaking high-impact multidimensional<br />
interventions (win-win strategies).<br />
Formulating an employment-led growth<br />
strategy<br />
The major elements of an employment-led<br />
growth strategy are:<br />
• Removing barriers to employment-centred<br />
development. For example, small- and medium-size<br />
enterprises often face bias in market<br />
entry and access to credit, and entrepreneurs<br />
may lack access to information and marketing<br />
skills. Removing these barriers requires<br />
multiple levels of support to improve the<br />
productivity and income of such enterprises.<br />
• Designing and implementing a conducive legal<br />
and regulatory framework to tackle informal<br />
work. Informal workers are among the most<br />
vulnerable and insecure, and a regulatory<br />
framework can provide protection, which<br />
increases security and incentives to enhance<br />
productivity and value added.<br />
• Strengthening the links between large firms<br />
(typically capital intensive) and small and medium-size<br />
enterprises (typically labour intensive).<br />
Industrial clusters supported by public<br />
investment can increase access to capital and<br />
technology and promote transfers of skills.<br />
Those actions can shift resources to sectors<br />
with greater potential for creating jobs and<br />
adding value.<br />
• Focusing on sectors where poor people live and<br />
work, especially in rural areas. Policy measures<br />
to sustain and generate jobs in agriculture<br />
can improve productivity (without displacing<br />
jobs) through intensive cultivation, regular<br />
changes in cropping patterns, integrated<br />
input packages and better marketing. As the<br />
2015 <strong>Human</strong> <strong>Development</strong> <strong>Report</strong> indicated,<br />
low-cost, sustainable technologies are<br />
available in agriculture and can be transferred<br />
to and adapted in various economies through<br />
collaboration across developing countries. 1<br />
• Adjusting the distribution of capital and labour<br />
in public spending to create jobs. Public<br />
spending can support job creation by favouring<br />
technologies and sectors that enhance<br />
human development. It can also have a<br />
demonstration effect, signalling to the rest<br />
of the economy the many ways of using more<br />
labour-intensive technologies.<br />
Securing decent work opportunities and<br />
better jobs for all people around the world with<br />
the notion of just jobs — those with fair remuneration,<br />
rights at work and opportunities for<br />
economic mobility — is the main feature of the<br />
Global Deal launched in September <strong>2016</strong> (box<br />
4.1). 2<br />
Enhancing financial inclusion<br />
People who are left out lack access to productive<br />
resources, including land, inputs and<br />
technology. But lack of access to finance has<br />
been identified as a major constraint to their<br />
economic opportunities and to becoming a<br />
part of the inclusive growth process. From<br />
2011 to 2014, 700 million additional people<br />
worldwide became bank account holders, yet<br />
2 billion people are still unbanked. 3 Financial<br />
services can be a bridge out of poverty and<br />
vulnerability. Several measures can enhance the<br />
financial inclusion of the poor.<br />
• Expanding banking services to disadvantaged<br />
and marginalized groups. Opening bank<br />
branches in rural areas, offering easy banking<br />
services, using group solidarity as collateral<br />
(as with the Grameen Bank in Bangladesh)<br />
and having simple procedures that can be<br />
followed by people with low literacy can all<br />
reach people now unbanked. The former<br />
Yugoslav Republic of Macedonia has a model<br />
for others to emulate (box 4.2).<br />
• Steering credit towards unserved remote areas<br />
and sectors. Investment banks in Argentina,<br />
Brazil, Malaysia and the Republic of Korea<br />
have directed credit to industrial sectors specializing<br />
in exports. 4<br />
• Reducing interest rates and providing credit<br />
guarantees and subsidized credit to small and<br />
medium-size enterprises. In Nigeria an agricultural<br />
lending facility provided incentives<br />
106 | HUMAN DEVELOPMENT REPORT <strong>2016</strong>
BOX 4.1<br />
The Global Deal — a triple-win strategy<br />
Decent work and good labour relations contribute to greater<br />
equality and more inclusive economic development,<br />
benefiting workers, companies and societies (a triple<br />
win). The Global Deal — initiated by the Prime Minister of<br />
Sweden and designed with the Organisation for Economic<br />
Co-operation and <strong>Development</strong> and the International<br />
Labour Organization — aims to enhance dialogue among<br />
like-minded national governments, companies, employer<br />
associations, trade unions and broader civil society to improve<br />
employment conditions and boost productivity.<br />
It aims to develop a platform for parties to collaborate<br />
and to strengthen existing cooperation structures.<br />
It will build on established initiatives and projects,<br />
providing political direction and impetus to overall<br />
development and systematizing and scaling up existing<br />
processes. The expectation is that it will contribute<br />
to inclusive growth, reduce inequalities and become a<br />
step towards achieving the Sustainable <strong>Development</strong><br />
Goals and the ultimate goal of eradicating extreme<br />
poverty.<br />
Source: Dewan and Randolph <strong>2016</strong>; Global Citizen <strong>2016</strong>.<br />
BOX 4.2<br />
Providing finance to rural farmers in the former Yugoslav Republic of Macedonia<br />
Two-thirds of the poor people in the former Yugoslav<br />
Republic of Macedonia, mostly subsistence farmers,<br />
unemployed people and pensioners, live in rural areas,<br />
where they lack the finance for investment and rural financial<br />
and technical services.<br />
A 2008 Agricultural Financial Services Project that<br />
was aligned with the country’s rural development policy<br />
concentrated on two basic services. In one, groups<br />
of clients were formed, their financial literacy was<br />
enhanced and the technical and managerial skills of<br />
service providers were improved. In the other, only agricultural<br />
financial services and technical support were<br />
provided through agricultural investments.<br />
In a simple but focused approach, the project provided<br />
2,745 loans, lifting the average participant household’s<br />
annual business income from €5,166 to €8,050 in<br />
two years. Project-linked branches offering credit and<br />
credit officers expanded fivefold. 1<br />
Note<br />
1. IFAD 2009, <strong>2016</strong>.<br />
Source: <strong>Human</strong> <strong>Development</strong> <strong>Report</strong> Office.<br />
to banks to allocate a large share of their<br />
credit to agribusiness, particularly small<br />
entrepreneurs. Such loans accounted for<br />
1 percent of total bank loans in 2010 and are<br />
expected to reach 10 percent by 2020. 5<br />
• Harnessing modern technology to promote<br />
financial inclusion. In Africa 12 percent of<br />
adults have mobile bank accounts, compared<br />
with 2 percent globally. 6 Kenya leads the<br />
way at 58 percent, followed by Somalia, the<br />
United Republic of Tanzania and Uganda<br />
at 35 percent. 7 M-Pesa in Kenya is a prime<br />
example of how mobile phone technology<br />
can reach the unbanked. BKash, a mobile<br />
banking system in Bangladesh, has changed<br />
the way poor people transfer money, including<br />
remittances by garment workers, bill payments<br />
and the purchase of daily necessities.<br />
Investing in human development<br />
priorities<br />
In 2014 public expenditure as a percentage<br />
of such basic social services as health care was<br />
3 percent in developing countries; the share in<br />
education was 4.7 percent between 2005 and<br />
2014. 8 Yet a major part of this expenditure may<br />
not reach those who need the services the most.<br />
Most disadvantaged and marginalized groups<br />
lack universal primary education, universal<br />
health care, improved sanitation and decent<br />
housing. But simply increasing social spending<br />
is not enough because in many instances such<br />
spending goes for modern health facilities for<br />
well-off groups in urban areas rather than to<br />
mother and child care centres in rural areas.<br />
Focused investments in human development<br />
Financial services<br />
can be a bridge<br />
out of poverty and<br />
vulnerability<br />
Chapter 4 Caring for those left out — national policy options | 107
Focused investments<br />
in human development<br />
priorities can deliver<br />
high-quality services<br />
to disadvantaged and<br />
marginalized groups<br />
priorities can produce human development<br />
benefits by delivering services along with infrastructure,<br />
thereby directing high-quality services<br />
to disadvantaged and marginalized groups<br />
(figure 4.1).<br />
Investing in human priorities is intended to<br />
reach those who lack basic social services such<br />
as education and health care that are essential<br />
for enhancing human capital so that these<br />
people can not only be part of inclusive growth,<br />
but also enhance their capabilities, which are<br />
intrinsically valuable.<br />
But there are four relevant policy considerations.<br />
First, the mere availability of services<br />
or access to them is not enough; the effective<br />
use of services also requires affordability and<br />
adaptability. Low-cost but good services are<br />
possible and can be affordable for poor people.<br />
In Nicaragua compact ultrasound machines<br />
that can be carried on bicycles are being used<br />
to monitor the health of pregnant women,<br />
improving antenatal care at relatively low cost. 9<br />
Similarly, services must be sensitive to the cultural<br />
and social norms of the contexts in which<br />
they are provided. For example, the presence<br />
of only male doctors in rural mother and child<br />
care centres would be a disincentive for women<br />
and girls to use the centres.<br />
Second, mere provisioning of services without<br />
considering quality is detrimental to poor<br />
people. Many services in poor areas are low<br />
quality — partly because of the perception that<br />
poor people do not want to pay for high- quality<br />
services and partly because of the perception<br />
that it is enough that poor people have some<br />
services, regardless of the quality. The result:<br />
Most high-quality services are enjoyed by the<br />
affluent. But poor people are usually ready to<br />
pay for high-quality and affordable services. In<br />
2004 poor parents in Chad paid for schooling<br />
both in cash ($2 is the average annual contribution)<br />
and in kind (volunteering at community<br />
or government schools). 10 Parents also covered<br />
the cost of books and other supplies.<br />
High-quality services can indeed be provided<br />
to poor people, as in Burkina Faso. The Office<br />
National de l’Eau et de l’Assainissement (the<br />
National Office of Water and Sanitation),<br />
the utility in charge of water and wastewater<br />
services in the capital, Ouagadougou, and<br />
other urban areas, provides piped water only<br />
to formal settlements. 11 But about 16 percent<br />
FIGURE 4.1<br />
Investments in priority human development to ensure human development for everyone<br />
Public expenditure ratio<br />
Government share of GNP<br />
Social allocation ratio<br />
Social services share of<br />
government spending<br />
Social priority ratio<br />
<strong>Human</strong> priority share of<br />
social sector spending<br />
<strong>Human</strong> expenditure ratio<br />
<strong>Human</strong> priority share of GNP<br />
The human expenditure ratio is the product of three ratios:<br />
E/Y = public expenditure as a<br />
proportion of national income<br />
S/E = the proportion of public<br />
expenditure going to the social<br />
sector—the social allocation ratio<br />
P/S = the proportion of expenditure<br />
in the social sectors going to human<br />
development priorities—the social<br />
priority ratio<br />
Put differently, the human<br />
expenditure ratio is E/Y x S/E x P/S<br />
Source: <strong>Human</strong> <strong>Development</strong> <strong>Report</strong> Office based on UNDP (1991).<br />
108 | HUMAN DEVELOPMENT REPORT <strong>2016</strong>
of Ouagadougou’s nearly 2 million inhabitants<br />
live in informal settlements, which are beyond<br />
the utility’s mandate. 12 To skirt this problem,<br />
the utility designed five-year concession contracts<br />
for private firms to build and operate<br />
water networks in five informal settlements,<br />
beginning in 2013. 13 The utility sells bulk water<br />
to the operators and regulates the tariffs. The<br />
model has been so successful that the utility<br />
added two more concessions in Ouagadougou<br />
and three in Houndé in 2015. Another should<br />
be ready by the end of <strong>2016</strong> in Bobo-Dioulasso.<br />
Third, nongovernmental organizations have<br />
become major actors in many countries by<br />
providing such basic social services as health<br />
care, education and safe drinking water.<br />
The BRAC nonformal education system in<br />
Bangladesh is a prime example. 14 Following an<br />
innovative curriculum but providing education<br />
in a cost- effective way has boosted both school<br />
attendance and retention. Two major measures<br />
that BRAC schools have initiated are separate<br />
toilets and two free sets of school uniforms<br />
for girls. These measures have contributed immensely<br />
to the education of girls in Bangladesh.<br />
BRAC also leads in providing basic social services,<br />
particularly in conflict and post conflict<br />
countries such as Afghanistan. 15 In many countries<br />
nongovernmental organizations and foundations<br />
(for instance, the Bill & Melinda Gates<br />
Foundation) are working with governments<br />
and other agencies on immunization drives for<br />
children. 16 Public– private partnerships and alliances<br />
may thus be an effective mechanism for<br />
providing services.<br />
Fourth, innovative services rarely include<br />
poor people, even though poor people often<br />
need these services the most. As the UN<br />
Secretary-General’s High-Level Panel on Access<br />
to Medicines highlighted, medical innovations<br />
have saved and improved millions of lives<br />
around the world, but access to them is highly<br />
unequal. Vulnerable groups are prevented from<br />
fully benefiting from the innovations because<br />
of multiple factors, including limited resources,<br />
stigma, discrimination, poor health education,<br />
unavailability of health insurance, regulatory<br />
barriers and exclusive marketing rights. 17<br />
One stark example: The international nongovernmental<br />
organization Médecins Sans<br />
Frontières validated new tests for tuberculosis<br />
to be used in low-income, humanitarian<br />
settings. 18 Yet the cost was too high for affected<br />
developing countries, which obtained the tests<br />
only after a dedicated public–private partnership<br />
was created. Economic and political<br />
choices around the funding and support of<br />
innovations often result in such barriers to access.<br />
Identifying gaps in the protection of target<br />
populations, determining the best new ways to<br />
address persistent challenges and providing<br />
evidence of the efficiency of the new methods<br />
may convince decisionmakers to scale up innovations<br />
and ensure inclusiveness. 19<br />
Since 2000, governments around the world<br />
have increasingly used the Internet to engage<br />
with their populations, publishing official documents<br />
and data on websites, allowing citizens<br />
to undertake administrative procedures online<br />
and sometimes inviting them to provide feedback<br />
or even participate in political decisionmaking<br />
(box 4.3). 20 But with a digital divide<br />
and without a digital dividend, few marginal<br />
and vulnerable groups can take advantage of<br />
these services.<br />
Undertaking high-impact multidimensional<br />
interventions — win-win strategies<br />
Universal human development could be accelerated<br />
if some multidimensional high-impact<br />
interventions are pursued. Measures such as<br />
providing school meals, redistributing assets<br />
and prioritizing local actions are a crucial part<br />
of the answer because such interventions have<br />
strong and multiple impacts; they are win-win<br />
strategies.<br />
Universal human<br />
development could be<br />
accelerated if some<br />
multidimensional highimpact<br />
interventions<br />
are pursued<br />
Providing school meals. School meal programmes<br />
provide multiple benefits: social<br />
protection by helping families educate their<br />
children and protect their children’s food security<br />
in times of crisis; nutrition, because in<br />
poor countries school meals are often the only<br />
regular and nutritious meal a child receives; education,<br />
because a daily school meal provides a<br />
strong incentive to send children to school and<br />
keep them there; and a boost to local agriculture,<br />
because food is often bought locally, benefiting<br />
local farmers. Evidence from Botswana,<br />
Cabo Verde, Côte d’Ivoire, Ghana, Kenya,<br />
Mali, Namibia, Nigeria and South Africa bears<br />
testimony to all the benefits of school feeding<br />
programmes. 21 Chapter 4 Caring for those left out — national policy options | 109
BOX 4.3<br />
E-governance<br />
Digital identification systems, a new area of development<br />
for civil participation, have great potential. They<br />
have increased the efficiency of public services in<br />
Belgium, Estonia, Finland, France, the Republic of Korea<br />
and Singapore, where citizens can pay taxes or request<br />
official documents online. 1 In developing countries digital<br />
identification can expand civil registration systems.<br />
Nigeria piloted a new voter authentication system in the<br />
2015 elections, using fingerprint-encoded cards to avoid<br />
duplicate votes. 2<br />
E-government can reduce costs and expand reach to<br />
even the most secluded areas of a country, as long as the<br />
Internet is accessible. In 2000 the United States launched<br />
the government’s official web portal to provide information<br />
and services to the public. Today 159 governments<br />
publish information online on finance, 151 on health, 146<br />
on education, 132 on labour, 130 on the environment and<br />
123 on social welfare. 3 Another rapidly developing area<br />
is open government data — freely accessible on websites<br />
with raw data, giving people the opportunity to follow<br />
their government’s results and to hold it accountable.<br />
Notes<br />
1. World Bank <strong>2016</strong>p. 2. World Bank <strong>2016</strong>p. 3. UNDESA 2014a.<br />
Source: <strong>Human</strong> <strong>Development</strong> <strong>Report</strong> Office.<br />
Differences in<br />
educational attainment<br />
prevent poor people<br />
from becoming part of<br />
the high-productivity<br />
growth process<br />
Rural infrastructure, especially roads and<br />
electricity, is another area. Building rural roads<br />
reduces transport costs, connects rural farmers<br />
to markets, allows workers to move more freely<br />
and promotes access to schools and health care<br />
clinics. More than 1 billion people worldwide<br />
lack electricity. 22 Electrification in rural communities<br />
in Guatemala and South Africa has helped<br />
increase employment among marginalized<br />
groups. 23 Low-cost options such as mini-grids<br />
have been successful in Kenya (green mini-grid),<br />
Senegal (smaller community projects) and the<br />
United Republic of Tanzania (good consumer<br />
tariff ) and can be easily replicated elsewhere. 24<br />
Mini-grids — often supplied by hybrid generation<br />
systems and incorporating smart technologies —<br />
are also connecting rural households.<br />
Cost-effective nutritional interventions<br />
can address deficiencies in iodine and<br />
micronutrients — deficiencies common among<br />
disadvantaged and marginalized groups. 25<br />
Adding iodine to salt, removing taxes on micronutrients<br />
and fortifying staples and condiments<br />
have improved the nutrition status of poor people.<br />
26 Such easy low-cost interventions can be<br />
readily scaled up and replicated elsewhere.<br />
Redistributing assets. Redistributive policies<br />
are often framed as reducing inequalities in<br />
outcomes (such as income) or providing social<br />
protection (as in cash transfers). But redistributing<br />
assets can also bring those left out into the<br />
growth process. For example, land reform has<br />
been advocated as a prerequisite for levelling<br />
the playing field so that growth is equitable. But<br />
customary laws for property tenure are still the<br />
norm in many societies. Such laws cover more<br />
than 75 percent of the land in most African<br />
countries and deprive women in particular. 27<br />
Appropriate land legislation can be formulated<br />
to supersede customary laws.<br />
<strong>Human</strong> capital is an asset, and differences in<br />
educational attainment, one aspect of this asset,<br />
prevent poor people from becoming part of the<br />
high-productivity growth process. And the outcome<br />
of that difference becomes stark in tertiary<br />
education. In the United States in 2015 the median<br />
weekly income of a person with a master’s<br />
degree was $1,341, but that of a person with<br />
only a high school diploma was roughly half<br />
that, at $678. 28 (The 2015 <strong>Human</strong> <strong>Development</strong><br />
<strong>Report</strong> called for democratizing tertiary education<br />
both nationally and globally.) 29<br />
Subsidizing inputs for poor people enhances<br />
their productivity and contributes to the<br />
growth process. For example, subsidizing green<br />
energy would be both poverty reducing and environment<br />
friendly. Bangladesh’s central bank<br />
has financed environmentally sustainable initiatives<br />
through a low-cost refinancing window. 30<br />
Jordan and Morocco have followed suit.<br />
Prioritizing local actions. Local approaches can<br />
limit conflict, protect minority rights, improve<br />
service delivery and be more responsive to local<br />
needs and citizen preferences.<br />
110 | HUMAN DEVELOPMENT REPORT <strong>2016</strong>
Providing autonomy to local governments<br />
in formulating and implementating local<br />
development plans allows plans to reflect the<br />
aspirations of local communities. Fiscal decentralization<br />
can also empower local governments<br />
to collect their own revenues and depend less<br />
on central government grants, under a formula<br />
for revenue generation between the central<br />
government and local governments. In Latin<br />
America decentralization increased local government<br />
spending from 20 percent of total government<br />
spending in 1985 to about 30 percent<br />
in 2010. 31 But the share of own-source revenue<br />
remained unchanged, at about 10 percent of<br />
the national total, making local government<br />
finances more vulnerable and less predictable,<br />
undermining long-term planning. Indonesia’s<br />
big bang decentralizations provide resources to<br />
meet local needs (box 4.4).<br />
But if the local approach is to ensure human<br />
development for those left out, it will also require<br />
people’s participation and greater local<br />
administrative capacity. A transparent and<br />
accountable mechanism should be in place to<br />
monitor human development outcomes. With<br />
community involvement and support from the<br />
central government and other development<br />
partners, local approaches can contribute much<br />
to human development in the poorest areas,<br />
as in Moldova (box 4.5). 32 The participatory<br />
model has worked so well that 70 towns and<br />
communities have adopted it, and 350,000<br />
Moldovans are involved in improving local<br />
development.<br />
Enhancing opportunities for women<br />
Creating opportunities for women requires<br />
ensuring women’s empowerment in the economic,<br />
political and cultural spheres (figure<br />
4.2). Investing in girls and women has multidimensional<br />
benefits — for example, if all girls<br />
in developing countries completed secondary<br />
education, the under-five mortality rate would<br />
be halved. 33<br />
As more girls finish primary and secondary<br />
education, they can carry on to higher education,<br />
enabling them to do the work of the<br />
future and move up the career ladder. But more<br />
women should be in science, technology, engineering<br />
and mathematics, where much future<br />
demand for high-level work will be. Only onefifth<br />
of countries had achieved gender parity<br />
in research by 2015, meaning that 45–55 percent<br />
of researchers were women. 34 Increasing<br />
women’s enrolment in tertiary education and<br />
in science, technology, engineering and mathematics<br />
requires such incentives as scholarships,<br />
admission quotas and internships with research<br />
institutions and technology firms.<br />
Local approaches can<br />
contribute much to<br />
human development<br />
in the poorest areas<br />
BOX 4.4<br />
Fiscal decentralization in Indonesia — improving service delivery<br />
Starting in 2000, when devolution to cities and districts<br />
became a focus of government reforms, decentralization<br />
was especially strong on the expenditure side in<br />
Indonesia. Subnational governments now manage almost<br />
a third of total public spending and about half of<br />
development outlays. Local governments are obliged to<br />
provide health care, education, and environmental and<br />
infrastructure services. Some of the major steps of the<br />
reforms:<br />
• Local governments were given budget autonomy.<br />
The next higher administrative level was mandated<br />
to review legality. Law 32/2004 expanded higher-level<br />
oversight of local budgeting.<br />
• Local and provincial assemblies are now elected<br />
every five years.<br />
• Provincial governors and local mayors have been<br />
directly elected since 2005.<br />
• The Public Information Disclosure Act, passed in<br />
2008, promised better access to public information<br />
as well as more transparency.<br />
• Citizens provide input into local government planning,<br />
and there are mechanisms for providing<br />
small-scale community services.<br />
The positive outcomes of the reforms include a<br />
substantial increase in local public spending on services<br />
and better service delivery in some sectors. But there<br />
have been issues with spending efficiency in some areas,<br />
as well as disputes over the extent of gains. And<br />
more attention has to be paid to developing effective<br />
local accountability mechanisms.<br />
Source: Smoke 2015.<br />
Chapter 4 Caring for those left out — national policy options | 111
BOX 4.5<br />
How local government makes a difference in Moldova<br />
Telenesti, a town of 9,000, was once one of Moldova’s<br />
poorest. For 20 years basic water, sewerage and garbage<br />
services were a rare luxury for most people. Then<br />
Telenesti’s municipal government teamed with local<br />
residents to improve basic services under a national<br />
participatory initiative.<br />
A long-standing problem was that local governments<br />
had little experience in guiding local development.<br />
Under socialism they depended on the distant<br />
central government for direction. So more than 10,000<br />
local officials — 80 percent of the national total — were<br />
trained in how to engage with community members and<br />
better manage public services.<br />
Telenesti has since renovated its water network,<br />
added street lighting and built new roads. It became the<br />
first town in the country to provide all residents with<br />
access to a sewerage system.<br />
Source: UNDP 2013a.<br />
FIGURE 4.2<br />
Factors that enable or constrain women’s empowerment—six direct and four underlying factors<br />
Labour market characteristics<br />
Access to property,<br />
assets and financial<br />
services<br />
Gender norms and discriminatory social norms<br />
Education skills<br />
development and<br />
training<br />
Social<br />
protection<br />
Women’s economic<br />
empowerment<br />
Collective action<br />
and leadership<br />
Investing in girls<br />
and women brings<br />
multidimensional<br />
benefits — for example,<br />
if all girls in developing<br />
countries were to<br />
complete secondary<br />
education, the<br />
under-five mortality<br />
rate would be halved<br />
Fiscal policy<br />
Source: Hunt and Samman <strong>2016</strong>.<br />
Address unpaid<br />
care and work<br />
burdens<br />
Women also have to juggle paid employment<br />
outside the home and unpaid care work inside<br />
the home as well as balance their productive<br />
and reproductive roles. Reserving jobs for<br />
women on maternity leave for up to a year<br />
and flexible working arrangements, including<br />
Access to<br />
quality, decent<br />
paid work<br />
Legal, regulatory and policy framework<br />
telecommuting, can allow women to return to<br />
work after giving birth. Women could also be<br />
offered salary increases to return to work.<br />
Reducing the burden of unpaid care work<br />
among women can also give women more<br />
choices. Enlarging care options, including day<br />
112 | HUMAN DEVELOPMENT REPORT <strong>2016</strong>
care centres, afterschool programmes, homes for<br />
senior citizens and long-term care facilities could<br />
help. Another option is to subsidize unpaid care<br />
work through vouchers or credits. Improved access<br />
to clean water and sanitation, energy services<br />
and public infrastructure, including transport,<br />
can greatly reduce the burden of unpaid care<br />
work, leaving more time for paid work, if women<br />
choose to pursue it. Parental leave for mothers<br />
and fathers can balance the distribution of<br />
unpaid care work and reduce wage gaps in paid<br />
work when fathers are included and have incentives<br />
to use it. A more equitable distribution of<br />
reproductive roles between mothers and fathers<br />
would also benefit men, who often miss out on<br />
important family time with their children.<br />
Encouraging and supporting female<br />
entrepreneurs<br />
Measures to encourage women’s entrepreneurship<br />
include establishing a legal framework<br />
that removes barriers to women owning land,<br />
a critical asset, especially in agriculture. Farms<br />
managed by woman- headed households are<br />
between half and two-thirds the size of farms<br />
run by man- headed households. 35 So, land policies,<br />
legislation and administration need to be<br />
changed to accommodate women—and the new<br />
rules must be enforced. These measures should<br />
cover formal and informal legal systems. In some<br />
countries legal reforms are already under way<br />
that may provide opportunities for women that<br />
have been heretofore unavailable (box 4.6).<br />
Breaking the glass ceiling<br />
The glass ceiling, though cracked in many<br />
places, is far from being shattered. Women in<br />
business hold 24 percent of senior management<br />
positions globally, but 33 percent of businesses<br />
have no women in those posts. 36 Gender<br />
requirements in selection and recruitment<br />
and incentive mechanisms for retention can<br />
enhance women’s representation in the public<br />
and private sectors. The criteria for promoting<br />
men and women into senior management positions<br />
should be identical, based on equal pay<br />
for equal work.<br />
In developing countries business leadership positions<br />
that are open to women are often limited<br />
to micro or small enterprises. In such contexts,<br />
policies promoting women’s entrepreneurship<br />
and supporting the participation of women-led<br />
small and medium-size enterprises in public sector<br />
procurement can be particularly relevant.<br />
Women’s representation can be increased<br />
through affirmative action, such as quotas for<br />
women on corporate boards, as in the European<br />
Union. Such efforts are even more effective<br />
when accompanied by policies that raise retention<br />
rates. Mentoring, coaching and sponsoring<br />
can empower women in the workplace by using<br />
successful senior female managers as role models<br />
and as sponsors. All these approaches can<br />
change norms and promote women to positions<br />
of seniority and responsibility. A complementary<br />
approach is to encourage men to join professions<br />
traditionally dominated by women.<br />
Mentoring, coaching<br />
and sponsoring can<br />
empower women in<br />
the workplace by using<br />
successful senior<br />
female managers<br />
as role models and<br />
as sponsors<br />
BOX 4.6<br />
Arab States — opening opportunities for women<br />
Business associations are emerging to support female<br />
entrepreneurs through training, research, networking<br />
and other services. Examples include the MENA<br />
Businesswomen’s Network Association in Bahrain, the<br />
Occupied Palestinian Territory Business Women’s Forum<br />
and the National Association of Women Entrepreneurs<br />
of Tunisia. 1<br />
Female labour force participation may increase<br />
in the Arab States as businesses and governments<br />
recognize the financial benefits of employing women,<br />
especially given women’s higher educational attainment<br />
and purchasing power.<br />
In Saudi Arabia the number of women employed has<br />
increased 48 percent since 2010, thanks partly to petitions<br />
and legal reforms that enable women to work in formerly<br />
closed sectors, including law, to go outside unaccompanied<br />
by men, to exercise voting rights and to be elected<br />
at certain levels of government. 2 In Jordan the online<br />
platform for engineering contractors, Handasiyat.net, has<br />
attracted female engineers seeking to work from home. 3<br />
Notes<br />
1. ILO <strong>2016</strong>b. 2. Chew 2015. 3. ILO <strong>2016</strong>b.<br />
Source: <strong>Human</strong> <strong>Development</strong> <strong>Report</strong> Office.<br />
Chapter 4 Caring for those left out — national policy options | 113
Universally fulfilling<br />
outcomes are more<br />
likely when all children<br />
can acquire the<br />
skills that match the<br />
opportunities open to<br />
young people joining<br />
the workforce<br />
The Norwegian quota law requires all public<br />
(limited) companies listed on the Norwegian<br />
Stock Exchange as well as state-owned, municipal,<br />
intermunicipal and cooperative companies<br />
to appoint boards that include at least 40 percent<br />
women. Women made up 6 percent of the<br />
boards of public limited liability companies in<br />
2002 and 40 percent only six years later. 37<br />
Addressing lifecycle capabilities<br />
Capabilities built over a lifetime have to be<br />
nurtured and maintained. And vulnerabilities<br />
that people face in various phases of their lives<br />
must be overcome. To ensure that human development<br />
reaches those left out, building capabilities<br />
should be seen through a lifecycle lens.<br />
Helping children prepare for the future<br />
Universally fulfilling outcomes are more likely<br />
when all children can acquire the skills that<br />
match the opportunities open to young people<br />
joining the workforce. Much attention is correctly<br />
focused on what is needed to ensure that<br />
all children, everywhere, complete a full course<br />
of schooling.<br />
But the formal education system is only part<br />
of a continuum of influences that connects a<br />
newborn to adulthood. Social and cultural influences<br />
operate inside and outside the school<br />
system. Factors critical to learning and life outcomes<br />
make themselves felt even in the womb<br />
and are cumulative, so that a shortfall at one<br />
stage can be compounded later and become<br />
harder — if not impossible — to address.<br />
At one level, school systems have to be<br />
flexible enough to accommodate divergent<br />
cultures. At another, promoting school<br />
readiness — creating capabilities that promote<br />
learning — is as important as schooling for producing<br />
positive life outcomes, such as increased<br />
productivity, higher income, better health and<br />
greater upward mobility. Traditional methods<br />
of remediation, such as public on-the-job<br />
training or adult literacy programmes to boost<br />
the skills of disadvantaged young people,<br />
have lower returns than early childhood programmes.<br />
A better choice is early interventions<br />
in the preschool years that promote learning<br />
and retention in school. Early childhood education<br />
services have expanded considerably<br />
since 2000, but the gaps, still large, require<br />
urgent attention.<br />
The World Bank has found that every dollar<br />
spent on preschool education earns $6–$17 in<br />
public benefits in the form of a healthier and<br />
more productive workforce. 38 Many developing<br />
countries seem to have accepted this. Ethiopia<br />
says that it will increase preschool enrolment<br />
to 80 percent by 2020, from 4 percent in 2009.<br />
Ghana now includes two years of preschool<br />
in the education system. China is contemplating<br />
providing preschool facilities for all<br />
youngsters. 39<br />
Empowering young people<br />
Voting is often the main avenue to influencing<br />
a political process, but it seems to be less<br />
attractive to younger voters than to older voters.<br />
In Canada 35–50 percent of voters ages<br />
18–34 voted in 2004–2011, compared with<br />
65–78 percent of voters ages 55–74. 40 Young<br />
people also seem disenchanted with traditional<br />
politics. That should not be interpreted as a<br />
lack of interest in public life.<br />
Millennials are seeking alternative ways to<br />
improve their communities, both locally and<br />
globally. Sixty-three percent of them have donated<br />
to charity, 52 percent have signed petitions<br />
and 43 percent have volunteered for civil<br />
society organizations. 41 They are also looking<br />
to social movements and community organizations<br />
as platforms for their political interests<br />
and action. In Egypt, the Syrian Arab Republic<br />
and Tunisia young protesters used their mobile<br />
phones to post comments, photos and videos<br />
of events during the Arab Spring live on social<br />
media, to generate national and international<br />
support for their demands. 42<br />
The challenge in these areas is integrating into<br />
policymaking the opinions and convictions of<br />
young people expressed through alternative<br />
forms of participation. One approach might be<br />
through government-sponsored advisory roles,<br />
youth parliaments and roundtable discussions.<br />
At least 30 countries have some kind of nonadult<br />
parliamentary structure, nationally or in<br />
cities, villages or schools. 43 Government agendas<br />
developed for children and youth, such as those<br />
in New Zealand, can also promote participation.<br />
On the economic front creating new opportunities<br />
for young people and preparing<br />
114 | HUMAN DEVELOPMENT REPORT <strong>2016</strong>
young people with the skills needed to take<br />
advantage of those opportunities are required.<br />
More than one-third of the skills important in<br />
today’s economy will have changed by 2020. 44<br />
Acquiring skills for the 21st century has to<br />
be part of lifelong learning of the four C’s —<br />
critical thinking, collaborating, creating and<br />
communicating (figure 4.3).<br />
Unbridling young people’s creativity and<br />
entrepreneurship requires policy support for<br />
sectors and enterprises in new areas of the<br />
economy, for young entrepreneurs involved in<br />
startups or crowdsourcing, for instance, and for<br />
social entrepreneurs (box 4.7).<br />
Protecting vulnerable workers<br />
Three of the world’s ten largest employers are<br />
replacing workers with robots, and an estimated<br />
57 percent of jobs in Organisation for<br />
Economic Co-operation and <strong>Development</strong><br />
countries are at risk because of automation<br />
(figure 4.4). 45 The world is also moving towards<br />
a knowledge economy, so that low-skilled or<br />
marginal workers are losing their livelihoods.<br />
The European Union is expected to add 16 million<br />
new jobs between 2010 and 2020, but the<br />
number of jobs available for people with little or<br />
no formal education is anticipated to decline by<br />
around 12 million. 46<br />
As some jobs disappear, new jobs will appear in<br />
nontradables such as education, health care and<br />
public services, which are also fundamental to<br />
enhancing human development. Workers should<br />
be educated for and guided towards such jobs.<br />
For example, skills can be developed so workers<br />
can transition to sustainable employment in the<br />
green economy, solar energy and wind power.<br />
A fit-for-the-future skill-learning system<br />
can be designed and implemented starting in<br />
secondary school and continuing in tertiary education.<br />
An emphasis on science, technology,<br />
engineering and mathematics may be necessary.<br />
But flexibility in the curricula of the learning<br />
As some jobs<br />
disappear, new<br />
jobs will appear in<br />
nontradables such<br />
as education, health<br />
care and public<br />
services, which are<br />
also fundamental to<br />
enhancing human<br />
development<br />
FIGURE 4.3<br />
21st century skills<br />
Ways of thinking<br />
Tools for working<br />
Ways of working<br />
Skills for living in<br />
the world<br />
Creativity<br />
Critical thinking<br />
Problemsolving<br />
Decisionmaking<br />
Learning<br />
Information and<br />
communication<br />
technology<br />
Information literacy<br />
Communication<br />
Collaboration<br />
Citizenship<br />
Life and career<br />
Personal and social<br />
responsibility<br />
Source: <strong>Human</strong> <strong>Development</strong> <strong>Report</strong> Office.<br />
BOX 4.7<br />
Social businesses attract young people<br />
Social businesses are emerging as new areas of work<br />
among young people. They are cause-driven entities<br />
designed to address a social problem — nonloss, nondividend<br />
companies, financially self-sustainable, the<br />
primary aim of which is not to maximize profits (though<br />
profits are desirable) but social benefits.<br />
Inspired by a particular cause and by the desire<br />
to give back to society, numerous successful young<br />
commercial entrepreneurs around the world are<br />
transitioning from for-profit ventures to engage in social<br />
change. A survey of 763 commercial entrepreneurs in<br />
India who made the transition from commercial to social<br />
entrepreneurship between 2003 and 2013 and a quantitative<br />
analysis of 493 entrepreneurs indicated that<br />
21 percent of successful entrepreneurs shifted to social<br />
change efforts. Most are skilled organization builders,<br />
independently wealthy, often establishment outsiders,<br />
and some from the diaspora.<br />
Source: UNDP 2015a.<br />
Chapter 4 Caring for those left out — national policy options | 115
FIGURE 4.4<br />
Navigating the fourth industrial revolution<br />
1 1784 2 1870 3 1969 4 ????<br />
Steam, water,<br />
mechanical production<br />
equipment<br />
Division of<br />
labour, electricity,<br />
mass production<br />
The computer,<br />
electronics<br />
and the Internet<br />
The barriers<br />
between people and<br />
machine dissolve<br />
Source: Schwab <strong>2016</strong>.<br />
Older people require<br />
dedicated attention<br />
to ensure that<br />
their human rights<br />
are respected<br />
system is crucial, and training should provide<br />
multitasking skills and the agility to move from<br />
one line of activity to another. Workers whose<br />
livelihoods are threatened can transition to jobs<br />
at similar and higher levels with the aid of wage<br />
subsidies and temporary income support.<br />
Caring for older people<br />
Older people form a particularly vulnerable<br />
group that often suffers from deprivations in<br />
health, income and social life (see chapter 2).<br />
They require dedicated attention from policymakers<br />
to ensure that their human rights are respected<br />
and that opportunities are available so<br />
they can enjoy self-realization and contribute<br />
to society. Some appropriate measures include:<br />
• Establishing a combination of public and private<br />
provisioning of elder care. Public provision<br />
of health care can be strengthened through<br />
affordable but high-quality health services<br />
targeted exclusively at older people. Because<br />
of changing family structures and women’s<br />
increasing economic activity, market mechanisms<br />
can enable private provision of such care<br />
(such as the employment of private caregivers)<br />
or innovative collective community-based systems.<br />
Under the Fureai Kippu system in Japan,<br />
people earn credits for caring for older people<br />
that they can use later when they need care or<br />
that they can transfer to others. 47<br />
• Strengthening the social protection for older<br />
people through basic noncontributory social<br />
pensions (as in Brazil). 48 Countries should<br />
also explore fully funded contributory pensions<br />
and social pensions. 49<br />
• Creating opportunities for older people to work<br />
where they can contribute, including teaching<br />
children, care work and voluntary work.<br />
Older relatives may provide care for children<br />
whose parents are working or have migrated<br />
for work or where the children have become<br />
orphans. In Denmark and the Netherlands<br />
more than 60 percent of women and more<br />
than 40 percent of men ages 60–65 provide<br />
care for their grandchildren. 50 In the United<br />
Kingdom 30 percent of people ages 65–74<br />
engage in voluntary work. 51<br />
Mobilizing resources for human<br />
development priorities<br />
Public policies for human development priorities<br />
require domestic and external resources. One of<br />
the critical issues is how resources are mobilized<br />
for such investments. The domestic revenue base<br />
in many developing countries is generally low. For<br />
example, in 2002 tax revenue as a share of GDP<br />
was about 7.2 percent in low human development<br />
countries, compared with nearly 15 percent<br />
in very high human development countries. 52<br />
Foreign direct investment favours certain countries<br />
(such as China and India), but not so much<br />
other countries. The economic lifeline of some<br />
poor countries is official development assistance,<br />
the prospect of which is rather dim because of<br />
the global political economy situation. Given<br />
such diverse circumstances, there are at least five<br />
options that developing countries can explore to<br />
generate the necessary resources.<br />
Creating fiscal space<br />
Fiscal space is the financing available to governments<br />
through policy actions aimed at<br />
enhancing resource mobilization and reforms<br />
116 | HUMAN DEVELOPMENT REPORT <strong>2016</strong>
to improve the governance, institutional and<br />
economic environment. Fiscal space has four<br />
pillars: official development assistance, domestic<br />
revenue, deficit financing (through domestic<br />
and external borrowing) and variations in<br />
spending priorities and efficiency. 53<br />
The choice of which pillar to use to increase<br />
or rebuild fiscal space depends mainly on country<br />
characteristics. In 2009 Ghana considered<br />
improving revenue collection to increase the<br />
health budget, even though the share of the total<br />
government budget allocated to health was<br />
stable. 54 In 2006 Chile identified higher revenue<br />
and greater borrowing as channels to expand the<br />
fiscal space. 55 In the mid-2000s Brazil and India<br />
identified higher expenditure efficiency in areas<br />
where stronger revenue efforts were identified as<br />
a means to boost the fiscal space. 56<br />
Expanding the per capita fiscal space allows<br />
for greater spending on sectors of the economy<br />
that directly enhance human development.<br />
And the stability of the fiscal space during<br />
economic downturns can also help maintain or<br />
even increase expenditure on social services as a<br />
countercyclical measure.<br />
Macroeconomic stability can help boost the<br />
fiscal space. Fiscal rules, stabilization funds and<br />
a medium-term expenditure framework can<br />
strengthen fiscal governance and bolster the fiscal<br />
space, as can more efficient use of resources.<br />
For example, developing countries might take<br />
advantage of lower commodity prices to reform<br />
subsidies. Broadening the tax base and reducing<br />
tax distortions also help.<br />
Consolidating remittances<br />
In <strong>2016</strong> remittances to developing countries — a<br />
lifeline for many societies — were expected to<br />
reach $442 billion. 57 They enter through various<br />
channels (not all legal) for a raft of purposes,<br />
from pure consumption to education and asset<br />
purchases, including land. But the transfer costs<br />
are steep, averaging nearly 8 percent worldwide<br />
to send $200 internationally in 2015.<br />
Consolidating and streamlining remittances<br />
could make them a funding source for human<br />
development priorities. Remittance banks can<br />
be set up in countries where the remittance<br />
flows are large, such as Bangladesh, Jordan<br />
and the Philippines. Easy and transparent<br />
legal remittance-sending mechanisms can be<br />
instituted in consultation with host countries.<br />
And digital remittance transfers can be modelled<br />
after M-Pesa and BKash.<br />
Using climate finance as human<br />
development priority financing<br />
The 2030 Agenda and the Paris Climate<br />
Change Agreement mark the global community’s<br />
commitment to take action to end poverty,<br />
confront inequality and tackle climate change,<br />
which impact marginalized and vulnerable people<br />
the most. Climate finance has thus emerged<br />
as a major resource to help countries tackle<br />
climate change. Given the differences in concerns<br />
in middle-income countries and the least<br />
developed countries, there has been a debate<br />
about the appropriate relationship between<br />
development finance and climate finance.<br />
Concerns vary across countries. Developed<br />
and middle-income countries that emit the<br />
majority of the carbon dioxide into the atmosphere<br />
are seeking financing and technologies to<br />
reduce emissions and mitigate climate change.<br />
But in the least developed countries, where<br />
emissions are low, climate finance can expand<br />
climate-resilient livelihoods, improve water and<br />
sanitation systems and ensure food security.<br />
These investments go beyond climate adaptation<br />
programmes in the narrow sense to focus<br />
on achieving human development by increasing<br />
the long-term climate resilience of economies<br />
and societies.<br />
Exploiting other means<br />
An estimated $1 trillion flows illegally out of<br />
developing and emerging economies each year,<br />
more than these economies receive in foreign<br />
direct investment and official development assistance.<br />
58 Beyond depriving the world’s needy<br />
countries, this propels crime, corruption and<br />
tax evasion. Most of the money is lost through<br />
trade invoicing — changing prices to secretly<br />
move money across borders. If exporting and<br />
importing countries collaborate to monitor<br />
invoicing through trade rules and other mechanisms,<br />
such flows can be identified and seized.<br />
<strong>Development</strong> impact bonds can be floated<br />
to open revenue streams from private investors<br />
and allow public entities to transfer risk.<br />
They also force policymakers to measure the<br />
Consolidating<br />
and streamlining<br />
remittances could<br />
make them a funding<br />
source for human<br />
development priorities<br />
Chapter 4 Caring for those left out — national policy options | 117
Ending subsidies to the<br />
rich or for commodities<br />
such as fossil fuel can<br />
generate resources for<br />
human development<br />
benefits of interventions. But they need clear<br />
goals — such as building 1 million toilets. A<br />
clear quantitative goal may sound great and be<br />
easily measurable, but the toilets would make<br />
little difference if they are not part of a locally<br />
led sustainable sanitation system.<br />
Stopping corruption and capital flight can<br />
also provide resources for human development.<br />
In 2010, $21 trillion worth of financial<br />
assets were transferred to offshore tax havens. 59<br />
Nigeria is estimated to have lost over $400 billion<br />
to corruption between independence and<br />
1999. 60 A small fraction of that could do much<br />
to reach those left out.<br />
Ending subsidies to the rich or for commodities<br />
such as fossil fuel can free resources<br />
for human development. In 2014 the richest<br />
20 percent of India’s population enjoyed<br />
subsidies of $16 billion thanks to six commodities<br />
and services — cooking gas, railways,<br />
power, aviation fuel, gold and kerosene — and<br />
exempt- exempt-exempt tax treatment under<br />
the public provident fund. 61 The International<br />
Monetary Fund estimates that fossil fuel<br />
companies benefit from global subsidies of<br />
$10 million a minute largely because polluters<br />
are not charged for the cost of the environmental<br />
damage they cause. 62 That cost includes<br />
the harm to local populations by air pollution<br />
as well as to people across the globe affected<br />
by the floods, droughts and storms driven by<br />
climate change.<br />
In the 1990s a 20:20 compact was proposed<br />
for basic human development — developing<br />
countries would devote 20 percent of their<br />
domestic budget to human development<br />
priorities, complemented by 20 percent of official<br />
development assistance. 63 Given the 2030<br />
Agenda, such ideas should be revived.<br />
Using resources efficiently<br />
Efficiency in resource use is equivalent to<br />
generating additional resources. For example,<br />
telemedicine can deliver medical advice and<br />
treatment options to patients irrespective of<br />
their location, thereby reducing the cost of<br />
service provision. Frontline health workers<br />
have difficulty diagnosing pneumonia, which<br />
kills more than 1 million children a year, and<br />
pre- eclampsia, the second-leading cause of<br />
maternal deaths. To change this, the Phone<br />
Oximeter mobile health platform uses a<br />
low-cost sensor powered by a mobile phone<br />
to measure blood oxygen levels and then<br />
displays informed advice for diagnosis and<br />
treatment. 64<br />
Pursuing measures for<br />
groups with special needs<br />
Because some groups in society are systematically<br />
discriminated against and thereby left<br />
out, only positive discriminatory measures<br />
can achieve more equitable outcomes in<br />
human development. To ensure that human<br />
development reaches everyone, measures are<br />
needed for some groups with special needs —<br />
such as women, ethnic minorities, indigenous<br />
peoples, persons with disabilities, people<br />
living with HIV and AIDS and vulnerable<br />
workers.<br />
One of these measures is to collect disaggregated<br />
data on all these groups (see chapter 3).<br />
Other policy measures are affirmative action<br />
and specific interventions to promote human<br />
development for marginalized groups.<br />
Using affirmative action<br />
Affirmative action — positive discrimination<br />
for distributive justice — has been important<br />
in redressing historical and persistent group<br />
disparities and group discrimination and in<br />
reiterating that every human being has equal<br />
rights. Women, ethnic minorities and persons<br />
with disabilities face various forms of<br />
discrimination because of their sex, ethnicity<br />
or circumstances (see chapter 2). Stigma and<br />
norms also contribute to the disparities and<br />
discrimination affecting indigenous peoples or<br />
people living with HIV and AIDS. Affirmative<br />
action may take the form of enrolment quotas<br />
for ethnic minorities in tertiary education or<br />
preferential treatment for female entrepreneurs<br />
in obtaining subsidized credit through<br />
the banking system.<br />
Affirmative action such as quotas not only reserves<br />
jobs for persons with disabilities, but also<br />
provides an opportunity for the rest of society<br />
to observe the capabilities and achievements of<br />
these people, changing bias, attitudes and social<br />
norms. One area where affirmative action has<br />
118 | HUMAN DEVELOPMENT REPORT <strong>2016</strong>
made a difference is in women’s representation<br />
in parliament (box 4.8).<br />
India’s affirmative action programme —<br />
launched in 1950, making it the world’s oldest<br />
— was originally intended to benefit Scheduled<br />
Castes, which include Dalits, or untouchables,<br />
who had been oppressed for centuries under<br />
the caste system and accounted for about<br />
16 percent of the population, and Scheduled<br />
Tribes, the historically neglected tribal groups<br />
that accounted for about 8 percent of the<br />
population. 65 The programme was expanded in<br />
the early 1990s to include the Other Backward<br />
Classes, lower castes of socially and educationally<br />
disadvantaged people encompassing about<br />
25 percent of the population. The programme<br />
has not remedied caste-based exclusions, but<br />
it has had substantial positive effects. In 1965,<br />
for example, Dalits held fewer than 2 percent of<br />
senior civil service positions, but the share had<br />
grown to 11 percent by 2001.<br />
In 2013, 32 of the 38 state universities and 40<br />
of the 59 federal universities in Brazil had some<br />
form of affirmative action policy. 66 Between<br />
1997 and 2011 the share of Afro-Brazilians<br />
of college age enrolled in university rose from<br />
4 percent to 20 percent.<br />
Promoting human development<br />
for marginalized groups<br />
Despite the great diversity in identities and<br />
needs (see chapter 2), marginalized groups,<br />
such as ethnic minorities, indigenous peoples,<br />
persons with disabilities, people living with<br />
HIV and AIDS, and lesbian, gay, bisexual,<br />
transgender and intersex individuals, often<br />
face similar constraints in their efforts to enhance<br />
their capabilities and freedoms, such as<br />
marginalization in basic well-being, voice and<br />
autonomy, or rights and privileges. They often<br />
face discrimination, social stigma and risk of<br />
being harmed. But each group also has special<br />
needs that must be met for the group to benefit<br />
from progress in human development.<br />
First, for some vulnerable groups, such as ethnic<br />
minorities or persons with disabilities, antidiscrimination<br />
and other rights are guaranteed<br />
in constitutions and other legislation. Similarly,<br />
special provisions often protect indigenous<br />
peoples, as in Canada and New Zealand. Yet in<br />
many cases effective mechanisms for full equality<br />
in law are lacking. National human rights<br />
commissions or commissions for specific groups<br />
can provide oversight and ensure that the rights<br />
Despite the<br />
great diversity in<br />
identities and needs,<br />
marginalized groups<br />
must confront common<br />
constraints in their<br />
efforts to enhance<br />
their capabilities<br />
and freedoms<br />
BOX 4.8<br />
Affirmative action has helped increase women’s representation in parliament<br />
Gender-based quotas in senior positions and parliaments<br />
have gained prominence since the adoption of<br />
the Beijing Declaration and Platform for Action at the<br />
United Nations Fourth World Conference in 1995 and<br />
the Committee on the Elimination of Discrimination<br />
against Women’s general recommendation 25 (2004)<br />
on special temporary measures, including quotas.<br />
Governments have increasingly adopted quotas since<br />
the conference to boost women’s participation, counter<br />
discrimination and accelerate change.<br />
In countries with some type of parliamentary gender<br />
quota a higher share of parliamentary seats are<br />
held by women. Women average 26 percent of the<br />
seats in lower houses and in single houses of parliament<br />
in countries with voluntary party quotas, 25 percent<br />
in countries with legislated candidate quotas and<br />
23 percent in countries with reserved seats for women. 1<br />
Compare this with 16 percent in countries with no such<br />
quotas. Countries with quotas for female parliamentarians<br />
have provided confidence and incentives for women<br />
to contest general parliamentary seats and win those<br />
seats.<br />
Rwanda, with female representation of 64 percent<br />
in the House of Deputies, is a shining example. The 2003<br />
constitution set aside 30 percent of legislative seats for<br />
women. Each election since has increased the seats held<br />
by women, both those reserved for women and some of<br />
the nonreserved seats. Women’s representation in the<br />
House of Deputies rose to 64 percent in 2013. Today,<br />
women account for over 60 percent of the members of<br />
parliament. 2 Since the introduction of quotas, women<br />
have not only increased their number of representatives,<br />
they have also used their positions to pass laws<br />
empowering women, including preventing and punishing<br />
violence against women, increasing property rights for<br />
women and promoting women in the labour force.<br />
Notes<br />
1. United Nations 2015d. 2. UN Women <strong>2016</strong>a.<br />
Source: <strong>Human</strong> <strong>Development</strong> <strong>Report</strong> Office.<br />
Chapter 4 Caring for those left out — national policy options | 119
Quotas in favour of<br />
ethnic minorities and<br />
the representation of<br />
indigenous peoples<br />
in parliaments are a<br />
means not only to foster<br />
self-determination, but<br />
also to raise issues<br />
of special concern<br />
of these groups are not violated. Some of these<br />
groups are not recognized as marginalized in<br />
many countries. Only five countries recognize<br />
the rights of lesbian, gay, bisexual, transgender<br />
and intersex people (box 4.9; see also chapter 2).<br />
Second, recognition of the special identity<br />
and status of marginalized groups, such as ethnic<br />
minorities or indigenous peoples, is necessary.<br />
Thus, because recognizing the right to selfdetermination<br />
sends a powerful message about<br />
the need for protection, recognizing the right of<br />
self- determination among indigenous communities<br />
is crucial. The special relationship of many<br />
indigenous peoples and the land should likewise<br />
be recognized, with measures to advance human<br />
development among these people reflecting an<br />
awareness of this reality. Ethnic minorities and<br />
indigenous peoples have distinct cultures and<br />
languages that need to be taken into consideration<br />
in expanding access to health care facilities<br />
and education opportunities. Education in their<br />
BOX 4.9<br />
native language not only recognizes the importance<br />
of distinct native languages, but is also<br />
conducive to greater learning among children.<br />
Third, effective participation by disadvantaged<br />
groups in the processes that shape their<br />
lives needs to be ensured. Quotas for ethnic minorities<br />
and indigenous peoples in parliaments<br />
are thus a means not only to foster self-determination,<br />
but also to help them raise their concerns.<br />
Some indigenous peoples have their own<br />
parliaments or councils, which are consultative<br />
bodies (see chapter 2). New Zealand has the<br />
longest history of indigenous self-representation<br />
in a national legislature (box 4.10). Mirna<br />
Cunningham Kain, activist for the rights of the<br />
Nicaraguan Miskitu indigenous peoples rights<br />
activist and former chairperson of the United<br />
Nations Permanent Forum on Indigenous Issues,<br />
emphasizes that the there is much to learn from<br />
indigenous peoples’ quest for peace and development<br />
in a plural world (see special contribution).<br />
Overcoming discrimination against lesbian, gay, bisexual, transgender and intersex individuals<br />
Overcoming the discrimination and abuse of lesbian,<br />
gay, bisexual, transgender and intersex (LGBTI) individuals<br />
requires a legal framework that can defend the<br />
relevant human rights. Where LGBTI people are criminalized,<br />
they are widely discriminated against. In countries<br />
with no basic legal tolerance for LGBTI people, there<br />
is almost no room for a defence based on the principle<br />
of antidiscrimination: The main protection is for LGBTI<br />
people to deny their sexual preference. Awareness<br />
campaigns need to be launched in households, communities,<br />
schools and workplaces so that acceptance<br />
becomes easier. Nonacceptance within households often<br />
leads teenagers to run away or drift and encourages<br />
harassment in schools and discrimination in hiring. Help<br />
centres, hotlines and mentoring groups can assist this<br />
community.<br />
Source: <strong>Human</strong> <strong>Development</strong> <strong>Report</strong> Office.<br />
BOX 4.10<br />
Maori representation in New Zealand’s parliament<br />
The Maori Representation Act of 1867 introduced a dual<br />
constituency system in New Zealand whereby members<br />
of parliament are elected from two sets of singlemember<br />
electorates, one for people of Maori descent<br />
and the other for people of European descent — now<br />
referred to as general electorates. In 1975 the act was<br />
amended to introduce a Maori Electoral Option, which<br />
gave electors of Maori descent the right to choose<br />
whether they enrolled in the Maori or the general<br />
electorates.<br />
Electoral reform in the 1990s affected Maori representation<br />
in two ways. First, it allowed the number<br />
of Maori electorates, which had remained fixed at four<br />
since 1867, to vary up or down depending on the numbers<br />
of voters of Maori descent who elected to enroll to vote<br />
in those electorates. Second, it introduced proportional<br />
representation, which allowed Maori and other groups<br />
to be elected from party lists. This resulted in the election<br />
of Maori from a wider range of political parties and<br />
a much higher number of Maori members of parliament<br />
(currently 25 out of 121 total members of parliament).<br />
Source: Edwards 2015; Forbes 2015.<br />
120 | HUMAN DEVELOPMENT REPORT <strong>2016</strong>
SPECIAL CONTRIBUTION<br />
The world has much to learn from indigenous peoples<br />
From my lifelong experiences, being an advocate for the rights of some of<br />
the most marginalized peoples, allow me to share what I have learned and<br />
come to see as essential elements to ensure peaceful societies and sustainable<br />
development in a plural world.<br />
Celebrating diversity<br />
Indigenous peoples contribute to diversity, and their history emphasizes the<br />
importance of revitalizing and celebrating ancient cultures, music, languages,<br />
knowledge, traditions and identities. Living in an era where xenophobia,<br />
fundamentalism, populism and racism are on the rise in many parts of the<br />
world, celebrations and positive messages about the value of diversity can<br />
contribute to counter negative stereotypes, racism and discrimination and<br />
instead foster tolerance, innovation and peaceful coexistence between<br />
peoples. This is essential to safeguard the inherent belief in human beings’<br />
equal worth, as reflected in the fundamental principles of the Universal<br />
Declaration on <strong>Human</strong> Rights.<br />
Taking special measures to ensure equality and<br />
combat discrimination<br />
The world today is more unequal than ever before — yet, there is an increasing<br />
recognition of the crucial importance of addressing systematic inequalities<br />
to ensure sustainable development. To address inequalities, a first step<br />
is to repeal discriminatory policies and laws that continue to exist in many<br />
countries, preventing particular groups of peoples from fully realizing their<br />
potential. For indigenous peoples, it is necessary to adopt positive or special<br />
measures to overcome discrimination and ensure the progressive achievement<br />
of indigenous peoples’ rights, as emphasised in the UN Declaration<br />
on the Rights of Indigenous Peoples (article 21.2). This includes measures<br />
to safeguard cultural values and identities of indigenous peoples (article<br />
8.2) or to ensure access to education in their own languages (article 14).<br />
Further, nondiscrimination for indigenous peoples is strongly related to the<br />
right to self-determination and cultural integrity. These principles should be<br />
promoted in the context of addressing target 16b of the 2030 Agenda, promoting<br />
and enforcing nondiscriminatory laws and policies.<br />
Getting down to the root causes of conflicts<br />
No solution to conflicts and injustices will be possible without addressing<br />
the root causes for these conflicts. For indigenous peoples, root causes<br />
most often relate to violations against their human rights, in particular<br />
rights related to their lands, territories and resources. Across the world,<br />
indigenous peoples increasingly experience militarization, armed conflict,<br />
forced displacements or other conflicts on their lands, which have become<br />
increasingly valuable in light of globalization and the continued quest for<br />
resource extraction. Indigenous human rights and environmental defenders,<br />
who mobilize to protect their rights, face death threats, harassment, criminalization<br />
and killings. According to an Oxfam <strong>Report</strong>, 41 percent of murders<br />
of human rights defenders in Latin America were related to the defence of<br />
the environment, land, territory and indigenous peoples. The essential and<br />
first step to prevent conflict and ensure peaceful development is hence to<br />
protect, promote and ensure the basic rights of all peoples, including their<br />
free, prior and informed consent on development activities taking place on<br />
their lands. In that light the 2030 Agenda’s goal 16 on peaceful societies<br />
and strong institutions is essential. In particular, the focus on transparency,<br />
the rule of law and equal access to justice will be crucial to ensure accountability<br />
to the rights of all peoples.<br />
Bringing in the voices, world views and power of<br />
indigenous peoples<br />
Indigenous peoples have called for their rights to be at the negotiating table<br />
and have a voice in decisionmaking processes. “Nothing about us, without<br />
us” goes one of the mottoes, that is being repeated. Consistent with the<br />
UN Declaration on the Rights of Indigenous Peoples article 7, indigenous<br />
peoples have the collective right to live in freedom, peace and security as<br />
distinct peoples. Furthermore, in postconflict societies, states should ensure<br />
the participation of indigenous peoples through their own representative<br />
institutions in peace negotiations, peacebuilding, peacekeeping, humanitarian<br />
assistance and reconciliation processes. By strengthening indigenous<br />
peoples’ own institutions and governance systems and ensuring their inclusion<br />
in essential decisionmaking processes at the local, national and global<br />
levels, just solutions to conflicts can be found, and the structural root causes<br />
that led to the conflicts can be addressed. Indigenous peoples can also contribute<br />
to peace processes through their ancient wisdom and approaches to<br />
reconciliation and peace. Indigenous approaches to reconciliation often go<br />
beyond legal solutions with an essential focus on forgiveness, coexistence<br />
and harmony, which can inspire in a conflict situation that might otherwise<br />
seem protracted. The world has much to learn from indigenous peoples in<br />
the quest for peace and development in a plural world, as the one we are<br />
living in.<br />
Mirna Cunningham Kain<br />
Nicaraguan Miskitu, indigenous peoples rights activist and former chairperson of the United Nations Permanent Forum on Indigenous Issues<br />
Chapter 4 Caring for those left out — national policy options | 121
Persons with<br />
disabilities are<br />
differently abled<br />
Fourth, among marginalized groups inclusion<br />
and accommodation are fundamental human<br />
rights and are critical to empowering them to live<br />
independently, find employment and participate<br />
in and contribute to society on an equal basis. An<br />
environment conducive to productivity and creativity<br />
is essential among persons with disabilities,<br />
though finding and sustaining employment may<br />
be difficult. Ensuring skill and vocational training<br />
among persons with disabilities, expanding their<br />
access to productive resources (such as finance<br />
for self-employment) and providing information<br />
over mobile devices are positive steps. More efficient<br />
information flows and infrastructure can<br />
help persons with disabilities obtain work and<br />
help employers take advantage of this wealth of<br />
human ingenuity. Some countries are relying on<br />
these techniques to enlarge employment choices<br />
among persons with disabilities (box 4.11).<br />
There is also a need to encourage behavioural<br />
shifts in favour of persons with disabilities.<br />
Changing social norms and perceptions to<br />
promote the perception that persons with<br />
disabilities are differently abled and should be<br />
given a fair opportunity in work is fundamental<br />
and should be backed by a legal framework that<br />
discourages discrimination.<br />
Technology can enhance the capacities of persons<br />
with disabilities. Indonesia instituted a legal<br />
requirement for Braille templates for blind voters<br />
or voters with visual impairments at all polling<br />
stations. 67 Cambodia has made such templates<br />
available since 2008. 68 The Philippines offers<br />
special voter registration facilities before election<br />
day and express lanes for voters with disabilities. 69<br />
Fifth, migrants and refugees — often compelled<br />
to leave their home countries by violent conflict<br />
and consequently a desperate form of migration<br />
— are vulnerable in host countries (see chapter 2).<br />
Although a cross-border issue (chapter 5 analyses<br />
it as a global challenge), the problem also needs<br />
to be addressed locally. And actions need to reflect<br />
the new nature of migration and its context.<br />
Countries should pass laws that protect refugees,<br />
particularly women and children, a big part of<br />
the refugee population and the main victims.<br />
Transit and destination countries should provide<br />
essential public goods in catering to displaced<br />
people, such as schooling for refugee children;<br />
refugees will otherwise become a lost generation.<br />
Destination countries should formulate temporary<br />
work policies and provisions for refugees<br />
because work is the best social protection for<br />
these people (box 4.12).<br />
A comprehensive set of indicators measuring<br />
human development among migrant families<br />
should be created. Governments should establish<br />
comprehensive migration policy regimes, given<br />
that migration boosts national economies, as in<br />
Sweden (box 4.13). Because the refugee problem<br />
is global, collaboration among national and international<br />
actors would represent a step forward.<br />
Making human<br />
development resilient<br />
Progress in human development can stagnate<br />
or even be reversed if threatened by shocks<br />
from environmental degradation, climate<br />
BOX 4.11<br />
Enlarging employment choices among persons with disabilities in Serbia<br />
Living with a disability in Serbia has often meant being<br />
poor and unemployed and facing prejudice and social<br />
exclusion. More than 10 percent of the population has<br />
disabilities, more than 70 percent of persons with disabilities<br />
live in poverty, and only 13 percent of persons<br />
with disabilities have access to employment. 1<br />
In 2009 the government introduced the Law on<br />
Professional Rehabilitation and Employment of Persons<br />
with Disabilities. The law established an employment<br />
quota system that legally obliged all employers with 20–<br />
50 employees to hire at least one person with disabilities<br />
and one more for every 50 additional employees. Private<br />
companies could opt not to comply with the quotas, but<br />
then had to pay a tax that would fund services for persons<br />
with disabilities. Almost 3,700 persons with disabilities<br />
found employment in 2010, up from only 600 in 2009. 2<br />
Notes<br />
1. UNDP 2011a. 2. UNDP 2011a.<br />
Source: <strong>Human</strong> <strong>Development</strong> <strong>Report</strong> Office.<br />
122 | HUMAN DEVELOPMENT REPORT <strong>2016</strong>
BOX 4.12<br />
Providing work to Syrian refugees in Jordan<br />
In Jordan the presence of Syrian refugees in host<br />
communities has bolstered the informal economy, depressed<br />
wages, impeded access to public services and<br />
increased child labour.<br />
Efforts are under way to improve the access of Syrian<br />
refugees and members of local host communities to<br />
Jordan’s formal labour market. Early in <strong>2016</strong> Jordan agreed<br />
to accommodate a fixed number of Syrians in the labour<br />
market in return for better access to European markets,<br />
greater European investment in Jordan and access to<br />
soft loans. As a followup, Syrian refugees were given<br />
a three-month grace period to apply for work permits.<br />
The focus then became finding a practical means to<br />
increase Syrian refugees’ access to the labour market<br />
in a way that would fill labour shortfalls, benefit host<br />
communities and contribute to Jordan’s economy. By<br />
June <strong>2016</strong>, 12,000 new work permits had been issued<br />
to Syrian refugees.<br />
Source: ILO <strong>2016</strong>a.<br />
change, natural disasters, global epidemics and<br />
conflicts. Vulnerable and marginalized groups<br />
— those already left out — are the major victims.<br />
Promoting social protection<br />
Social protection provides support for those<br />
left out, but it can also have an impact on development<br />
by enhancing capabilities. Social protection<br />
includes social security, social assistance<br />
and social safety nets. Only 27 percent of the<br />
world’s population is covered by a comprehensive<br />
social protection system — about 5.2 billion<br />
people are not. 70 Policy options to expand<br />
social protection include:<br />
• Pursuing well designed, well targeted and well<br />
implemented social protection programmes. A<br />
social protection floor — a nationally defined<br />
set of basic social security guarantees —<br />
launched within the UN system in 2009 and<br />
updated with concrete recommendations in<br />
2012 aims to secure a minimum level of health<br />
care, pensions and other social rights for everyone.<br />
71 Countries are exploring ways to finance<br />
the floor, ranging from restructuring current<br />
public expenditures to extending social security<br />
contributions, restructuring debt and using<br />
the foreign exchange reserves of central banks.<br />
• Combining social protection with appropriate<br />
employment strategies. Creating jobs through<br />
a public works programme targeted at<br />
poor people can reduce poverty through<br />
income generation, build physical infrastructure<br />
and protect poor people against<br />
shocks. The National Rural Employment<br />
Guarantee Programme in India and the<br />
Rural Employment Opportunities for Public<br />
BOX 4.13<br />
The Swedish economy is being boosted by<br />
immigration<br />
Immigration has helped fuel Sweden’s biggest economic<br />
boom in five years. In 2015 Sweden took in<br />
more refugees per capita than any other country<br />
in Europe. The National Institute of Economic and<br />
Social Research indicates that the economy has<br />
benefited from the larger workforce, but emphasizes<br />
the difference between immigrants and refugees.<br />
There is a perception that a large influx of refugees<br />
is an impossible burden on the state even in the<br />
short term, but it increases growth. Still, the government<br />
needs a long-term strategy to integrate refugees<br />
and continue the economic expansion.<br />
Source: Witton <strong>2016</strong>.<br />
Assets Programme in Bangladesh are prime<br />
examples. 72<br />
• Providing a living income. A guaranteed basic<br />
minimum income for all citizens, independent<br />
of the job market, is also a policy option.<br />
Finland is about to launch an experiment<br />
whereby a randomly selected group of 2,000–<br />
3,000 citizens already on unemployment<br />
benefits will receive a basic monthly income<br />
of €560 (approximately $600), which would<br />
replace their existing benefits. The amount<br />
is the same as the country’s guaranteed minimum<br />
social security support. A pilot study<br />
to run in 2017–2018 will assess whether this<br />
basic income transfer can reduce poverty,<br />
social exclusion and bureaucracy, while increasing<br />
employment. 73 Switzerland held a<br />
Progress in human<br />
development can<br />
stagnate or even<br />
be reversed if<br />
threatened by shocks<br />
from environmental<br />
degradation, climate<br />
change, natural<br />
disasters, global<br />
epidemics and conflicts<br />
Chapter 4 Caring for those left out — national policy options | 123
<strong>Human</strong> development<br />
will never be resilient<br />
in the fight against<br />
HIV and AIDS unless<br />
everyone who needs<br />
help can be reached<br />
referendum on a basic minimum income in<br />
<strong>2016</strong>, but only 23 percent of voters backed<br />
the measure. 74 The main criticism is the<br />
enormous cost; the counterargument is that<br />
a large portion of the cost would be offset by<br />
the elimination of other social programmes.<br />
Another criticism is that a living income<br />
would be a disincentive to work, but the goal<br />
is not to enhance the incentive to work for<br />
pay, but to enable people to live if there is no<br />
paid work.<br />
• Tailoring programmes to local contexts. The lessons<br />
learned through highly successful Latin<br />
American experiences show that cash transfers<br />
can provide effective social protection.<br />
The conditional cash transfer programme in<br />
the Philippines reached 4.4 million families<br />
in 2015, covering 21 percent of the population;<br />
82 percent of the benefits went to<br />
the poorest 40 percent of the population. 75<br />
The programme’s success can be linked to<br />
careful targeting and regular assessments<br />
to update the list of recipients and ensure<br />
that the programme effectively matches the<br />
needs of the most vulnerable. Madagascar,<br />
where 60 percent of the population lives in<br />
extreme poverty, has a simple cash transfer<br />
programme. Beneficiaries, mostly women,<br />
receive regular cash payments and training in<br />
nutrition, early childhood development and<br />
leadership skills. 76<br />
Addressing epidemics, shocks and risks<br />
<strong>Human</strong> development will never be resilient<br />
in the fight against HIV and AIDS unless<br />
everyone who needs help can be reached. Yes,<br />
much progress has been made in scaling up<br />
antiretroviral therapy, but 18 million people<br />
living with HIV still do not have access to<br />
it. 77 Particular populations are left out; young<br />
women, who may be exposed to gender-based<br />
violence and have limited access to information<br />
and health care, are among the most<br />
exposed. 78 Still, there have been successes in<br />
reducing infection rates among women and<br />
children and in expanding their access to<br />
treatment (box 4.14).<br />
In an increasingly interconnected world, in<br />
which people move around more and more<br />
easily and frequently, being prepared for possible<br />
health crises has become a priority in both<br />
developed and developing countries. The recent<br />
epidemic of the Zika virus provides a good<br />
example of why countries should be prepared<br />
for health shocks. The outbreak of the virus<br />
BOX 4.14<br />
Reaching those left out in the fight against HIV and AIDS<br />
Malawi is a leader in the fight against HIV and AIDS with<br />
a game-changing approach known as Option B+, adopted<br />
in 2011. The programme provides antiretroviral therapy<br />
to all pregnant women with HIV in a treat-all approach,<br />
which removes the delays and hurdles involved in determining<br />
eligibility. Early treatment helps women stay<br />
healthy, protects their next pregnancies from infection<br />
and reduces the risk of transmitting HIV to their partners.<br />
A year after Option B+ was introduced, the number of<br />
pregnant and breastfeeding women living with HIV who<br />
were on antiretroviral therapy had risen from 1,257 in<br />
the second quarter of 2011 to 10,663 in the third quarter<br />
of 2012. 1 Following this success, Malawi launched the<br />
2015–2020 National HIV and AIDS Strategic Plan in 2014<br />
to reach populations missed by previous initiatives.<br />
Brazil opened its first clinic for transgender people<br />
in São Paulo in 2010 and has since opened nine more<br />
primary health care services in the city centre. In Kigali,<br />
Rwanda, the Women’s Equity in Access to Care and<br />
Treatment Clinic, dedicated to working with women and<br />
vulnerable young people and adolescents living with<br />
HIV, supports nearly 400 young people living with HIV,<br />
90 percent of them on antiretroviral therapy. In Dar es<br />
Salaam, United Republic of Tanzania, the faith-based<br />
organization Pastoral Activities and Services for People<br />
with AIDS Dar es Salaam Archdiocese offers testing and<br />
counselling to increase enrolment in care, treatment and<br />
support among children and adolescents living with HIV.<br />
In Nairobi, Kenya, the Mathari hospital provides antiretroviral<br />
therapy for those living with HIV who inject drugs.<br />
And Support for Addiction, Prevention and Treatment in<br />
Africa provides psychosocial counselling, testing for HIV<br />
and other sexually transmitted infections, and needle<br />
and syringe programmes at two facilities. 2<br />
Notes<br />
1. CDC 2013; UNAIDS <strong>2016</strong>f. 2. UNAIDS <strong>2016</strong>c.<br />
Source: UNAIDS <strong>2016</strong>f.<br />
124 | HUMAN DEVELOPMENT REPORT <strong>2016</strong>
occurred at the beginning of 2015 in Brazil,<br />
and the virus spread rapidly across countries in<br />
the Americas. The spread of the virus has been<br />
so rapid and alarming that in February <strong>2016</strong> the<br />
World Health Organization declared the virus<br />
a Public Health Emergency of International<br />
Concern.<br />
Countries have reacted in different ways to<br />
the spread of the Zika virus. Countries with an<br />
ongoing virus transmission such as Colombia,<br />
the Dominican Republic, Ecuador and Jamaica<br />
have advised women to postpone pregnancy. 79<br />
In Brazil a new mosquito strain was released<br />
to try to fight the virus, and members of the<br />
armed forces were sent across the country to<br />
educate people about mosquito control and<br />
to warn them of the risks linked to the virus. 80<br />
The revised strategic response plan designed<br />
by the World Health Organization, in collaboration<br />
with more than 60 partners, focuses on<br />
research, detection, prevention, and care and<br />
support. 81<br />
The Ebola epidemic that tore through West<br />
Africa in 2014 claimed 11,310 lives. A combination<br />
of factors contributed to its savagery, including<br />
a mobile population, crumbling public<br />
health systems, official neglect and hazardous<br />
burial practices. A genetic mutation may have<br />
made Ebola more deadly by improving the virus’s<br />
ability to enter human cells. This suggests<br />
that the scope of the epidemic was expanded.<br />
According to one alarming finding, patients infected<br />
with mutated versions of Ebola are much<br />
more likely to die. 82<br />
Natural disasters — earthquakes, floods, tsunamis,<br />
volcanic eruptions and the like — can<br />
generate enormous loss of life, drive people<br />
into poverty and even reverse progress in human<br />
development. The effects of disasters on<br />
human well-being can be greatly reduced, especially<br />
among the groups that are most exposed.<br />
Building disaster resilience into policies and<br />
programmes can reduce the associated risks<br />
and greatly mitigate the effects.<br />
This is the approach at the heart of the Sendai<br />
Framework for Disaster Risk Reduction agreed<br />
in March 2015. Several programmes illustrate<br />
the innovations involved in the approach. In<br />
Azerbaijan meteorological stations are being<br />
modernized with automatic alarm systems to<br />
alert authorities when critically high water levels<br />
are reached. 83 The system also collects data<br />
that can be used to predict seasonal flooding.<br />
Sri Lanka has implemented projects to improve<br />
the resilience of school buildings that can jointly<br />
serve as community facilities during disasters<br />
such as the 2004 tsunami. 84 The buildings are<br />
designed with storm- resilient toilets, solar<br />
systems for electricity, high foundations to reduce<br />
flood vulnerability and flat concrete roofs<br />
to resist high winds. The success of these and<br />
similar programmes requires cooperation and<br />
collaboration among various stakeholders and<br />
affected groups (government, civil society, scientific<br />
research institutions, the private sector,<br />
women, migrants, poor people and children).<br />
It also requires communication and shared<br />
resources among institutions at all levels and<br />
an understanding of the different roles these<br />
institutions play in disaster monitoring and<br />
response.<br />
Combating violence and<br />
ensuring people’s security<br />
Violence endangers people’s security. The drivers<br />
of violence are complex and thus call for a<br />
multipronged approach that includes:<br />
• Promoting the rule of law based on fairness<br />
and zero tolerance for violence. This approach<br />
needs a civic space for dialogue and participatory<br />
decisionmaking against violence and<br />
close collaboration with local leaders and<br />
credible intermediaries to promote dialogue<br />
with gangs and alienated groups.<br />
• Strengthening local governments, community<br />
policing and law enforcement personnel in hotspots<br />
of violence not only to address violence,<br />
but also to fight corruption.<br />
• Developing high-quality infrastructure, improving<br />
public transit in high-crime neighbourhoods<br />
and building better housing in the poorest<br />
urban areas to enhance the trust between the<br />
authorities and people left out. The Medellín<br />
miracle in Colombia’s second largest city<br />
is a prime example of how a multipronged<br />
approach can turn a city once notorious for<br />
its homicide rate (about 6,000 a year in 1991)<br />
into a thriving and agreeable place to live. 85<br />
• Providing socioeconomic alternatives to violence,<br />
particularly among young people, by<br />
building social cohesion.<br />
• Developing response and support services to<br />
address violence and aid its victims.<br />
The drivers of<br />
violence are complex<br />
and thus call for a<br />
multipronged approach<br />
Chapter 4 Caring for those left out — national policy options | 125
Successful programmes<br />
in disarmament,<br />
demobilization and<br />
reintegration must<br />
recognize that<br />
ex- combatants are a<br />
heterogeneous group<br />
and often include<br />
child soldiers, so a<br />
targeted, phased<br />
approach is needed<br />
Maintaining human well-being<br />
in postconflict situations<br />
Many societies, especially those with low human<br />
development, face great difficulty in achieving<br />
progress in well-being because they are in the<br />
grips of violent conflict or its aftermath. <strong>Human</strong><br />
development policies in such situations must<br />
include both political and economic measures.<br />
On the political front a three-pronged approach<br />
to transforming institutions is needed<br />
during postconflict relief, recovery and reconstruction.<br />
First is to ensure people’s security.<br />
This needs to be done through citizen protection<br />
and community policing, including the<br />
vetting and redeployment of security forces<br />
accountable to the public. The need to immediately<br />
deploy an effective police force — national<br />
or international — trained in dealing with violence<br />
against women is urgent.<br />
Second is to pursue faster caseload processing<br />
to ensure social accountability, especially in<br />
delivering humanitarian relief and establishing<br />
the groundwork for future powersharing.<br />
Third is to reintegrate ex- combatants.<br />
Disarmament, demobilization and reintegration<br />
of ex- combatants are early steps in the<br />
transition from war to peace. Disarmament<br />
and demobilization require security, the<br />
inclusion of all warring parties, political<br />
agreement, a comprehensive approach and<br />
sufficient resources. Reintegration focuses on<br />
reinsertion, addressing the economic needs of<br />
ex- combatants and economic reintegration.<br />
Successful programmes in disarmament,<br />
demobilization and reintegration must recognize<br />
that ex- combatants are a heterogeneous<br />
group and often include child soldiers, so a<br />
targeted, phased approach is needed.<br />
On the economic front, the following policy<br />
interventions are necessary:<br />
• Reviving basic social services. This has social<br />
and political benefits, and positive results can<br />
be achieved even in the direst situations (box<br />
4.15). Communities, nongovernmental organizations<br />
and public–private partnerships<br />
can be good catalysts in such situations.<br />
• Supporting work in the health system to cover<br />
many goals. In many conflict-afflicted countries<br />
the health system has collapsed, converting<br />
health services into a life- threatening<br />
challenge for helpers and the wounded.<br />
International aid becomes indispensable in<br />
this setting, but local volunteers can contribute<br />
substantially to providing crucial health<br />
services and saving lives.<br />
• Initiating public works programmes.<br />
Emergency temporary jobs and cash for work<br />
can provide much-needed livelihoods and<br />
contribute to the building of critical physical<br />
and social infrastructure.<br />
• Formulating and implementing targeted community-based<br />
programmes — for example by<br />
continuing to use makeshift schools so that children<br />
do not lose access to education. Through<br />
such initiatives, the capabilities of future<br />
generations can be maintained. Economic<br />
activities can be jumpstarted by reconnecting<br />
people, reconstructing networks and helping<br />
restore the social fabric.<br />
BOX 4.15<br />
Success in reducing maternal and child mortality in Afghanistan<br />
After the collapse of the Taliban in 2002, Afghanistan<br />
adopted a new development path and, with the help<br />
of donors, invested billions of dollars in rebuilding the<br />
country’s economy and health systems. These investments<br />
have improved maternal and child health and<br />
reduced maternal and under-five mortality.<br />
The 2010 Afghanistan Mortality Survey estimated<br />
that there were 327 maternal deaths per 100,000 live<br />
births and 97 deaths among children under age 5 per<br />
1,000 live births.<br />
Decreases in the maternal mortality ratio and the<br />
under-five mortality rate are consistent with changes<br />
in key determinants of mortality, including higher age<br />
at marriage, greater contraceptive use, lower fertility,<br />
better immunization coverage, improvements in<br />
the share of women delivering in health facilities,<br />
more widespread antenatal and postnatal care,<br />
greater involvement of community health workers<br />
and increased access to the basic package of health<br />
services.<br />
Source: Rasooly and others 2014.<br />
126 | HUMAN DEVELOPMENT REPORT <strong>2016</strong>
Addressing climate change<br />
Climate change jeopardizes the lives and<br />
livelihoods of poor and marginalized people<br />
through food insecurity, health and other<br />
risks. Addressing it requires three initial policy<br />
measures.<br />
Putting a price on carbon pollution and<br />
ending fossil subsidies<br />
Putting a price on carbon pollution brings down<br />
emissions and drives investment into cleaner<br />
options. There are several paths governments<br />
can take to price carbon, all leading to the same<br />
result (box 4.16). The choice of the instrument<br />
will depend on national and economic circumstances.<br />
There are also more indirect ways of<br />
accurately pricing carbon, such as through fuel<br />
taxes, the removal of fossil fuel subsidies and<br />
regulations that incorporate a social cost of<br />
carbon. Greenhouse gas emissions can also be<br />
priced through payments for emission reductions.<br />
Private or sovereign entities can purchase<br />
emissions reductions to compensate for their<br />
own emissions (offsets) or to support mitigation<br />
activities through results- based finance.<br />
These measures begin to capture what are<br />
known as the external costs of carbon emissions<br />
— costs that the public pays for in other ways,<br />
such as higher food prices because of damage to<br />
crops, higher health care costs because of heat<br />
waves and droughts, and damage to property<br />
because of flooding and sea level rise — and tie<br />
them to their sources through a price on carbon.<br />
These options are intended to make those<br />
who are responsible for the damage and who<br />
are in a position to limit it pay for remediation.<br />
Rather than placing formal restrictions on<br />
emissions, a price on carbon raises the awareness<br />
of polluters while giving them a choice.<br />
They can interrupt their polluting activities,<br />
find ways to reduce their emissions or agree to<br />
pay the price for the pollution they generate.<br />
This is the most flexible and least costly way for<br />
society to achieve environmental protection.<br />
It is also an efficient way to encourage innovations<br />
in clean technologies while promoting<br />
economic growth.<br />
Approximately 40 countries and more than<br />
20 cities, states and provinces use carbon<br />
pricing mechanisms, and more intend to do<br />
so in coming years. These mechanisms cover<br />
around half of the emissions of these entities,<br />
or 13 percent of annual global greenhouse gas<br />
emissions. 86 The Paris Agreement on climate<br />
change further encourages countries to cooperate<br />
internationally on carbon markets and link<br />
their respective carbon pricing policies.<br />
Getting prices right is only one part of the<br />
equation. Cities are growing fast, particularly<br />
in developing countries. Over half the global<br />
population is urban today; by 2050 that<br />
proportion is expected to reach two-thirds. 87<br />
With careful planning in transport and land<br />
use and the establishment of energy efficiency<br />
standards, cities can avoid locking in unsustainable<br />
patterns. They can open access to jobs and<br />
opportunities for poor people, while reducing<br />
air pollution.<br />
Rather than placing<br />
formal restrictions<br />
on emissions, a price<br />
on carbon raises the<br />
awareness of polluters<br />
while giving them a<br />
choice; it is the most<br />
flexible and least costly<br />
way for society to<br />
achieve environmental<br />
protection<br />
BOX 4.16<br />
Two paths in carbon pricing<br />
There are two main types of carbon pricing: an emissions<br />
trading system and a carbon tax. An emissions<br />
trading system — sometimes referred to as a cap-andtrade<br />
system — caps the total level of greenhouse gas<br />
emissions and allows industries with low emissions to<br />
sell their extra allowances to larger emitters. By creating<br />
supply and demand for emissions allowances,<br />
the system establishes a market price for greenhouse<br />
gas emissions. The cap helps ensure that the required<br />
emission reductions will take place to keep the emitters<br />
(in aggregate) within their preallocated carbon<br />
budget.<br />
A carbon tax directly sets a price on carbon by defining<br />
a tax rate on greenhouse gas emissions or — more<br />
commonly — on the carbon content of fossil fuels. It is<br />
different from an emissions trading system in that the<br />
reduction in emissions as a result of the tax is not predefined,<br />
though the price of carbon is.<br />
Source: World Bank <strong>2016</strong>j.<br />
Chapter 4 Caring for those left out — national policy options | 127
Poor people and<br />
environmental damage<br />
are often caught in a<br />
downward spiral. Past<br />
resource degradation<br />
deepens today’s<br />
poverty, which forces<br />
poor people to deplete<br />
resources to survive<br />
By phasing out harmful fossil fuel subsidies,<br />
countries can reallocate their spending to where<br />
it is most needed and most effective, including<br />
targeted support for poor people. In 2013 global<br />
fossil fuel subsidies totalled $550 billion and<br />
accounted for a large share of some countries’<br />
GDP. 88 Yet fossil fuel subsidies are not about<br />
protecting the poor: The wealthiest 20 percent<br />
of the population captures six times more benefit<br />
from such subsidies than does the poorest<br />
20 percent. 89<br />
Increasing energy efficiency and the use<br />
of renewable energy<br />
About 1.2 billion people worldwide lack access<br />
to electricity, and 2.8 billion rely on solid fuels,<br />
such as wood, charcoal and coal, which cause<br />
noxious indoor air pollution, for cooking. 90<br />
The Sustainable Energy for All Initiative sets<br />
out three goals for 2030: achieve universal<br />
access to modern energy, double the rate of<br />
improvement in energy efficiency and double<br />
the share of renewable energy in the global<br />
energy mix. More than 20 years of effort in improving<br />
energy efficiency have reduced global<br />
energy use to one-third less than it otherwise<br />
would have been. Choosing renewable energy<br />
is more affordable than ever. Prices are falling,<br />
and developing utility-scale renewable energy<br />
is now less expensive than the cost of fossil fuel<br />
facilities in a number of countries. 91<br />
Focusing on the poverty– environment<br />
nexus — complex but critical for<br />
marginalized people<br />
The poverty– environment nexus is complex.<br />
Environmental damage almost always affects<br />
people living in poverty the most. These people<br />
become the major victims of air and water pollution,<br />
experience drought and desertification<br />
and generally live nearest to the dirty factories,<br />
busy roads, waste dumps and ecologically fragile<br />
lands. There is an irony here. Even though<br />
poor people bear the brunt of environmental<br />
damage, they are seldom the creators of it. The<br />
rich pollute more, generate more waste and put<br />
more stress on nature.<br />
Poor people and environmental damage are<br />
often caught in a downward spiral. Past resource<br />
degradation deepens today’s poverty, which<br />
forces poor people to deplete resources to survive.<br />
Biodiversity, on which poor people’s lives, livelihoods,<br />
food and medicine depend, has passed the<br />
precautionary threshold in half the world’s land. 92<br />
It would be too simplistic to explain the<br />
poverty– environment nexus in terms of income<br />
only: Questions about the ownership of natural<br />
resources, access to common resources (such as<br />
water), the strengths and weaknesses of local<br />
communities and local institutions, and ensuring<br />
poor people’s rights and entitlements to resources<br />
are all part of the policy options because<br />
they impact people’s environmental behaviour.<br />
Climate-smart agriculture supports development<br />
while ensuring food security as climate<br />
changes. Using this approach, farmers can raise<br />
productivity and improve their resilience to<br />
climate change. Their farms, along with forests,<br />
can absorb and store carbon, creating carbon<br />
sinks and reducing overall emissions. 93<br />
Through a Poverty–Environment Initiative<br />
led jointly by the United Nations <strong>Development</strong><br />
Programme and the United Nations<br />
Environment Programme, the mutually reinforcing<br />
links between poverty and environment<br />
have been mainstreamed into the national and<br />
local development strategies of 24 countries<br />
and into the sector strategies of 18 countries<br />
in an integrated fashion, focusing on multidimensional<br />
development issues (box 4.17).<br />
Protecting the gains of human development<br />
and stopping the reversals of these gains would<br />
model resilience in concentric circles around<br />
the individual, the family and tight local<br />
groups, the local community, local government,<br />
the state and the planet. The government’s role<br />
is to ensure a balance between the protection<br />
and the empowerment of the individual and<br />
the concentric circles of security providers,<br />
which are either extensions of the individual<br />
or, if they are malfunctioning, the threats to the<br />
individual. Latvia has been at the forefront of<br />
such an approach, which can be replicated in<br />
other parts of the world (box 4.18).<br />
Empowering those left out<br />
If policies do not deliver well-being to marginalized<br />
and vulnerable people and if institutions<br />
fail to ensure that people are not left<br />
out, there must be instruments and redress<br />
128 | HUMAN DEVELOPMENT REPORT <strong>2016</strong>
BOX 4.17<br />
Mainstreaming the poverty– environment nexus<br />
Rwanda has integrated the poverty– environment nexus<br />
and climate objectives and targets into 30 district plans,<br />
as it institutionalizes mainstream approaches to the<br />
poverty– environment nexus and implements poverty–<br />
environment objectives into its National <strong>Development</strong><br />
Plan.<br />
Mongolia’s Green <strong>Development</strong> Policy integrates<br />
poverty– environment objectives and indicators. Substantial<br />
progress was also made in 17 provincial development<br />
plans and in the National Socio-Economic<br />
<strong>Development</strong> Plan (<strong>2016</strong>–2020), in which sustainable<br />
development and inclusive growth are outcomes in support<br />
of the country’s economic development.<br />
A poverty– environment initiative has helped the<br />
government of Guatemala include pro-poor, gender<br />
and sustainable natural resource management objectives<br />
in its National <strong>Development</strong> Plan and regional<br />
development plans. 1 The initiative has trained government<br />
officials on how ecosystem services and valuation<br />
methodologies can contribute to poverty reduction.<br />
Lao People’s Democratic Republic has identified<br />
foreign direct investment in natural resources,<br />
including land, mining and hydropower, as the key<br />
poverty– environment nexus issue. 2 Such investment<br />
was driving rapid economic growth in the country but<br />
degrading the environment of rural communities. The<br />
initiative has helped integrate social and environmental<br />
safeguards into national development planning and<br />
private investment management, including modern<br />
guidelines for new investments and improved monitoring<br />
capacity, in a signal contribution to Sustainable<br />
<strong>Development</strong> Goal target 17.5, to adopt and implement<br />
investment promotion regimes for least developed<br />
countries. 3<br />
Notes<br />
1. UNEP and UNDP <strong>2016</strong>. 2. United Nations 2015c. 3. United Nations 2015c.<br />
Source: GC-RED <strong>2016</strong>.<br />
BOX 4.18<br />
Resilient human development — lessons from Latvia<br />
First, human resilience must be seen though a combined<br />
lens of human development and human security.<br />
Second, human resilience must be embedded in<br />
reality, as follows:<br />
• Information technology and human mobility increase<br />
the impact of individual and global actions.<br />
• There are many development goals and limited resources.<br />
The best development gains result from<br />
smart prioritizing and making good choices.<br />
• The emergence of behavioural economics helps<br />
policymakers address human perceptions.<br />
Third, to prioritize actions, decisionmakers may take<br />
the following steps:<br />
• Ask people to identify the main threats, risks and<br />
barriers to their development, collect data on the<br />
Source: Simane <strong>2016</strong>.<br />
mechanisms so that these people can claim<br />
their rights and demand what they deserve.<br />
Upholding human rights<br />
The landscape of human rights tools for addressing<br />
deprivations and exclusion across the<br />
risks identified, gauge the intensity of the threats<br />
through standard approaches and identify the most<br />
vulnerable groups.<br />
• Address objective and subjective factors because<br />
both affect behaviour.<br />
• Identify and strengthen the factors with the greatest<br />
impact on promoting resilience, remembering<br />
that these factors can be specific to individuals and<br />
communities.<br />
• Foster the abilities of individuals to develop their<br />
own security strategies.<br />
• Ensure efficient security constellations — intersectoral,<br />
multilevel cooperation to help the individual,<br />
community and country to maintain security.<br />
dimensions of human development is complex.<br />
Frameworks are in place to guarantee universal<br />
human rights and justice for all people. But<br />
state commitments to upholding these rights<br />
vary, national institutions have different implementation<br />
capacities and accountability mechanisms<br />
are sometimes missing. The Universal<br />
The landscape of<br />
human rights tools<br />
for addressing<br />
deprivations and<br />
exclusion across<br />
the dimensions of<br />
human development<br />
is complex<br />
Chapter 4 Caring for those left out — national policy options | 129
In an integrated<br />
world, human rights<br />
require global justice<br />
Declaration of <strong>Human</strong> Rights, adopted in<br />
1948, has served as the foundation for global<br />
and national human rights and moral calls<br />
for action. 94 It has drawn attention to human<br />
rights by influencing national constitutions<br />
and prompting international treaties aimed at<br />
protecting specific types of rights, including the<br />
International Covenant on Civil and Political<br />
Rights and the International Covenant on<br />
Economic, Social and Cultural Rights.<br />
Governments have been selective in recognizing<br />
international treaties and vary in<br />
adoption of mechanisms for greater accountability<br />
(figure 4.5). Optional protocols have<br />
been established to provide individuals with a<br />
means to file complaints about rights violations<br />
to international committees. These committees<br />
are entrusted to conduct inquiries into serious<br />
and systematic abuses.<br />
<strong>Human</strong> development for all entails a full<br />
commitment to human rights that, as measured<br />
by ratifications of human rights treaties, has<br />
yet to be made. It also requires strong national<br />
human rights institutions with the capacity,<br />
mandate and will to address discrimination<br />
and ensure the protection of human rights<br />
across multiple dimensions. Such institutions,<br />
including human rights commissions and<br />
ombudsmen, handle complaints about rights<br />
abuses, educate civil society and states about<br />
human rights and recommend legal reforms.<br />
Treating development as a human right has<br />
been instrumental in reducing deprivations in<br />
some dimensions and contexts. For example,<br />
under the Indian Constitution the state must<br />
provide schools within a reasonable distance to<br />
the communities they serve; after this provision<br />
became a motive of public litigation against<br />
the government in the Supreme Court, such<br />
schools were provided.<br />
Treating the full expansion of choices and<br />
freedoms associated with human development<br />
as human rights is a practical way of shifting<br />
highly unequal power balances. <strong>Human</strong> rights<br />
provide principles, vocabularies and tools for<br />
defending the rights, help reshape political dynamics<br />
and open space for social change.<br />
In an integrated world, human rights require<br />
global justice. The state-centred model of<br />
accountability must be extended to the obligations<br />
of nonstate actors and to the state’s obligations<br />
beyond national borders. <strong>Human</strong> rights<br />
cannot be realized universally without well<br />
established domestic mechanisms and stronger<br />
international action (see chapter 5).<br />
Ensuring access to justice<br />
Access to justice is the ability of people to seek<br />
and obtain remedy through formal or informal<br />
judicial institutions. The justice process has<br />
qualitative dimensions and should be pursued<br />
in accordance with human rights principles and<br />
standards. A central feature of the rule of law<br />
is the equality of all before the law — all people<br />
have the right to the protection of their rights<br />
by the state, particularly the judiciary. Therefore,<br />
equal access to the courts and other institutions<br />
of justice involved in enforcing the law is important.<br />
Access to justice goes beyond access to the<br />
formal structures of the courts and the legal system;<br />
it is more than legal empowerment alone.<br />
Poor and disadvantaged people face immense<br />
obstacles, including their lack of awareness and<br />
legal knowledge, compounded by structural and<br />
personal alienation. Poor people have limited access<br />
to public services, which are often expensive<br />
and cumbersome and lack adequate resources,<br />
personnel and facilities. Police stations and<br />
courts may not be available in remote areas, and<br />
poor people can rarely afford the cost of legal<br />
processes, such as legal fees. Quasi-judicial mechanisms<br />
may also be inaccessible or prejudicial.<br />
Obstacles to justice for indigenous peoples<br />
and for racial and ethnic minorities stem from<br />
their historically subordinate status and from<br />
sociopolitical systems that reinforce bias in the<br />
legal framework and the justice system, which<br />
may tend to criminalize the actions of and incarcerate<br />
members of these minorities disproportionately.<br />
This leads to a systemic reinforcement<br />
of weaknesses and susceptibility to abuse by law<br />
enforcement officials.<br />
The political and legal marginalization of<br />
historically oppressed or subordinate groups<br />
can still be seen in these groups’ limited access<br />
to justice. Ethnic minorities, poor rural people<br />
and people displaced by conflict have traditionally<br />
faced some of the largest barriers to justice.<br />
Universal access to justice is particularly<br />
important for marginalized groups. Legal empowerment<br />
and knowledge are essential so that<br />
people can claim their rights. The weakest in<br />
society need them the most. The state-financed<br />
130 | HUMAN DEVELOPMENT REPORT <strong>2016</strong>
FIGURE 4.5<br />
Many countries have not ratified or signed various international human rights instruments<br />
State party Signatory No action<br />
International Convention on the Elimination of<br />
All Forms of Racial Discrimination (1965)<br />
6<br />
14<br />
177<br />
International Covenant on Civil and<br />
Political Rights (1966)<br />
7<br />
22<br />
168<br />
International Covenant on Economic,<br />
Social and Cultural Rights (1966)<br />
6<br />
27<br />
164<br />
Convention on the Elimination of All<br />
Forms of Discrimination against Women (1979)<br />
2<br />
6<br />
189<br />
Convention against Torture and Other Cruel,<br />
Inhuman or Degrading Treatment or Punishment (1984)<br />
10<br />
27<br />
160<br />
Convention on the Rights of the Child (1989)<br />
1<br />
0<br />
196<br />
International Convention on the Protection of the Rights of<br />
All Migrant Workers and Members of their Families (1990)<br />
17<br />
49<br />
132<br />
International Convention for the Protection of all<br />
Persons from Enforced Disappearance (2006)<br />
53<br />
51<br />
93<br />
Convention on the Rights of Persons<br />
with Disabilities (2007)<br />
11<br />
19<br />
168<br />
Source: UNOHCHR <strong>2016</strong>.<br />
Legal Aid Service in Georgia is a promising<br />
example that has produced timely and tangible<br />
results (box 4.19). 95<br />
Promoting inclusion<br />
Countries have deployed various political<br />
approaches in dealing with difference and<br />
diversity among their population and within<br />
borders. Societies have dealt with cultural diversity<br />
and heterogeneous populations through<br />
multiple measures that focus on integration,<br />
assimilation and multiculturalism.<br />
These approaches have often required an<br />
evolving notion of citizenship with socio political<br />
features. These features have had varying effects<br />
Chapter 4 Caring for those left out — national policy options | 131
BOX 4.19<br />
Equality under the law — Georgia’s Legal Aid Service<br />
Georgia’s state-financed Legal Aid Service was established<br />
in 2007 to provide legal advice, particularly to<br />
vulnerable groups, as part of a sweeping package of<br />
judicial reforms. The service operates as an independent<br />
entity accountable to parliament. Its independence<br />
and transparency are safeguarded by the Legal<br />
Aid Council.<br />
The government has established the High School<br />
of Justice to train judicial professionals. 1 Lawyers have<br />
gained public outreach skills, particularly on behalf of<br />
marginalized groups.<br />
Three-quarters of respondents to a 2010 survey rated<br />
the service “very satisfactory,” and 71 percent said<br />
that they had achieved a favourable outcome in court. 2<br />
By 2015 the service had expanded to 18 offices<br />
across the country and had provided free legal assistance<br />
to more than 75,000 people. The majority of<br />
beneficiaries were from the most vulnerable groups<br />
— 57 percent without jobs, 11 percent without the education<br />
to understand legal language, 10 percent socially<br />
vulnerable and 4 percent ethnic minorities. Fifty-eight<br />
percent of users were women.<br />
Notes<br />
1. UNDP <strong>2016</strong>g. 2. UNDP <strong>2016</strong>g.<br />
Source: <strong>Human</strong> <strong>Development</strong> <strong>Report</strong> Office.<br />
The right to information<br />
requires the freedom<br />
to use that information<br />
to form public opinions,<br />
call governments to<br />
account, participate<br />
in decisionmaking and<br />
exercise the right to<br />
freedom of expression<br />
on people’s well-being and human development<br />
priorities because they have had a broad impact<br />
on people’s political freedoms, their relative<br />
position in markets and their status in social<br />
and public life. For example, some 1.5 billion<br />
people worldwide cannot prove who they are. 96<br />
Without birth registration, a birth certificate or<br />
any other identification document, they face barriers<br />
carrying out everyday tasks such as opening<br />
a bank account, accessing social benefits and<br />
obtaining health insurance. New technologies<br />
can help countries build robust and inclusive<br />
identification systems.<br />
Where the deprived, excluded group is a<br />
demographic majority, democratic institutions<br />
may lead to comprehensive policies that reduce<br />
socioeconomic inequalities. This was the case<br />
in post-apartheid South Africa and in Malaysia<br />
following the adoption of the New Economic<br />
Policy in 1970.<br />
Inclusion is at the core of the 2030 Agenda.<br />
The pledge to leave no one behind is embedded<br />
in the vision of a just, equitable, tolerant, open<br />
and socially inclusive world in which the needs<br />
of the most vulnerable are met.<br />
Ensuring accountability<br />
Holding social institutions publicly and mutually<br />
accountable, especially in protecting the rights of<br />
excluded segments of a population, requires explicit<br />
policy interventions. One major instrument<br />
to accomplish this is the right to information.<br />
Since the 1990s more than 50 countries have<br />
adopted new instruments that protect the right<br />
to information. 97 In 2015 more than 100 countries<br />
had national laws or national ordinances and<br />
regulations on the right to information. 98 While<br />
laws on freedom of information were enacted in<br />
advanced industrialized countries to promote<br />
good governance, transparency and accountability,<br />
they had a somewhat different trajectory in<br />
many developing countries (box 4.20).<br />
The right to information requires the freedom<br />
to use that information to form public<br />
opinions, call governments to account, participate<br />
in decisionmaking and exercise the right<br />
to freedom of expression. This right of access<br />
to information places two key obligations on<br />
governments: to publish and disseminate to the<br />
public key information on what public bodies<br />
are doing and to respond by letting the public<br />
view the original documents or receive copies<br />
of documents and information.<br />
Participatory exercises to hold state institutions<br />
accountable, such as public expenditure<br />
tracking surveys, citizen report cards, score cards,<br />
social audits and community monitoring, have<br />
all been used to develop direct accountability relationships<br />
between service users and service providers.<br />
They also provide stakeholder inputs in<br />
deliberative exercises that prioritize and allocate<br />
local services and resources through participatory<br />
budgeting, sector-specific budget monitoring<br />
and participatory audits, all improving citizen engagement<br />
in the management of public finances.<br />
132 | HUMAN DEVELOPMENT REPORT <strong>2016</strong>
BOX 4.20<br />
Right to information — actions in developing countries<br />
Since 2005 India has introduced progressive acts on the<br />
right to socioeconomic entitlements, including information,<br />
work, education, forest conservation, food and public<br />
service. These acts have been marked by their explicit<br />
use of rights-based claims and by the design of innovative<br />
governance mechanisms that seek to enhance the transparency,<br />
responsiveness and accountability of the state. 1<br />
Social audits, defined as mechanisms by which<br />
information on expenditures and implementation problems<br />
is gathered and then presented for discussion in<br />
a public meeting, have become popular, thanks to the<br />
work of the Indian grassroots group Mazdoor Kisaan<br />
Shakti Sangathana. 2<br />
In Bangladesh the Local Government (Union Parishad)<br />
Act 2009 and the Right to Information Act 2009<br />
require disclosure of information on the Union Parishad’s<br />
proposed budget at open meetings and of current development<br />
plans and budgets at citizen gatherings. 3<br />
Mozambique’s Conselhos consultivas (consulting councils)<br />
comprise citizens elected by their communities,<br />
with quotas for community leaders (40 percent),<br />
women (30 percent) and young people (20 percent).<br />
They are intended to establish a public administration<br />
for development as part of a process through which<br />
citizens participate and influence the decisionmaking on<br />
development.<br />
Notes<br />
1. Ruparelia 2013. 2. Joshi 2010. 3. McGee and Kroesschell 2013.<br />
Source: <strong>Human</strong> <strong>Development</strong> <strong>Report</strong> Office.<br />
Such participation is also well recognized as<br />
contributing to human development and to<br />
democratic governance—particularly for those<br />
left out. Empowered voice and participation<br />
have had pro-poor development outcomes as<br />
well as democracy-building outcomes. People’s<br />
freedoms, including those associated with voice<br />
and accountability, can also have instrumental<br />
or indirect value for other development objectives,<br />
because different types of freedoms<br />
can be complementary. Enhancing voice and<br />
accountability can therefore have an impact on<br />
poverty and deprivations.<br />
Conclusion<br />
Advancing human development through<br />
efforts to reach everyone requires meaningful<br />
and well designed policies — including<br />
universal policies with appropriate focus and<br />
reorientation, measures for groups with specific<br />
needs and interventions to protect human development<br />
gains and stop reversals. But policies<br />
supporting national policies will also involve<br />
ensuring people’s participation in influencing<br />
policies and in evaluating development results,<br />
particularly the voice of the marginalized and<br />
vulnerable. For this, the quality and use of data<br />
for evidence-based policymaking will need to<br />
be greatly improved. And the systems and tools<br />
for transparency, accountability and evaluation<br />
will need to be greatly strengthened.<br />
But the relevance and the effectiveness of<br />
national policies depend largely on what happens<br />
globally in terms of issues and institutions,<br />
given the broader bounds of the global community<br />
and global markets. Chapter 5 takes up<br />
that issue.<br />
People’s freedoms,<br />
including those<br />
associated with voice<br />
and accountability,<br />
can have instrumental<br />
or indirect value for<br />
other development<br />
objectives, because<br />
different types of<br />
freedoms can be<br />
complementary<br />
Chapter 4 Caring for those left out — national policy options | 133
Chapter 5<br />
Transforming<br />
global institutions
Infographic 5.1 Challenges and reforms in<br />
global institutions—a summary<br />
Global markets and their regulation<br />
Options for reforming<br />
global institutions<br />
Macroeconomic<br />
stability<br />
Fair trade<br />
and<br />
investment<br />
rules<br />
Fair system<br />
of migration<br />
Global tax<br />
coordination<br />
Structural challenges<br />
in global institutions<br />
Unbalanced<br />
governance<br />
of economic<br />
globalization<br />
Sustainable<br />
global<br />
economy<br />
Multilateral institutions<br />
Greater<br />
equity and<br />
legitimacy<br />
of multilateral<br />
institutions<br />
Well funded<br />
multilateralism<br />
and<br />
cooperation<br />
Inequitable<br />
multilateralism<br />
Underfunded<br />
multilateralism<br />
Challenges<br />
and reforms in<br />
global institutions<br />
Inequitable<br />
globalization<br />
Globally<br />
defending<br />
people’s<br />
security<br />
Reactive<br />
multilateralism<br />
Limited<br />
informed<br />
deliberation<br />
Limited<br />
participation<br />
in multilateral<br />
processes<br />
Limited<br />
inclusiveness<br />
Protect<br />
investigative<br />
journalism<br />
Expand<br />
participation<br />
in multilateral<br />
processes<br />
Promote<br />
and support<br />
inclusive<br />
civil society<br />
networks<br />
Increase<br />
information<br />
flow and<br />
transparency<br />
Global civil society
<strong>Human</strong> <strong>Development</strong><br />
5.<br />
<strong>Report</strong> <strong>2016</strong><br />
<strong>Human</strong> <strong>Development</strong> for Everyone<br />
Transforming global institutions<br />
The current global landscape is very different from what the world faced in 1990. New global challenges threaten the 2030<br />
Agenda for “leaving no one behind.” Inequality and exclusion, violence and extremism, refugees and migration, pollution<br />
and environmental degradation — all are caused by humans and their interactions, particularly across borders. That is why<br />
their solution depends not only on the actions of individual countries, but also on the construction of global collective<br />
capabilities to achieve results that no country can on its own.<br />
All these cases involve global public goods<br />
and spillovers, which have grown in tandem<br />
with globalization and human connectivity.<br />
Uncoordinated national policies addressing<br />
global challenges — cutting greenhouse gas emissions,<br />
protecting labour rights, ensuring minimum<br />
incomes, cooperating to strengthen fragile<br />
states, providing humanitarian aid and refuge to<br />
those extremely endangered — are bound to be<br />
insufficient because of the existence of externalities.<br />
1 So global and regional institutions are necessary<br />
to bring systematic attention, monitoring<br />
and coordination to key global issues.<br />
International institutions and the resulting<br />
global order have enabled considerable progress<br />
in human development. But these institutions<br />
have also coexisted with persistent extreme<br />
deprivation — leaving behind large segments of<br />
the global population — and persistent human<br />
insecurity (see chapters 1 and 2). The mixed<br />
success calls for reforms, with an agenda that<br />
keeps what works and addresses evident gaps.<br />
The main global social institutions —<br />
markets, multilateral organizations and civil<br />
society — are the focus of this chapter. They<br />
include rules and regulations governing the<br />
interchange of goods, services, capital and<br />
labour; multilateral organizations setting and<br />
enforcing the promotion of global public<br />
goods; and global networks of citizens promoting<br />
their diverse interests. The chapter<br />
addresses the structural challenges for human<br />
development, particularly for reaching everyone,<br />
and presents reform options.<br />
On the challenges and structural deficiencies,<br />
the leitmotif is inequality among countries<br />
at different levels of development and<br />
among segments of the global population.<br />
Asymmetries persist in the way countries participate<br />
in global markets, in defining rules, in<br />
financing compensatory mechanisms and in<br />
having the capacity to pursue accountability.<br />
These inequalities constitute barriers to practical<br />
universalism and compromise fairness, as<br />
some groups have decisive advantages in defining<br />
both the rules of the game and the payoffs.<br />
The winners and losers of globalization depend<br />
on the way globalization is pursued.<br />
To respond to these challenges, global institutions<br />
can enhance collective capabilities. They<br />
can expand opportunities for international<br />
exchange (including people, knowledge, goods,<br />
services and capital), both for cooperation and<br />
for participation and accountability. But there<br />
is tension between globalization and democratic<br />
national policymaking. International rules<br />
can constrain some national policies, including<br />
those that today’s developed countries used in<br />
the past. However, it is possible to construct<br />
better global institutions and governance along<br />
the following lines:<br />
• Rules that over-restrict development policies<br />
are not an inevitable result of globalization.<br />
They are the consequence of a particular<br />
path to globalization, where some countries<br />
and some voices have had a greater say at<br />
the negotiating table. But if broader views<br />
are included more systematically and more<br />
equitably, it will be possible to enact human<br />
development–friendly rules for all. In particular,<br />
expanding opportunities requires<br />
that countries retain meaningful space for<br />
national policymaking under democratic<br />
principles.<br />
• The generation of global public goods demands<br />
stronger multilateralism and policy coherence,<br />
able to match the common good with<br />
the common responsibility, all endowed with<br />
legitimacy. For example, curbing the inflow<br />
of migrants cannot be fully separated from<br />
the responsibility to protect people facing<br />
extreme deprivation abroad.<br />
The winners and<br />
losers of globalization<br />
depend on the way<br />
globalization is pursued<br />
Chapter 5 Transforming global institutions | 137
Collective decisions<br />
shape global<br />
institutions — through<br />
the interactions of<br />
different groups,<br />
with varying costs<br />
and benefits<br />
• Developing countries require enhanced capacities<br />
to use globalization for sustainable<br />
development. In the past they have accepted<br />
— through democratic processes — the<br />
restrictions on national policymaking in<br />
investment protection treaties, tax incentives<br />
to foreign companies and the liberalization<br />
of trade. Some of these commitments later<br />
become obstacles for development policies in<br />
some countries.<br />
Structural challenges in<br />
global institutions<br />
<strong>Human</strong> development for everyone requires<br />
identifying relevant barriers to practical universalism<br />
at the level of the main global institutions:<br />
markets, multilateral organizations and<br />
global civil society.<br />
Governance of economic globalization<br />
Unbalanced governance of economic<br />
globalization<br />
The globalization of market institutions regulating<br />
the international flow of goods, services,<br />
capital and labour is neither spontaneous<br />
nor inevitable. The world has previously seen<br />
waves of globalization followed by periods of<br />
protectionism, a result of collective national,<br />
regional and global decisions. Globalization<br />
requires minimum standards, rules and trust.<br />
For individuals globalization can be seen as<br />
intrinsically human development–enhancing,<br />
since it opens new opportunities for interacting,<br />
travelling and investing (an expansion of<br />
individual capabilities). But it also implies exposure<br />
to external shocks through interactions<br />
with other people and nations. Some shocks<br />
will expand capabilities, some will reduce them<br />
(table 5.1). Based on these effects, collective<br />
decisions shape global institutions — through<br />
the interactions of different groups, with varying<br />
costs and benefits.<br />
Multilateral and bilateral organizations<br />
determine the main rules and standards. For<br />
trade in goods and services the World Trade<br />
Organization is the main standard-setting entity:<br />
Member countries are bound by its norms.<br />
For the flow of capital the main mechanisms<br />
of protection are international investment<br />
agreements and bilateral investment treaties.<br />
For the flow of labour there is a mix of bilateral<br />
agreements and international conventions.<br />
The multilateral mechanisms protecting<br />
foreign goods and foreign capital from<br />
TABLE 5.1<br />
Examples of the social benefits and costs of globalizing market institutions<br />
Trade<br />
Finance<br />
Migration<br />
Benefits<br />
• Access to goods and services at a lower price<br />
• Access to larger markets<br />
• Upgrading and diversifying economic structures<br />
• Access to new sources of financing<br />
• Ability for firms to diversify risks by accessing other<br />
markets<br />
• Access to a broader labour market for host countries<br />
• Access to better working and living conditions than in<br />
source countries for migrants<br />
• Remittances for source countries<br />
• Flow of knowledge and culture<br />
Costs<br />
• Unemployment in import-substituting sectors<br />
• Exposure to negative trade shocks<br />
• Reduced space for national policies<br />
• Race to the bottom (workers)<br />
• Financial volatility (exposure to financial shocks)<br />
• Reduced space for national policies<br />
• Race to the bottom (workers, tax systems and<br />
regulations)<br />
• Vulnerability of migrants and their families<br />
• Potential imbalances in service provision in host<br />
countries, particularly in the face of a migration shock<br />
• Gaps in skills and care for countries of origin (“brain<br />
drain”)<br />
Source: <strong>Human</strong> <strong>Development</strong> <strong>Report</strong> Office.<br />
138 | HUMAN DEVELOPMENT REPORT <strong>2016</strong>
discriminatory treatment are much more prevalent<br />
than those protecting foreign workers<br />
from discrimination (figure 5.1). The World<br />
Trade Organization has 164 members subject<br />
to its standards and rules; 181 countries have<br />
signed investment protection treaties, which<br />
provide legal mechanisms for affected corporations<br />
to sue states. But fewer than 50 countries<br />
are committed to protecting migrants, their basic<br />
rights as human beings and their economic<br />
rights as workers.<br />
The asymmetry in multilateral and bilateral<br />
institutions regulating international markets has<br />
affected patterns of globalization. The globalization<br />
of trade has surged since 1990, averaging<br />
6.7 percent growth a year. The globalization of<br />
finance has expanded even faster. Foreign direct<br />
investment increased 8.9 percent a year over<br />
1990–2015. 2 Meanwhile the number of migrants<br />
has grown 1.9 percent a year, keeping the<br />
share of migrants in the world population stable<br />
over the last 25 years, at around 3 percent. 3<br />
Mobility differs for goods, services, capital<br />
and labour. It is more limited for workers<br />
than for goods or for capital, which can move<br />
in seconds. But there has been little progress<br />
in policies favouring labour mobility. About<br />
73 percent of surveyed countries had migration<br />
policies consistent with keeping migration<br />
constant (typically no intervention), 16 percent<br />
had policies to lower migration and only<br />
11 percent had policies to increase it. 4<br />
One of the main costs of globalization is the<br />
transmission of “major” external shocks, those<br />
beyond “normal” cycles. A collapse in terms of<br />
trade because of global recession, a sudden stop<br />
of capital flows or a surge in migrants caused<br />
by a conflict in a neighbouring country are external<br />
events with the potential to create large<br />
cross-border crises. From the point of view of<br />
a particular country, these external shocks are<br />
typically exogenous, but from the point of<br />
view of the international community, they are<br />
endogenous human-caused events. So in many<br />
cases they are preventable. Similarly, once the<br />
shock starts, individual countries rarely have<br />
the capacity to affect its magnitude and duration.<br />
Instead, the coordinated action of many<br />
countries must contain and reduce the negative<br />
effects.<br />
Mobility is more<br />
limited for workers<br />
than for goods or for<br />
capital. But there has<br />
been little progress<br />
in policies favouring<br />
labour mobility<br />
FIGURE 5.1<br />
The number of countries subscribing to multilateral instruments varies<br />
Annual growth of global trade: 6.7%<br />
Annual growth of foreign direct investment: 8.9%<br />
Global openess to trade and investment flow<br />
correlates with high growth rates<br />
Number of<br />
countries<br />
164<br />
181<br />
Annual growth of the global migration: 1.9%<br />
Global protectionism through<br />
limited adoption of migration-related<br />
conventions correlates with low growth rates<br />
49<br />
23<br />
49<br />
World Trade<br />
Organization<br />
(members)<br />
Countries with<br />
a bilateral<br />
investment treaty<br />
Migration:<br />
ILO Convention 97<br />
on Migration for<br />
Employment<br />
Migration:<br />
ILO Convention 143<br />
on Migrant<br />
Workers<br />
International Convention on<br />
the Protection of the Rights<br />
of all Migrant Workers and<br />
Members of their families<br />
Note: Growth rates are for 1990–2015.<br />
Source: World Trade Organization, United Nations Conference on Trade and <strong>Development</strong>, United Nations Department of Economic and Social Affairs, International<br />
Labour Organization and United Nations Treaty Collection.<br />
Chapter 5 Transforming global institutions | 139
The current<br />
architecture of<br />
international<br />
institutions and<br />
unbalanced evolution<br />
of global markets<br />
present challenges to<br />
human development<br />
Inequitable globalization<br />
The current architecture of international institutions<br />
and unbalanced evolution of global markets<br />
present challenges to human development on<br />
two fronts. Some population segments have progressed,<br />
leaving others behind. And unregulated<br />
financial globalization has increased people’s<br />
economic insecurity (see chapters 1 and 2).<br />
Capital tends to be concentrated in the wealthiest<br />
segment of the population, which enjoys the<br />
benefits of mobility and the increasingly flexible<br />
forms of production (global value chains). Some<br />
of the gains are transmitted to the rest of society,<br />
but the positive effects cannot be taken for granted<br />
(box 5.1). The increasingly complex global<br />
economy has also created loopholes that might<br />
accommodate illegal activities and tax evasion,<br />
undermining government effectiveness (box 5.2).<br />
Barriers to migration undermine one path<br />
to development for people in poor countries.<br />
Orderly migration increases opportunities for<br />
people in developing countries. Individuals generally<br />
see moving to another country as a way<br />
to increase their well-being and human development.<br />
More than 75 percent of international<br />
migrants move to a country with higher human<br />
development than in their home country. 5 In<br />
some cases they discover choices they did not<br />
have at home. For instance, women may be allowed<br />
to study and work more freely. Refugees<br />
can escape violence and persecution and hope<br />
that their human rights will be respected.<br />
International migrants are a source of money,<br />
investment and trade for their home country. 6<br />
But the costs of migration can be unacceptably<br />
high. They derive from the lack of protection<br />
of migrants’ basic rights, resulting in,<br />
BOX 5.1<br />
Transnational corporations and human development—no automatic link<br />
Transnational corporations have been one of the most<br />
notable faces of globalization. The stock of foreign direct<br />
investment grew from $2 billion in 1990 to $25 billion<br />
in 2015. 1 This increase has been associated with<br />
investment treaties (see figure 5.1) and national investment<br />
policies liberalizing or promoting foreign direct<br />
investment. An underlying promise is that foreign direct<br />
investment can enhance human development, through<br />
different channels: the increase in productive capacity<br />
(particularly in developing countries, which are capital<br />
scarce), the transfer and diffusion of technology and<br />
knowhow, the creation of employment and skill development<br />
and increases in tax revenues. But these positive<br />
links should not be taken for granted.<br />
• A significant share of foreign direct investment is<br />
devoted to mergers and acquisitions related to existing<br />
assets. In those cases, there is no direct creation<br />
of productive capacity. In 2015, 41 percent of<br />
foreign direct investment inflows were for mergers<br />
and acquisitions. 2<br />
• Foreign direct investment tends to come from and<br />
go to high-income countries. In such economies the<br />
stock of foreign direct investment was 37 percent of<br />
GDP in 2015, compared with 31 percent in transition<br />
countries and 28 percent in developing countries. 3<br />
• Transnational corporations often operate protected<br />
by investment treaties that might prevent the<br />
correction of negative externalities rooted in their<br />
operations. For example, legislative reform in the renewable<br />
energy sector was the top activity by states<br />
pursuing investment arbitration in 2015. Similarly,<br />
the Energy Charter Treaty is by far the most frequently<br />
invoked international investment agreement. 4<br />
• Transnational corporations have been changing the<br />
global pattern of production through global value<br />
chains, geographically fragmenting production processes.<br />
Today around 80 percent of global exports<br />
are nested within global value chains. 5 If a country<br />
imports all high value-added inputs, it might end up<br />
exporting sophisticated final goods with relatively<br />
low value-added. One consequence is that for developing<br />
countries, engaging in a manufacturing<br />
global value chain does not necessarily upgrade<br />
the productive and social structure.<br />
• Transnational corporations often use geographical<br />
fragmentation to avoid taxes. 6<br />
• Another effect of global value chains is the rising<br />
share of value added generated by capital and<br />
high-skilled labour, with pervasive consequences<br />
for the distribution of income across and within<br />
countries (between investors and workers and between<br />
different segments of the population, in general).<br />
7 For example, in Latin America foreign direct<br />
investment widened income gaps. 8<br />
Notes<br />
1. UNCTAD <strong>2016</strong>. 2. UNCTAD <strong>2016</strong>. 3. UNCTAD <strong>2016</strong>. 4. UNCTAD <strong>2016</strong>. 5. Montes and Lunenborg <strong>2016</strong>. 6. Zucman 2015. 7. Timmer and others 2014. 8. Herzer, Huhne and<br />
Nunnenkamp 2014; Suanes <strong>2016</strong>.<br />
140 | HUMAN DEVELOPMENT REPORT <strong>2016</strong>
BOX 5.2<br />
Loopholes of globalization—tax avoidance and illegal financial flows<br />
The mobility of capital in a world of uneven rules has<br />
created loopholes that erode the capacities of national<br />
governments to perform such basic tasks as collecting<br />
taxes and regulating and restricting illegal activities.<br />
Large firms and high-income groups take advantage<br />
of regulatory loopholes on international financial<br />
markets to avoid paying national taxes. Corporations<br />
producing at global scale can shift profits to places<br />
with lower taxes (through transfer pricing and debt restructuring).<br />
For example, in August <strong>2016</strong> the European<br />
Commission determined that the effective corporate tax<br />
rate that Apple paid was 0.005 percent in fiscal 2014,<br />
thanks to a special tax regime in Ireland, where profits<br />
from sales across Europe could be recorded. 1 Similarly,<br />
high-income people can use offshore centres to hide<br />
their money and reduce their tax burden. The wealth in<br />
offshore centres was estimated at $7.6 trillion in 2014,<br />
more than the capitalization of the world’s 20 largest<br />
companies, and the accumulated assets of the wealthiest<br />
1,645 people (see figure). In April <strong>2016</strong> the “Panama<br />
Papers” offered a glimpse into the mechanisms that<br />
wealthy people use in offshore centres. The fiscal cost<br />
to national governments: more than $190 billion a year. 2<br />
Illicit financial flows—money illegally earned, transferred<br />
or used—present a big challenge for developing<br />
countries, particularly those in Africa. The flows weaken<br />
governance and reduce consumption, investment and<br />
social spending, hurting the long-term construction<br />
of collective capabilities and the expansion of human<br />
development. In Africa an estimated $30–$60 billion<br />
Transferring wealth offshore<br />
$ trillions<br />
7.6<br />
Offshore<br />
wealth<br />
Source: Zucman 2015; Forbes FT 500.<br />
5.9<br />
Market capitalization<br />
of the 20 largest<br />
global companies<br />
Comparable to<br />
6.4<br />
Assets of the<br />
wealthiest<br />
1,645 billionaires<br />
a year is lost because of laundering criminal proceeds<br />
associated with human trafficking—corruption that<br />
leads to the theft of state assets, tax abuse and commercial<br />
abuse. In 2001–2010 Africa lost around $400<br />
billion to trade mispricing alone. The size of illicit financial<br />
flows are in the range of total official development<br />
assistance to the region. 3 There are multiple drivers of<br />
illicit financial flows, but the main ones are lack of transparency,<br />
lack of monitoring systems, heterogeneous<br />
tax systems, limited national capacities, incomplete<br />
international architecture and insufficient coordination<br />
among countries, all in a context of economies based on<br />
extractive industries operating under weak institutions. 4<br />
1. European Commission <strong>2016</strong>. 2. Zucman 2015. 3. Over the last 50 years Africa lost an estimated $1 trillion dollars because of illicit financial flows, which is roughly the level<br />
of official development assistance (African Union and Economic Commission for Africa 2015). 4. African Union and Economic Commission for Africa 2015.<br />
Source: <strong>Human</strong> <strong>Development</strong> <strong>Report</strong> Office.<br />
for example, a high death toll among refugees<br />
and widespread human trafficking (as the 2015<br />
<strong>Human</strong> <strong>Development</strong> <strong>Report</strong> documented).<br />
Such costs undermine the globalization of<br />
labour as a vehicle for human development.<br />
The growth in the stock of voluntary migrants<br />
(excluding refugees) fell from 3 percent in<br />
2005–2010 to 1.5 percent in 2010–2015. 7<br />
Imbalances in the governance<br />
of multilateral institutions<br />
Inequitable multilateralism<br />
The governance of multilateral institutions<br />
is important not only for achieving their key<br />
functions, but also for expanding the collective<br />
capabilities among nations. An appropriate<br />
structure ensures the legitimacy and the quality<br />
of the work of such institutions.<br />
The International Monetary Fund (IMF)<br />
helps solve information, commitment and<br />
coordination problems that might affect the<br />
stability and soundness of the global monetary<br />
system. In practical terms it performs<br />
surveillance work (having access to sensitive<br />
information) and acts as a trusted advisor. Its<br />
effectiveness depends on how trustworthy,<br />
competent and impartial countries see it.<br />
The IMF’s governance structure (which<br />
is dominated by Group of 7 countries) matters.<br />
After reforms agreed on in 2010 and<br />
The governance of<br />
multilateral institutions<br />
is important not only<br />
for achieving their<br />
key functions, but<br />
also for expanding the<br />
collective capabilities<br />
among nations<br />
Chapter 5 Transforming global institutions | 141
The rules that govern<br />
international trade<br />
affect national space to<br />
define public policies<br />
implemented in January <strong>2016</strong>, the United States<br />
alone has veto power, with almost 17 percent<br />
of the voting power. Brazil, China, India, the<br />
Russian Federation and South Africa combined<br />
have 14 percent of the voting power. 8 There are<br />
some complaints that lending decisions have<br />
been connected to the borrower’s alignment<br />
with the main shareholders’ interests. 9 For example,<br />
the systemic exemption clause — in effect<br />
during 2010–2015 to assist Greece — allowed<br />
the IMF to provide loans to countries with<br />
unsustainable debts if the countries’ problems<br />
could pose a threat to international financial<br />
stability. 10 The policy has pros (defending global<br />
financial stability) and cons (creating moral<br />
hazard). Such a case also raises an alert about<br />
possible tension at the geopolitical level.<br />
The IMF’s Independent Evaluation Office<br />
found that trust in the organization was variable,<br />
“with authorities in Asia, Latin America<br />
and large emerging markets the most sceptical,<br />
and those in large advanced countries the most<br />
indifferent.” 11 Limited trust affects its role not<br />
only as advisor, but also as lender in times of<br />
crisis. 12 It is argued that as a result of this limited<br />
trust, developing economies have chosen to<br />
accumulate very large reserves as self-insurance,<br />
a choice that is costly for countries and inefficient<br />
(with a recessionary bias) for the world. 13<br />
The World Bank is also governed by shareholders,<br />
predominately Group of 7 countries,<br />
though China became the third largest voter<br />
after the United States and Japan since a 2010<br />
reform. 14 There may be tension between the<br />
goal of eradicating poverty and the goal of<br />
overcoming failures in capital markets and providing<br />
global public goods. 15<br />
The governance of international trade is dominated<br />
by rules — the General Agreement on<br />
Tariffs and Trade and its successor, the World<br />
Trade Organization. They have favoured trade<br />
expansion 16 in a context of generalized trade liberalization<br />
in developing countries as a result of<br />
structural adjustment in the 1980s and 1990s. 17<br />
However, the rules affect national space to define<br />
public policies. 18 In particular, they limit<br />
the use of trade policy to support sectoral or industrial<br />
development (policies used in the past<br />
by today’s developed countries to promote their<br />
industries). 19 In addition, some rules can restrict<br />
the use of social policy, such as India’s National<br />
Food Security Act (box 5.3).<br />
The World Trade Organization’s Doha<br />
<strong>Development</strong> Round offered some space for<br />
rebalancing the rules, this time towards a<br />
development-oriented perspective. But progress<br />
on the key issues of this round, negotiated<br />
since 2001, has been limited. 20 With the Doha<br />
Round stalled, international trade rules have<br />
been dominated by regional and bilateral trade<br />
agreements, where protecting investments<br />
and intellectual property rights have become<br />
central. In practice, industrial countries (the<br />
main source of foreign direct investment and<br />
BOX 5.3<br />
The World Trade Organization and India’s national development policies<br />
India’s National Food Security Act of 2013 grants the<br />
“right to food” in the biggest ever food safety net programme,<br />
distributing highly subsidized food grain (61<br />
million tonnes) to 67 percent of the population. The<br />
scale of buying grain from poor farmers for sale to<br />
poorer consumers put India at risk of violating its World<br />
Trade Organization obligations in agriculture. World<br />
Trade Organization members are subject to trade sanctions<br />
if they breach a ceiling on their agricultural subsidies.<br />
But the method of calculating the ceiling is fixed on<br />
the basis of 1986–1988 prices and in national currency,<br />
an unusually low baseline.<br />
This clear asymmetry in international rules reduces<br />
national space for development policy. India, as other<br />
developing countries, did not have large agricultural<br />
subsidies when the rules were originally agreed. The<br />
act—which aims to stave off hunger for 840 million<br />
people and which can play a pivotal role in the UN<br />
agenda to end hunger everywhere—is being challenged<br />
because it raises India’s direct food subsidy bill from<br />
roughly $15 billion a year to $21 billion. In comparison,<br />
the United States increased its agricultural domestic<br />
support from $60 billion in 1995 to $140 billion in 2013.<br />
The matter has not been resolved, except for a<br />
negotiated pause in dispute actions against countries<br />
with existing programmes that notify the World Trade<br />
Organization and promise to negotiate a permanent<br />
solution.<br />
Source: Montes and Lunenborg <strong>2016</strong>.<br />
142 | HUMAN DEVELOPMENT REPORT <strong>2016</strong>
patents) use such agreements to obtain benefits.<br />
The payments of royalties and licences from developing<br />
to developed countries (particularly<br />
to the United States) have grown immensely<br />
since 1990 (figure 5.2). 21<br />
International investment agreements and<br />
bilateral investment treaties might restrict<br />
governments’ ability to define national policies<br />
and standards. 22 These agreements often define<br />
expropriation as an action that reduces investors’<br />
expected profits—a very broad definition<br />
that is ripe for litigation. 23 An international entity,<br />
in most cases the International Centre for<br />
Settlement of Investment Disputes, resolves disputes<br />
related to these instruments. Proper regulation<br />
of foreign corporations might become<br />
difficult (box 5.4). Most countries have signed<br />
some of the 2,958 bilateral investment treaties<br />
recorded by the United Nations Conference on<br />
Trade and <strong>Development</strong> (see figure 5.1).<br />
With 193 member states and most resolutions<br />
decided by one country–one vote, the<br />
United Nations is perhaps the international<br />
organization with the greatest international<br />
legitimacy. However, asymmetries exist, notably<br />
between developed and developing countries,<br />
tied to two elements.<br />
First, the five permanent members of the<br />
Security Council — China, France, the Russian<br />
Federation, the United Kingdom and the<br />
United States — have veto power. As the only<br />
UN body with the capacity to issue binding<br />
resolutions, the Security Council has a decisive<br />
role in selecting the UN Secretary-General (appointed<br />
by the General Assembly but only on<br />
the recommendation of the Security Council,<br />
according to Article 97 of the UN Charter).<br />
Second, the expenditures of both operational<br />
and peacekeeping activities are funded<br />
largely by a few donor countries. For the UN<br />
system as a whole, 55 percent of resources are<br />
earmarked by donors, meaning that they have<br />
to be spent on specific, predetermined activities.<br />
24 For its operational activities (62 percent<br />
of UN expenditure), core resources (those not<br />
restricted) represent a small and declining proportion<br />
of total funding, falling from 32 percent<br />
in 2003 to 24 percent in 2014 (figure 5.3).<br />
The expenditures<br />
of UN operational<br />
and peacekeeping<br />
activities are funded<br />
largely by a few<br />
donor countries<br />
FIGURE 5.2<br />
Net payments of royalties and licences from developing to developed countries have grown immensely since 1990<br />
$ billions<br />
80<br />
70<br />
60<br />
50<br />
40<br />
30<br />
United States<br />
20<br />
10<br />
0<br />
–10<br />
–20<br />
Low- and middle-income<br />
countries<br />
–30<br />
–40<br />
1980<br />
1985 1990 1995 2000<br />
2005 2010<br />
Source: Montes and Lunenborg <strong>2016</strong>.<br />
Chapter 5 Transforming global institutions | 143
BOX 5.4<br />
Bilateral investment treaties and national policies in Ecuador<br />
In October 2012 an arbitration tribunal of the International<br />
Centre for Settlement of Investment Disputes ruled<br />
against Ecuador in a case brought by Occidental<br />
Petroleum Corporation and Occidental Exploration and<br />
Production Company under the United States–Ecuador<br />
Bilateral Investment Treaty. It imposed a penalty on<br />
Ecuador of $1.8 billion plus compound interest and litigation<br />
costs, bringing the award to $2.3 billion.<br />
What legal observers found striking about this<br />
judgement is that the tribunal recognized that Ecuador<br />
cancelled its contract because the company violated<br />
a key clause (selling 40 percent of the concession to<br />
another company without permission) but found that<br />
Ecuador violated the obligation of “fair and equitable<br />
treatment” under the United States–Ecuador Bilateral<br />
Investment Treaty.<br />
Source: Montes and Lunenborg <strong>2016</strong>; Wallach and Beachy 2012.<br />
FIGURE 5.3<br />
The share of core resources in UN operational activities is low and declining<br />
(%)<br />
32<br />
30<br />
28<br />
26<br />
24<br />
22<br />
0<br />
2003 2004 2005 2006 2007 2008 2009 2010 2011 2012 2013 2014<br />
Source: <strong>Human</strong> <strong>Development</strong> <strong>Report</strong> Office based on ECOSOC (<strong>2016</strong>).<br />
The funding of<br />
global institutions<br />
appears inadequate<br />
for achieving<br />
international targets<br />
Noncore resources, typically earmarked to a<br />
certain thematic or geographical area, have<br />
been increasing, resulting in UN development<br />
agencies having to compete for funding from<br />
donors. While earmarked funds can in some<br />
cases expand the resource envelope, they have<br />
generally crowded out core resources.<br />
Underfunded multilateralism<br />
The resources channelled through the main<br />
global institutions are modest. In 2014 official<br />
development assistance was a mere 0.17 percent<br />
of global GDP. 25 UN spending in 2014 was<br />
0.06 percent of global GDP. 26 Lending from<br />
the main international financial institutions<br />
has also been limited: IMF disbursements<br />
were 0.04 percent of global GDP, 27 and multilateral<br />
development bank disbursements were<br />
0.09 percent of global GDP. 28 If directed to<br />
one goal, these resources make a difference.<br />
But they are often directed to multiple fronts,<br />
some associated with deprivations and some<br />
with global public goods (with increasing demand,<br />
as for peace and security). The European<br />
Union, facing fewer deprivations, manages<br />
around 1 percent of its members’ GDP. 29<br />
The funding of global institutions appears<br />
inadequate for achieving international targets.<br />
The Sustainable <strong>Development</strong> Goals, far<br />
broader than the Millennium <strong>Development</strong><br />
Goals, require investments in developing<br />
144 | HUMAN DEVELOPMENT REPORT <strong>2016</strong>
countries of $3.3–4.5 trillion over the next 15<br />
years. Subtracting current annual investments<br />
of $1.4 trillion, the resource gap is around<br />
$2.5 trillion (around 3 percent of global GDP<br />
in current prices). 30 The global agenda also<br />
demands a strong global approach. The United<br />
Nations — leading this agenda, which includes<br />
several issues intrinsically global, particularly<br />
those related to the environment and climate<br />
change — has a budget that is very small (around<br />
2 percent of the resource gap for achieving the<br />
Sustainable <strong>Development</strong> Goals in developing<br />
countries 31 ).<br />
Nor is the Sustainable <strong>Development</strong> Goals’<br />
more ambitious agenda matched by resources<br />
provided by traditional donor countries through<br />
official development assistance. The typical contribution<br />
of developed countries has with a few<br />
exceptions been consistently below 0.7 percent<br />
of gross national income (GNI), a mark established<br />
in 1970 and reaffirmed by the Monterrey<br />
Consensus in 2002 and by the Sustainable<br />
<strong>Development</strong> Goals last year. In 2014 the average<br />
contribution of donor countries through this<br />
channel was 0.39 percent of GNI. 32<br />
Two problems demand a strong economic<br />
role of global institutions: the underprovision<br />
of public goods when left to voluntary decentralized<br />
decisions, and the imperfections<br />
in capital markets. Reducing carbon dioxide<br />
emissions under the Paris Agreement on climate<br />
change would require annual clean energy<br />
investments equivalent to 1.5 percent of every<br />
country’s GDP. 33 The resource gaps are also<br />
wide for such urgent issues as forcibly displaced<br />
people. Despite record contributions from<br />
donors in 2015 ($3.36 billion), the funding<br />
gap for the Office of the United Nations High<br />
Commissioner for Refugees grew to 53 percent,<br />
from 36 percent in 2010. 34 In <strong>2016</strong> its estimated<br />
funding need is $6.55 billion 35 — equivalent to<br />
0.4 percent of global military expenditure. 36<br />
Reactive multilateralism<br />
Over the last few years the number of countries<br />
in conflict and the number of casualties have<br />
trended upward. 37 Today’s armed conflicts are<br />
increasingly within countries, reducing the<br />
traditional tools of coercive diplomacy and<br />
deterrence. 38 But the consequences are felt globally,<br />
both because the international community<br />
must respond to international terrorism and<br />
violations of human rights and because extreme<br />
human insecurity can be a source of border tensions<br />
and refugee crises. These “new” phenomena<br />
have the following characteristics: 39<br />
• The majority are supported by illegal financing.<br />
• Nonstate actors are much more prominent.<br />
• Civilians account for the vast majority of victims.<br />
40 Of people killed or injured by explosive<br />
weapons in populated areas, 92 percent<br />
are civilians. 41<br />
These crises highlight the weakness of<br />
global institutions, whether their inadequate<br />
response to forced migration or their failure<br />
to prevent crises through bolder development<br />
programmes. In most cases the surge in international<br />
cooperation seems to have waited until<br />
the situation reached a global scale.<br />
International cooperation is based on sovereignty.<br />
Bilateral cooperation takes place<br />
between two sovereign states. Multilateral<br />
cooperation through UN entities is demand<br />
driven: Programmes are agreed with governments.<br />
The underlying assumption is that the<br />
nation-state can protect its citizens, which<br />
is not always the case. But the envelope of<br />
resources also depends on the priorities of<br />
donor countries. Therefore, this system of demand<br />
and supply leaves some people behind.<br />
Consider the three main sources of refugees<br />
in 2010–2015 (Afghanistan, Somalia and<br />
the Syrian Arab Republic). 42 In the late 1990s<br />
they received 0.4 percent of total official development<br />
assistance, despite accounting for<br />
0.8 percent of the population of developing<br />
countries. 43 In the last few years, after the crisis<br />
became a reality affecting other countries, they<br />
received around 5 percent, 44 led more by their<br />
instability than by the root social conditions<br />
causing it.<br />
Untapped potential of<br />
global civil society<br />
Limited participation in multilateral<br />
processes<br />
One notable institutional change over the<br />
past 25 years is the progressive involvement<br />
of global civil society movements in formal<br />
multilateral processes. In 2000 the United<br />
Nations Millennium Declaration encouraged<br />
Today’s armed conflicts<br />
are increasingly<br />
within countries, but<br />
the consequences<br />
are felt globally<br />
Chapter 5 Transforming global institutions | 145
Global social<br />
movements have<br />
spotlighted inequality,<br />
sustainability and<br />
the globalization<br />
of markets<br />
governments to develop strong partnerships<br />
with civil society organizations. 45 The Paris<br />
Declaration on Aid Efficiency in 2005, the<br />
Accra Agenda for Action in 2008 and the<br />
Busan Partnership for Effective <strong>Development</strong><br />
in 2011 all acknowledged civil society’s growing<br />
responsibilities in pursuing the development<br />
agenda. More recently, the post-2015 agenda<br />
for sustainable development brought together<br />
governmental and nongovernmental actors in<br />
dozens of national, regional, global and thematic<br />
consultations. The 2030 Agenda now recognizes<br />
the role of civil society organizations and philanthropic<br />
organizations in its implementation. 46<br />
The United Nations Economic and Social<br />
Council grants consultative status to more than<br />
4,500 nongovernmental organizations, up from<br />
41 at its creation in 1946. 47 Of the nongovernmental<br />
organizations with consultative status,<br />
72 percent were admitted after 2000, and 43 percent<br />
between 2010 and 2015 (figure 5.4). 48<br />
Global social movements have spotlighted<br />
inequality, sustainability and the globalization<br />
of markets. On environmental sustainability<br />
they have been particularly successful in raising<br />
awareness and promoting policies (box 5.5).<br />
Nongovernmental organizations were among<br />
the first stakeholders to bring environmental sustainability<br />
to the attention of the general public<br />
and policymakers in the 1980s and 1990s. Today,<br />
they implement environmental programmes independently<br />
or in partnership with governments<br />
and multilateral institutions. They also monitor<br />
progress and ensure that governments and corporations<br />
respect their commitments.<br />
Limited inclusiveness<br />
Information and communication technologies<br />
have allowed civil society to gather across borders<br />
and share ideas, online or offline, but are unequally<br />
spread around the world. Telecommunication<br />
infrastructure and online participation tools are<br />
positively correlated (figure 5.5). 49 The more a<br />
country’s telecommunication infrastructure is<br />
developed, the more likely the existence of online<br />
mechanisms for civil society participation in public<br />
and political life.<br />
Although less than 5 percent of the world’s<br />
people are native English speakers, 53 percent<br />
of online content is in English. 50 Around 85 percent<br />
of user-generated content on Google today<br />
FIGURE 5.4<br />
Of the more than 4,500 nongovernmental organizations granted consultative status by the United Nations<br />
Economic and Social Council, 72 percent were admitted after 2000<br />
% of nongovernmental organizations<br />
2000–2015<br />
Millennium <strong>Development</strong> Goals<br />
encourage partnerships<br />
with civil society<br />
1996<br />
ECOSOC opens<br />
consultative status<br />
to noninternational<br />
nongovernmental<br />
organizations<br />
55<br />
29<br />
2<br />
0<br />
3 4<br />
6<br />
1946–1955 1956–1965 1966–1975 1976–1985 1986–1995<br />
1996–2005 2006–2015<br />
ECOSOC is the United Nations Economic and Social Council.<br />
Source: ECOSOC 2015.<br />
146 | HUMAN DEVELOPMENT REPORT <strong>2016</strong>
BOX 5.5<br />
Civil society and environment sustainability<br />
The international nongovernmental organization Greenpeace<br />
elaborated one of the first scenarios for mitigating<br />
climate change as early as 1993 and was instrumental in<br />
raising awareness of global warming through protests and<br />
other communications. 1 In the early 1990s it developed a<br />
new technology, Greenfreeze, to build refrigerators without<br />
using chlorofluorocarbons, which deplete ozone. In<br />
1997 the United Nations Environment Programme recognized<br />
Greenpeace’s contributions to protecting the Earth’s<br />
ozone layer. Today, more than 800 million of the world’s<br />
refrigerators use Greenfreeze technology. 2<br />
Civil society organizations have had a major local,<br />
national or global impact on the environment,<br />
through their direct action and their advocacy. Highly<br />
publicized campaigns, in the media or on the streets,<br />
have informed people about environmental issues and<br />
pressured governments to take action. For instance,<br />
Greenpeace research on deforestation in the Amazon<br />
due to the production of soy, followed by protests by the<br />
organization’s activists, led the Brazilian government to<br />
adopt an agreement keeping the rainforest from being<br />
destroyed by soybean farming. 3<br />
Notes<br />
1. IPCC 2000. 2. Greenpeace <strong>2016</strong>a. 3. Greenpeace <strong>2016</strong>b.<br />
Source: <strong>Human</strong> <strong>Development</strong> <strong>Report</strong> Office.<br />
FIGURE 5.5<br />
Good telecommunication infrastructure means<br />
more online participation<br />
E-participation index<br />
0.8<br />
0.6<br />
Upper middleincome<br />
countries<br />
0.4<br />
Lower middleincome<br />
countries<br />
0.2<br />
Low-income<br />
countries<br />
0<br />
0 0.1 0.2 0.3 0.4<br />
Information and communication technology infrastructure index<br />
Source: UNDESA <strong>2016</strong>d.<br />
is produced in Canada, Europe or the United<br />
States. 51 Individuals unable to read or write<br />
English are thus excluded from most of the opportunities<br />
for participation on the Internet.<br />
Limited informed deliberation<br />
High-income<br />
countries<br />
New forms of participation — particularly<br />
though social networks with global reach — are<br />
increasingly important in policymaking. They<br />
are based on fast and decentralized interactions,<br />
which do not always allow proper fact-checking<br />
and analysis. So the policy debate can be too<br />
reactive and based on a short-term news cycle.<br />
Computer-generated fake accounts (bots) can<br />
alter the information that governments and the<br />
media extract from social networks.<br />
Social media can also spread false information.<br />
User-created content allows anyone<br />
to publish anything regardless of its veracity.<br />
Aggregating users by their identity, tastes and<br />
beliefs into “echo chambers” makes it easier to<br />
persuade groups of people. 52 This is reinforced<br />
by a confirmation bias that leads people to focus<br />
on information matching their own opinion<br />
rather than be open to other arguments.<br />
Options for institutional reform<br />
The global order and its effects on human development<br />
depend on the quality of global institutions.<br />
While national policies can facilitate<br />
a country’s insertion in global society, a good<br />
economic, social and political order requires<br />
institutions to coordinate the collective actions<br />
of all countries. The following options for reform<br />
aim to make better global institutions by<br />
promoting global public goods.<br />
Stabilizing the global economy<br />
The history of financial crises shows how capital<br />
markets tend to underestimate risks in times<br />
of liquidity and to overreact in times of trouble.<br />
New forms of<br />
participation —<br />
particularly though<br />
social networks with<br />
global reach — are<br />
increasingly important<br />
in policymaking<br />
Chapter 5 Transforming global institutions | 147
Macroeconomic<br />
coordination among<br />
larger economies is<br />
key to preserving the<br />
public good of stability<br />
Coordinate macroeconomic policies and<br />
regulations<br />
Macroeconomic coordination among larger<br />
economies is key to preserving the public good<br />
of stability. Global imbalances could be more<br />
systematically addressed with greater participation<br />
of the United Nations in Group of 7 and<br />
Group of 20 meetings, on behalf of developing<br />
countries with small economies but great exposure<br />
to external shocks.<br />
The 2008 financial crisis triggered a wide<br />
array of coordination efforts, led by the Group<br />
of 20, around a consensus for countercyclical<br />
fiscal and monetary policy. An important measure<br />
was the heavy capitalization of multilateral<br />
development banks. And the IMF approved<br />
the largest issuance of special drawing rights in<br />
its history ($250 billion), allocating 60 percent<br />
to high-income countries. 53<br />
After the crisis the main central banks (US<br />
Federal Reserve, Bank of Canada, European<br />
Central Bank, Bank of England, People’s Bank of<br />
China and Bank of Japan) used currency swaps to<br />
provide liquidity and stabilize exchange rate markets,<br />
working among themselves and with some<br />
central banks from developing countries. 54 Such<br />
coordination should be enhanced and made more<br />
systematic. One proposal is a global international<br />
reserve system based on special drawing rights and<br />
managed by the IMF, allowing countries to deposit<br />
unused special drawing rights at the IMF, which<br />
could finance its lending operations, facilitating<br />
countercyclical policy and efficient risk sharing. 55<br />
Regulate currency transactions and<br />
capital flows<br />
To help capital markets channel resources from<br />
savers to investors and facilitate the smoothing<br />
of consumption, regulation has become well<br />
accepted, but mainly in the space of banks.<br />
The Financial Stability Board coordinates national<br />
financial authorities and international<br />
standard-setting in their efforts to come up<br />
with regulatory and supervisory policies. But<br />
there has been reluctance to regulate nonbank<br />
international capital flows. 56<br />
One option is to tax international transactions.<br />
A multilateral tax on the four major<br />
trading currencies (with a very small rate of<br />
0.1 percent) could raise roughly 0.05 percent of<br />
global GDP. 57 Such transaction taxes in France<br />
curtail trading volumes and intraday volatility<br />
with negligible effect on liquidity. 58 A multilateral<br />
tax could reduce speculation and the associated<br />
short-term volatility and strengthen the<br />
longer term segments of capital markets, linked<br />
to productive investment.<br />
Another option is to use capital controls.<br />
Even the IMF (which in 1997 attempted to<br />
make capital account liberalization mandatory<br />
for all its members) has recently acknowledged<br />
their benefits, 59 highlighting that they reduced<br />
vulnerabilities (overheating and excessive indebtedness)<br />
before the financial crisis in 2008. 60<br />
Applying fair trade and investment rules<br />
A fair system regulating the flow of goods, services,<br />
knowledge and productive investment is a<br />
global public good. International trade has been<br />
a strong engine of development for many countries,<br />
particularly in Asia. But two problems are<br />
now crucial. First, trade rules — including their<br />
extension to intellectual property rights and<br />
investment protection treaties — tend to favour<br />
developed countries. Second, global trade has<br />
slowed in recent years, which might reduce<br />
opportunities for developing countries. 61 The<br />
international agenda should be to set rules to<br />
expand trade of goods, services and knowledge<br />
to favour human development and the<br />
Sustainable <strong>Development</strong> Goals.<br />
Finalize the World Trade Organization’s<br />
Doha Round<br />
For developing countries, one of the most<br />
important global public goods would be<br />
a fair and well functioning World Trade<br />
Organization. There is hope: As developing<br />
countries have gained negotiating power, multilateral<br />
agreements can, despite their limitations,<br />
become a tool for fairer trade. The Doha<br />
Round intends to add development principles<br />
to trade rules, by introducing implementation<br />
issues to ease the ability of developing countries<br />
to perform World Trade Organization<br />
obligations, by addressing imbalances in agricultural<br />
subsidy regimes and by strengthening<br />
and operationalizing special and differential<br />
treatment (see Sustainable <strong>Development</strong> Goal<br />
target 17.10).<br />
148 | HUMAN DEVELOPMENT REPORT <strong>2016</strong>
Reform the global intellectual property<br />
rights regime<br />
Assessing the usefulness of the current intellectual<br />
property rights regime to meet the<br />
Sustainable <strong>Development</strong> Goals could be a basis<br />
for reform. Two Sustainable <strong>Development</strong><br />
Goals are particularly sensitive to property<br />
rights: the promotion of healthy life and<br />
well-being for all (Sustainable <strong>Development</strong><br />
Goal 3) and the technology facilitation mechanism,<br />
introduced in the Addis Ababa Action<br />
Agenda (Sustainable <strong>Development</strong> Goal 17).<br />
The UN Secretary-General’s High-Level<br />
Panel on Access to Medicines has recommended<br />
that World Trade Organization members<br />
revise agreements on Trade-Related Aspects<br />
of Intellectual Property Rights to enable a swift<br />
and expeditious export of essential medicines<br />
produced under compulsory license to countries<br />
that cannot produce them themselves. 62 In<br />
practice, priority should be given to medicines<br />
on the World Health Organization Model List<br />
of Essential Medicines. A similar principle<br />
should be used with the technology facilitation<br />
mechanism: Every year technologies critical to<br />
achieving the Sustainable <strong>Development</strong> Goals<br />
should be identified (in a forum proposed by<br />
the Addis Agenda), as should the obstacles to<br />
their adoption. In this context, if intellectual<br />
property rights enforced through World Trade<br />
Organization mechanisms prove to be an<br />
obstacle to the timely diffusion of required<br />
technology, the international community<br />
must take a hard look at reshaping the way<br />
such assets are protected and remunerated internationally.<br />
63 Progress in this direction could<br />
be particularly important in fighting climate<br />
change, since technology diffusion is essential<br />
to decouple GDP growth from greenhouse gas<br />
emissions.<br />
Reform the global investor protection<br />
regime<br />
While investors and their property rights have<br />
to be properly defended against arbitrariness,<br />
most bilateral investment treaties with developing<br />
countries have been negotiated asymmetrically.<br />
Developing countries should use the<br />
available legal space to reassess and change the<br />
models of these treaties (box 5.6).<br />
BOX 5.6<br />
Reassessing treaties—some examples<br />
South Africa, after consultations with the investment<br />
community, has allowed existing bilateral investment<br />
treaties to lapse and locates investor protections in a<br />
domestic law effective December 2015.<br />
Brazil has negotiated new treaties with Angola,<br />
Chile, Colombia, Malawi, Mexico, Mozambique and<br />
Peru based on a core model of investment facilitation<br />
and cooperation. The Brazilian approach generally<br />
rejects investor–state arbitration to resolve<br />
disputes.<br />
India’s new model protects the investor instead of<br />
the investment. And it requires the exhaustion of domestic<br />
remedies before arbitration can be triggered.<br />
Source: Montes and Lunenborg <strong>2016</strong>.<br />
Adopting a fair system of migration<br />
Strengthen strategies that protect the<br />
rights of and promote opportunities for<br />
migrants<br />
A first step in implementing a human rights–<br />
based approach to protect migrants is to ratify<br />
the 1990 UN Convention on Migrant Workers<br />
and Their Families. Since migration is also part<br />
of a global economy, its rules should be the<br />
counterpart to fair trade and investment rules,<br />
establishing nondiscriminatory treatment<br />
of national workers. This market-based view<br />
should be subject to negotiation in bilateral<br />
and regional agreements, taking advantage of<br />
similarities among countries.<br />
Migration can continue to be a source of<br />
human development if the long-term needs of<br />
host countries match the interests of migrants.<br />
Voluntary global mobility could benefit from<br />
better coordination among countries of origin,<br />
transit and destination. International agreements<br />
could ensure migrants’ security and<br />
increase their productivity. Training and information<br />
could be provided to migrants in their<br />
country of origin on the opportunities and challenges<br />
they will encounter in their host country.<br />
Governments could exchange administrative<br />
information on migrants to facilitate their<br />
integration. For example, the Bulgarian city of<br />
Kavarna signed an agreement with Polish cities,<br />
where most of its Roma population is employed,<br />
Migration can continue<br />
to be a source of<br />
human development<br />
if the long-term needs<br />
of host countries<br />
match the interests<br />
of migrants<br />
Chapter 5 Transforming global institutions | 149
Since displacement<br />
lasts on average<br />
17 years, the<br />
journeys of forcibly<br />
displaced people<br />
require international<br />
coordination and<br />
agreement<br />
to ensure their right to work, allow them to start<br />
companies and facilitate tax collection. 64 The<br />
Romas’ economic success improved how the<br />
host community perceived them.<br />
Establish a global mechanism to<br />
coordinate economic migration<br />
The International Organization for Migration<br />
joined the UN system in September <strong>2016</strong><br />
(box 5.7). Long-term migration policies, with<br />
a human development perspective, require<br />
continuous and consistent coordination and cooperation<br />
at all levels. As part of the UN system<br />
the International Organization for Migration<br />
becomes a permanent member of the Chief<br />
Executives Board, the highest entity for UN<br />
coordination, and its subsidiary bodies. The<br />
International Organization for Migration is now<br />
formalized in UN country teams as part of the<br />
UN <strong>Development</strong> Assistance Framework. It is<br />
poised to be the main supporter of negotiations<br />
to adopt the Global Compact for Safe, Orderly<br />
and Regular Migration, scheduled for 2018.<br />
Facilitate guaranteed asylum for forcibly<br />
displaced people<br />
The 1951 Refugee Convention and its<br />
1967 Protocol oblige countries to welcome<br />
asylumseekers on their territories and to not<br />
send them back where their lives may be at risk.<br />
Only 148 of 193 UN member states are party<br />
to the convention or its protocol.<br />
The safety of forcibly displaced people<br />
during their journey must also be ensured<br />
through humanitarian aid or organized transportation.<br />
Since displacement lasts on average<br />
17 years, their journeys require international<br />
coordination and agreement to share the responsibility<br />
of care in times of emergency and<br />
in the longer term. 65 In the Kenyan refugee<br />
camp of Kalobeyei, refugees have been granted<br />
plots of land and the right to sell their produce<br />
and to open businesses for more sustainable<br />
livelihoods. 66<br />
Coordinating taxes and<br />
monitoring finance, globally<br />
One of the pillars of human development is a<br />
system of taxation to finance key human development<br />
priorities. But the recent wave of globalization<br />
has been weakening governments’ ability to<br />
collect taxes and curb illicit financial flows.<br />
Move towards a global automatic<br />
exchange of information from financial<br />
institutions<br />
A global financial register, recording ownership<br />
of all financial securities in circulation in the<br />
world, would facilitate the work of tax and<br />
regulatory authorities tracking income and<br />
BOX 5.7<br />
International Organization for Migration—a new member of the UN family<br />
The International Organization for Migration—the lead<br />
global agency on migration—joined the UN system as a<br />
related organization in September <strong>2016</strong>, precisely when<br />
the international community faced the task of coordinating<br />
a holistic approach to the global challenge of large<br />
movements of migrants and refugees. It embraces areas<br />
as diverse as migration, humanitarian assistance (including<br />
food security), public health and labour markets. With<br />
its new status, cooperation with UN agencies, funds and<br />
programmes will be deepened on substantial issues as<br />
well as in such areas as administrative cooperation, reciprocal<br />
representation and personnel arrangements.<br />
As part of a regional response to the Syrian crisis,<br />
the International Organization for Migration provided<br />
assistance for 4 million people in Iraq, Jordan, Lebanon,<br />
the Syrian Arab Republic and Turkey. 1 It has room for<br />
cooperation with the Office of the High Commissioner<br />
for Refugees and other specialized UN agencies, funds<br />
and programmes. It is expected to play a key role from a<br />
migration perspective in the long-term normalization of<br />
the crisis, providing services in prescreening, counselling,<br />
medical processing, training, transport, reception<br />
and integration. 2<br />
Notes<br />
1. IOM <strong>2016</strong>a, <strong>2016</strong>b. 2. UNHCR 1997.<br />
Source: <strong>Human</strong> <strong>Development</strong> <strong>Report</strong> Office.<br />
150 | HUMAN DEVELOPMENT REPORT <strong>2016</strong>
detecting illicit flows. This is feasible if existing<br />
registries from main markets are centralized<br />
and expanded to include derivatives. 67<br />
On-demand information (for example, one<br />
government requesting information about<br />
some taxpayer) is not effective, since it has to<br />
go through an investigation with limited information<br />
(precisely why information is being<br />
requested). But an active global mechanism is<br />
feasible. In 2010 the US Congress passed the<br />
Foreign Account Tax Compliance Act, which<br />
requires financial institutions in the world to<br />
inform US tax authorities of assets held by US<br />
citizens. 68<br />
Integrated information systems can reduce<br />
illicit financial flows, enabling authorities at<br />
both ends of the flows to act against them.<br />
For instance, the destination of illicit flows<br />
from Africa is concentrated in its main trading<br />
partners (Canada, China, Europe, India, Japan,<br />
the Republic of Korea and the United States). 69<br />
Given the institutional weakness of most<br />
African countries, their trading partners could<br />
boost transparency.<br />
Increase technical capacity of countries<br />
to process information and implement<br />
active policies against tax evasion, tax<br />
avoidance and illicit flows<br />
To make the globalization of information<br />
work in favour of public policies, governments<br />
require preparation. Even if information about<br />
foreign assets becomes readily available as the<br />
result of a data revolution, its effectiveness will<br />
depend on adequate and systematic analysis.<br />
So international cooperation should support<br />
the development of technical capacity in this<br />
area.<br />
Making the global economy sustainable<br />
The Paris Agreement on climate change is a<br />
milestone but will not be enough in itself.<br />
Experts agree that countries’ current pledges<br />
to reduce greenhouse gas emissions (intended<br />
nationally determined contributions) will not<br />
keep global warming below the critical level of<br />
1.5°–2°C above preindustrial levels. 70 In fact,<br />
if all countries were to keep to their pledges,<br />
the global mean temperature would rise 2.4°–<br />
2.7°C by 2100. 71<br />
Yet curbing global warming is possible.<br />
Coordinated global action has worked well in<br />
the past, as in moves to halt ozone depletion<br />
in the 1990s. The 1987 Montreal Protocol<br />
on Substances That Deplete the Ozone Layer<br />
and subsequent compliance by signatory states<br />
led to a sharp decline in atmospheric chlorine,<br />
which depletes the ozone layer. 72 Then, however,<br />
both the problem and the solution appeared<br />
much more straightforward. Now the world<br />
has a clear diagnosis of the problem associated<br />
with greenhouse gases, but the solution is not as<br />
clear and even less incentive-compatible. Still,<br />
things may be changing: A proposed plan to<br />
raise global investment in energy efficiency and<br />
to expand renewable energy from the current<br />
0.4 percent of GDP a year to 1.5–2 percent<br />
of GDP a year would reduce carbon dioxide<br />
emissions 40 percent over 20 years, to levels<br />
consistent with a limited increase in temperatures,<br />
and have positive net macroeconomic<br />
effects. 73 With enough political commitment,<br />
these targets are feasible.<br />
Technological development has already<br />
allowed the decoupling of economic growth<br />
and carbon dioxide emissions in 21 countries,<br />
including Germany, Spain, Sweden, the United<br />
Kingdom and the United States. 74 World<br />
economic growth in 2014 and 2015 was not<br />
accompanied by emissions growth. 75 So there<br />
is space for a good equilibrium. If countries<br />
have access to those technologies through new<br />
investments, a decisive investment plan can<br />
overcome the feared tradeoff between faster<br />
economic development and lower greenhouse<br />
gas emissions.<br />
Environmentally sustainable policies are not<br />
only the right thing to do for future generations,<br />
they are also an effective way of promoting<br />
human development now. An aggressive investment<br />
plan is likely to have a positive effect<br />
on job creation, based on estimates in Brazil,<br />
China, Germany, India, Indonesia, the Republic<br />
of Korea, South Africa, Spain and the United<br />
States. In India increasing clean energy investments<br />
by 1.5 percent of GDP a year for 20 years<br />
will generate a net increase of about 10 million<br />
jobs annually, after factoring in job losses from<br />
retrenchments in the fossil fuel industries. 76<br />
Continuing advocacy and communication<br />
on the need to address climate change and<br />
protect the environment are essential to gather<br />
Technological<br />
development has<br />
already allowed<br />
the decoupling of<br />
economic growth<br />
and carbon dioxide<br />
emissions in 21<br />
countries<br />
Chapter 5 Transforming global institutions | 151
Today’s new realities<br />
and aspirations<br />
call for improved<br />
representation of<br />
developing countries<br />
in the governance<br />
of multilateral<br />
organizations<br />
support from governments, corporations and<br />
individuals. Technological advances and better<br />
knowledge of impacts on the environment have<br />
provided the tools to correct ways of living,<br />
consuming and producing. This correction will<br />
come with a cost, including inevitable job losses<br />
in polluting industries. But the 2015 <strong>Human</strong><br />
<strong>Development</strong> <strong>Report</strong> exposed different ways<br />
to respond to this challenge, such as targeted<br />
social policies and the development of new<br />
professional skills for affected workers. 77<br />
A good balance requires access to technology,<br />
economic incentives aligned with green<br />
investment, and resources to invest. Indeed,<br />
efficiency and sustainability depend on identifying<br />
the “right” social costs of the different<br />
types of energy and on tackling failures in credit<br />
markets.<br />
One promising option is to expand access to<br />
credit through national and multilateral development<br />
banks. Germany is a world leader in<br />
energy efficiency thanks to the decisive action<br />
of Germany’s state-owned development bank,<br />
Kf W. Its loans and subsidies for investment in<br />
energy-efficiency measures in buildings and industry<br />
have leveraged voluminous private funds.<br />
And the recently created New <strong>Development</strong><br />
Bank, which is expected to emphasize sustainable<br />
development and renewable energy, has<br />
explicitly committed to giving priority to clean<br />
energy projects. In <strong>2016</strong> it approved its first<br />
package of loans worth $811 million to Brazil,<br />
China, India and South Africa.<br />
Assuring greater equity and legitimacy<br />
of multilateral institutions<br />
With today’s new realities the time has come to<br />
examine the governance structures of multilateral<br />
institutions.<br />
Increase the voice of developing<br />
countries in multilateral organizations<br />
There has been progress over the last few years<br />
with the recapitalization of the IMF and multilateral<br />
development banks to face the financial<br />
crisis, but most developing countries remain<br />
under-represented. The UN Security Council<br />
should open more space for developing countries.<br />
Today’s new realities and aspirations call<br />
for improved representation of developing<br />
countries in the governance of multilateral<br />
organizations.<br />
Improve transparency in appointing<br />
heads of multilateral organizations<br />
The appointment process of heads of multilateral<br />
organizations should be more transparent.<br />
The lack of transparency limits the opportunity<br />
to shape each organization for future<br />
challenges. In <strong>2016</strong> the United Nations made<br />
some progress on this front, with the election<br />
of the Secretary-General preceded by public<br />
declarations of candidacies and public informal<br />
dialogues with member states. This progress<br />
should continue with more robust processes in<br />
all multilateral organizations.<br />
Increase coordination and effectiveness<br />
to achieve people-centred goals<br />
The performance of multilateral institutions<br />
should be assessed on people’s agency and<br />
well-being. The multilateral system is committed<br />
to achieving the Sustainable <strong>Development</strong><br />
Goals by 2030. This powerful agenda might require<br />
institutional adjustments, such as reshaping<br />
entities to strengthen coherence, increase<br />
accountability and ensure synergy, or binding<br />
mechanisms to make effective the common<br />
but differentiated responsibility of countries.<br />
The advancement of disadvantaged groups in<br />
many parts of the world depends heavily on the<br />
consistent work of multilateral organizations<br />
(box 5.8).<br />
Ensuring well funded<br />
multilateralism and cooperation<br />
The international community should expand<br />
the resource envelope for global action, including<br />
global financing for national development<br />
and for institutional public goods.<br />
Strengthen multilateral and regional<br />
development banks<br />
Multilateral and regional development banks<br />
can address the lack of resources to support<br />
poverty eradication, the knowledge gaps in<br />
policymaking, the market failures affecting<br />
the financing of socially valuable projects<br />
152 | HUMAN DEVELOPMENT REPORT <strong>2016</strong>
BOX 5.8<br />
Global institutional developments promoting women’s inclusion<br />
Global institutions supporting gender equality and<br />
women’s empowerment have evolved over the last<br />
three decades. In addition to the continuing work of the<br />
Commission on the Status of Women (since 1946) and<br />
the 1979 Convention on the Elimination of all Forms of<br />
Discrimination against Women, two important processes<br />
have been under way.<br />
First, the institutional architecture has been expanded<br />
since the 1995 Beijing Platform for Action, which defined<br />
strategic objectives and actions by governments,<br />
regional organizations, multilateral organizations and<br />
private sector and civil society organizations. In July<br />
2010 the United Nations Entity for Gender Equality<br />
and the Empowerment of Women, also known as UN<br />
Women, was created to consolidate the mandates of<br />
four previously separate entities in the UN system and<br />
to lead, coordinate and promote the accountability of<br />
the UN system in its work on gender equality and women’s<br />
empowerment.<br />
Second, the normative work on gender equality<br />
and women’s empowerment has been progressively<br />
mainstreamed through different instruments, following<br />
the rights-based and evidence-based premise that<br />
improving the situation of women is not only a moral<br />
imperative, but also a prerequisite and an effective—<br />
and indispensable—development tool. In 2000 the<br />
UN Security Council approved the landmark resolution<br />
1325, stressing the key role of women in preventing<br />
and resolving conflicts through peace negotiations,<br />
peacebuilding, peacekeeping, humanitarian responses<br />
and postconflict reconstruction. In 2015 it approved<br />
resolution 2242, strengthening the agenda for Women,<br />
Peace and Security within the UN system and defining<br />
the accountability of all peace actors, including UN<br />
peacekeepers.<br />
The dual role of gender equality and women’s empowerment—as<br />
a means and end of human development—has<br />
been consistently reflected in the global<br />
development agenda. In the Millennium <strong>Development</strong><br />
Goals and in the 2030 Agenda and the Sustainable<br />
<strong>Development</strong> Goals, gender equality and women’s empowerment<br />
appear both as standalone goals and part<br />
of most development objectives. This view, in turn, has<br />
trickled down to other multilateral, regional, national<br />
and local government entities, supported by a global<br />
network of civil society organizations.<br />
A majority of developing regions have achieved<br />
gender parity in primary education, and gaps have narrowed<br />
in secondary and tertiary education. But in most<br />
areas progress has been too slow and uneven. 1 One important<br />
global institutional challenge is to generate accurate<br />
and updated sex-disaggregated statistical data<br />
and information for all countries, particularly in lagged<br />
statistical areas such as time use, essential for comprehensive<br />
analysis of the economic and noneconomic situation<br />
of women and men in a rapidly changing world.<br />
Note<br />
1. UNDESA 2015e.<br />
Source: <strong>Human</strong> <strong>Development</strong> <strong>Report</strong> Office.<br />
(local, national, regional or global) and financial<br />
instability.<br />
The World Bank Group is the most important<br />
multilateral development bank (with around<br />
50 percent of multilateral development bank<br />
disbursements over 2004–2012). 78 Founded to<br />
address market failures in international capital<br />
markets, it now has the primary goal of reducing<br />
extreme poverty. It is also a knowledge bank,<br />
collecting and disseminating data and ideas.<br />
Multilateral and regional development banks<br />
played an active countercyclical role in the financial<br />
crisis of 2008, a role to be strengthened.<br />
For example, the multilateral development<br />
banks increased their lending to developing and<br />
emerging countries 72 percent between 2008<br />
and 2009, precisely when private capital markets<br />
were contracting their flows of resources. 79<br />
They reacted quickly to the paralysis in private<br />
trade financing, committing to $9.1 billion,<br />
on top of the $3.2 billion they were already<br />
providing. The Group of 20 agreed in 2009<br />
to support the recapitalization of multilateral<br />
development banks. 80<br />
<strong>Development</strong> banks can catalyse long-term<br />
private financing and thus leverage public<br />
resources. For example, in 2012 the European<br />
Investment Bank doubled its paid-in capital by<br />
€10 billion, which increased its lending capacity<br />
by €80 billion. Given typical cofinancing<br />
of at least 50 percent by private investors, this<br />
opened financing space of €160 billion. 81 If<br />
multilateral development banks diversify, they<br />
can accommodate broader objectives in line<br />
with the Sustainable <strong>Development</strong> Goals. In<br />
the last few years two very large multilateral<br />
Multilateral and<br />
regional development<br />
banks played an<br />
active countercyclical<br />
role in the financial<br />
crisis of 2008, a role<br />
to be strengthened<br />
Chapter 5 Transforming global institutions | 153
FIGURE 5.6<br />
Developing countries would<br />
add $191 billion to official<br />
development assistance by<br />
meeting their contribution<br />
target of 0.7 percent of gross<br />
national income<br />
$ billions<br />
135<br />
Actual<br />
2014<br />
326<br />
Potential<br />
2014<br />
Source: <strong>Human</strong> <strong>Development</strong> <strong>Report</strong> Office<br />
calculations based on UNSD (<strong>2016</strong>).<br />
development banks have been created: the<br />
Asian Infrastructure Investment Bank, supporting<br />
an infrastructure-led view of development<br />
and a regional emphasis (box 5.9), and the New<br />
<strong>Development</strong> Bank, emphasizing sustainable<br />
development and renewable energy.<br />
Increase official development assistance<br />
from traditional donors<br />
Developed countries should increase their contributions<br />
to official development assistance,<br />
meeting their commitment of 0.7 percent of<br />
gross national income (supported in the Addis<br />
Ababa Agenda and a target under Sustainable<br />
<strong>Development</strong> Goal 17). Meeting this target<br />
would have added an estimated $191 billion to<br />
actual official development assistance in 2014,<br />
an increase of 141 percent (figure 5.6). Meeting<br />
this Sustainable <strong>Development</strong> Goal target<br />
would be crucial to achieve other Sustainable<br />
<strong>Development</strong> Goals, in particular in the least<br />
developed countries — unable to mobilize domestic<br />
resources or access private international<br />
capital markets.<br />
Expand the participation of developing<br />
countries through South–South and<br />
triangular cooperation<br />
With the rise of donors that do not form<br />
part of the Organisation for Economic Cooperation<br />
and <strong>Development</strong>—<strong>Development</strong><br />
Assistance Committee, the landscape of<br />
development cooperation has been changing,<br />
with South-South cooperation and triangular<br />
cooperation gaining importance. The first is<br />
a long-standing form of international cooperation<br />
with its roots in the 1970s; the second<br />
emerged at the end of the 1990s. In both forms<br />
developing countries share skills, knowledge<br />
and resources to meet their development<br />
goals. Triangular cooperation includes either a<br />
<strong>Development</strong> Assistance Committee donor or<br />
a multilateral institution, facilitating funding,<br />
training and management. As suggested by<br />
the Paris Declaration for Aid Effectiveness, 82<br />
developing countries should assume ownership<br />
of technical cooperation projects and carefully<br />
select areas of cooperation and partner countries<br />
according to their needs.<br />
BOX 5.9<br />
The new regional development bank—for infrastructure in Asia<br />
Regional development banks provide technical and<br />
financial assistance to developing countries through<br />
technical cooperation, grants and low-interest loans.<br />
Traditionally the regional development banks have included<br />
the African <strong>Development</strong> Bank, the Asian <strong>Development</strong><br />
Bank, the European Bank for Reconstruction<br />
and <strong>Development</strong> and the Inter-American <strong>Development</strong><br />
Bank. The Asian Infrastructure Investment Bank, a major<br />
new institution, emerged in January <strong>2016</strong>.<br />
Considering the substantive challenge of reaching<br />
the Sustainable <strong>Development</strong> Goals by 2030, the regional<br />
development banks complement global cooperation.<br />
They can disseminate region-specific knowledge,<br />
align their programmes and projects to region-specific<br />
challenges and appear as more legitimate regional actors<br />
than global institutions. The Asian Infrastructure<br />
Investment Bank is the first major regional development<br />
bank funded mainly by the region’s emerging economies.<br />
Of $85.9 billion in subscriptions, China contributes<br />
34.7 percent, India 9.7 percent and the Russian<br />
Federation 7.6 percent. This reflects a shift towards a<br />
greater role for emerging countries in development finance,<br />
with potentially important implications for global<br />
governance, including more diverse sources of finance<br />
for developing and emerging country borrowers as well<br />
as more favourable lending conditions.<br />
The Asian Infrastructure Investment Bank’s mandate<br />
is slightly different from that of other development<br />
banks in that it emphasizes investing in infrastructure<br />
and other productive areas rather than directly targeting<br />
poverty reduction and social protection.<br />
The expansion of regional development banking is<br />
a major step in development policies, but also a management<br />
and governance challenge. Griffith-Jones<br />
(<strong>2016</strong>) underscores clear targets in the context of clear<br />
development frameworks; good governance to increase<br />
efficiency and promote alignment with national development<br />
strategies; correct incentives for bank staff and for<br />
borrowers to ensure that loans maximize development<br />
impact and ensure a minimum commercial return; transparency<br />
of operations; and technical assistance to limit<br />
adverse social and environmental effects in operations.<br />
Source: <strong>Human</strong> <strong>Development</strong> <strong>Report</strong> Office.<br />
154 | HUMAN DEVELOPMENT REPORT <strong>2016</strong>
Although financial contributions from most<br />
non–<strong>Development</strong> Assistance Committee<br />
donors are not officially reported to the<br />
Organisation for Economic Co-operation and<br />
<strong>Development</strong>, some estimates provide insights<br />
on the increasing amount of these financial<br />
flows to developing countries. Saudi Arabia,<br />
as the largest non–<strong>Development</strong> Assistance<br />
Committee donor in financial terms, provided<br />
$13.7 billion in 2014, followed by the United<br />
Arab Emirates, with $5.1 billion the same year.<br />
China increased its aid flows from $2.6 billion<br />
in 2010 to $3.4 billion in 2014, and India<br />
from $708 million to $1.4 billion. Substantial<br />
resources also came from Qatar ($1.3 billion in<br />
2013), the Russian Federation ($876 million in<br />
2014), Mexico ($529 million in 2013), Brazil<br />
($500 million in 2010) 83 and South Africa<br />
($148 million in 2014). Smaller countries such<br />
as Chile and Costa Rica have also contributed<br />
($49 million and $24 million, respectively, in<br />
2014), especially in triangular cooperation<br />
agreements with other donors. 84<br />
South–South cooperation has become popular<br />
because of several comparative advantages<br />
of developing countries. First, given their own<br />
very recent path to development, they are more<br />
familiar with recent development challenges.<br />
Second, many southern countries share the<br />
same development contexts and perspectives<br />
background as their cooperation partners. Third,<br />
some South–South cooperation projects may be<br />
more cost-efficient than traditional technical<br />
cooperation. Shorter distances between partner<br />
countries can reduce travel costs, while fees for<br />
translation are saved when the two partner countries<br />
speak the same language (table 5.2).<br />
Triangular cooperation has benefits similar<br />
to those of South–South cooperation. An example<br />
of triangular cooperation is Germany’s<br />
support for Brazil and Peru to create a Centre<br />
for Environmental Technology. The centre<br />
trains experts in air technology, the Clean<br />
<strong>Development</strong> Mechanism, regeneration of<br />
degraded areas, energy efficiency, renewable<br />
energy and innovations in environmental<br />
technologies. 85 It was jointly funded by the<br />
German Regional Fund for the Promotion of<br />
Triangular Cooperation in Latin America and<br />
the Caribbean and the Brazilian and Peruvian<br />
governments.<br />
Another example of triangular cooperation<br />
is Brazil’s Centre of Excellence against Hunger.<br />
A joint initiative between the World Food<br />
South–South<br />
cooperation has<br />
become popular<br />
because of several<br />
comparative<br />
advantages of<br />
developing countries<br />
TABLE 5.2<br />
South–South cooperation advantages in Asia and Latin America<br />
Comparative advantage of southern partners<br />
Expertise through recent path to development<br />
Alignment thanks to regional background—and cost-efficiency<br />
South–South cooperation example<br />
Based on India’s outstanding capacities in information and<br />
communication technology, the Indian government established<br />
the Indian Technical and Economic Cooperation Civilian Training<br />
Programme. The purpose is to share expertise in information<br />
technology, telecommunication, management, renewable energy,<br />
small and medium-size enterprise, rural development and other<br />
specialized disciplines. Financed with some $32 million by the<br />
Indian government, 10,000 participants, mostly from the least<br />
developed countries, were trained in 2014–2015. a<br />
Argentina and Colombia are cooperating in the peace<br />
negotiations between the Colombian government and the<br />
Fuerzas Armadas Revolucionarias de Colombia. The two<br />
countries are working on a database with genetic profiles of<br />
people who disappeared during the conflict to identify and<br />
register victims. This work aims at establishing justice and<br />
reparation for the victims’ families. The common regional<br />
background, including the same language and similar culture,<br />
can be useful in this delicate work.<br />
a. Asia Foundation 2015.<br />
Source: <strong>Human</strong> <strong>Development</strong> <strong>Report</strong> Office.<br />
Chapter 5 Transforming global institutions | 155
The existing<br />
multilateral institutions<br />
have a longestablished<br />
legitimacy<br />
and functioning<br />
capacity to convene<br />
states around common<br />
actions. But they<br />
require substantial<br />
reforms to address<br />
today’s issues<br />
Programme and the Brazilian government, the<br />
centre makes the successful Brazilian strategy<br />
of addressing Zero Hunger available to other<br />
developing countries. Brazil had reduced the<br />
number of people suffering from hunger from<br />
22.8 million in 1992 to 13.6 million in 2012. 86<br />
The centre, launched in 2011, aims to improve<br />
food security, social protection and school<br />
attendance (through school feeding) in developing<br />
countries—mostly in Africa but also in<br />
Asia and Latin America — through training,<br />
workshops, technical missions and national<br />
consultations. 87<br />
Explore options for funding global public<br />
goods<br />
In view of conflicts, insecurity, financial volatility<br />
and environmental degradation, awareness<br />
of the need to provide global public goods<br />
is increasing, but collective action problems<br />
encourage states to free ride. That is why such<br />
goods are hugely underfunded.<br />
One option is the traditional mechanism<br />
of UN financing, included in the Charter<br />
of the United Nations: “The expenses of the<br />
organization shall be borne by the Members<br />
as apportioned by the General Assembly.” In<br />
2014 assessed contributions accounted for<br />
around 29 percent of UN system revenues,<br />
more than half of which were devoted to<br />
peacekeeping operations. 88 Given the growing<br />
share of earmarked resources, enhanced mandatory<br />
assessed contributions can be explored<br />
to increase the global collective capabilities to,<br />
for example, deal with crises — such as climate<br />
mitigation and adaptation —that have global<br />
repercussions. Contributions can be an incentive<br />
device, linking them to the generation of<br />
negative externalities, such as carbon dioxide<br />
emissions. 89<br />
The Adaptation Fund established under<br />
the Kyoto Protocol of the United Nations<br />
Framework Convention on Climate Change<br />
is financed in part by government and<br />
private donors as well as from a 2 percent<br />
share of proceeds of Certified Emission<br />
Reductions issued under the Protocol’s Clean<br />
<strong>Development</strong> Mechanism projects. Since<br />
2010 it has committed almost $360 million<br />
to climate adaptation and resilience activities<br />
in 61 countries. 90 The collapse of carbon<br />
prices has greatly reduced this mechanism’s<br />
revenues.<br />
A global financial transaction tax to increase<br />
funding for developing countries has been<br />
proposed by some entities (such as the UN<br />
Department of Economic and Social Affairs).<br />
As discussed earlier, this would increase the<br />
cost of purely speculative financial transactions.<br />
Some of the revenues could go towards global<br />
public goods. 91 About 30 economies have some<br />
form of financial transaction tax. The European<br />
Union is the closest to adopting a comprehensive<br />
approach, including 10 member states, but<br />
has yet to make a final decision. 92<br />
Other innovative ways to fund global public<br />
goods include taxes, fees and levies; funds<br />
from private companies; public sources from<br />
developing countries (including South–South<br />
cooperation); and partnerships that combine<br />
sources. UNITAID, established in 2006 by the<br />
governments of Brazil, Chile, France, Norway<br />
and the United Kingdom, aims to prevent and<br />
treat HIV and AIDS, tuberculosis and malaria.<br />
Through traditional contributions and an additional<br />
tax on airfares, it raises around $300 million<br />
a year. 93<br />
Globally defending people’s security<br />
Rising geopolitical instability, challenging<br />
globalization and reappearing nationalism<br />
and xenophobia in many countries make it<br />
more important than ever to bring the world<br />
together through multilateral organizations.<br />
The existing multilateral institutions have a<br />
long-established legitimacy and functioning<br />
capacity to convene states around common<br />
actions. But they require substantial reforms to<br />
address today’s issues.<br />
Discussions are under way to ensure that<br />
the United Nations provides a forum to reach<br />
multilateral decisions promptly in response to<br />
major global problems — and that it possesses<br />
the means to implement decisions effectively.<br />
Some of the proposed solutions are restructuring<br />
current mechanisms towards prevention<br />
rather than towards mere reaction, prioritizing<br />
field operations and coordinating better internally<br />
and with civil society and the private<br />
sector. In a special contribution, Carol Bellamy,<br />
chair of the Governing Board of the Global<br />
Community Engagement and Resilience<br />
156 | HUMAN DEVELOPMENT REPORT <strong>2016</strong>
Fund and former executive director of United<br />
Nations Children’s Fund, argues that preventing<br />
violent extremism has worked its way onto<br />
the global development agenda (see special<br />
contribution).<br />
Improve mechanisms to ensure an<br />
adequate response to crisis<br />
The 2014 <strong>Human</strong> <strong>Development</strong> <strong>Report</strong><br />
pointed out that today’s fragmented global<br />
institutions are not accountable or fast- acting<br />
enough to address crises. They typically<br />
work in an ad hoc manner with neither the<br />
mandate nor the resources to tackle modern<br />
threats. Each global institution has its own<br />
structural problems and drawbacks. 94 For<br />
example, the United Nations was founded<br />
explicitly to uphold the collective security<br />
of sovereign states, a structure that no longer<br />
matches today’s security threats. It thus<br />
suffers from structural legacies of the Cold<br />
War — such as Security Council vetoes — that<br />
restrict multilateral actions. <strong>Human</strong>itarian<br />
organizations, which are usually the first to<br />
respond to human suffering in the aftermath<br />
of natural disasters, see themselves restricted<br />
in conflict prevention and resolution because<br />
of their need to preserve absolute impartiality<br />
towards the belligerents and nondiscrimination<br />
towards the victims. They may stay away<br />
from peace processes in order to assure their<br />
ability to continue their work in case conflict<br />
prevention fails. 95<br />
Such problems highlight first, the need for<br />
institutional adequacy and coherence, and<br />
second, the need for commensurate resources<br />
to tackle these modern threats. Global and<br />
multilateral institutions require fundamental<br />
reforms that can endow their international<br />
efforts with both legitimacy and capacity —<br />
boosting their means of implementation.<br />
The international community should be able<br />
to act in cases of evident deterioration of human<br />
conditions, particularly in crisis situations.<br />
The 2014 <strong>Human</strong> <strong>Development</strong> <strong>Report</strong> argues<br />
that the responsibility to protect should be expanded<br />
beyond mass atrocities to include other<br />
intense deprivations in the human security of<br />
particular vulnerable groups. 96<br />
Strengthen global redress mechanisms<br />
For human security the rule of law imposes<br />
dual accountability on the state. First, the<br />
state has an obligation to victims of violence<br />
to bring perpetrators to justice. Second, when<br />
agents of the state break the law they too must<br />
be held to account. Yet it is precisely in wartorn<br />
societies that the rule of law is absent and<br />
difficult to rebuild, leaving the demand for<br />
justice unmet.<br />
That is why advocates of human rights saw<br />
the establishment of the International Criminal<br />
Court as one of their major victories. More<br />
than a decade later the assessment is sobering.<br />
Prosecutions have been few, slow and difficult,<br />
with patchy support and cooperation from<br />
member states. There is no clear evidence to<br />
suggest that the court’s action has had a deterrent<br />
effect — and enhanced protection and<br />
empowerment of victims. On the contrary, the<br />
court has encountered severe resistance from<br />
governments and local communities. 97 In <strong>2016</strong><br />
Burundi and South Africa announced their<br />
withdrawal from it. 98<br />
Adequate, well equipped and well accepted<br />
global redress mechanisms are indispensable for<br />
resolving cross-broader issues, such as genocide,<br />
ethnic cleansing, refugees, migrant workers, humans<br />
trafficked and claims on international or<br />
territorial waters. Yet the international forums<br />
for deliberating these shared global challenges<br />
remain mired with historic deficits in participation<br />
and accountability. Global mechanisms<br />
to deal with international crimes need to be<br />
strengthened, by reasserting country commitments<br />
to accountable, collective action at<br />
the global level and by holding member states<br />
accountable for compliance both in commitments<br />
and in action.<br />
Promoting greater and better<br />
participation of global civil society<br />
in multilateral processes<br />
Greater people’s participation should be ensured<br />
in multilateral decisionmaking, making it<br />
inclusive, equitable and truly global. It should<br />
also be based on facts and reason, to produce<br />
positive changes in policies.<br />
The international<br />
community should<br />
be able to act in<br />
cases of evident<br />
deterioration of human<br />
conditions, particularly<br />
in crisis situations<br />
Chapter 5 Transforming global institutions | 157
SPECIAL CONTRIBUTION<br />
Preventing violent extremism and promoting human development for all: A critical issue on the global development agenda<br />
“Preventing violent extremism” (PVE) has gradually worked its way onto the<br />
global development agenda and now seems set to become a permanent fixture.<br />
Initially there was scepticism among many in the development community,<br />
but it has gained much wider legitimacy, for example, through the work<br />
of the 35 member state Global Counterterrorism Forum (GCTF). At the same<br />
time the fact the PVE agenda emerged from a counterterrorism community<br />
was a further concern. While welcoming the effort to correct the securityheavy<br />
counterterrorism policies of the past, there remained a suspicion that<br />
PVE was no more than a fig leaf and that efforts to engage development<br />
would simply continue to instrumentalize it.<br />
While the development community is still far from fully converted, a<br />
number of recent advances may alleviate concerns. First, the UN Secretary-<br />
General has embraced PVE and its relevance to the global development<br />
agenda, publishing his Action Plan to Prevent Violent Extremism in January<br />
<strong>2016</strong> and calling on all UN agencies to respond. Second, this builds on a<br />
clear recognition of the interdependency of security and development in<br />
the Sustainable <strong>Development</strong> Goals. Third, the <strong>Development</strong> Assistance<br />
Committee (DAC) of the Organisation for Economic Co-operation and<br />
<strong>Development</strong> (OECD) has recognized PVE contributions by donors as eligible<br />
for official development assistance (ODA) status. As a result, some<br />
of the most significant development donors—from the UK Department<br />
for International <strong>Development</strong> (DFID) through the Swiss Agency for<br />
<strong>Development</strong> and Cooperation (SDC) to the US Agency for International<br />
<strong>Development</strong> (USAID) —are now funding PVE activities at scale.<br />
Existing research on what causes and may in turn prevent violent extremism—while<br />
still in its infancy—nevertheless points up the potential<br />
relevance of development interventions. While one of the challenges of<br />
PVE remains that its drivers are context-specific and extremely localized,<br />
exclusion and marginalization are constants. How to lift the obstacles to<br />
human development generated by exclusion and marginalization is one of<br />
the themes for this <strong>Human</strong> <strong>Development</strong> <strong>Report</strong>; and it is clear that doing so<br />
will also help prevent violent extremism. The sorts of interventions that have<br />
been demonstrated to be most effective, for example, include empowering<br />
women and girls, educating children especially to think critically, and creating<br />
positive alternatives such as apprenticeships and jobs.<br />
Beyond the individual and community levels, the linkages between<br />
development and violent extremism at the national and global levels are<br />
also becoming clearer. Despite media attention to atrocities committed in<br />
a growing number of rich countries, it is worth remembering that the impact<br />
of violent extremism is felt disproportionately by poor communities in<br />
poorer countries. Rapidly developing countries like Egypt, Kenya and Tunisia<br />
are losing a significant proportion of their GDP because of the reduction in<br />
tourism in response to concerns about extremism and terrorism. The 2015<br />
Global Terrorism Index estimated that the global economic cost of terrorism<br />
(including direct and indirect costs) was over $50 billion in 2014, thereby<br />
also making a strong business case for private sector engagement.<br />
The Global Community Engagement and Resilience Fund (GCERF) has<br />
been at the forefront with initiatives to prevent violent extremism through<br />
promoting human development. They are conceived and developed by affected<br />
communities and include activities for raising awareness of violent<br />
extremism, mobilizing action against it and creating positive alternatives.<br />
In its first two years the fund has distributed about $25 million to support<br />
local initiatives to build community resilience against violent extremism in<br />
Bangladesh, Kenya, Kosovo,* Mali, Myanmar and Nigeria. Such initiatives<br />
also seek to bridge different perspectives on security and development<br />
among stakeholders and ensure national ownership, doing no harm and protecting<br />
the communities that participate.<br />
The challenges of integrating PVE with human development should not<br />
be underestimated. But perhaps for the first time in my career, human development<br />
for all may actually be attainable. I am strongly committed to<br />
contribute to lift a significant barrier that remains in the way of this epochal<br />
achievement. Preventing violent extremism is a critical development goal.<br />
Carol Bellamy<br />
Chair of the Governing Board of the Global Community Engagement and Resilience Fund and former executive director of the United Nations Children’s Fund<br />
* References to Kosovo shall be understood to be in the context of Security Council Resolution 1244 (1999).<br />
Expand mechanisms for participation of<br />
civil society in multilateral institutions<br />
Efforts have already been made to encourage<br />
civil society in multilateral institutions, such<br />
as including nongovernmental organizations<br />
in international debates as observers or consultants.<br />
Some civil society organizations<br />
participate in international initiatives, alongside<br />
governments and intergovernmental organizations.<br />
Consider the Busan Partnership for<br />
Effective <strong>Development</strong> Co-operation, which<br />
counts the Bill & Melinda Gates Foundation<br />
and the civil society network Better Aids among<br />
its signatories. Such participation mechanisms<br />
should be developed further to ensure that the<br />
158 | HUMAN DEVELOPMENT REPORT <strong>2016</strong>
civil society organizations involved represent a<br />
wide range of interests.<br />
Enhance the transparency and<br />
accountability of multilateral institutions<br />
Information and communication technologies<br />
provide new tools for civil society and concerned<br />
individuals from around the world to monitor<br />
the commitments and results of multilateral<br />
institutions. Some multilateral institutions<br />
recently published databases online so that the<br />
public could use them for monitoring and advocacy,<br />
starting with the United Nations in 2008, 99<br />
the World Bank in 2011 100 and the European<br />
Union in 2012. 101 Other mechanisms include<br />
online petitions to address multilateral bodies<br />
on specific issues. To support these new forms<br />
of civil participation, more people must possess<br />
computer skills and have access to the Internet.<br />
Promote and support inclusive<br />
global civil society networks<br />
focused on specific groups<br />
Networks of women; young people; ethnic<br />
minorities; persons with disabilities; lesbian,<br />
gay, bisexual, transgender and intersex people;<br />
and displaced workers make their voices<br />
stronger in the global arena and facilitate<br />
peer-learning of best practices to promote<br />
inclusion in every country. Civil society has<br />
been praised for its positive impact on women’s<br />
participation in public and political life<br />
(box 5.10).<br />
Increase the free flow of information<br />
and knowledge through active<br />
transparency mechanisms<br />
In the long term both market and multilateral<br />
institutions will benefit from the accountability<br />
ensured by a well informed civil society.<br />
Well regulated markets collect and disseminate<br />
information about prices, wages, taxes paid and<br />
service quality. Similarly, multilateral initiatives<br />
are standardizing open government practices,<br />
such as the Open Government Partnership,<br />
which has 70 member countries. 102 Multilateral<br />
organizations must themselves be accountable<br />
not only to member states, but also to civil<br />
society.<br />
The International Aid Transparency<br />
Initiative is a global benchmark for multilateral<br />
organizations to publish relevant information<br />
on their programmes. Open government data<br />
initiatives publish raw data on freely accessible<br />
websites; in 2014, 86 countries provided government<br />
data in machine-readable structures,<br />
such as Microsoft Excel. 103 The United States<br />
launched the Open Government Initiative<br />
in 2009, 104 joined by the United Kingdom in<br />
2010, 105 Kenya in 2011, 106 Ghana in 2012 107<br />
and Japan in 2013, 108 to cite a few.<br />
Multilateral<br />
organizations must<br />
themselves be<br />
accountable not only<br />
to member states, but<br />
also to civil society<br />
BOX 5.10<br />
Civil society and women’s participation<br />
Women are less represented than men in traditional political<br />
forums. In 2015 women held 22.5 percent of national<br />
parliamentary seats worldwide. When women face discrimination<br />
in formally entering political or public life, civil<br />
society presents them with alternatives for participation.<br />
Of the 11,554 UN online volunteers who contributed their<br />
skills for peace and development in 2015, 59 percent were<br />
women. 1 Civil society organizations have been advocating<br />
for gender equity and raising awareness of women’s rights<br />
violations for decades.<br />
The role of civil society in gender initiatives is now<br />
fully recognized by multilateral institutions. The United<br />
Nations Entity for Gender Equality and the Empowerment<br />
of Women regards civil society as one of its most important<br />
constituencies, playing “a pivotal role in advancing gender<br />
equality and the empowerment of women” 2 In <strong>2016</strong> the<br />
Commission on the Status of Women agreed to increase<br />
resources and support for women’s and civil society organizations<br />
to promote gender equality, the empowerment<br />
of women and the rights of women and girls. The United<br />
Nations <strong>Development</strong> Programme’s 2014–2017 Gender<br />
Equality Strategy also plans to support women’s networks<br />
and civil society movements to bring gender equality perspectives<br />
into policymaking and legal reforms.<br />
Notes<br />
1. UNV <strong>2016</strong>. 2. UN Women 2014.<br />
Source: <strong>Human</strong> <strong>Development</strong> <strong>Report</strong> Office.<br />
Chapter 5 Transforming global institutions | 159
The transformation<br />
of global institutions<br />
can expand human<br />
development<br />
for everyone<br />
Protect the work of international<br />
investigative journalism<br />
Freedoms of expression and of information<br />
are fundamental human rights recognized in<br />
the Universal Declaration of <strong>Human</strong> Rights<br />
and the International Covenant on Civil and<br />
Political Rights. They are also instrumental in<br />
human development and human security. Free<br />
and competent media can ensure transparency,<br />
accountability and the rule of law, promote<br />
participation in public and political discourse<br />
and contribute to the fight against poverty.<br />
Yet freedom of the press has been under attack<br />
worldwide in recent years, with investigative<br />
journalists risking their freedom and sometimes<br />
their lives for their work. The United Nations<br />
recommends making freedom of expression<br />
possible through: 109<br />
• A legal and regulatory environment that allows<br />
for an open and pluralistic media sector<br />
to emerge.<br />
• Political will to support the sector and rule of<br />
law to protect.<br />
• Laws ensuring access to information, especially<br />
information in the public domain.<br />
• Media literacy skills among news consumers<br />
to critically analyse and synthesize the information<br />
they receive to use it in their daily<br />
lives and to hold the media accountable for<br />
its actions.<br />
The media have uncovered war crimes, asymmetries<br />
in global markets, abuses of privacy<br />
on the Internet and problems in international<br />
organizations, information essential for improving<br />
national and global institutions.<br />
Conclusion<br />
The transformation of global institutions can<br />
expand human development for everyone. It is<br />
a process that requires a delicate balance among<br />
the regulation of markets, the governance of<br />
multilateral organizations and the participation<br />
of an increasingly interconnected global<br />
civil society. The three are linked, and their<br />
reciprocal accountability is crucial to undertake<br />
reforms. Global markets are a great source<br />
of dynamism, but they need to be properly<br />
regulated to work for the majority. These regulations<br />
in turn need to be rooted in legitimate<br />
multilateral processes, where the interests of<br />
developing countries are central and where the<br />
voices of people contribute to the deliberative<br />
process. These transformations at the global<br />
level are essential for achieving human development<br />
for everyone.<br />
Chapter 6 builds on the national policies and<br />
global reforms to propose a five point action<br />
agenda. It also looks forward to identify the<br />
substantive work on human development that<br />
needs to be undertaken to extend the frontiers<br />
of knowledge on human development for<br />
everyone..<br />
160 | HUMAN DEVELOPMENT REPORT <strong>2016</strong>
Chapter 6<br />
<strong>Human</strong> development<br />
for everyone—<br />
looking forward
Infographic 6.1 <strong>Human</strong> development for everyone—<br />
a five-point action agenda<br />
Identify those<br />
who face human<br />
development deficits<br />
and map where<br />
they are<br />
Work towards reforms<br />
in the global system<br />
<strong>Human</strong><br />
development<br />
for<br />
everyone<br />
Pursue a range<br />
of available<br />
policy options<br />
with coherence<br />
Implement the<br />
Sustainable <strong>Development</strong><br />
Goals and other<br />
global agreements<br />
Close the gender gap
<strong>Human</strong> <strong>Development</strong><br />
6.<br />
<strong>Report</strong> <strong>2016</strong><br />
<strong>Human</strong> <strong>Development</strong> for Everyone<br />
<strong>Human</strong> development for everyone —<br />
looking forward<br />
We want a world where human development reaches everyone and no one is left behind — now or in the future. In that<br />
broader perspective the preceding chapters have articulated the message that since universalism is key to human development,<br />
it is both an ethical imperative and a practical requirement. The human development journey will not be universal if<br />
we leave anyone behind, and we cannot build a peaceful and prosperous world by excluding people on the path.<br />
<strong>Human</strong> development for everyone is not a<br />
dream; it is a realizable goal. We can build<br />
on what we have achieved. We can explore<br />
new possibilities to overcome challenges. We<br />
can attain what once seemed unattainable,<br />
for what seem to be challenges today can be<br />
overcome tomorrow. Realizing our hopes is<br />
within our reach. The 2030 Agenda and the<br />
Sustainable <strong>Development</strong> Goals are critical<br />
steps towards human development for<br />
everyone.<br />
But the reality is that the impressive progress<br />
on many human development fronts over<br />
the past 25 years has bypassed many people,<br />
particularly those who are marginalized and<br />
vulnerable. Such progress has enriched many<br />
lives — but not to the same extent and certainly<br />
not for all. The barriers are still substantial —<br />
economic, political and social — for all human<br />
beings to realize their full potential in life.<br />
Such barriers are particularly stark for women<br />
and girls, since they are discriminated against<br />
just because of their gender.<br />
Overcoming such inequality and barriers<br />
is a prerequisite for human development for<br />
everyone. Despite the barriers to universalism,<br />
a more just, equitable and inclusive world must<br />
be viewed as achievable. Particularly where the<br />
financial and technological resources exist<br />
to eliminate deprivations, the persistence of<br />
such injustice is indefensible. A more equal<br />
world calls for practical and immediate action<br />
on three fronts. First is implementing<br />
relevant measures from the range of available<br />
policy options. Second is reforming global<br />
governance with fairer multilateralism. And<br />
third is refocusing on analytical issues, such as<br />
disaggregated indicators, voice and autonomy<br />
measures and qualitative assessments of human<br />
development.<br />
The world has fewer than 15 years to achieve<br />
the aspirational and inspirational goals to<br />
eradicate poverty, end hunger, achieve gender<br />
equality and empower all women and girls.<br />
Time is of the essence, as Sub- Saharan Africa<br />
shows (figure 6.1). To eliminate extreme poverty<br />
by 2030, it must progress twice as fast as its<br />
current rate. If nothing happens in the next six<br />
years, progress will have to be more than three<br />
times faster. 1 If numbers stagnate in the next 11<br />
years, progress will have to be eight times faster.<br />
<strong>Human</strong> development for<br />
everyone — an action agenda<br />
In the context of these aspirations, the <strong>Report</strong><br />
builds on its analysis and findings to suggest a<br />
five-point action agenda for ensuring human<br />
development for everyone (see infographic 6.1<br />
on the facing page). These actions cover policy<br />
issues and global commitments.<br />
Identifying those who face<br />
human development deficits<br />
and mapping where they are<br />
Identifying those who have been left out of the<br />
progress in human development and mapping<br />
their locations are not just parts of an academic<br />
exercise, they are essential tasks for useful<br />
advocacy and for effective policymaking.<br />
Such mapping can help development activists<br />
demand action and guide policymakers in<br />
formulating and implementing policies to<br />
improve the well-being of marginalized and<br />
vulnerable people. National and subnational<br />
<strong>Human</strong> <strong>Development</strong> <strong>Report</strong>s can be useful<br />
instruments for identifying those left behind<br />
and mapping their locations.<br />
Identifying those who<br />
have been left out of<br />
the progress in human<br />
development and<br />
mapping their locations<br />
are not just parts of an<br />
academic exercise,<br />
they are essential<br />
tasks for useful<br />
advocacy and for<br />
effective policymaking<br />
Chapter 6 <strong>Human</strong> development for everyone—looking forward | 163
FIGURE 6.1<br />
Reaching everyone — time is of the essence in Sub- Saharan Africa<br />
Annual change needed to eliminate education poverty by 2030<br />
Annual change needed to eliminate ultra poverty a by 2030<br />
Annual change needed to achieve universal birth registration by 2030<br />
Annual change needed to reduce under-five mortality to 25 preventable deaths per 1,000 live births by 2030<br />
Annual change needed to halve national poverty by 2030<br />
2015<br />
10.4%<br />
5.9%<br />
7.5%<br />
4.5%<br />
14.8%<br />
2018<br />
7.4%<br />
9.3%<br />
5.6%<br />
12.9%<br />
18.2%<br />
2021<br />
10.0%<br />
12.1%<br />
7.4%<br />
16.8%<br />
23.5%<br />
2024<br />
10.9%<br />
15.4%<br />
17.7%<br />
24.1%<br />
33.0%<br />
55.2%<br />
2027<br />
20.6%<br />
33.1%<br />
32.2%<br />
42.4%<br />
0 10 20 30 40 50 60<br />
a. Defined as poverty in which individuals cannot afford to meet daily recommended food requirements.<br />
Source: ODI <strong>2016</strong>.<br />
164 | HUMAN DEVELOPMENT REPORT <strong>2016</strong>
BOX 6.1<br />
Administrative registries in Latin America and the Caribbean<br />
Administrative registries collect multidimensional data<br />
on such subjects as time use, income and subjective<br />
well-being. A well known example is Brazil’s Cadastro<br />
Único shared registry, which provides panel data on<br />
the vulnerable population, defined as households earning<br />
half or less of a minimum wage per person or three<br />
minimum wages in all. The database contains information<br />
on the characteristics of the household and each<br />
family member and on their social and economic circumstances<br />
and access to public services.<br />
Run by Caixa Econômica Federal, a public bank,<br />
the database covers about 78 million people, mainly to<br />
assign benefits for Bolsa Família, the well known cash<br />
transfer programme. It has increased the programme’s<br />
outreach while mitigating the risk of data manipulation,<br />
fraud and clientelism, for which Bolsa Família was earlier<br />
criticized.<br />
Other countries in Latin America and the Caribbean<br />
have followed Brazil’s lead. The Dominican Republic’s<br />
Single Beneficiary Selection System helps identify and<br />
classify households eligible for social programmes. This<br />
targeting mechanism has been key for channelling resources<br />
to the most vulnerable households, while also improving<br />
the monitoring and evaluation of social policy programmes.<br />
A single national database for determining eligibility<br />
has other benefits, such as preventing duplication<br />
(otherwise people may receive benefits from several<br />
programmes), reducing administrative costs across programmes<br />
and facilitating the monitoring of criteria for<br />
time limits and graduation.<br />
Source: Checchi and van der Werfhorst 2014; ILO 2014a; World Bank 2015c.<br />
A critical element of such a mapping exercise<br />
is collecting relevant information and data.<br />
Rather than traditional census and household<br />
surveys, innovative data collection mechanisms<br />
— such as administrative registries, as pursued<br />
in some countries in Latin America and the<br />
Caribbean — can be more effective (box 6.1).<br />
Pursuing a range of available<br />
policy options with coherence<br />
Translating universalism from principle to<br />
practice will have to go beyond mapping those<br />
left out in the human development journey<br />
and identifying the barriers they face. Pursuing<br />
necessary policies and empowering those left<br />
out are a must.<br />
<strong>Human</strong> development for everyone requires<br />
a multipronged set of national policy options<br />
(see chapter 4): reaching those left out using<br />
universal policies, pursuing measures for groups<br />
with special needs, making human development<br />
resilient and empowering those left out.<br />
Keep in mind, however, that country situations<br />
differ and policy options have to be tailored<br />
to each country. Policies in every country<br />
have to be pursued in a coherent way through<br />
multistakeholder engagement, local and subnational<br />
adaptations and horizontal (across silos)<br />
and vertical policy coherence (for international<br />
and global consistency).<br />
Closing the gender gap<br />
Gender equality and women’s empowerment<br />
are fundamental dimensions of human development.<br />
With half of humanity lacking<br />
equal progress in human development, human<br />
development is not universal. This simple but<br />
a powerful truth is often forgotten in the preoccupation<br />
with average human progress.<br />
Gender gaps exist in capabilities as well as<br />
opportunities. As the <strong>2016</strong> Global Gender Gap<br />
<strong>Report</strong> indicates, progress is still too slow for<br />
realizing the full potential of half of humanity<br />
within our lifetimes. 2 On current trends East<br />
Asia and the Pacific will take 111 years to close<br />
just the economic gender gap (not to speak of<br />
other gender gaps), and the Middle East and<br />
North Africa, 356 years.<br />
At a historic gathering in New York in<br />
September 2015 some 80 world leaders committed<br />
to end discrimination against women by<br />
2030 and announced concrete and measurable<br />
national actions to kickstart rapid changes. The<br />
commitments address the most pressing barriers<br />
for women, such as increasing investment<br />
in gender equality, reaching parity for women<br />
at all levels of decisionmaking, eliminating<br />
discriminatory legislation and tackling social<br />
norms that perpetuate discrimination and violence<br />
against women. Now is the time to act on<br />
what has been promised and agreed.<br />
Gender equality<br />
and women’s<br />
empowerment<br />
are fundamental<br />
dimensions of human<br />
development<br />
Chapter 6 <strong>Human</strong> development for everyone—looking forward | 165
The Sustainable<br />
<strong>Development</strong> Goals,<br />
critical in their own<br />
right, are also crucial<br />
for human development<br />
for everyone; the<br />
2030 Agenda and the<br />
human development<br />
approach are<br />
mutually reinforcing<br />
Implementing the Sustainable<br />
<strong>Development</strong> Goals and other<br />
global agreements<br />
The Sustainable <strong>Development</strong> Goals, critical<br />
in their own right, are also crucial for human<br />
development for everyone; the 2030 Agenda<br />
and the human development approach are<br />
mutually reinforcing. Further, achieving the<br />
Sustainable <strong>Development</strong> Goals is an important<br />
step for all human beings to realize their<br />
full potential in life. In that context the focus<br />
should be not only on people who are “just behind<br />
and visible,” but also on those who are “far<br />
behind and invisible.” Tracking and monitoring<br />
the Sustainable <strong>Development</strong> Goals are thus<br />
important to measure progress, identify gaps<br />
in sustainable development and change policies<br />
and implementation plans, if development<br />
is off track. Her Excellency Angela Merkel,<br />
chancellor of the Federal Republic of Germany,<br />
argues that all of humanity will have to work<br />
together towards realizing the inspirational<br />
2030 Agenda (see special contribution).<br />
The historic Paris Agreement on climate<br />
change is the first to consider both developed<br />
and developing countries in a common framework,<br />
urging them all to make their best efforts<br />
and reinforce their commitments in the coming<br />
years (box 6.2). All parties should now report<br />
regularly on their emissions and their efforts<br />
to implement their commitments, submitting<br />
to international review. On another front, the<br />
New York Declaration, announced at the UN<br />
Summit for Refugees in September <strong>2016</strong>, contains<br />
bold commitments to address the issues<br />
facing refugees and migrants and to prepare for<br />
future challenges (box 6.3). The international<br />
community, national governments and all other<br />
parties must ensure that the agreements are<br />
honoured, implemented and monitored.<br />
Working towards reforms<br />
in the global system<br />
In today’s globalized world, national policies<br />
for universal human development must be<br />
complemented and supplemented by a global<br />
system that is fair and that enriches human<br />
development. The current architecture of the<br />
global system has five glaring shortcomings:<br />
the governance of economic globalization is<br />
BOX 6.2<br />
The Paris Agreement on climate change<br />
The key outcomes of the Conference of the Parties of<br />
the United Nations Framework Convention on Climate<br />
Change were the Paris Agreement and a companion decision<br />
known as the 21st Session. Among their provisions:<br />
• Reaffirm the goal of limiting global temperature increase<br />
to well below 2°C above preindustrial levels,<br />
while urging efforts to limit the increase to 1.5°C.<br />
• Establish binding commitments by all parties to<br />
make nationally determined contributions and pursue<br />
domestic measures aimed at achieving the<br />
contributions.<br />
• Commit all countries to report regularly on their<br />
emissions and progress in implementing and<br />
achieving nationally determined contributions and<br />
to undergo international review.<br />
• Commit all countries to submit new nationally determined<br />
contributions every five years, with the<br />
clear expectation that they will represent progress<br />
beyond the previous contributions.<br />
• Reaffirm the binding obligations of developed countries<br />
under the United Nations Framework Convention<br />
on Climate Change to support the efforts of<br />
developing countries, while encouraging voluntary<br />
contributions by developing countries, too.<br />
• Extend through 2025 the current goal of mobilizing<br />
$100 billion a year in support by 2020 with a higher<br />
goal to be set for the period after 2025.<br />
• Extend a mechanism to address the loss and damage<br />
resulting from climate change, which explicitly<br />
will not involve or provide a basis for any liability or<br />
compensation.<br />
• Require parties engaging in international emissions<br />
trading to avoid double counting.<br />
• Call for a new mechanism, similar to the Clean <strong>Development</strong><br />
Mechanism under the Kyoto Protocol,<br />
that enables emission reductions in one country<br />
to be counted towards another country’s nationally<br />
determined contributions.<br />
Source: UNFCCC 2015.<br />
166 | HUMAN DEVELOPMENT REPORT <strong>2016</strong>
SPECIAL CONTRIBUTION<br />
The Sustainable <strong>Development</strong> Goals—shared vision, collective responsibilities<br />
<strong>Human</strong> dignity is inviolable. This principle has not changed since 1948 when<br />
it was formulated by the United Nations in the Universal Declaration of<br />
<strong>Human</strong> Rights. It does not stop at national borders and applies to everyone<br />
regardless of age, gender or religion. However, to what extent have<br />
we lived up to this high principle? How far have we progressed in reality<br />
towards ensuring that every individual can lead a life in dignity? The <strong>Human</strong><br />
<strong>Development</strong> <strong>Report</strong> sheds light on this regularly. By placing the focus on<br />
individuals, it also highlights the necessity of investing in people: in health,<br />
in education and training, in economic and social infrastructure.<br />
Poverty and hunger, state fragility and terror — we are aware of these<br />
and other existential challenges. However, we also know that good human<br />
development is possible. Even in the poorest regions there are not only natural<br />
resources, but also tremendous creativity, innovative drive and a willingness<br />
to work hard. We have to make the most of these assets in order to<br />
seize the opportunities for a life in dignity — regardless of how difficult that<br />
might be in some cases.<br />
At a time of increasing globalization, life chances on the different continents<br />
are more closely interconnected than ever before. It is therefore all<br />
the more important to act jointly on the basis of shared values. That is why<br />
we have adopted the 2030 Agenda with its global Sustainable <strong>Development</strong><br />
Goals. That is why we have concluded a global climate agreement. As a<br />
result of these instruments, all states have an obligation and responsibility<br />
to tackle the key challenges facing humankind — from the eradication<br />
of poverty and the protection of the climate, nature and the environment to<br />
ensuring peace.<br />
In many respects, viable answers to such crucial questions require us to<br />
fundamentally change how we think and act in the way we live and work.<br />
The economy, social issues and the environment have an impact on each<br />
other. Economic productivity, social responsibility and protection of the natural<br />
resources on our planet therefore have to be reconciled. This is exactly<br />
the meaning of the principle of sustainability, which the 2030 Agenda is<br />
aiming for. In its essence, it is about nothing less than a life in dignity, justice<br />
and peace, a life in an intact environment, social security and the opportunity<br />
for every individual to reach their economic potential.<br />
The 2030 Agenda has laid the cornerstone of a new global partnership<br />
in which Germany too is assuming an active role. Already in July <strong>2016</strong>, at<br />
the first High-Level Political Forum in New York, the German government<br />
reported on the steps taken towards implementing the agenda at national<br />
level, as well as the measures to follow. At the international level we will<br />
use our G20 presidency in 2017 in particular to set priorities on the AGENDA.<br />
The consistent implementation of the 2030 Agenda also calls for a<br />
transformation of the international system. One key task of the new UN<br />
Secretary-General, António Guterres, will therefore be to make the UN<br />
structures and institutions fit for purpose. Germany will be happy to support<br />
him in this process.<br />
Modern information and communications technologies offer major opportunities<br />
for the successful implementation of the 2030 Agenda. They<br />
boost the efficiency, effectivity and transparency of measures and processes,<br />
thus saving time and money. They open up new possibilities for dialogue<br />
and cooperation. They enable everyone to have access to knowledge.<br />
Broader access to information can, not least, promote development policy<br />
goals in areas such as good governance and rural development, as well<br />
as education, health and the development of financial systems. The development<br />
and expansion of digital infrastructure can create new opportunities<br />
for economic growth and employment in both industrialized and developing<br />
countries. The important thing is to eliminate existing differences not only<br />
between industrialized and developing countries, but also within developing<br />
countries, for example between urban and rural regions.<br />
Alongside access to modern technologies, there is the question of digital<br />
inclusion. The right qualifications are essential if every man and woman<br />
is to participate in the digital world on an equal basis in both economic and<br />
social terms. This, too, will be one of the focal issues during Germany’s G20<br />
presidency.<br />
Not only determination, but also unity are required in order to master<br />
the diverse global challenges and in some cases crisis-ridden developments.<br />
The 2030 Agenda provides us with a comprehensive and forward-looking<br />
approach for shaping our world together — not any old way, not at the expense<br />
of people and nature in other regions but for the benefit of everyone<br />
in our one world. We all have a responsibility, day in and day out, to make<br />
sustainability a guiding principle in action — as responsible politicians and<br />
decisionmakers in business and society, as individuals who are truly interested<br />
in our future.<br />
Before the adoption of the 2030 Agenda it was the time to negotiate.<br />
Now is the time to act. It is up to us to enable everyone to live a life in dignity.<br />
Dr. Angela Merkel<br />
Chancellor of the Federal Republic of Germany<br />
unbalanced, globalization remains inequitable,<br />
imbalances exist in the governance of multilateral<br />
institutions, multilateralism remains<br />
reactive to human security and the potential of<br />
global civil society remains untapped.<br />
These shortcomings pose challenges to<br />
human development on several fronts. The<br />
distributional consequences of inequitable<br />
globalization promote the progress of some<br />
segments of the population, leaving poor and<br />
Chapter 6 <strong>Human</strong> development for everyone—looking forward | 167
BOX 6.3<br />
The New York Declaration<br />
• Protect the human rights of all refugees and migrants,<br />
regardless of status. This includes the rights<br />
of women and girls and promoting their full, equal<br />
and meaningful participation in finding solutions.<br />
• Ensure that all refugee and migrant children are receiving<br />
education within a few months of arrival.<br />
• Prevent and respond to sexual and gender-based<br />
violence.<br />
• Support those countries rescuing, receiving and<br />
hosting large numbers of refugees and migrants.<br />
• Work towards ending the practice of detaining children<br />
for the purposes of determining their migration<br />
status.<br />
• Strongly condemn xenophobia against refugees and<br />
migrants and support a global campaign to counter it.<br />
• Strengthen the positive contributions made by migrants<br />
to economic and social development in their<br />
host countries.<br />
• Improve the delivery of humanitarian and development<br />
assistance to those countries most affected,<br />
including through innovative multilateral financial<br />
solutions, with the goal of closing all funding gaps.<br />
• Implement a comprehensive refugee response<br />
based on a new framework that sets out the responsibility<br />
of Member States, civil society partners<br />
and the UN system, whenever there is a large<br />
movement of refugees or a protracted refugee<br />
situation.<br />
• Find new homes for all refugees identified by the<br />
United Nations High Commissioner for Refugees as<br />
needing resettlement and expand the opportunities<br />
for refugees to relocate to other countries through,<br />
for example, labour mobility or education schemes.<br />
• Strengthen the global governance of migration by<br />
bringing the International Organization for Migration<br />
into the UN system.<br />
Source: United Nations <strong>2016</strong>i.<br />
Voice and autonomy<br />
have become more<br />
important not only in<br />
their own right, but also<br />
as critical instruments<br />
for the empowerment<br />
and well-being of<br />
those left out<br />
vulnerable people behind. Such globalization<br />
makes those left behind economically insecure.<br />
And people suffer in lingering conflicts.<br />
To move towards a fairer global system,<br />
the agenda for global institutional reforms<br />
should focus on global markets and their<br />
regulation, on the governance of multilateral<br />
institutions and on the strengthening of global<br />
civil society. That reform agenda should<br />
be promoted vigorously and consistently by<br />
bolstering public advocacy, building alliances<br />
among stakeholders and pushing through the<br />
agenda for reform.<br />
<strong>Human</strong> development for everyone<br />
— future substantive work<br />
To ensure universal human development, the<br />
action agenda for policies and reforms will<br />
have to be backed by substantive work on<br />
analytical issues and assessment perspectives.<br />
The substantive work must begin with the why<br />
questions. Why are people discriminated? Why<br />
have social norms and values evolved to what<br />
they are now? Answering will require not only<br />
economic analysis, but also sociological and<br />
anthropological studies.<br />
Some issues in the human development<br />
approach need to be refocused. So far, the<br />
approach has concentrated more on freedom<br />
of well- being than on freedom of agency. This<br />
may have a historical reason. In earlier years basic<br />
deprivations were more significant, deserving<br />
the most analysis, measurement and policy<br />
response. But as well-being has been realized,<br />
freedom of agency has become more important.<br />
Voice and autonomy have become more<br />
important not only in their own right, but also<br />
as critical instruments for the empowerment<br />
and well-being of those left out.<br />
The focus also has to be on analysing and understanding<br />
collective capabilities. Collective<br />
agency is critical for people who are marginalized<br />
and vulnerable, who may not be able<br />
to achieve much alone. And because poor and<br />
disadvantaged people suffer most from insecurities<br />
and vulnerabilities, human security needs<br />
to be analysed through its links with human development<br />
and the balance between short-term<br />
responses and long-term prevention.<br />
To ensure human development for everyone,<br />
future substantive work should also<br />
concentrate on assessing human development.<br />
Reaching everyone requires disaggregated data<br />
and the pursuit of three other issues.<br />
168 | HUMAN DEVELOPMENT REPORT <strong>2016</strong>
First, assessments of human development so<br />
far have focused on quantitative achievements.<br />
But with progress in human development,<br />
quality has also become important. For example,<br />
more children are enrolled in and attending<br />
school, but what are they learning? So<br />
along with quantitative monitoring of progress<br />
in human development, it is equally important<br />
to assess the quality of those achievements.<br />
Second, even though it is more difficult to<br />
measure voice and autonomy, research should<br />
focus on developing such a measure. Much<br />
has been written on this, and human development<br />
assessments can build on that work.<br />
Such a measure would not only complement<br />
the <strong>Human</strong> <strong>Development</strong> Index (a measure of<br />
well-being), it would also be a powerful instrument<br />
to advocate for the voiceless.<br />
Third, various measures of well-being and<br />
deprivations have been proposed from different<br />
perspectives. Those left out suffer deprivation in<br />
multiple aspects of life. So it is crucial that we<br />
have a clear idea of multiple deprivations and<br />
well-being. Examining how human development<br />
measures can benefit from the other measures of<br />
well-being would be a worthwhile exercise.<br />
Because universalism is central to the human<br />
development approach, some of these analytical<br />
and assessment issues would inform and guide<br />
the research, analysis and work of future <strong>Human</strong><br />
<strong>Development</strong> <strong>Report</strong>s, including the 2017<br />
<strong>Report</strong>. This is necessary to extend the frontiers<br />
of the human development approach, to better<br />
understand human development issues and to<br />
address future human development challenges.<br />
Conclusion<br />
From a human development perspective, we<br />
want a world where all human beings have the<br />
freedom to realize their full potential in life so<br />
they can attain what they value. This is what<br />
human development is all about — universalism,<br />
leaving no one behind. Universal human development<br />
must enable all people — regardless of<br />
their age, citizenship, religion, ethnicity, gender,<br />
sexual orientation or any other identity — to<br />
expand their capabilities fully and put those capabilities<br />
to use. This also means that capabilities<br />
and opportunities are sustainable throughout an<br />
individual’s lifecycle and across generations. But<br />
those less endowed or lagging behind need support<br />
from others — from individuals, communities<br />
and states — to realize their full potential.<br />
In the ultimate analysis, development is of<br />
the people, by the people and for the people.<br />
People have to partner with each other. There<br />
needs to be a balance between people and the<br />
planet. And humanity has to strive for peace<br />
and prosperity. <strong>Human</strong> development requires<br />
recognizing that every life is equally valuable<br />
and that human development for everyone<br />
must start with those farthest behind.<br />
The <strong>2016</strong> <strong>Human</strong> <strong>Development</strong> <strong>Report</strong> is<br />
an intellectual contribution to resolving these<br />
issues. We strongly believe that only after they<br />
are resolved will we all reach the end of the road<br />
together. And when we look back, we will see<br />
that no one has been left out.<br />
<strong>Human</strong> development<br />
requires recognizing<br />
that every life is equally<br />
valuable and that<br />
human development<br />
for everyone must<br />
start with those<br />
farthest behind<br />
Chapter 6 <strong>Human</strong> development for everyone—looking forward | 169
Notes<br />
Overview<br />
1 UNFPA 2014.<br />
2 United Nations 2015a.<br />
3 United Nations 2015c.<br />
4 UNDP 1990.<br />
5 United Nations 2015a.<br />
6 United Nations <strong>2016</strong>h.<br />
7 United Nations <strong>2016</strong>h.<br />
8 UNICEF 2014a.<br />
9 IEA <strong>2016</strong>b.<br />
10 UNAIDS <strong>2016</strong>a.<br />
11 UNHCR <strong>2016</strong>a.<br />
12 UNDP 2014a.<br />
13 SIDA 2015.<br />
14 UNDP <strong>2016</strong>e.<br />
15 UNDESA <strong>2016</strong>a.<br />
16 WHO 2011b.<br />
17 UNFPA 2015.<br />
18 ILGA <strong>2016</strong>b.<br />
19 Charmes 2015.<br />
20 Abadeer 2015.<br />
21 <strong>Human</strong> <strong>Development</strong> <strong>Report</strong> Office<br />
calculation using data from Milanović<br />
(<strong>2016</strong>).<br />
22 The Social Progress Imperative’s<br />
Social Progress Index website (www.<br />
socialprogressimperative.org/globalindex/,<br />
accessed 12 December <strong>2016</strong>).<br />
23 The Sustainable <strong>Development</strong><br />
Solutions Network’s World<br />
Happiness <strong>Report</strong> website (http://<br />
worldhappiness.report, accessed 12<br />
December <strong>2016</strong>).<br />
24 The Organisation for Economic<br />
Co-operation and <strong>Development</strong>’s<br />
Better Life Index website (www.<br />
oecdbetterlifeindex.org, accessed 12<br />
December <strong>2016</strong>).<br />
25 Centre for Bhutan Studies and<br />
GNH Research’s Gross National<br />
Happiness Index website (www.<br />
grossnationalhappiness.com/ articles/,<br />
accessed 12 December <strong>2016</strong>).<br />
26 In 2009 the UN Secretary-General<br />
created the Global Pulse initiative<br />
aiming to harness Big Data as a public<br />
good in the service of sustainable development<br />
and humanitarian action. In<br />
2014 the UN Statistical Commission<br />
formed a Global Working Group on<br />
Big Data. The Global Partnership on<br />
Sustainable <strong>Development</strong> Data was<br />
formed among governments, corporate,<br />
UN and international financial<br />
institutions, nonprofits and academic<br />
stakeholders. It currently has 150<br />
members.<br />
27 Demirgüç-Kunt and others 2014.<br />
28 Harris and Marks 2009.<br />
29 WFP <strong>2016</strong>b.<br />
30 World Bank <strong>2016</strong>i.<br />
31 UNESCO 2013b.<br />
32 World Bank 2015b.<br />
33 The Economist <strong>2016</strong>c.<br />
34 UNDESA <strong>2016</strong>a.<br />
35 WEF <strong>2016</strong>a.<br />
36 Cecchini and others 2015.<br />
37 Cashin <strong>2016</strong>.<br />
38 UN Women <strong>2016</strong>a.<br />
39 UNDESA <strong>2016</strong>a.<br />
40 UNDESA <strong>2016</strong>a.<br />
41 UNAIDS <strong>2016</strong>d.<br />
42 WHO <strong>2016</strong>j.<br />
43 The Guardian <strong>2016</strong>a.<br />
44 WHO <strong>2016</strong>j.<br />
45 World Bank 2015a.<br />
46 World Bank 2015a.<br />
47 UNDP 2015a.<br />
48 Demos Helsinki <strong>2016</strong>.<br />
49 United Nations 2013.<br />
50 UN Women 2015b.<br />
Chapter 1<br />
1 Jahan 2010.<br />
2 UNDP 1994.<br />
3 UNDP 1995.<br />
4 UNDP 1997. The <strong>Human</strong> Poverty Index<br />
was replaced by the Multidimensional<br />
Poverty Index in 2010.<br />
5 UNDP 1994<br />
6 Jahan 2003.<br />
7 UNDP 2002, 2004, 2007, 2011b,<br />
2015a.<br />
8 UNDP 2017.<br />
9 UNDP and IAER 2013.<br />
10 World Bank 2017.<br />
11 IFPRI 2015; United Nations 2015a.<br />
12 WHO 2015c, <strong>2016</strong>b.<br />
13 UNICEF 2014a.<br />
14 IEA <strong>2016</strong>b; UNAIDS <strong>2016</strong>a.<br />
15 UNHCR <strong>2016</strong>a.<br />
16 UNHCR <strong>2016</strong>a.<br />
17 FAO <strong>2016</strong>a.<br />
18 IEP <strong>2016</strong>.<br />
19 Street Child 2014.<br />
20 <strong>Human</strong> <strong>Development</strong> <strong>Report</strong> Office<br />
estimates based on data from<br />
UNDESA (2015d), UNESCO Institute<br />
for Statistics (<strong>2016</strong>), UNSD (<strong>2016</strong>),<br />
World Bank (<strong>2016</strong>o), Barro and Lee<br />
(2015) and IMF (<strong>2016</strong>d).<br />
21 World Bank <strong>2016</strong>i.<br />
22 World Bank 2017.<br />
23 United Nations <strong>2016</strong>h.<br />
24 United Nations <strong>2016</strong>h.<br />
25 United Nations <strong>2016</strong>h.<br />
26 United Nations <strong>2016</strong>h.<br />
27 United Nations 2015a.<br />
28 United Nations 2015a.<br />
29 United Nations 2015a.<br />
30 WHO <strong>2016</strong>i.<br />
31 United Nations 2015a.<br />
32 United Nations 2015a.<br />
33 United Nations 2015a.<br />
34 United Nations 2015a.<br />
35 United Nations 2015a.<br />
36 United Nations 2015a.<br />
37 United Nations 2015a.<br />
38 United Nations 2015a.<br />
39 United Nations <strong>2016</strong>h.<br />
40 ITU <strong>2016</strong>a.<br />
41 World Bank <strong>2016</strong>e.<br />
42 UNDESA <strong>2016</strong>d.<br />
43 WHO 2011a; UNDESA 2014a.<br />
44 Cukier and Mayer-Schoenberger 2013.<br />
45 World Bank 2017.<br />
46 UNICEF and World Bank <strong>2016</strong>.<br />
47 WFP <strong>2016</strong>a.<br />
48 Fink and others <strong>2016</strong>.<br />
49 FAO 2011a.<br />
50 McKenzie 2014.<br />
51 UNICEF <strong>2016</strong>c.<br />
52 UNESCO Institute for Statistics <strong>2016</strong>.<br />
53 ILO <strong>2016</strong>d.<br />
54 Woosey 2005; Lattier 2015.<br />
55 Niño-Zarazúa, Roope and Tarp <strong>2016</strong>.<br />
56 World Bank <strong>2016</strong>i.<br />
57 Lawson <strong>2016</strong>.<br />
58 Saez and Zucman 2014.<br />
59 World Bank <strong>2016</strong>p.<br />
60 United Nations <strong>2016</strong>h.<br />
61 DFID 2010.<br />
62 UNDESA 2014b.<br />
63 World Bank 2015g.<br />
64 World Bank <strong>2016</strong>d.<br />
65 United Nations 2015a; WEF 2015.<br />
66 WEF 2015.<br />
67 UNDESA 2014b.<br />
68 UNDESA 2015c.<br />
69 UNDESA 2015a.<br />
70 UNDESA 2015b.<br />
71 Kharas and Gertz 2010.<br />
72 The Economist <strong>2016</strong>a.<br />
73 Kharas and Gertz 2010.<br />
74 Ehrenfreund <strong>2016</strong>.<br />
75 UNFPA 2014.<br />
76 UNDESA 2015b.<br />
77 UNFPA <strong>2016</strong>.<br />
78 Office of the Secretary-General’s<br />
Envoy on Youth <strong>2016</strong>.<br />
79 ILO 2015a; UNDESA <strong>2016</strong>e.<br />
80 UNDESA <strong>2016</strong>e.<br />
81 ILO <strong>2016</strong>e.<br />
82 S4YE 2015.<br />
83 ManpowerGroup <strong>2016</strong>.<br />
84 World Bank 2017.<br />
85 ILO 2015b.<br />
86 Fajgelbaum and Khandelwal <strong>2016</strong>.<br />
87 UNCTAD 2015.<br />
88 McKinsey Global Institute 2014.<br />
89 UNDP 2015a.<br />
90 The Economist <strong>2016</strong>e.<br />
91 The Economist <strong>2016</strong>e.<br />
92 UNHCR <strong>2016</strong>a.<br />
93 UNHCR <strong>2016</strong>a.<br />
94 UNICEF <strong>2016</strong>e.<br />
95 UNHCR <strong>2016</strong>a.<br />
96 Purdie and Khaltarkhuu <strong>2016</strong>.<br />
97 Purdie and Khaltarkhuu <strong>2016</strong>.<br />
98 FAO and WFP <strong>2016</strong>.<br />
99 United Nations 2000a.<br />
100 UN Women 2012.<br />
101 United Nations Peacekeeping <strong>2016</strong>.<br />
102 IEP <strong>2016</strong>.<br />
103 IEP 2015.<br />
104 The Economist <strong>2016</strong>b.<br />
105 IEP <strong>2016</strong>.<br />
106 IEP <strong>2016</strong>.<br />
107 IANYD <strong>2016</strong>.<br />
108 UNESCO <strong>2016</strong>a.<br />
109 ILO 2015c.<br />
110 World Bank <strong>2016</strong>c.<br />
111 World Bank <strong>2016</strong>c.<br />
112 World Bank <strong>2016</strong>c.<br />
113 WHO <strong>2016</strong>h.<br />
114 UNAIDS 2014a.<br />
115 UNAIDS <strong>2016</strong>b.<br />
116 UNAIDS 2014b.<br />
117 UNAIDS 2015.<br />
118 WHO 2015d.<br />
119 WHO 2015b.<br />
120 Ng and others 2014.<br />
121 World Bank 2015d.<br />
122 WHO <strong>2016</strong>a.<br />
123 World Bank <strong>2016</strong>b.<br />
124 CRED and UNISDR 2015.<br />
125 UNISDR 2015.<br />
126 UNDP <strong>2016</strong>f.<br />
127 UNCCD 2015.<br />
128 Braimoh 2015.<br />
129 Newbold and others <strong>2016</strong>.<br />
130 Gjerde 2006; Parker 2015;<br />
PlasticsEurope 2013.<br />
131 Gall and Thompson 2015.<br />
132 GAHP 2014.<br />
133 IEA <strong>2016</strong>b.<br />
134 World Bank and IHME <strong>2016</strong>.<br />
135 IEA <strong>2016</strong>b.<br />
136 IEA <strong>2016</strong>b.<br />
137 World Bank <strong>2016</strong>n.<br />
138 Chao 2012.<br />
139 FAO <strong>2016</strong>b.<br />
140 Mekonnen and Hoekstra <strong>2016</strong>.<br />
141 World Bank <strong>2016</strong>a.<br />
142 EIA <strong>2016</strong>.<br />
143 Coady and others 2015; IEA <strong>2016</strong>c.<br />
144 United Nations <strong>2016</strong>h.<br />
145 United Nations 2010.<br />
146 WHO <strong>2016</strong>c.<br />
147 Hallegatte and others <strong>2016</strong>.<br />
148 World Bank 2017.<br />
149 World Bank <strong>2016</strong>i.<br />
150 Demirgüç-Kunt and others 2014.<br />
151 United Nations 2015a.<br />
152 PAHO-WHO <strong>2016</strong>a.<br />
153 PAHO-WHO <strong>2016</strong>b.<br />
154 United Nations 2015a.<br />
155 Stuart and others <strong>2016</strong>.<br />
156 Stuart and others <strong>2016</strong>.<br />
157 Peracod 2012.<br />
158 Avaaz <strong>2016</strong>.<br />
159 Hollow 2013.<br />
160 Spacehive <strong>2016</strong>.<br />
161 Austin 2011.<br />
162 Statista <strong>2016</strong>.<br />
163 Dean and others 2012.<br />
164 UNDP 2015a.<br />
165 UNICEF 2004.<br />
166 Watson <strong>2016</strong>.<br />
167 Arekapudi 2014.<br />
168 Arekapudi 2014.<br />
Notes | 171
169 Arekapudi 2014.<br />
170 Indrawati 2015.<br />
171 Indrawati 2015.<br />
172 IOC <strong>2016</strong>.<br />
173 Ford <strong>2016</strong>.<br />
174 New York Times <strong>2016</strong>.<br />
175 Indrawati 2015.<br />
176 Indrawati 2015.<br />
177 UN Women <strong>2016</strong>b.<br />
178 UN Women <strong>2016</strong>b.<br />
179 UN Women 2013.<br />
180 BBC News <strong>2016</strong>b.<br />
181 Indrawati 2015.<br />
182 Indrawati 2015.<br />
183 Pew Research Center 2015b.<br />
184 Raub and others <strong>2016</strong>.<br />
185 Greytak and others <strong>2016</strong>.<br />
186 Lyons 2015.<br />
187 UN Women <strong>2016</strong>b.<br />
188 Le Coz <strong>2016</strong>.<br />
189 Ghosh <strong>2016</strong>.<br />
190 UN Women <strong>2016</strong>b.<br />
191 BBC News <strong>2016</strong>a.<br />
192 Avon Global Center for Women and<br />
Justice and others 2011.<br />
193 UN Women <strong>2016</strong>b.<br />
194 Clark <strong>2016</strong>.<br />
195 Banerjee <strong>2016</strong>.<br />
196 Kynge <strong>2016</strong>.<br />
197 World Bank and ECOFYS <strong>2016</strong>.<br />
198 ITC 2014.<br />
199 IEA <strong>2016</strong>c.<br />
200 United Nations 2015c.<br />
201 C2ES 2015.<br />
202 United Nations <strong>2016</strong>e.<br />
203 Bokova <strong>2016</strong>.<br />
Chapter 2<br />
1 UNDESA <strong>2016</strong>c.<br />
2 HDI classifications are based on HDI<br />
fixed cutoff points, which are derived<br />
from the quartiles of distributions of<br />
the component indicators. The cutoff<br />
points are less than 0.550 for low<br />
human development, 0.550–0.699<br />
for medium human development,<br />
0.700–0.799 for high human development<br />
and 0.800 or greater for very<br />
high human development.<br />
3 UNDP 2014c.<br />
4 UNDP 2014d.<br />
5 <strong>Human</strong> <strong>Development</strong> <strong>Report</strong> Office<br />
estimate.<br />
6 <strong>Human</strong> <strong>Development</strong> <strong>Report</strong> Office estimates<br />
based on abridged life-tables<br />
of the United Nations Department of<br />
Economic and Social Affairs (UNDESA<br />
2015d) and data of the Luxembourg<br />
Income Study database (LIS <strong>2016</strong>),<br />
Eurostat’s European Union Statistics<br />
on Income and Living Conditions<br />
(Eurostat <strong>2016</strong>b), the World Bank’s<br />
International Income Distribution<br />
Data Set (World Bank 2013), United<br />
Nations Children’s Fund Multiple<br />
Indicator Cluster Surveys (UNICEF<br />
<strong>2016</strong>b) and Demographic and Health<br />
Surveys (ICF International <strong>2016</strong>)<br />
using the methodology described in<br />
Technical note 2 (available at http://<br />
hdr.undp.org/sites/default/files/<br />
hdr<strong>2016</strong>_ technical_notes.pdf).<br />
7 <strong>Human</strong> <strong>Development</strong> <strong>Report</strong> Office<br />
estimates based on UNDESA (2015d).<br />
8 <strong>Human</strong> <strong>Development</strong> <strong>Report</strong> Office<br />
estimates based on data from<br />
UNDESA (2015d), UNESCO Institute<br />
for Statistics (<strong>2016</strong>), UNSD (<strong>2016</strong>),<br />
World Bank (<strong>2016</strong>o), Barro and Lee<br />
(2015) and IMF (<strong>2016</strong>d).<br />
9 <strong>Human</strong> <strong>Development</strong> <strong>Report</strong> Office<br />
estimates based on the GDI.<br />
10 <strong>Human</strong> <strong>Development</strong> <strong>Report</strong> Office<br />
estimates based on data from the UN<br />
Maternal Mortality Estimation Group<br />
(<strong>2016</strong>), UNDESA (2015d), IPU (<strong>2016</strong>),<br />
UNESCO Institute for Statistics (<strong>2016</strong>)<br />
and ILO (<strong>2016</strong>c).<br />
11 <strong>Human</strong> <strong>Development</strong> <strong>Report</strong> Office<br />
estimates based on IPU (<strong>2016</strong>), ILO<br />
(<strong>2016</strong>c), UN Maternal Mortality<br />
Estimation Group (<strong>2016</strong>), UNDESA<br />
(2015d) and UNESCO (<strong>2016</strong>b).<br />
12 <strong>Human</strong> <strong>Development</strong> <strong>Report</strong><br />
Office estimates based on data on<br />
household deprivations in education,<br />
health and living standards from<br />
various household surveys using the<br />
methodology described in Technical<br />
note 1 (available at http://hdr.undp.<br />
org/sites/default/files/hdr<strong>2016</strong>_<br />
technical_notes.pdf).<br />
13 United Nations 2015a.<br />
14 United Nations 2015a.<br />
15 UN-Habitat 2014.<br />
16 <strong>Human</strong> <strong>Development</strong> <strong>Report</strong> Office<br />
estimates.<br />
17 Agbor 2012.<br />
18 Watkins, van Fleet and Greubel 2012.<br />
19 Phiri and Ataguba 2014.<br />
20 UNICEF 2014a.<br />
21 UNESCO 2015a.<br />
22 UNESCO 2015b.<br />
23 <strong>Human</strong> <strong>Development</strong> <strong>Report</strong> Office<br />
estimates based on ILO (<strong>2016</strong>c).<br />
24 SIDA 2015.<br />
25 United Nations 2015a.<br />
26 <strong>Human</strong> <strong>Development</strong> <strong>Report</strong> Office<br />
estimates based on UNESCO (<strong>2016</strong>b).<br />
27 <strong>Human</strong> <strong>Development</strong> <strong>Report</strong> Office<br />
estimates based on UN Maternal<br />
Mortality Estimation Group (<strong>2016</strong>) and<br />
UNDESA (2015d).<br />
28 WHO <strong>2016</strong>g.<br />
29 UNICEF 2014b.<br />
30 UNICEF <strong>2016</strong>a.<br />
31 Acid Survivors Foundation <strong>2016</strong>.<br />
32 Thomson <strong>2016</strong>.<br />
33 World Bank 2015h.<br />
34 UNDP <strong>2016</strong>a.<br />
35 United Nations <strong>2016</strong>g.<br />
36 UNDP <strong>2016</strong>e.<br />
37 <strong>Human</strong> <strong>Development</strong> <strong>Report</strong> Office<br />
estimates based on UNDESA (2015d).<br />
38 <strong>Human</strong> <strong>Development</strong> <strong>Report</strong> Office<br />
estimates based on World Bank<br />
(<strong>2016</strong>o).<br />
39 <strong>Human</strong> <strong>Development</strong> <strong>Report</strong> Office<br />
estimates based on FAO (2011b).<br />
40 UNRWA 2013.<br />
41 UNESCO and UNICEF 2015.<br />
42 UNESCO 2013a.<br />
43 Much of the data in this section are<br />
from Martinez-Franzoni and Sánchez-<br />
Ancochea (<strong>2016</strong>).<br />
44 Baru and others 2010.<br />
45 Krishnan and others <strong>2016</strong>.<br />
46 Kronfol 2012.<br />
47 UNDP <strong>2016</strong>i.<br />
48 UNDP <strong>2016</strong>c.<br />
49 UNFPA 2015.<br />
50 UNDP 2012b.<br />
51 OECD and UNDESA 2013.<br />
52 UNHCR <strong>2016</strong>c.<br />
53 IOM 2014.<br />
54 UNDP 2009.<br />
55 UNHCR <strong>2016</strong>b.<br />
56 Watkins 2013.<br />
57 UNDESA <strong>2016</strong>a.<br />
58 IFAD 2012.<br />
59 UNDESA 2013a.<br />
60 IHS <strong>2016</strong>.<br />
61 IWGIA <strong>2016</strong>.<br />
62 UNDESA <strong>2016</strong>e.<br />
63 ABC News 2015.<br />
64 ONS 2012.<br />
65 Gates and Newport 2012.<br />
66 ILGA <strong>2016</strong>b.<br />
67 WHO 2015e.<br />
68 Butler 1980.<br />
69 Shriver Center <strong>2016</strong>.<br />
70 UN Women 2015a.<br />
71 HelpAge International and Center for<br />
Demographic Research 2015.<br />
72 Kelley and others 2015.<br />
73 UCL Institute of Health Equity 2010.<br />
74 WHO 2011b.<br />
75 Evans-Lacko and others 2013.<br />
76 Angermeyer, Matschinger and<br />
Schomerus 2013.<br />
77 WHO <strong>2016</strong>f.<br />
78 WHO <strong>2016</strong>f.<br />
79 <strong>Human</strong> <strong>Development</strong> <strong>Report</strong><br />
Office estimates based on data on<br />
household deprivation in education,<br />
health and living standards from<br />
various household surveys using the<br />
methodology described in Technical<br />
note 1 (available at http://hdr.undp.<br />
org/sites/default/files/hdr<strong>2016</strong>_<br />
technical_notes.pdf).<br />
80 UNESCO 2014b.<br />
81 Sandefur <strong>2016</strong>.<br />
82 UNESCO 2014b.<br />
83 UNESCO 2014b.<br />
84 <strong>Human</strong> <strong>Development</strong> <strong>Report</strong> Office<br />
estimates based on UNDESA (2015d).<br />
85 IHME <strong>2016</strong>.<br />
86 Murray and others 2015.<br />
87 Checchi and van der Werfhorst 2014.<br />
88 ITU <strong>2016</strong>b.<br />
89 Kreft and others 2015.<br />
90 UNICEF 2011.<br />
91 United Nations 2015a.<br />
92 Strong and Schwartz <strong>2016</strong>.<br />
93 Global Witness <strong>2016</strong>.<br />
94 Hillis and others 2014.<br />
95 End Violence Against Children: The<br />
Global Partnership <strong>2016</strong>.<br />
96 The World Health Organization<br />
defines elder abuse as an act of commission<br />
or of omission (neglect) that<br />
may be intentional or psychological<br />
(involving emotional or verbal aggression)<br />
financial or material, inflicting<br />
unnecessary suffering, injury or pain.<br />
97 WHO 2015e.<br />
98 UNODC 2013.<br />
99 <strong>Human</strong> <strong>Development</strong> <strong>Report</strong> Office<br />
estimates based on UNODC (<strong>2016</strong>).<br />
100 Torche <strong>2016</strong>.<br />
101 Blanden 2013; Duncan and Murnane<br />
2011; Torche 2014.<br />
102 Piraino 2015.<br />
103 Keswell, Girdwood and Leibbrandt<br />
2013.<br />
104 Serafina and Tonkin 2014.<br />
105 McGinn, Castro and Lingo 2015.<br />
106 Lambert, Ravallion and van de Walle<br />
2014.<br />
107 UNDP 2014b.<br />
108 At the time of writing, there were<br />
more than 9.7 million survey votes<br />
on what matters to respondents. The<br />
data may not be statistically representative<br />
in all countries and subpopulations,<br />
but the results are indicative<br />
of variations in values. The responses<br />
are based on subjective evaluations.<br />
See United Nations (<strong>2016</strong>a).<br />
109 See Pew Research Center (2014).<br />
The survey involved face to face<br />
interviews with approximately 1,000<br />
respondents in each country, except<br />
China (3,190) and India (2,464).<br />
110 <strong>Human</strong> <strong>Development</strong> <strong>Report</strong> Office<br />
estimates based on data from Barro<br />
and Lee (2015), IMF (<strong>2016</strong>d), UNDESA<br />
(2015d, <strong>2016</strong>e), UNDP (1990),<br />
UNESCO (<strong>2016</strong>b) and World Bank<br />
(<strong>2016</strong>o).<br />
111 ILGA <strong>2016</strong>c.<br />
112 Raub and others <strong>2016</strong>.<br />
113 World Bank 2015h.<br />
114 UNDP 2015a.<br />
115 Demirgüç-Kunt and others 2014.<br />
116 Banning-Lover <strong>2016</strong>.<br />
117 UNDP 2015a.<br />
118 Charmes 2015.<br />
119 Abadeer 2015.<br />
120 WHO <strong>2016</strong>d.<br />
121 UNICEF <strong>2016</strong>b.<br />
122 IPPR 2012.<br />
123 OECD 2011.<br />
124 Nave 2000.<br />
125 United Nations 2014.<br />
126 See Wimmer (2012). The size of the<br />
politically excluded population is calculated<br />
as a function of the number of<br />
power sharing elites.<br />
127 Alesina, Michalopoulos and<br />
Papaioannou 2012.<br />
128 Milanović <strong>2016</strong>.<br />
129 Milanović <strong>2016</strong>.<br />
130 Desai 2007.<br />
131 Desai 2007.<br />
132 Pan and Christiaensen 2012.<br />
133 Stampini and Tornarolli 2012.<br />
172 | HUMAN DEVELOPMENT REPORT <strong>2016</strong>
134 Darrow and Tomas 2005; Johnson and<br />
Start 2001.<br />
135 See Marx and others (2015), which<br />
is based on data from a sample of<br />
73 mostly high- and middle-income<br />
countries.<br />
136 Ortiz and others 2013.<br />
137 Wimmer 2012.<br />
Chapter 3<br />
1 Sen 1985, p. 203.<br />
2 Alkire 2010, p. 1.<br />
3 United Nations 1948.<br />
4 Nussbaum 2003.<br />
5 UNDP 2000, p. 21.<br />
6 UNDP 2000, p. 21.<br />
7 UNDP 2010a.<br />
8 Alkire 2009.<br />
9 United Nations Broadband<br />
Commission for Digital <strong>Development</strong><br />
2015; UNODC 2014b.<br />
10 UNDP 1994, p. 22.<br />
11 Gómez, Muto and Kamidohzono <strong>2016</strong>.<br />
12 Kahneman and Tversky 2000.<br />
13 Kahneman and Tversky 2000; Thaler<br />
2015.<br />
14 Ariely 2008, 2015.<br />
15 World Bank 2015i.<br />
16 Ariely 2008; Diamond and Vartiainen<br />
2007.<br />
17 Banerjee and Duflo 2011; Karlan and<br />
Appel 2011.<br />
18 Thaler and Sunstein 2008.<br />
19 Thaler and Sunstein 2008; World Bank<br />
2015i.<br />
20 Deneulin 2008.<br />
21 Stewart 2013.<br />
22 Deneulin <strong>2016</strong>.<br />
23 United Nations <strong>2016</strong>b.<br />
24 Mandavilli <strong>2016</strong>; Moss-Racusin and<br />
others 2012.<br />
25 Gillian and others <strong>2016</strong>.<br />
26 Nussbaum 2003.<br />
27 UNDP <strong>2016</strong>a; World Bank 2014.<br />
28 UNDP 2011b, p. 2. See also Sen<br />
(2009).<br />
29 United Nations 2015b.<br />
30 Power <strong>2016</strong>.<br />
31 UN Women n.d.<br />
32 Social Progress Imperative <strong>2016</strong>.<br />
33 UNDP 2010b, 2012b, 2014d.<br />
34 United Nations 2015c.<br />
35 ICF International <strong>2016</strong>; UNICEF <strong>2016</strong>b;<br />
World Bank <strong>2016</strong>g.<br />
36 UNDP 2015b.<br />
37 UNDP <strong>2016</strong>i.<br />
38 United Nations 2015c.<br />
39 UNESCO 2014a.<br />
40 Based on UNDESA (2015d).<br />
41 Murray and others 2015.<br />
42 The Social Progress Imperative’s<br />
Social Progress Index website (www.<br />
socialprogressimperative.org/ globalindex/,<br />
accessed 12 December <strong>2016</strong>).<br />
43 The Sustainable <strong>Development</strong><br />
Solutions Network’s World<br />
Happiness <strong>Report</strong> website (http://<br />
worldhappiness.report, accessed 12<br />
December <strong>2016</strong>).<br />
44 The Organisation for Economic<br />
Co-operation and <strong>Development</strong>’s<br />
Better Life Index website (www.<br />
oecdbetterlifeindex.org, accessed 12<br />
December <strong>2016</strong>).<br />
45 Centre for Bhutan Studies and<br />
GNH Research’s Gross National<br />
Happiness website (www.<br />
grossnationalhappiness.com/ articles/,<br />
accessed 12 December <strong>2016</strong>).<br />
46 UK Office for National<br />
Statistics’s National Wellbeing<br />
Website (www.ons.gov.uk/<br />
peoplepopulationandcommunity/wellbeing,<br />
accessed 12 December <strong>2016</strong>).<br />
47 Ballivian 2015.<br />
48 GWG <strong>2016</strong>.<br />
49 WEF <strong>2016</strong>c.<br />
50 The UN Secretary-General created<br />
the Global Pulse Initiative in 2009 to<br />
harness Big Data as a public good in<br />
the service of sustainable development<br />
and humanitarian action. The<br />
UN Statistical Commission formed<br />
the Global Working Group on Big Data<br />
in 2014. The Global Partnership on<br />
Sustainable <strong>Development</strong> Data was<br />
formed among governments, corporate<br />
partners, the United Nations,<br />
international financial institutions,<br />
and nonprofit and academic stakeholders.<br />
It currently has more than<br />
150 members.<br />
Chapter 4<br />
1 UNDP 2015a.<br />
2 Dewan and Randolph <strong>2016</strong>; Global<br />
Citizen <strong>2016</strong>.<br />
3 Demirgüç-Kunt and others 2014.<br />
4 Epstein 2007.<br />
5 Rizwanul and Iyanatul 2015.<br />
6 Demirgüç-Kunt and others 2014.<br />
7 Demirgüç-Kunt and others 2014.<br />
8 UNDP 2015a.<br />
9 Harris and Marks 2009.<br />
10 Hillman and Jenkner 2004.<br />
11 World Bank 2011a.<br />
12 INSD <strong>2016</strong>; Soura 2015.<br />
13 Filou 2014.<br />
14 BRAC Centre <strong>2016</strong>.<br />
15 BRAC Afghanistan <strong>2016</strong>.<br />
16 Bill & Melinda Gates Foundation<br />
<strong>2016</strong>.<br />
17 United Nations Secretary General’s<br />
High-Level Panel on Access to<br />
Medicines <strong>2016</strong>.<br />
18 CID <strong>2016</strong>.<br />
19 United Nations Secretary General’s<br />
High-Level Panel on Access to<br />
Medicines <strong>2016</strong>.<br />
20 UNDESA 2014a.<br />
21 WFP <strong>2016</strong>b.<br />
22 United Nations <strong>2016</strong>h.<br />
23 World Bank <strong>2016</strong>i.<br />
24 Wiemann and Eibs-Singer <strong>2016</strong>.<br />
25 FAO and ILSI 1997.<br />
26 Allen and others 2006.<br />
27 SIDA 2015.<br />
28 US Bureau of Labor Statistics <strong>2016</strong>.<br />
29 UNDP 2015a.<br />
30 UNEP <strong>2016</strong>.<br />
31 Bonet and Cibils 2013.<br />
32 UNDP 2013a.<br />
33 UNESCO 2013c.<br />
34 UN Women <strong>2016</strong>c.<br />
35 SIDA 2015.<br />
36 Grant Thornton <strong>2016</strong>.<br />
37 Teigen 2012.<br />
38 World Bank 2015e.<br />
39 The Economist <strong>2016</strong>c.<br />
40 Kembhavi 2013.<br />
41 Deloitte 2014.<br />
42 Austin 2011.<br />
43 United Nations <strong>2016</strong>h.<br />
44 WEF <strong>2016</strong>a.<br />
45 Schwab <strong>2016</strong>; Williams-Grut <strong>2016</strong>.<br />
46 UNDP 2015a.<br />
47 UNDP 2015a.<br />
48 Cecchini and others 2015.<br />
49 UNDP 2015a.<br />
50 UNFPA and HelpAge International<br />
2012.<br />
51 UNDP 2015a.<br />
52 See Statistical table 10.<br />
53 Roy, Heuty and Letouzé 2007.<br />
54 Cashin <strong>2016</strong>.<br />
55 World Bank 2006.<br />
56 World Bank 2006.<br />
57 World Bank <strong>2016</strong>k.<br />
58 Kar and Spanjers 2015.<br />
59 Amundsen 2014.<br />
60 Nnochiri 2012.<br />
61 Nair <strong>2016</strong>.<br />
62 Coady and others 2015.<br />
63 UNDP 1991.<br />
64 PATH 2013.<br />
65 Brown and Langer 2015.<br />
66 Lloyd 2015.<br />
67 Mann 2014.<br />
68 Cambodian Disabled People’s<br />
Organization 2015.<br />
69 Asia Foundation 2013.<br />
70 UNDP 2015a.<br />
71 Rizwanul and Iyanatul 2015.<br />
72 UNDP 2015a.<br />
73 Neuvonen <strong>2016</strong>.<br />
74 BBC News <strong>2016</strong>c.<br />
75 World Bank 2015f.<br />
76 Rutkowski <strong>2016</strong>.<br />
77 UNAIDS <strong>2016</strong>e.<br />
78 UNAIDS 2015.<br />
79 WHO <strong>2016</strong>j.<br />
80 The Guardian <strong>2016</strong>a.<br />
81 WHO <strong>2016</strong>j.<br />
82 Zimmer <strong>2016</strong>.<br />
83 UNDP <strong>2016</strong>h.<br />
84 UNDP <strong>2016</strong>j.<br />
85 Brodzinsky 2014.<br />
86 World Bank 2015j.<br />
87 UNDESA 2015f.<br />
88 World Bank 2015a.<br />
89 Coady, Flamini and Sears 2015.<br />
90 World Bank 2015a.<br />
91 World Bank 2015a.<br />
92 Vaughan <strong>2016</strong>.<br />
93 World Bank 2015a.<br />
94 United Nations 1948.<br />
95 UNDP <strong>2016</strong>g.<br />
96 World Bank <strong>2016</strong>f.<br />
97 United Nations 2013.<br />
98 Banisar 2015.<br />
Chapter 5<br />
1 For actions with positive externalities<br />
the result is underprovision, as<br />
individuals or countries decide to<br />
free-ride without contributing to their<br />
supply. For actions with negative<br />
externalities there is a tendency to<br />
overprovision or overexploitation, as<br />
some individual or countries do not<br />
absorb their direct cost.<br />
2 UNCTAD <strong>2016</strong>.<br />
3 UNDESA 2015c.<br />
4 UNDESA 2013b.<br />
5 UNDP 2009.<br />
6 For example, in 2015 remittances<br />
to Sub- Saharan Africa amounted to<br />
2.46 percent of GDP, over three times<br />
more than in 1990. In Latin America<br />
and the Caribbean they almost<br />
tripled over the same time period, to<br />
1.43 percent of GDP. In 2015 global<br />
remittances came to more than four<br />
times global official development<br />
assistance (World Bank <strong>2016</strong>h). See<br />
also UNDP (2015a).<br />
7 <strong>Human</strong> <strong>Development</strong> <strong>Report</strong> Office estimate<br />
based on data from the United<br />
Nations Department of Economic<br />
and Social Affairs, the Office of the<br />
United Nations High Commissioner<br />
for Refugees and the United Nations<br />
Relief and Works Agency for Palestine<br />
Refugees in the Near East.<br />
8 IMF <strong>2016</strong>a.<br />
9 Thacker 1999; Dreher, Sturm and<br />
Vreeland 2009; Reinhart and Trebesch<br />
<strong>2016</strong>.<br />
10 IMF <strong>2016</strong>b.<br />
11 Independent Evaluation Office of the<br />
International Monetary Fund 2013,<br />
p. 1.<br />
12 Eichengreen and Woods <strong>2016</strong>.<br />
13 Ocampo 2015a.<br />
14 World Bank <strong>2016</strong>m.<br />
15 Clemens and Kremer <strong>2016</strong>; Ravallion<br />
<strong>2016</strong>.<br />
16 Subramanian and Wei 2007.<br />
17 Seth <strong>2016</strong>.<br />
18 Even creating tensions with democratic<br />
principles, as described by Rodrik<br />
(2011).<br />
19 Chang 2002.<br />
20 Montes and Lunenborg <strong>2016</strong>.<br />
21 Protection can go beyond foreign<br />
direct investment flows. For instance,<br />
the North American Free Trade<br />
Agreement introduced clauses to<br />
limit potential regulations not only for<br />
foreign direct investment , but also for<br />
destabilizing short-term speculative<br />
flows (Gallager and others 2013).<br />
22 Montes and Lunenborg <strong>2016</strong>;<br />
Mercurio 2014.<br />
23 Montes and Lunenborg <strong>2016</strong>.<br />
24 Jenks and Topping <strong>2016</strong>.<br />
Notes | 173
25 Equivalent to $135 billion in 2014.<br />
UNSD <strong>2016</strong>; World Bank <strong>2016</strong>o.<br />
26 Equivalent to $48 billion in 2014.<br />
Jenks and Topping <strong>2016</strong>; World Bank<br />
<strong>2016</strong>o.<br />
27 Data are the average for the period<br />
2008–2015 to include the response to<br />
the global financial crisis (IMF <strong>2016</strong>c;<br />
World Bank <strong>2016</strong>o).<br />
28 Data are for 2012. Ocampo 2015a;<br />
World Bank <strong>2016</strong>o.<br />
29 European Union 2014.<br />
30 UNCTAD 2014. Similar estimates can<br />
be found in Schmidt-Traub (2015).<br />
31 Comparing the UN budget ($48 billion)<br />
with the estimated annual resource<br />
gap of implementing the Sustainable<br />
<strong>Development</strong> Goals in developing<br />
countries ($2.5 trillion).<br />
32 OECD <strong>2016</strong>f, table 4.<br />
33 Pollin <strong>2016</strong>.<br />
34 UNHCR 2015a.<br />
35 UNHCR 2015b.<br />
36 Perlo-Freeman and others <strong>2016</strong>.<br />
37 UCDP <strong>2016</strong>.<br />
38 Kaldor 1999.<br />
39 Weiss 2007; Kaldor 2013.<br />
40 Wiist and others 2014.<br />
41 United Nations <strong>2016</strong>d.<br />
42 UNHCR <strong>2016</strong>a.<br />
43 OECD <strong>2016</strong>d.<br />
44 OECD <strong>2016</strong>d.<br />
45 United Nations 2000b.<br />
46 United Nations 2015c.<br />
47 UNDESA <strong>2016</strong>b.<br />
48 ECOSOC 2015.<br />
49 UNDESA <strong>2016</strong>b.<br />
50 W3 Techs <strong>2016</strong>.<br />
51 World Bank <strong>2016</strong>p.<br />
52 Del Vicario and others <strong>2016</strong>.<br />
53 Ocampo 2015a.<br />
54 Council on Foreign Relations 2015.<br />
55 Ocampo 2015b.<br />
56 Ocampo 2015a.<br />
57 Matheson 2011.<br />
58 Becchetti, Ferrari and Trenta 2014.<br />
59 IMF 2012.<br />
60 Ostry and others 2011.<br />
61 Montes and Lunenborg <strong>2016</strong>.<br />
62 United Nations Secretary-General’s<br />
High-Level Panel on Access to<br />
Medicines <strong>2016</strong>.<br />
63 Montes and Lunenborg <strong>2016</strong>.<br />
64 IOM 2015.<br />
65 UNHCR 2014.<br />
66 The Economist <strong>2016</strong>d.<br />
67 See details in Zucman (2015).<br />
68 See details in Zucman (2015).<br />
69 African Union and Economic<br />
Commission for Africa 2015.<br />
70 Independent Commission on<br />
Multilateralism <strong>2016</strong>; Pollin <strong>2016</strong>;<br />
IEA <strong>2016</strong>d.<br />
71 IEA <strong>2016</strong>d; Pollin <strong>2016</strong>.<br />
72 Independent Commission on<br />
Multilateralism <strong>2016</strong>.<br />
73 Pollin <strong>2016</strong>.<br />
74 World Resources Institute <strong>2016</strong>.<br />
75 IEA <strong>2016</strong>a.<br />
76 Pollin <strong>2016</strong>.<br />
77 UNDP 2015a.<br />
78 Ocampo 2015a.<br />
79 Griffith-Jones <strong>2016</strong>.<br />
80 Ocampo 2015a.<br />
81 Griffith-Jones and Cozzi 2015.<br />
82 OECD 2008.<br />
83 Brazil’s development cooperation<br />
is significantly higher according<br />
to the official figures published<br />
by the Brazilian government. The<br />
Organisation for Economic Cooperation<br />
and <strong>Development</strong> uses<br />
these data but, for its analysis, only<br />
includes in its estimates activities<br />
in low- and middle-income countries<br />
and contributions to multilateral<br />
agencies whose main aim is promoting<br />
the economic development and<br />
welfare of developing countries (or<br />
a percentage of these contributions<br />
when a multilateral agency does not<br />
work exclusively on development<br />
activities in developing countries).<br />
The Organisation for Economic<br />
Co-operation and <strong>Development</strong> also<br />
excludes bilateral peacekeeping activities.<br />
Brazil’s official data may exclude<br />
some activities that would be included<br />
as development cooperation in<br />
<strong>Development</strong> Assistance Committee<br />
statistics and so are also excluded<br />
from the Organisation for Economic<br />
Co-operation and <strong>Development</strong><br />
estimates that are based on Brazil’s<br />
own data. (www.oecd.org/dac/<br />
dac-global-relations/brazil-development-co-operation.htm).<br />
84 All data are Organisation for<br />
Economic Co-operation and<br />
<strong>Development</strong> estimates, except<br />
those for the Russian Federation<br />
and the United Arab Emirates, which<br />
do not report to the Organisation<br />
for Economic Co-operation and<br />
<strong>Development</strong> (www.oecd.org/development/stats/non-dac-reporting.htm).<br />
85 GIZ 2014.<br />
86 WFP 2014.<br />
87 UNOSSC <strong>2016</strong>.<br />
88 Jenks and Topping <strong>2016</strong>.<br />
89 Sachs 2012.<br />
90 Adaptation Fund 2015; United Nations<br />
2011.<br />
91 UNDESA 2012.<br />
92 Hemmelgarn and others 2015; Council<br />
of the European Union <strong>2016</strong>.<br />
93 WHO 2013.<br />
94 UNDP 2014b.<br />
95 Tanner 2000.<br />
96 UNDP 2014b.<br />
97 Khan <strong>2016</strong>.<br />
98 The Guardian <strong>2016</strong>b.<br />
99 UNSD 2008.<br />
100 World Bank 2011b.<br />
101 European Union 2012.<br />
102 Open Government Partnership website<br />
(www.opengovpartnership.org,<br />
accessed 26 September <strong>2016</strong>).<br />
103 UNDESA 2014a.<br />
104 United States of America 2009.<br />
105 United Kingdom 2010.<br />
106 Republic of Kenya 2011.<br />
107 Republic of Ghana 2012.<br />
108 State of Japan 2013.<br />
109 United Nations <strong>2016</strong>f.<br />
Chapter 6<br />
1 ODI <strong>2016</strong>.<br />
2 WEF <strong>2016</strong>b.<br />
174 | HUMAN DEVELOPMENT REPORT <strong>2016</strong>
References<br />
Abadeer, A.S.Z. 2015. Norms and Gender Discrimination in<br />
the Arab World. New York: Palgrave Macmillan.<br />
ABC (Australian Broadcasting Corporation) News.<br />
2015. “ABS Collects Data on Sexual Orientation for First<br />
Time.” PM (news broadcast), 6 July. www.abc.net.au/<br />
news/2015-07-06/abs-collects-data-on-sexual-orientationfor-first/6599506.<br />
Accessed 26 October <strong>2016</strong>.<br />
Acid Survivors Foundation. <strong>2016</strong>. “Statistics.” www.<br />
acidsurvivors.org/Statistics. Accessed 11 October <strong>2016</strong>.<br />
Adaptation Fund. 2015. “About the Adaptation Fund.” www.<br />
adaptation-fund.org/about/. Accessed 30 September <strong>2016</strong>.<br />
African Union and Economic Commission for Africa.<br />
2015. Illicit Financial Flows: <strong>Report</strong> of the High Level<br />
Panel on Illicit Financial Flows from Africa. www.<br />
uneca.org/sites/default/files/PublicationFiles/iff_main_<br />
report_26feb_en.pdf. Accessed 8 November <strong>2016</strong>.<br />
Agartan, T.I. 2012. “Marketization and Universalism:<br />
Crafting the Right Balance in the Turkish Healthcare<br />
System.” Current Sociology 60(4): 456–471.<br />
Agbor, J. 2012. “Op-Ed: Poverty, Inequality and Africa’s<br />
Education Crisis.” Brookings Institution, Washington, DC.<br />
www.brookings.edu/opinions/poverty-inequality-andafricas-education-crisis/.<br />
Accessed 26 October <strong>2016</strong>.<br />
Alesina, A.F., S. Michalopoulos and E. Papaioannou.<br />
2012. “Ethnic Inequality.” NBER Working Paper 18512,<br />
National Bureau of Economic Research, Cambridge, MA.<br />
www.nber.org/papers/w18512.pdf. Accessed 27 October<br />
<strong>2016</strong>.<br />
Alkire, S. 2009. “Concepts and Measures of Agency.” In K.<br />
Basu and R. Kanbur, eds., Arguments for a Better World:<br />
Essays in Honor of Amartya Sen. Volume I: Ethics, Welfare,<br />
and Measurement and Volume II: <strong>Development</strong>, Society,<br />
and Institutions. Oxford, UK: Oxford University Press.<br />
———. 2010. “<strong>Human</strong> <strong>Development</strong>: Definitions, Critiques,<br />
and Related Concepts.” <strong>Human</strong> <strong>Development</strong> Research<br />
Paper 2010/01. United Nations <strong>Development</strong> Programme,<br />
New York.<br />
Allen, L., B. de Benoist, O. Dary and R. Hurrell, eds.<br />
2006. Guidelines on Food Fortification with Micronutrients.<br />
Geneva: World Health Organization; Rome: Food and<br />
Agriculture Organization of the United Nations. www.<br />
who.int/nutrition/publications/guide_food_fortification_<br />
micronutrients.pdf. Accessed 22 November <strong>2016</strong>.<br />
Amundsen, I. 2014. “Corruption and Other Leakages.” Paper<br />
presented at the 2014 Natural Resource Charter Conference<br />
“Strengthening Resource Governance,” 12–13 June, Oxford,<br />
UK. www.cmi.no/publications/5247-corruption-and-otherleakages.<br />
Accessed 7 November <strong>2016</strong>.<br />
Angermeyer, M.C., H. Matschinger and G. Schomerus.<br />
2013. “Public Attitudes towards People with Depression<br />
in Times of Uncertainty: Results from Three Population<br />
Surveys in Germany.” Social Psychiatry and Psychiatric<br />
Epidemiology 48(9): 1513–1518.<br />
Arekapudi, N. 2014. “Credit for All: Increasing Women’s<br />
Access to Finance.” Thomson Reuters Foundation<br />
News, 11 November. New York. http://news.trust.org//<br />
item/20141111224416-boan9/. Accessed 14 October<br />
<strong>2016</strong>.<br />
Ariely, D. 2008. Predictably Irrational: The Hidden Forces<br />
That Shape Our Decisions. New York: HarperCollins.<br />
———. 2015. Irrationally Yours: On Missing Socks,<br />
Pickup Lines, and Other Existential Puzzles. New York:<br />
HarperCollins.<br />
Asia Foundation. 2013. “The Right to Vote: Filipinos<br />
with Disabilities and the 2013 Elections.” Manila, The<br />
Philippines. https://asiafoundation.org/resources/pdfs/<br />
PWDs2013Elections.pdf. Accessed 7 November <strong>2016</strong>.<br />
———. 2015. 50 Years of Indian Technical and Economic<br />
Cooperation. Indian <strong>Development</strong> Cooperation Research<br />
<strong>Report</strong>. Manila, The Philippines. www.cprindia.org/sites/<br />
default/files/working_papers/IDCR%20<strong>Report</strong>%20-%20<br />
50%20years%20of%20ITEC.pdf. Accessed 19 November<br />
<strong>2016</strong>.<br />
Austin, L. 2011. “The Politics of Youth Bulge: From Islamic<br />
Activism to Democratic Reform in the Middle East and<br />
North Africa.” SAIS Review of International Affairs 31(2):<br />
81–96.<br />
Avaaz. <strong>2016</strong>. “Climate Change: The Beginning of the End<br />
of Fossil Fuels.” https://avaaz.org/page/en/highlights/.<br />
Accessed 11 October <strong>2016</strong>.<br />
Avon Global Center for Women and Justice, New<br />
York City Bar Association, Cornell Law School<br />
International <strong>Human</strong> Rights Clinic and Virtue<br />
Foundation. 2011. “Combating Acid Violence in<br />
Bangladesh, India, and Cambodia.” New York. www.<br />
lawschool.cornell.edu/womenandjustice/upload/<br />
Combating-Acid-Violence-<strong>Report</strong>.pdf. Accessed 14<br />
October <strong>2016</strong>.<br />
Ballivian, A. 2015. “Using Big Data for the Sustainable<br />
<strong>Development</strong> Goals.” Global Working Group on Big Data<br />
for Official Statistics, New York. http://unstats.un.org/<br />
unsd/trade/events/2015/abudhabi/presentations/<br />
day3/02/2b%20A-Using%20Big%20Data%20for%20<br />
the%20Sustainable%20<strong>Development</strong>%20Goals%20<br />
10222015.pdf. Accessed 7 November <strong>2016</strong>.<br />
Banerjee, A., and E. Duflo. 2011. Poor Economics: A<br />
Radical Rethinking of the Way to Fight Global Poverty.<br />
Philadelphia: Public Affairs.<br />
Banerjee, B. <strong>2016</strong>. “India State Aims to Plant a Record 50<br />
Million Trees in a Day.” Associated Press, 11 July. http://<br />
bigstory.ap.org/article/6421397504594f6e80a179d07f35<br />
f8d3/india-state-aims-plant-record-50-million-trees-day.<br />
Accessed 26 August <strong>2016</strong>.<br />
Banisar, D. 2015. “National Right to Information Laws,<br />
Regulations and Initiatives 2015.” Article 19: Global<br />
Campaign for Free Expression. http://dx.doi.org/10.2139/<br />
ssrn.1857498. Accessed 7 November <strong>2016</strong>.<br />
Banning-Lover, R. <strong>2016</strong>. “Russia and the US Have the<br />
Worst Employment Gaps for Disabled People.” The<br />
Guardian, 23 June. www.theguardian.com/globaldevelopment-professionals-network/<strong>2016</strong>/jun/23/<br />
russia-and-the-us-have-the-worst-employment-gaps-fordisabled-people.<br />
Accessed 25 August <strong>2016</strong>.<br />
Banu, A. <strong>2016</strong>. “<strong>Human</strong> <strong>Development</strong>, Disparity and<br />
Vulnerability: Women in South Asia.” Background paper<br />
for <strong>Human</strong> <strong>Development</strong> <strong>Report</strong> <strong>2016</strong>. United Nations<br />
<strong>Development</strong> Programme, <strong>Human</strong> <strong>Development</strong> <strong>Report</strong><br />
Office, New York.<br />
Barro, R.J., and J.-W. Lee. 2015. Education Matters: Global<br />
Schooling Gains from the 19th to the 21st Century. New<br />
York: Oxford University Press.<br />
Baru, R., A. Acharya, S. Acharya, A.K. Shiva Kumar<br />
and K. Nagaraj. 2010. “Inequities in Access to Health<br />
Services in India: Caste, Class and Region.” Economic and<br />
Political Weekly 45(38): 49–58.<br />
BBC News. <strong>2016</strong>a. “Colombia’s President Santos Enacts<br />
Tougher Law on Acid Attacks.” 19 January. www.bbc.<br />
com/news/world-latin-america-35349222. Accessed 14<br />
October <strong>2016</strong>.<br />
———. <strong>2016</strong>b. “Gambia and Tanzania Outlaw Child<br />
Marriage.” 8 July. www.bbc.com/news/worldafrica-36746174.<br />
Accessed 14 October <strong>2016</strong>.<br />
———. <strong>2016</strong>c. “Switzerland’s Voters Reject Basic<br />
Income Plan.” 5 June. www.bbc.com/news/worldeurope-36454060.<br />
Accessed 7 November <strong>2016</strong>.<br />
Becchetti, L., M. Ferrari and U. Trenta. 2014. “The Impact<br />
of the French Tobin Tax.” Journal of Financial Stability 15:<br />
127–148.<br />
Bill & Melinda Gates Foundation. <strong>2016</strong>. “What We<br />
Do: Vaccine Delivery Strategy Overview.” Seattle<br />
www.gatesfoundation.org/What-We-Do/Global-<br />
<strong>Development</strong>/Vaccine-Delivery. Accessed 17 December<br />
<strong>2016</strong>.<br />
Blanden, J. 2013. “Cross-country Rankings in<br />
Intergenerational Mobility: A Comparison of Approaches<br />
from Economics and Sociology.” Journal of Economic<br />
Surveys 27(1): 38–73.<br />
Bokova, I. <strong>2016</strong>. “At Last, the Destruction of Heritage<br />
Has Been Recognised as a Weapon of War.” The<br />
Guardian, 28 September. www.theguardian.com/globaldevelopment/<strong>2016</strong>/sep/28/destruction-of-heritageweapon-of-war-timbuktu-shrines-irina-bokova.<br />
Accessed<br />
14 October <strong>2016</strong>.<br />
Bonet, J, and V.F. Cibils. 2013. “Expanding Local Revenues<br />
for Promoting Local <strong>Development</strong>.” Urban Public<br />
Economics Review 19(July–December): 64–87.<br />
BRAC Afghanistan. <strong>2016</strong>. “BRAC Afghanistan.” Kabul.<br />
http://brac.net/brac-afghanistan/item/756-education.<br />
Accessed 17 December <strong>2016</strong><br />
BRAC Centre. <strong>2016</strong>. “Education.” Dhaka. http://brac.net/<br />
education-programme/item/758-overview. Accessed 17<br />
December <strong>2016</strong>.<br />
Braimoh, A. 2015. “To Fight Desertification, Let’s Manage<br />
Our Land Better.” Landscape Approach (Blog), 17 June.<br />
World Bank, Washington, DC. http://blogs.worldbank.org/<br />
taxonomy/term/13891. Accessed 11 October <strong>2016</strong>.<br />
Brodzinsky, S. 2014. “From Murder Capital to Model City:<br />
Is Medellín’s Miracle Show or Substance?” The Guardian,<br />
17 April. www.theguardian.com/cities/2014/apr/17/<br />
medellin-murder-capital-to-model-city-miracle-un-worldurban-forum.<br />
Accessed 7 November <strong>2016</strong>.<br />
Brown, G.K., and A. Langer. 2015. “Does Affirmative<br />
Action Work? Lessons from around the World.” Foreign<br />
Notes | 175
Affairs 94(March–April): 49–56. www.foreignaffairs.<br />
com/articles/2015-03-01/does-affirmative-action-work.<br />
Accessed 7 November <strong>2016</strong>.<br />
Butler, R.N. 1980. “Ageism: A Foreword.” Journal of Social<br />
Issues 36(2): 8–11.<br />
C2ES (Centre for Climate and Energy Solutions). 2015.<br />
“Outcomes of the U.N. Climate Change Conference<br />
in Paris.” Arlington, VA. www.c2es.org/international/<br />
negotiations/cop21-paris/summary. Accessed 14 October<br />
<strong>2016</strong>.<br />
Cambodian Disabled People’s Organization. 2015.<br />
“Disability Inclusion in the Voter Registration Processes,<br />
The Challenges, Lessons Learned and Good Practices: A<br />
Pathway of Disability Inclusion in Political Rights.” Phnom<br />
Penh. www.ifes.org/sites/default/files/cdpo_report_the_<br />
challenges_lessons_learned_and_good_practices.pdf.<br />
Accessed 7 November <strong>2016</strong>.<br />
Cashin, C. <strong>2016</strong>. Health Financing Policy: The<br />
Macroeconomic, Fiscal, and Public Finance Context.<br />
Washington, DC: World Bank. http://elibrary.worldbank.<br />
org/doi/abs/10.1596/978-1-4648-0796-1. Accessed 7<br />
November <strong>2016</strong>.<br />
CDC (US Centers for Disease Control and Prevention).<br />
2013. “Impact of an Innovative Approach to Prevent<br />
Mother-to-Child Transmission of HIV: Malawi, July 2011–<br />
September 2012.” Morbidity and Mortality Weekly <strong>Report</strong>,<br />
1 March. www.cdc.gov/mmwr/preview/mmwrhtml/<br />
mm6208a3.htm?s_cid=mm6208a3_w. Accessed 7<br />
November <strong>2016</strong>.<br />
Cecchini, S., F. Filgueira, R. Martínez and C. Rossel,<br />
eds. 2015. Towards Universal Social Protection: Latin<br />
American Pathways and Policy Tools. Santiago: United<br />
Nations Economic Commission for Latin America and the<br />
Caribbean.<br />
Chang, H.-J. 2002. Kicking Away the Ladder: <strong>Development</strong><br />
Strategy in Historical Perspective. London and New York:<br />
Anthem Press.<br />
Chao, S. 2012. “Forest Peoples: Numbers across the World.”<br />
Forest Peoples Programme, Moreton-in-Marsh, UK. www.<br />
forestpeoples.org/sites/fpp/files/publication/2012/05/<br />
forest-peoples-numbers-across-world-final_0.pdf.<br />
Accessed 26 October <strong>2016</strong>.<br />
Charmes, J. 2015. “Time Use across the World: Findings of a<br />
World Compilation of Time Use Surveys.” Background paper<br />
for <strong>Human</strong> <strong>Development</strong> <strong>Report</strong> 2015. United Nations<br />
<strong>Development</strong> Programme, <strong>Human</strong> <strong>Development</strong> <strong>Report</strong><br />
Office, New York. www.hdr.undp.org/sites/default/files/<br />
charmes_hdr_2015_final.pdf. Accessed 27 October <strong>2016</strong>.<br />
Checchi, D., and H.G. van der Werfhorst. 2014.<br />
“Educational Policies and Income Inequality.” IZA<br />
Discussion Paper 8222. Institute for the Study of Labour,<br />
Bonn, Germany. http://ftp.iza.org/dp8222.pdf. Accessed<br />
26 October <strong>2016</strong>.<br />
Chew, J. 2015. “Women Are Taking over Saudi Arabia’s<br />
Workforce.” Fortune, 10 August. http://fortune.<br />
com/2015/08/10/women-saudi-arabia/. Accessed 7<br />
November <strong>2016</strong>.<br />
CID (Council for International <strong>Development</strong>). <strong>2016</strong>.<br />
“Healthcare Innovations Won’t Cure Global Health<br />
Inequality: Political Action Will.” Wellington. www.cid.org.<br />
nz/news/healthcare-innovations-wont-cure-global-healthinequality-political-action-will/.<br />
Accessed 7 November <strong>2016</strong>.<br />
Clark, P. <strong>2016</strong>. “Renewables Overtake Coal as World’s<br />
Largest Source of Power Capacity.” Financial Times, 25<br />
October. www.ft.com/content/09a1f984-9a1d-11e6-8f9b-<br />
70e3cabccfae. Accessed 1 November <strong>2016</strong>.<br />
Clemens, M., and M. Kremer. <strong>2016</strong>. “The New Role for<br />
the World Bank.” Journal of Economic Perspectives 30(1):<br />
53–76.<br />
Coady, D., I.W.H. Parry, L. Sears and B. Shang.<br />
2015. “How Large Are Global Energy Subsidies.” IMF<br />
Working Paper 15/105. International Monetary Fund,<br />
Washington, DC. www.imf.org/external/pubs/cat/longres.<br />
aspx?sk=42940.0. Accessed 7 November <strong>2016</strong>.<br />
Coady, D., V. Flamini and L. Sears. 2015. “The Unequal<br />
Benefits of Fuel Subsidies Revisited: Evidence for<br />
Developing Countries.” IMF Working Paper 15/250.<br />
International Monetary Fund, Washington, DC. www.imf.<br />
org/external/pubs/ft/wp/2015/wp15250.pdf. Accessed 22<br />
November <strong>2016</strong>.<br />
Cornia, G.A., and F. Stewart, eds. 2014. Towards <strong>Human</strong><br />
<strong>Development</strong>: New Approaches to Macroeconomics and<br />
Inequality. Oxford: Oxford University Press.<br />
Council of the European Union. <strong>2016</strong>. “Outcome of the<br />
Council Meeting, 3475th Council Meeting, Economic and<br />
Financial Affairs.” Luxembourg. www.consilium.europa.<br />
eu. Accessed 30 September <strong>2016</strong>.<br />
Council on Foreign Relations. 2015. “Central Bank Currency<br />
Swaps.” www.cfr.org/international-finance/central-bankcurrency-swaps-since-financial-crisis/p36419#!/?cid=from_<br />
interactives_listing. Accessed 8 November <strong>2016</strong>.<br />
CRED (Centre for Research on the Epidemiology of<br />
Disasters) and UNISDR (United Nations Office for<br />
Disaster Risk Reduction). 2015. “The <strong>Human</strong> Cost of<br />
Weather-Related Disasters 1995–2015.” Geneva. www.<br />
unisdr.org/files/46796_cop21weatherdisastersreport2015.<br />
pdf. Accessed 14 October <strong>2016</strong>.<br />
Cukier, K.N., and V. Mayer-Schoenberger. 2013. “Rise of<br />
Big Data: How It’s Changing the Way We Think about the<br />
World.” Foreign Affairs 92(3): 28–40. http://faculty.cord.<br />
edu/andersod/The%20Rise%20of%20Big%20Data.docx.<br />
Accessed 4 December <strong>2016</strong>.<br />
Curto, V.E., R.G. Fryer, Jr., and M.L. Howard. 2011. “It<br />
May Not Take a Village: Increasing Achievement among<br />
the Poor.” In G.J. Duncan and R.J. Murnane, eds., Whither<br />
Opportunity? Rising Inequality, Schools, and Children’s<br />
Life Chances. New York: Russell Sage Foundation. http://<br />
scholar.harvard.edu/files/fryer/files/it_may_not_take_a_<br />
village_increasing_achievement_among_the_poor.pdf.<br />
Accessed 26 October <strong>2016</strong>.<br />
Darrow, M., and A. Tomas. 2005. “Power, Capture, and<br />
Conflict: A Call for <strong>Human</strong> Rights Accountability in<br />
<strong>Development</strong> Cooperation.” <strong>Human</strong> Rights Quarterly 27(2):<br />
471–538.<br />
Daude, C. 2012. “Educación, Clases Medias y Movilidad<br />
Social en América Latina.” In L. Paramio and R.<br />
Grynspan, eds., Clases medias en sociedades emergentes.<br />
Pensamiento Iberoamericano Series 10. Madrid:<br />
Fundación Carolina and Agencia Española de Cooperación<br />
Internacional para el Desarrollo. www.fundacioncarolina.<br />
es/wp-content/uploads/2014/07/PensamientoIbero10.pdf.<br />
Accessed 26 October <strong>2016</strong>.<br />
Day Ashley, L., C. Mcloughlin, M. Aslam, J. Engel, J.<br />
Wales, S. Rawal, R. Batley, G. Kingdon, S. Nicolai<br />
and P. Rose. 2014. “The Role and Impact of Private<br />
Schools in Developing Countries.” Education Rigorous<br />
Literature Review. UK Department for International<br />
<strong>Development</strong>, London. www.gov.uk/government/uploads/<br />
system/uploads/attachment_data/file/439702/privateschools-full-report.pdf.<br />
Accessed 26 October <strong>2016</strong>.<br />
Dean, D., S. DiGrande, D. Field, A. Lundmark, J. O’Day,<br />
J. Pineda and P. Zwillenberg. 2012. “BCG <strong>Report</strong>:<br />
The Connected World; The Internet Economy in the G-20:<br />
The $4.2 Trillion Growth Opportunity.” Boston Consulting<br />
Group, Boston, MA. www.bcg.com/documents/file100409.<br />
pdf. Accessed 20 October <strong>2016</strong>.<br />
Del Vicario, M., A. Bessi, F. Zollo, F. Petroni, A. Scala,<br />
G. Caldarelli, H. Stanley and W. Quattrociocchi.<br />
<strong>2016</strong>. “The Spreading of Misinformation Online.”<br />
Proceedings of the National Academy of Sciences of the<br />
United States of America 113(3): 554–559.<br />
Deloitte. 2014. “Big Demands and High Expectations:<br />
The Deloitte Millennial Survey.” London. http://www2.<br />
deloitte.com/content/dam/Deloitte/ru/Documents/<br />
Corporate_responsibility/ru_2014_MillennialSurvey_<br />
ExecutiveSummary.pdf. Accessed 7 November <strong>2016</strong>.<br />
Demirgüç-Kunt, A., L.F. Klapper, D. Singer and P. Van<br />
Oudheusden. 2014. “The Global Findex Database 2014:<br />
Measuring Financial Inclusion around the World.” Policy<br />
Research Working Paper 7255. World Bank, Washington,<br />
DC. http://documents.worldbank.org/curated/<br />
en/187761468179367706/pdf/WPS7255.pdf. Accessed 21<br />
December <strong>2016</strong>.<br />
Demos Helsinki. <strong>2016</strong>. “Thousands to Receive Basic<br />
Income in Finland: A Trial That Could Lead to the Greatest<br />
Societal Transformation of Our Time.” Helsinki. www.<br />
demoshelsinki.fi/en/<strong>2016</strong>/08/30/thousands-to-receivebasic-income-in-finland-a-trial-that-could-lead-to-thegreatest-societal-transformation-of-our-time/.<br />
Accessed 7<br />
November <strong>2016</strong>.<br />
Deneulin, S. 2008. “Beyond Individual Freedom and<br />
Agency: Structures of Living Together in the Capability<br />
Approach.” In F. Comim, M. Qizilbash and S. Alkire,<br />
eds., The Capability Approach: Concepts, Measures and<br />
Applications. New York: Cambridge University Press.<br />
———. <strong>2016</strong>. “Expanding Freedoms, Changing Structures:<br />
The <strong>Human</strong> <strong>Development</strong> <strong>Report</strong> 2014.” <strong>Development</strong> and<br />
Change 47(FORUM <strong>2016</strong>): 937–951.<br />
Desai, R.M. 2007. “The Political Economy of Poverty<br />
Reduction: Scaling Up Antipoverty Programs in the<br />
Developing World.” Working Paper 2. Brookings<br />
Institution, Wolfensohn Center for <strong>Development</strong>,<br />
Washington, DC. www.brookings.edu/wp-content/<br />
uploads/<strong>2016</strong>/06/11_poverty_desai.pdf. Accessed 27<br />
October <strong>2016</strong>.<br />
Dewan, S., and G. Randolph. <strong>2016</strong>. “The Global Deal: A<br />
New Economic Consensus.” Huffington Post (Blog), 17 June.<br />
www.huffingtonpost.com/sabina-dewan/the-global-deal-anew-eco_b_7603460.html.<br />
Accessed 7 November <strong>2016</strong>.<br />
DFID (UK Department for International <strong>Development</strong>).<br />
2010. Cities: The New Frontier. London. www.gov.uk/<br />
government/uploads/system/uploads/attachment_data/<br />
file/67689/cities-new-frontier.pdf. Accessed 25 August<br />
<strong>2016</strong>.<br />
Diamond, P., and H. Vartiainen, eds. 2007. Behavioral<br />
Economics and its Applications. Princeton, NJ: Princeton<br />
University Press.<br />
176 | HUMAN DEVELOPMENT REPORT <strong>2016</strong>
Dreher, A., J. Sturm and J. Vreeland. 2009. “Global Horse<br />
Trading: IMF Loans for Votes in the United Nations Security<br />
Council.” European Economic Review 53(7): 742–757.<br />
Duncan, G.J., and R.J. Murnane, eds. 2011. Whither<br />
Opportunity? Rising Inequality, Schools, and Children’s Life<br />
Chances. New York: Russell Sage Foundation.<br />
The Economist. <strong>2016</strong>a. “China’s Middle Class: 225m<br />
Reasons for China’s Leaders to Worry.” 9 July. www.<br />
economist.com/news/leaders/21701760-communist-partytied-its-fortunes-mass-affluence-may-now-threaten-itssurvival-225m.<br />
Accessed 11 October <strong>2016</strong>.<br />
———. <strong>2016</strong>b. “Daily Chart: Iraq’s Deadly War.” 8 July.<br />
www.economist.com/blogs/graphicdetail/<strong>2016</strong>/07/dailychart-4?fsrc=scn/tw/te/bl/ed/iraqsdeadlywar.<br />
Accessed<br />
25 August <strong>2016</strong>.<br />
———. <strong>2016</strong>c. “Early Childhood <strong>Development</strong>: Give<br />
Me a Child.” 29 October. www.economist.com/news/<br />
international/21709292-boosting-health-toddlers-bodiesand-brains-brings-multiple-benefits-too-often.<br />
Accessed 7<br />
November <strong>2016</strong>.<br />
———. <strong>2016</strong>d. “Special <strong>Report</strong> on Migration.” 28 May–3<br />
June.<br />
———. <strong>2016</strong>e. “The World Economy: An Open and Shut<br />
Case.” 1 October. www.economist.com/news/specialreport/21707833-consensus-favour-open-economiescracking-says-john-osullivan.<br />
Accessed 11 October <strong>2016</strong>.<br />
ECOSOC (United Nations Economic and Social<br />
Council). 2015. “List of Non-governmental Organizations<br />
in Consultative Status with the Economic and Social<br />
Council as of 1 September 2015.” E/2015/INF/5. New<br />
York. http://csonet.org. Accessed 18 October <strong>2016</strong>.<br />
———. <strong>2016</strong>. “Statistical Annex on Funding Data of the<br />
<strong>2016</strong> Secretary General’s <strong>Report</strong> on the Implementation of<br />
the QCPR.” www.un.org/en/ecosoc/qcpr/pdf/statistical_<br />
annex_tables_on_funding_flows_2014.xlsx. Accessed 28<br />
July <strong>2016</strong>.<br />
Edwards, B. 2015. “2014 NZ General Election Results—The<br />
Definitive Stats.” Liberation (Blog), 3 March. http://liberation.<br />
typepad.com/liberation/2015/03/2014-nz-general-electionresults-the-definitive-stats.html.<br />
Accessed 2 June 2015.<br />
Ehrenfreund, M. <strong>2016</strong>. “This Is How Immigration Will<br />
Change Europe during the Rest of This Century.” World<br />
Economic Forum, Geneva. www.weforum.org/agenda/<strong>2016</strong>/07/this-is-how-immigration-will-change-europeover-the-rest-of-this-century.<br />
Accessed 11 October <strong>2016</strong>.<br />
EIA (US Energy Information Administration). <strong>2016</strong>.<br />
International Energy Outlook <strong>2016</strong>. Washington, DC. www.<br />
eia.gov/forecasts/ieo/pdf/0484(<strong>2016</strong>).pdf. Accessed 14<br />
October <strong>2016</strong>.<br />
Eichengreen, B., and N. Woods. <strong>2016</strong>. “The IMF’s Unmet<br />
Challenges.” Journal of Economic Perspectives 30(1): 29–52.<br />
End Violence Against Children: The Global<br />
Partnership. <strong>2016</strong>. “Global Leaders and Youth Advocates<br />
Launch New Partnership and Fund to End Violence against<br />
Children Everywhere.” Press release, 12 July. New York.<br />
www.end-violence.org/press_releases.html. Accessed 27<br />
October <strong>2016</strong>.<br />
Epstein, G. 2007. “Central Banks as Agents of Employment<br />
Creation.” Working Paper 38. <strong>Report</strong> ST/ESA/2007/<br />
DWP/38. United Nations Department of Economic<br />
and Social Affairs, New York. www.un.org/esa/desa/<br />
papers/2007/wp38_2007.pdf. Accessed 22 November<br />
<strong>2016</strong>.<br />
European Commission. 2014. “Communication from the<br />
Commission on the European Citizens’ Initiative ‘Water<br />
and Sanitation Are a <strong>Human</strong> Right! Water Is a Public<br />
Good, Not a Commodity!’” Brussels. http://ec.europa.eu/<br />
transparency/regdoc/rep/1/2014/EN/1-2014-177-EN-F1-1.<br />
Pdf. Accessed 7 November <strong>2016</strong>.<br />
———. <strong>2016</strong>. “State Aid: Ireland Gave Illegal Tax Benefits<br />
to Apple Worth up to €13 Billion.” Press release, 30<br />
August. http://europa.eu/rapid/press-release_IP-16-<br />
2923_en.htm. Accessed 21 December <strong>2016</strong>.<br />
European Union. 2012. “European Union Open Data Portal.”<br />
Brussels. http://open-data.europa.eu/en/data. Accessed<br />
26 September <strong>2016</strong>.<br />
———. 2014. “The European Union Explained: Budget.”<br />
Brussels. https://europa.eu/european-union/topics/<br />
budget_en. Accessed 28 November <strong>2016</strong>.<br />
Eurostat. <strong>2016</strong>a. “Asylum Statistics Source.” http://<br />
ec.europa.eu/eurostat/statistics-explained/index.php/<br />
Asylum_statistics. Accessed 21 October <strong>2016</strong>.<br />
———. <strong>2016</strong>b. European Union Statistics on Income and<br />
Living Conditions (EUSILC). Brussels. http://ec.europa.eu/<br />
eurostat/web/microdata/european-union-statistics-on<br />
-income-and-living-conditions. EUSILC UDB 2014 — version<br />
2 of August <strong>2016</strong>.<br />
Evans-Lacko, S., M. Knapp, P. McCrone, G. Thornicroft<br />
and R. Mojtabai. 2013. “The Mental Health<br />
Consequences of the Recession: Economic Hardship and<br />
Employment of People with Mental Health Problems in<br />
27 European Countries.” Plos One (Community Blog), 26<br />
July. http://journals.plos.org/plosone/article?id=10.1371/<br />
journal.pone.0069792. Accessed 26 October <strong>2016</strong>.<br />
Fajgelbaum, P.D., and A.K. Khandelwal. <strong>2016</strong>.<br />
“Measuring the Unequal Gains from Trade.” Quarterly<br />
Journal of Economics 131(3): 1113–1180.<br />
FAO (Food and Agriculture Organization of the United<br />
Nations). 2011a. “Global Food Losses and Food Waste:<br />
Extent, Causes and Prevention.” Rome. www.fao.org/<br />
docrep/014/mb060e/mb060e.pdf. Accessed 24 August <strong>2016</strong>.<br />
———. 2011b. The State of the World’s Land and Water<br />
Resources for Food and Agriculture: Managing Systems at<br />
Risk. Rome. www.fao.org/docrep/017/i1688e/i1688e.pdf.<br />
Accessed 7 November <strong>2016</strong>.<br />
———. <strong>2016</strong>a. “UN Seeks to Boost Response to El Niño’s<br />
Dire Impact in Africa and Asia/Pacific, Urges La Niña<br />
Preparedness.” Rome. www.fao.org/news/story/en/<br />
item/423058/icode/. Accessed 23 August <strong>2016</strong>.<br />
———. <strong>2016</strong>b. State of the World’s Forests <strong>2016</strong>, Forests<br />
and Agriculture: Land-Use Challenges and Opportunities.<br />
Rome. www.fao.org/3/a-i5588e.pdf. Accessed 23 August<br />
<strong>2016</strong>.<br />
FAO (Food and Agriculture Organization of the United<br />
Nations) and ILSI (International Life Sciences<br />
Institute). 1997. Preventing Micronutrient Malnutrition:<br />
A Guide to Food-Based Approaches: A Manual for Policy<br />
Makers and Programme Planners. Rome. www.fao.org/<br />
docrep/X5244E/X5244e00.htm. Accessed 22 November<br />
<strong>2016</strong>.<br />
FAO (Food and Agriculture Organization of the United<br />
Nations) and WFP (World Food Programme). <strong>2016</strong>.<br />
“Monitoring Food Security in Countries with Conflict<br />
Situations: A Joint FAO/WFP Update for the United<br />
Nations Security Council (July <strong>2016</strong>).” Rome. www.fao.<br />
org/3/a-c0335e.pdf. Accessed 11 October <strong>2016</strong>.<br />
Filou, E. 2014. “The African Water Companies Serving the<br />
Poorest and Staying Afloat.” The Guardian, 4 October.<br />
www.theguardian.com/global-development-professionalsnetwork/<strong>2016</strong>/oct/04/urban-africa-water-companiespoorest-profit.<br />
Accessed 22 November <strong>2016</strong>.<br />
Fink, G., E. Peet, G. Danaei, K. Andrews, D.C. McCoy,<br />
C.R. Sudfeld, M.C.S. Fawzi, M. Ezzati and W.W.<br />
Fawzi. <strong>2016</strong>. “Schooling and Wage Income Losses Due to<br />
Early-Childhood Growth Faltering in Developing Countries:<br />
National, Regional, and Global Estimates.” American<br />
Journal of Clinical Nutrition 104(1): 104–112.<br />
Forbes, M. 2015. “A Year of Mixed Fortunes for Maori MPs.”<br />
Radio New Zealand, 29 December. www.radionz.co.nz/<br />
news/national/293124/year-of-mixed-fortunes-for-maorimps.<br />
Accessed 7 November <strong>2016</strong>.<br />
Ford, D. <strong>2016</strong>. “UAE’s First Female Fighter Pilot Led<br />
Airstrike against ISIS.” CNN, 9 October. www.cnn.<br />
com/2014/09/25/world/meast/uae-female-fighter-pilot/.<br />
Accessed 14 October <strong>2016</strong>.<br />
Fryer, R.G., Jr. 2006. “Acting White: The Social Price Paid<br />
by the Best and Brightest Minority Students.” Education<br />
Next Winter: 52–59. http://educationnext.org/files/<br />
ednext20061_52.pdf. Accessed 26 October <strong>2016</strong>.<br />
Fryer, R.G., Jr., and S.D. Levitt. 2004.”The Causes and<br />
Consequences of Distinctively Black Names.” Quarterly<br />
Journal of Economics 119(3): 767–805.<br />
Fryer, R.G., Jr., D. Pager and J.L. Spenkuch. 2013. “Racial<br />
Disparities in Job Finding and Offered Wages.” Journal of<br />
Law and Economics 56(3): 633–689.<br />
GAHP (Global Alliance on Health and Pollution).<br />
2014. “Pollution: The Silent Killer of Millions in Poor<br />
Countries.” New York. www.gahp.net/new/wp-content/<br />
uploads/2014/12/GAHP-PollutionSummaryNov2014DRAFT.<br />
pdf. Accessed 23 August <strong>2016</strong>.<br />
Gall, S.C., and R.C. Thompson. 2015. “The Impact of<br />
Debris on Marine Life.” Marine Pollution Bulletin 92(1–2):<br />
170–179.<br />
Gallager, K., R. Ffrench-Davis, L. Mah-Hui and K.<br />
Soverel. 2013. “Financial Stability and the Trans-Pacific<br />
Partnership: Lessons from Chile and Malaysia.” GEGI<br />
Working Paper. Boston, MA: Global Economic Governance<br />
Initiative.<br />
Gates, G.J., and F. Newport. 2012. “Special <strong>Report</strong>: 3.4%<br />
of U.S. Adults Identify as LGBT.” Gallup, Politics, 18<br />
October. Washington, DC. www.gallup.com/poll/158066/<br />
special-report-adults-identify-lgbt.aspx. Accessed 26<br />
October <strong>2016</strong>.<br />
GC-RED (Global Policy Centre on Resilient Ecosystems<br />
and Desertification). <strong>2016</strong>. “UNDP-UNEP Poverty-<br />
Environment Initiative (PEI).” Nairobi. www.undp.org/<br />
content/undp/en/home/ourwork/global-policy-centres/<br />
sustainable_landmanagement/pei.html. Accessed 7<br />
November <strong>2016</strong>.<br />
Geneva Declaration on Armed Violence and<br />
<strong>Development</strong>. 2015. “Executive Summary.” Global<br />
Burden of Armed Violence 2015: Every Body Counts.<br />
Geneva. www.genevadeclaration.org/fileadmin/docs/<br />
GBAV3/GBAV3_ExecSummary_pp1-10.pdf. Accessed 11<br />
October <strong>2016</strong>.<br />
Ghosh, T. <strong>2016</strong>. “Acid Attack in India: Where Does the<br />
Nation Stand Today?” Huffington Post, 29 March. www.<br />
huffingtonpost.com/tanushree-ghosh/acid-attack-in-indiawher_b_9559790.html.<br />
Accessed 14 October <strong>2016</strong>.<br />
References | 177
Gillian, W.S., A.N. Maupin, C.R. Reyes, M. Accavitti<br />
and F. Shic. <strong>2016</strong>. “Do Early Educators’ Implicit Biases<br />
Regarding Sex and Race Relate to Behavior Expectations<br />
and Recommendations of Preschool Expulsions and<br />
Suspensions?” Research Study Brief. Yale University, Yale<br />
Child Study Center, New Haven, CT.<br />
GIZ (Deutsche Gesellschaft für Internationale<br />
Zusammenarbeit). 2014. Developing an Environmental<br />
Technology Centre (CTA) in Peru. Triangular Cooperation<br />
Brazil–Peru–Germany. Eschborn, Germany. www.giz.de/<br />
en/downloads/giz2014-en-zentrum-umwelttechnologienperu.pdf.<br />
Accessed 8 November <strong>2016</strong>.<br />
Gjerde, K.M. 2006. “Ecosystems and Biodiversity in Deep<br />
Waters and High Seas.” UNEP Regional Seas <strong>Report</strong>s and<br />
Studies No. 178. United Nations Environment Programme,<br />
Nairobi. www.unep.org/pdf/EcosystemBiodiversity_<br />
DeepWaters_20060616.pdf. Accessed 11 October <strong>2016</strong>.<br />
Global Citizen. <strong>2016</strong>. “Sweden’s New Global Deal Will<br />
Boost Employment and the SDGs.” 12 October. New York.<br />
www.globalcitizen.org/en/content/sweden-new-globaldeal/.<br />
Accessed 7 November <strong>2016</strong>.<br />
Global Initiative to End All Corporal Punishment<br />
of Children. 2015. “Towards Non-violent Schools:<br />
Prohibiting All Corporal Punishment, Global <strong>Report</strong> 2015.”<br />
London. www.endcorporalpunishment.org/assets/pdfs/<br />
reports-thematic/Schools%20<strong>Report</strong>%202015-EN.pdf.<br />
Accessed 26 October <strong>2016</strong>.<br />
Global Witness. <strong>2016</strong>. “On Dangerous Ground.” London.<br />
www.globalwitness.org/en/reports/dangerous-ground/.<br />
Accessed 26 October <strong>2016</strong>.<br />
Gómez, O.A., A. Muto and S.G. Kamidohzono. <strong>2016</strong>.<br />
“Sharing the Journey: The Way Ahead for <strong>Human</strong><br />
<strong>Development</strong> and <strong>Human</strong> Security Frameworks.”<br />
Background paper for <strong>Human</strong> <strong>Development</strong> <strong>Report</strong><br />
<strong>2016</strong>. United Nations <strong>Development</strong> Programme, <strong>Human</strong><br />
<strong>Development</strong> <strong>Report</strong> Office, New York.<br />
Grant Thornton. <strong>2016</strong>. “Women in Business: Turning<br />
Promise into Practice.” London. www.grantthornton.<br />
global/en/insights/articles/women-in-business-<strong>2016</strong>/.<br />
Greenpeace. <strong>2016</strong>a. “Refrigeration that Won’t Heat Up<br />
the Planet.” www.greenpeace.org/international/en/<br />
campaigns/climate-change/Solutions/Climate-friendlyrefrigeration/.<br />
Accessed 8 November <strong>2016</strong>.<br />
———. <strong>2016</strong>b. “10 Years Ago the Amazon Was Being<br />
Bulldozed for Soy—Then Everything Changed.” www.<br />
greenpeace.org/usa/victories/amazon-rainforestdeforestation-soy-moratorium-success/.<br />
Accessed 8<br />
November <strong>2016</strong>.<br />
Greytak, E.A., J.G. Kosciw, C. Villenas and N.M.<br />
Giga. <strong>2016</strong>. “From Teasing to Torment: School Climate<br />
Revisited, A Survey of U.S. Secondary School Students<br />
and Teachers.” GLSEN, New York. www.glsen.org/sites/<br />
default/files/TeasingtoTorment%202015%20FINAL%20<br />
PDF%5B1%5D_0.pdf. Accessed 14 October <strong>2016</strong>.<br />
Griffith-Jones, S. <strong>2016</strong>. “Global Governance and Growth<br />
for <strong>Human</strong> <strong>Development</strong>.” Background paper for <strong>Human</strong><br />
<strong>Development</strong> <strong>Report</strong> <strong>2016</strong>. United Nations <strong>Development</strong><br />
Programme, <strong>Human</strong> <strong>Development</strong> <strong>Report</strong> Office, New York.<br />
Griffith-Jones, S., and G. Cozzi. 2015. “Investment-led<br />
Growth: A Solution to the European Crisis.” Political<br />
Quarterly 86: 119–133.<br />
The Guardian. <strong>2016</strong>a. “Brazil is ‘Badly Losing’ the Battle<br />
against Zika Virus, Says Health Minister.” 26 January.<br />
www.theguardian.com/world/<strong>2016</strong>/jan/26/brazil-zikavirus-health-minister-armed-forces-eradication.<br />
Accessed<br />
30 November <strong>2016</strong>.<br />
———. <strong>2016</strong>b. “South Africa to Quit International Criminal<br />
Court.” www.theguardian.com/world/<strong>2016</strong>/oct/21/southafrica-to-quit-international-criminal-court-documentshows.<br />
Accessed 8 November <strong>2016</strong>.<br />
GWG (Global Working Group on Big Data for Official<br />
Statistics). <strong>2016</strong>. “UN Big Data for Official Statistics.”<br />
United Nations Department of Economic and Social<br />
Affairs, New York. http://unstats.un.org/bigdata/.<br />
Accessed 7 November <strong>2016</strong>.<br />
Hallegatte, S., M. Bangalore, L. Bonzanigo, M. Fay,<br />
T. Kane, U. Narloch, J. Rozenberg, D. Treguer and<br />
A. Vogt-Schilb. <strong>2016</strong>. Shock Waves: Managing the<br />
Impacts of Climate Change on Poverty. Climate Change<br />
and <strong>Development</strong> Series. Washington, DC: World Bank.<br />
https://openknowledge.worldbank.org/bitstream/<br />
handle/10986/22787/9781464806735.pdf. Accessed 25<br />
August <strong>2016</strong>.<br />
Harris, R.D., and W.M. Marks. 2009. “Compact Ultrasound<br />
for Improving Maternal and Perinatal Care in Low-<br />
Resource Settings: Review of the Potential Benefits,<br />
Implementation Challenges and Public Health Issues.”<br />
Journal of Ultrasound Medicine 28: 1067–1076.<br />
Heckman, J., R. Pinto and P. Savelyev. 2013.<br />
“Understanding the Mechanisms through Which an<br />
Influential Early Childhood Program Boosted Adult<br />
Outcomes.” American Economic Review 103(6): 2052–86.<br />
HelpAge International and Center for Demographic<br />
Research. 2015. “Breaking the Silence: Elder Abuse in the<br />
Republic of Moldova.” Chisinau, Moldova. www.refworld.<br />
org/pdfid/566a972e4.pdf. Accessed 26 October <strong>2016</strong>.<br />
Hemmelgarn, T., G. Nicodème, B. Tasnadi and P.<br />
Vermote. 2015. “Financial Transaction Taxes in the<br />
European Union.” Taxation Papers Working Paper 62.<br />
Brussels. www.steuer-gegen-armut.org/fileadmin/<br />
Dateien/Kampagnen-Seite/Unterstuetzung_Ausland/<br />
EU/2015-<strong>2016</strong>/1602_EU_Commission.pdf. Accessed 30<br />
September <strong>2016</strong>.<br />
Herzer, D., P. Huhne and P. Nunnenkamp. 2014. “FDI<br />
and Income Inequality: Evidence from Latin American<br />
Economies.” Review of <strong>Development</strong> Economics 18(4):<br />
778–793.<br />
Hillis, S., J. Mercy, A. Amobi and H. Kress. 2014. “Global<br />
Prevalence of Past-year Violence against Children: A<br />
Systematic Review and Minimum Estimates.” Pediatrics<br />
137(3):e20154079.<br />
Hillman, A.L., and E. Jenkner. 2004. “Educating Children<br />
in Poor Countries.” Economic Issues 33. International<br />
Monetary Fund, Washington, DC. www.imf.org/external/<br />
pubs/ft/issues/issues33/. Accessed 7 November <strong>2016</strong>.<br />
Hollow, M. 2013. “Crowdfunding and Civic Society in<br />
Europe: A Profitable Partnership?” Open Citizenship 4(1):<br />
68–73. www.academia.edu/3415172/Crowdfunding_<br />
and_Civic_Society_in_Europe_A_Profitable_Partnership.<br />
Accessed 11 October <strong>2016</strong>.<br />
HOPE XXL. 2015. “The Liemers List: Final Version.” Duiven,<br />
The Netherlands. www.hope-xxl.com/downloads/liemerslist-final-version.pdf.<br />
Accessed 7 November <strong>2016</strong>.<br />
Hunt, A., and E. Samman. <strong>2016</strong>. “Women’s Economic<br />
Empowerment: Navigating Enablers and Constraints.”<br />
Research <strong>Report</strong>. Overseas <strong>Development</strong> Institute,<br />
London. www.odi.org/sites/odi.org.uk/files/resourcedocuments/10683.pdf.<br />
Accessed 7 November <strong>2016</strong>.<br />
IANYD (United Nations Inter-Agency Network on Youth<br />
<strong>Development</strong>). <strong>2016</strong>. “Young People’s Participation<br />
in Peacebuilding: A Practice Note.” New York. www.<br />
un.org/en/peacebuilding/pbso/pdf/Practice%20Note%20<br />
Youth%20&%20Peacebuilding%20-%20January%20<strong>2016</strong>.<br />
pdf. Accessed 11 October <strong>2016</strong>.<br />
ICAP (International Carbon Action Partnership). <strong>2016</strong>.<br />
“Korea Emissions Trading Scheme.” 26 September, Berlin.<br />
https://icapcarbonaction.com/en/?option=com_etsma<br />
p&task=export&format=pdf&layout=list&systems[]=47.<br />
Accessed 22 November <strong>2016</strong>.<br />
ICF International. <strong>2016</strong>. “Data.” DHS Program. Rockville,<br />
MD. www.dhsprogram.com/Data/. Accessed 15 July<br />
<strong>2016</strong>.<br />
IEA (International Energy Agency). <strong>2016</strong>a. “Decoupling<br />
of Global Emissions and Economic Growth Confrmed.”<br />
Press release, 16 March. Paris. www.iea.org/newsroom/<br />
news/<strong>2016</strong>/march/decoupling-of-global-emissions-andeconomic-growth-confirmed.html.<br />
Accessed 24 October<br />
<strong>2016</strong>.<br />
———. <strong>2016</strong>b. Energy and Air Pollution: World Energy<br />
Outlook Special <strong>Report</strong>. Paris. www.iea.org/publications/<br />
freepublications/publication/WorldEnergyOutlookSpecial<br />
<strong>Report</strong><strong>2016</strong>EnergyandAirPollution.pdf. Accessed 23<br />
August <strong>2016</strong>.<br />
———. <strong>2016</strong>c. “WEI <strong>2016</strong>: Fact Sheet.” Paris. www.iea.<br />
org/media/publications/wei/WEI<strong>2016</strong>FactSheet.pdf.<br />
Accessed 14 October <strong>2016</strong>.<br />
———. <strong>2016</strong>d. World Energy Outlook <strong>2016</strong>. www.iea.<br />
org/media/publications/weo/WEO<strong>2016</strong>Factsheet.pdf.<br />
Accessed 1 November <strong>2016</strong>.<br />
IEP (Institute for Economics and Peace). 2015. “Global<br />
Terrorism Index 2015: Measuring and Understanding the<br />
Impact of Terrorism.” New York. http:// economicsandpeace.<br />
org/wp-content/uploads/2015/11/Global-Terrorism-<br />
Index-2015.pdf. Accessed 23 August <strong>2016</strong>.<br />
———. <strong>2016</strong>. “Global Peace Index <strong>2016</strong>: Ten Years of<br />
Measuring Peace.” New York. http://economicsandpeace.<br />
org/wp-content/uploads/<strong>2016</strong>/06/GPI-<strong>2016</strong>-<strong>Report</strong>_2.pdf.<br />
Accessed 23 August <strong>2016</strong>.<br />
IFAD (International Fund for Agricultural <strong>Development</strong>).<br />
2009. “Macedonia: Agricultural Financial Services<br />
Project.” Project Completion Digests. Rome. http://<br />
operations.ifad.org/documents/654016/037e464d-864a-<br />
458d-b142-dcdf0086bca8. Accessed 7 November <strong>2016</strong>.<br />
———. 2012. “Indigenous Peoples: Valuing, Respecting<br />
and Supporting Diversity.” Rome. www.ifad.org/<br />
documents/10180/0f2e8980-09bc-45d6-b43b-<br />
8518a64962b3. Accessed 1 November <strong>2016</strong>.<br />
———. <strong>2016</strong>. “Rural Poverty Portal.” Rome. www.<br />
ruralpovertyportal.org/country/statistics/tags/macedonia.<br />
Accessed 7 November <strong>2016</strong>.<br />
IFPRI (International Food Policy Research Institute).<br />
2015. Global Nutrition <strong>Report</strong> 2015: Actions and<br />
Accountability to Advance Nutrition and Sustainable<br />
<strong>Development</strong>. Washington, DC. http://ebrary.ifpri.<br />
org/utils/getfile/collection/p15738coll2/id/129443/<br />
filename/129654.pdf. Accessed 24 August <strong>2016</strong>.<br />
IHME (Institute for Health Metrics and Evaluation).<br />
<strong>2016</strong>. “Rethinking <strong>Development</strong> and Health: Findings from<br />
the Global Burden of Disease Study.” IHME University of<br />
178 | HUMAN DEVELOPMENT REPORT <strong>2016</strong>
Washington, Seattle. www.healthdata.org/policy-report/<br />
rethinking-development-and-health-findings-globalburden-disease-study.<br />
Accessed 4 November <strong>2016</strong>.<br />
IHS (Indian Health Service, Federal Health Program<br />
for American Indians and Alaska Natives). <strong>2016</strong>.<br />
“Disparities.” Fact sheet. Rockville, MD. www.ihs.gov/newsroom/factsheets/disparities/.<br />
Accessed 28 October <strong>2016</strong>.<br />
IISD (International Institute for Sustainable<br />
<strong>Development</strong>). <strong>2016</strong>. “Fossil-Fuel Subsidies.” Global<br />
Subsidies Initiative, Geneva. www.iisd.org/gsi/fossil-fuelsubsidies.<br />
Accessed 7 November <strong>2016</strong>.<br />
ILGA (International Lesbian, Gay, Bisexual, Trans and<br />
Intersex Association). <strong>2016</strong>a. “Global Attitudes Survey<br />
on LGBTI People.” Geneva. http://ilga.org/what-we-do/<br />
ilga-riwi-global-attitudes-survey-lgbti-logo/. Accessed 2<br />
November <strong>2016</strong>.<br />
———. <strong>2016</strong>b. “Sexual Orientation Laws in the World:<br />
Criminalisation.” Geneva. http://ilga.org/downloads/04_<br />
ILGA_WorldMap_ENGLISH_Crime_May<strong>2016</strong>.pdf.<br />
Accessed 26 October <strong>2016</strong>.<br />
———. <strong>2016</strong>c. “Sexual Orientation Laws in the World:<br />
Overview.” Geneva. http://ilga.org/downloads/03_ILGA_<br />
WorldMap_ENGLISH_Overview_May<strong>2016</strong>.pdf. Accessed<br />
26 October <strong>2016</strong>.<br />
ILO (International Labour Organization). 2012.<br />
“ILO Global Estimate of Forced Labour: Results and<br />
Methodology.” Geneva. www.ilo.org/wcmsp5/groups/<br />
public/---ed_norm/---declaration/documents/publication/<br />
wcms_182004.pdf. Accessed 26 October <strong>2016</strong>.<br />
———. 2014a. “Brazil, Cadastro Único: Operating a<br />
Registry through a National Public Bank.” Geneva.<br />
———. 2014b. “Decent Work and Social Justice in Pacific<br />
Small Island Developing States: Challenges, Opportunities<br />
and Policy Responses.” ILO Office for Pacific Island<br />
Countries, Suva, Fiji Islands. www.ilo.org/wcmsp5/<br />
groups/public/---dgreports/---nylo/documents/publication/<br />
wcms_242172.pdf. Accessed 28 November <strong>2016</strong>.<br />
———. 2015a. “Global Employment Trends for Youth<br />
2015: Scaling Up Investments in Decent Jobs for<br />
Youth.” Geneva. www.ilo.org/wcmsp5/groups/public/-<br />
--dgreports/---dcomm/---publ/documents/publication/<br />
wcms_412015.pdf. Accessed 23 August <strong>2016</strong>.<br />
———. 2015b. World Employment and Social Outlook: The<br />
Changing Nature of Jobs. Geneva. www.ilo.org/wcmsp5/<br />
groups/public/---dgreports/---dcomm/---publ/documents/<br />
publication/wcms_368626.pdf. Accessed 11 October<br />
<strong>2016</strong>.<br />
———. 2015c. World Employment and Social Outlook:<br />
Trends 2015. Geneva. www.ilo.org/ wcmsp5/groups/<br />
public/---dgreports/---dcomm/---publ/documents/<br />
publication/wcms_337069.pdf. Accessed 14 October<br />
<strong>2016</strong>.<br />
———. <strong>2016</strong>a. “Our Impact, Their Voices: Helping<br />
Syrian Refugees Formalize Their Work Status through<br />
Cooperatives.” 26 June. Geneva. www.ilo.org/beirut/<br />
media-centre/fs/WCMS_493964/lang--en/index.htm.<br />
Accessed 10 November <strong>2016</strong>.<br />
———. <strong>2016</strong>b. “Women in Business and Management:<br />
Gaining Momentum in the Middle East and North<br />
Africa.” Regional Office for Arab States, Beirut. www.<br />
ilo.org/wcmsp5/groups/public/---arabstates/---ro-beirut/<br />
documents/publication/wcms_446101.pdf. Accessed 7<br />
November <strong>2016</strong>.<br />
———. <strong>2016</strong>c. “Women at Work: Trends <strong>2016</strong>.” Geneva.<br />
http://ilo.org/wcmsp5/groups/public/---dgreports/---<br />
dcomm/---publ/documents/publication/wcms_457317.pdf.<br />
Accessed 7 November <strong>2016</strong>.<br />
———. <strong>2016</strong>d. World Employment and Social Outlook<br />
<strong>2016</strong>: Transforming Jobs to End Poverty. Geneva.<br />
https://sustainabledevelopment.un.org/content/<br />
documents/10290ILO%20WESO(<strong>2016</strong>).pdf. Accessed 11<br />
October <strong>2016</strong>.<br />
———. <strong>2016</strong>e. World Employment and Social Outlook:<br />
Trends for Youth <strong>2016</strong>. Geneva. www.ilo.org/wcmsp5/<br />
groups/public/---dgreports/---dcomm/---publ/documents/<br />
publication/wcms_513739.pdf. Accessed 20 October<br />
<strong>2016</strong>.<br />
IMF (International Monetary Fund). 2012. The<br />
Liberalization and Management of Capital Flows: An<br />
Institutional View. Washington, DC.<br />
———. <strong>2016</strong>a. “IMF Members’ Quotas and Voting Power,<br />
and IMF Board of Governors.” Washington, DC. www.imf.<br />
org/external/np/sec/memdir/members.aspx. Accessed 16<br />
December <strong>2016</strong>.<br />
———. <strong>2016</strong>b. “IMF Survey: IMF Reforms Policy for<br />
Exceptional Access Lending.” www.imf.org/external/<br />
pubs/ft/survey/so/<strong>2016</strong>/pol012916a.htm. Accessed 21<br />
December <strong>2016</strong>.<br />
———. <strong>2016</strong>c. “Past IMF Disbursements and Repayments<br />
for All Members.” Washington, DC. www.imf.org/ external/<br />
np/fin/tad/extrep1.aspx. Accessed 10 November <strong>2016</strong>.<br />
———. <strong>2016</strong>d. World Economic Outlook: October <strong>2016</strong>:<br />
Subdued Demand: Symptoms and Remedies. World<br />
Economic and Financial Surveys. Washington, DC. www.<br />
imf.org/external/pubs/ft/weo/<strong>2016</strong>/02/pdf/text.pdf.<br />
Accessed 7 November <strong>2016</strong>.<br />
Independent Commission on Multilateralism. <strong>2016</strong>.<br />
UN 2030: Rebuilding Order in a Fragmenting World. New<br />
York. www.ipinst.org/wp-content/uploads/<strong>2016</strong>/08/<br />
IPI-ICM-UN-2030-Chairs-<strong>Report</strong>2FINAL.pdf. Accessed 26<br />
September <strong>2016</strong>.<br />
Independent Evaluation Office of the International<br />
Monetary Fund. 2013. The Role of the IMF as Trusted<br />
Advisor. Evaluation <strong>Report</strong>. www.ieo-imf.org/ieo/<br />
files/completedevaluations/RITA_-_Main_<strong>Report</strong>.pdf.<br />
Accessed 8 November <strong>2016</strong>.<br />
Indrawati, S.M. 2015. “Discriminating against Women<br />
Keeps Countries Poorer.” Voices: Perspectives on<br />
<strong>Development</strong> (Blog), 10 September. Washington, DC.<br />
http://blogs.worldbank.org/voices/discriminating-againstwomen-keeps-countries-poorer.<br />
Accessed 14 October<br />
<strong>2016</strong>.<br />
INSD (Burkina Faso Institut National de la Statistique<br />
et de la Démographie). <strong>2016</strong>. “Chiffres clés.”<br />
Ouagadougou. www.insd.bf/n/. Accessed 22 November<br />
<strong>2016</strong>.<br />
IOC (International Olympic Committee). <strong>2016</strong>. “Kimia<br />
Alizadeh: The Yog Star Flying the Flag for Female Athletes<br />
in Iran.” 26 August. Lausanne, Switzerland. www.olympic.<br />
org/news/kimia-alizadeh-the-yog-star-flying-the-flag-forfemale-athletes-in-iran.<br />
Accessed 14 October <strong>2016</strong>.<br />
IOM (International Organization for Migration). 2014.<br />
“Global Migration Trends: An Overview.” Geneva. http://<br />
missingmigrants.iom.int/sites/default/files/Globalmigration-trends_December-2014_final.pdf.<br />
Accessed 26<br />
October <strong>2016</strong>.<br />
———. 2015. World Migration <strong>Report</strong> 2015: Migrants and<br />
Cities: New Partnerships to Manage Mobility. Geneva.<br />
http://publications.iom.int/system/files/wmr2015_en.pdf.<br />
Accessed 26 September <strong>2016</strong>.<br />
———. <strong>2016</strong>a. IOM Regional Response to the Syria Crisis.<br />
Geneva. http://reliefweb.int/sites/reliefweb.int/files/<br />
resources/IOM%20Regional%20Response%20to%20<br />
the%20Syria%20Crisis%20Sitrep%20%28June%20<br />
<strong>2016</strong>%29.pdf. Accessed 7 November <strong>2016</strong>.<br />
———. <strong>2016</strong>b. IOM Regional Response to the Syria Crisis<br />
[infographic]. Geneva. www.iom.int/sites/default/files/<br />
country/docs/IOM-Regional-Response-to-the-Syria-Crisis-<br />
Map-March<strong>2016</strong>.pdf. Accessed 16 December <strong>2016</strong>.<br />
IPCC (Intergovernmental Panel on Climate Change).<br />
2000. Special <strong>Report</strong> on Emission Scenarios. Cambridge,<br />
UK: Cambridge University Press.<br />
IPPR (Institute for Public Policy Research). 2012.<br />
“Modern Women Marrying Men of the Same or Lower<br />
Social Class.” 5 April. London. www.ippr.org/news-andmedia/press-releases/modern-women-marrying-menof-the-same-or-lower-social-class.<br />
Accessed 27 October<br />
<strong>2016</strong>.<br />
IPU (Inter-Parliamentary Union). <strong>2016</strong>. Women in national<br />
parliaments. www.ipu.org/wmn-e/classif-arc.htm.<br />
Accessed 19 July <strong>2016</strong>.<br />
ITC (International Trade Centre). 2014. “Trade in<br />
Environmental Goods and Services: Opportunities and<br />
Challenges.” Technical Paper. Geneva. www.intracen.<br />
org/uploadedFiles/intracenorg/Content/Publications/<br />
AssetPDF/EGS%20Ecosystems%20Brief%20040914%20<br />
-%20low%20res.pdf. Accessed 27 October <strong>2016</strong>.<br />
ITU (International Telecommunication Union). <strong>2016</strong>a.<br />
End-<strong>2016</strong> Estimates for Key ICT Indicators. Geneva. www.<br />
itu.int/en/ITU-D/Statistics/Documents/statistics/<strong>2016</strong>/<br />
ITU_Key_2005-<strong>2016</strong>_ICT_data.xls. Accessed 4 December<br />
<strong>2016</strong>.<br />
———. <strong>2016</strong>b. “ICT Facts and Figures <strong>2016</strong>.” Geneva.<br />
www.itu.int/en/ITU-D/Statistics/Documents/facts/<br />
ICTFactsFigures<strong>2016</strong>.pdf. Accessed 26 October <strong>2016</strong>.<br />
IWGIA (International Work Group for Indigenous<br />
Affairs). <strong>2016</strong>. “Indigenous Peoples’ Education.”<br />
Copenhagen. www.iwgia.org/culture-and-identity/<br />
indigenous-peoples-and-education. Accessed 28 October<br />
<strong>2016</strong>.<br />
Jahan, S. 2003. “Evolution of the <strong>Human</strong> <strong>Development</strong><br />
Index.” In S. Fukuda-Parr and A.K. Shiva Kumar, eds.,<br />
Readings in <strong>Human</strong> <strong>Development</strong>: Concepts, Measures<br />
and Policies for a <strong>Development</strong> Paradigm. New Delhi:<br />
Oxford University Press.<br />
———. 2010. Freedom for Choice: Essays in <strong>Human</strong><br />
<strong>Development</strong>. Dhaka: Shahitya Prakash.<br />
Jenks, B., and J. Topping. <strong>2016</strong>. Financing the United<br />
Nations <strong>Development</strong> System: Current Trends and<br />
New Directions. Uppsala, Sweden: Dag Hammarskjold<br />
Foundation and Multi-Partner Trust Fund Office.<br />
Johnson, C., and D. Start. 2001.”Rights, Claims and<br />
Capture: Understanding the Politics of Pro-Poor Policy.”<br />
Working Paper 145. Overseas <strong>Development</strong> Institute,<br />
London. www.odi.org/sites/odi.org.uk/files/odi-assets/<br />
publications-opinion-files/2319.pdf. Accessed 27 October<br />
<strong>2016</strong>.<br />
Joshi, A. 2010. “Review of Impact and Effectiveness<br />
of Transparency and Accountability Initiatives:<br />
References | 179
Annex 1 Service Delivery.” Paper prepared for<br />
the Transparency and Accountability Initiative<br />
Workshop, Institute of <strong>Development</strong> Studies, 14–15<br />
October, Brighton, UK. www.ids.ac.uk/files/dmfile/<br />
IETAAnnex1ServicedeliveryJoshiFinal28Oct2010.pdf.<br />
Accessed 22 November <strong>2016</strong>.<br />
Kahneman, D. 2011. Thinking, Fast and Slow. New York:<br />
Farrar, Straus and Giroux.<br />
Kahneman, D., and A. Tversky, eds. 2000. Choices, Values<br />
and Frames. Cambridge: Cambridge University Press; New<br />
York: Russell Sage Foundation.<br />
Kaldor, M. 1999. New and Old Wars: Organized Violence in<br />
a Global Era. Cambridge, UK: Polity Press.<br />
———. 2013. “In Defense of New Wars.” Stability:<br />
International Journal of Security and <strong>Development</strong><br />
2(1). www.stabilityjournal.org/articles/10.5334/sta.at/.<br />
Accessed 19 December <strong>2016</strong>.<br />
Kar, D., and J. Spanjers. 2015. “Illicit Financial Flows<br />
from Developing Countries: 2004–2013.” Global Financial<br />
Integrity, Washington, DC. www.gfintegrity.org/wpcontent/uploads/2015/12/IFF-Update_2015-Final-1.pdf.<br />
Accessed 22 November <strong>2016</strong>.<br />
Karki, M., and A.K. Bohara. 2014. “Evidence of Earnings<br />
Inequality Based on Caste in Nepal.” Developing<br />
Economies 52(3): 262–286.<br />
Karlan, D., and J. Appel. 2011. More Than Good Intentions:<br />
How a New Economics Is Helping to Solve Global Poverty.<br />
New York: Dutton Adult.<br />
Keeley, B. 2009. International Migration: The <strong>Human</strong> Face<br />
of Globalization. OECD Insights. Paris. www.oecd-ilibrary.<br />
org/docserver/download/0109111e.pdf?expires=14604750<br />
31&id=id&accname=guest&checksum=600363DC6E73F73<br />
CCFACB0DAF7A97E36. Accessed 26 October <strong>2016</strong>.<br />
Kelley, D.J., A. Ali, C. Brush, A.C. Corbett, C. Daniels,<br />
P.H. Kim, T.S. Lyons, M. Majbouri and E.G. Rogoff.<br />
2015. “Global Entrepreneurship Monitor: 2014 United<br />
States <strong>Report</strong>.” Global Entrepreneurship Research<br />
Association, London Business School, London. www.<br />
babson.edu/Academics/centers/blank-center/globalresearch/gem/Documents/GEM%20USA%202014.pdf.<br />
Accessed 2 November <strong>2016</strong>.<br />
Kembhavi, R. 2013. “Political Participation among Seniors.”<br />
Research Note. Elections Canada, Gatineau, Quebec,<br />
Canada. www.elections.ca/res/rec/part/partsen/pdf/<br />
sen_e.pdf. Accessed 7 November <strong>2016</strong>.<br />
Keswell, M., S. Girdwood and M. Leibbrandt. 2013.<br />
“Educational Inheritance and the Distribution of<br />
Occupations: Evidence from South Africa.” Review of<br />
Income and Wealth 59(S1): S111–S137.<br />
Keuleers, P. <strong>2016</strong>. “Securing Our Societies from the Threat<br />
of Senseless Terrorism.” Our Perspectives (Blog), 11<br />
April. New York. www.undp.org/content/undp/en/home/<br />
blog/<strong>2016</strong>/4/11/Securing-our-societies-from-the-threat-ofsenseless-terrorism-.html.<br />
Accessed 11 October <strong>2016</strong>.<br />
Khan, I. <strong>2016</strong>. “Pathways to Justice: Rule of Law, <strong>Human</strong><br />
Rights, Sustainable <strong>Development</strong> and <strong>Human</strong> Security.”<br />
Background paper for <strong>Human</strong> <strong>Development</strong> <strong>Report</strong><br />
<strong>2016</strong>. United Nations <strong>Development</strong> Programme, <strong>Human</strong><br />
<strong>Development</strong> <strong>Report</strong> Office, New York.<br />
Kharas, H., and G. Gertz. 2010. “The New Global Middle<br />
Class: A Crossover from West to East.” In China’s<br />
Emerging Middle Class: Beyond Economic Transformation,<br />
Cheng Li, ed. Washington, DC: Brookings Institution Press.<br />
Kim, C.-Y. 2011. From Despair to Hope: Economic Policy<br />
Making in Korea: 1945-1979. Seoul: Korean <strong>Development</strong><br />
Institute.<br />
Kim, D.-I. and R.H. Topel. 1995. “Labor Markets and<br />
Economic Growth: Lessons from Korea’s Industrialization,<br />
1970-1990.” In R.B. Freeman and L. Katz, eds., Differences<br />
and Changes in Wage Structures. Chicago, IL: University<br />
of Chicago Press.<br />
Kim, K.S., and J.K. Kim. 1997. “Korean Economic<br />
<strong>Development</strong>: An Overview.” In D.-S. Cha, K.S. Kim<br />
and D.H. Perkins, The Korean Economy 1945-1995:<br />
Performance and Vision for the 21st Century. Seoul: Korea<br />
<strong>Development</strong> Institute.<br />
Kim, T.-H. 2011. “<strong>Development</strong> of a Gender Equality Index<br />
and Measurement of Gender Equality in South Korea.”<br />
Gender Studies and Policy Review 4: 80–93.<br />
Kreft, S., D. Eckstein, L. Dorsch and L. Fischer. 2015.<br />
“Global Climate Risk Index <strong>2016</strong>: Who Suffers Most from<br />
Extreme Weather Events? Weather-Related Loss Events<br />
in 2014 and 1995 to 2014.” Germanwatch Briefing Paper.<br />
Bonn, Germany. http://docplayer.net/18855757-Globalclimate-risk-index-<strong>2016</strong>.html.<br />
Accessed 3 November <strong>2016</strong>.<br />
Krishnan, N., G.L. Ibarra, A. Narayan, S. Tiwari and T.<br />
Vishwanath. <strong>2016</strong>. Uneven Odds, Unequal Outcomes:<br />
Inequality of Opportunity in the Middle East and North<br />
Africa. Directions in <strong>Development</strong>: Poverty Series.<br />
Washington, DC: World Bank.<br />
Kronfol, N.M. 2012. “Access and Barriers to Health<br />
Care Delivery in Arab Countries: A Review.” Eastern<br />
Mediterranean Health Journal 18(12): 1239–1246.<br />
Kynge, J. <strong>2016</strong>. “China in Three Numbers.” Financial Times,<br />
13 July. http://video.ft.com/5032304024001/China-inthree-numbers/World.<br />
Accessed 14 October <strong>2016</strong>.<br />
Lambert, S., M. Ravallion and D. van de Walle. 2014.<br />
“Intergenerational Mobility and Interpersonal Inequality in<br />
an African Economy.” Journal of <strong>Development</strong> Economics<br />
110(C): 327–344.<br />
Lattier, D. 2015. “32 Million U.S. Adults Are ‘Functionally<br />
Illiterate’: What Does That Even Mean?” 25 August.<br />
Intellectual Takeout, Bloomington, MN. www.<br />
intellectualtakeout.org/blog/32-million-us-adults-arefunctionally-illiterate-what-does-even-mean.<br />
Accessed 26<br />
October <strong>2016</strong>.<br />
Lawson, M. <strong>2016</strong>. “It’s Time to Demolish the Myth of<br />
Trickle-Down Economics.” 19 July. World Economic Forum,<br />
Geneva. www.weforum.org/agenda/<strong>2016</strong>/07/it-s-time-todemolish-the-myth-of-trickle-down-economics.<br />
Accessed<br />
11 October <strong>2016</strong>.<br />
Le Coz, C. <strong>2016</strong>. “As Acid Attacks Rise against Women,<br />
Laws Help to Deter Such Assaults.” City University<br />
of New York, Ralph Bunche Institute for International<br />
Studies, New York. www.passblue.com/<strong>2016</strong>/02/29/<br />
as-acid- attacks-rise-against-women-laws-help-deter-suchassaults/.<br />
Accessed 14 October <strong>2016</strong>.<br />
Lee, J.H., and D.-I. Kim. 1997. “Labor Market<br />
<strong>Development</strong>s and Reforms in Korea.” Working Paper<br />
9703. Korean <strong>Development</strong> Institute, Seoul.<br />
Lee, K., W. Shin and H. Shin. 2015. “How Large or Small in<br />
the Policy Space? WTO Regime and Industrial Policy.” In J.<br />
Alonso and J. Ocampo, eds., Global Governance and Rules<br />
for the Post-2015 Era: Addressing Emerging Issues in the<br />
Global Environment. New York: Bloomsbury.<br />
Lewis, K., and S. Burd-Sharps. 2013. American<br />
<strong>Human</strong> <strong>Development</strong> <strong>Report</strong>: The Measure of America<br />
2013–2014. New York: Measure of America. www.<br />
measureofamerica.org/wp-content/uploads/2013/06/<br />
MOA-III.pdf. Accessed 26 October <strong>2016</strong>.<br />
LIS (Luxembourg Income Study). <strong>2016</strong>. “LIS Database.”<br />
Cross-National Data Center in Luxembourg, Luxembourg.<br />
www.lisdatacenter.org/our-data/lis-database/. Accessed<br />
15 July <strong>2016</strong>.<br />
Lloyd, M. 2015. “A Decade of Affirmative Action in Brazil:<br />
Lessons for the Global Debate.” In R.T. Teranishi, L.B.<br />
Pazich, M. Knobel and W.R. Allen, eds., Mitigating<br />
Inequality: Higher Education Research, Policy and<br />
Practice in an Era of Massification and Stratification.<br />
Bingley, UK: Emerald Group Publishing. www.ses.<br />
unam.mx/integrantes/uploadfile/mlloyd/Lloyd_<br />
ADecadeOffAffirmativeActionInBrazil.pdf. Accessed 22<br />
November <strong>2016</strong>.<br />
Lyons, K. 2015. “The Gambia Bans Female Genital<br />
Mutilation.” The Guardian, 24 November. London. www.<br />
theguardian.com/society/2015/nov/24/the-gambia-bansfemale-genital-mutilation.<br />
Accessed 14 October <strong>2016</strong>.<br />
Mandavilli, A. <strong>2016</strong>. “Female Scientists Turn to Data to<br />
Fight Lack of Representation on Panels.” New York Times,<br />
5 September.<br />
Mann, T. 2014. “Prejudice at the Polling Booth: Disabled<br />
Indonesians Face Barriers in Voting.” Asia Foundation,<br />
Jakarta. http://asiafoundation.org/2014/04/09/prejudiceat-the-polling-booth-disabled-indonesians-face-barriersin-voting/.<br />
Accessed 7 November <strong>2016</strong>.<br />
ManpowerGroup. <strong>2016</strong>. “Millennial Careers: 2020 Vision,<br />
Facts, Figures and Practical Advice from Workforce<br />
Experts.” Milwaukee, WI. www.manpowergroup.<br />
com/wps/wcm/connect/660ebf65-144c-489e-975c-<br />
9f838294c237/MillennialsPaper1_2020Vision_<br />
lo.pdf?MOD=AJPERES. Accessed 20 October <strong>2016</strong>.<br />
Martínez-Franzoni, J. and D. Sánchez-Ancochea.<br />
<strong>2016</strong>. “Achieving Universalism in Developing Countries.”<br />
Background paper for <strong>Human</strong> <strong>Development</strong> <strong>Report</strong><br />
<strong>2016</strong>. United Nations <strong>Development</strong> Programme, <strong>Human</strong><br />
<strong>Development</strong> <strong>Report</strong> Office, New York.<br />
Marx, A., J. Soares and W. Van Acker. 2015. “The<br />
Protection of International Labour Rights: A Longitudinal<br />
Analysis of the Protection of the Rights of Freedom of<br />
Association and Collective Bargaining over 30 Years in 73<br />
Countries.” In A. Marx, J. Wouters, G. Rayp and L. Beke,<br />
eds., Global Governance of Labour Rights: Assessing the<br />
Effectiveness of Transnational Public and Private Policy<br />
Initiatives. Leuven Global Governance Series. Cheltenham,<br />
UK: Edward Elgar Publishing.<br />
Marx, A., J. Wouters, G. Rayp and L. Beke, eds. 2015.<br />
Global Governance of Labour Rights: Assessing the<br />
Effectiveness of Transnational Public and Private Policy<br />
Initiatives. Leuven Global Governance Series. Cheltenham,<br />
UK: Edward Elgar Publishing.<br />
Matheson, T. 2011. “Taxing Financial Transactions: Issues<br />
and Evidence.” Working Paper WP/11/54. Washington,<br />
DC: International Monetary Fund.<br />
McGee, R., and C. Kroesschell. 2013. “Local<br />
Accountabilities in Fragile Contexts: Experiences from<br />
Nepal, Bangladesh and Mozambique.” IDS Working Paper<br />
422. Institute of <strong>Development</strong> Studies, Brighton, UK.<br />
www.ids.ac.uk/download.cfm?objectid=E8A258F0-A82B-<br />
11E2-806C005056AA0D87. Accessed 7 November <strong>2016</strong>.<br />
180 | HUMAN DEVELOPMENT REPORT <strong>2016</strong>
McGinn, K.L., M.R. Castro and E.L. Lingo. 2015. “Mums<br />
the Word! Cross-National Effects of Maternal Employment<br />
on Gender Inequalities at Work and at Home.” Harvard<br />
Business School Working Paper 15–094. Harvard Business<br />
School, Boston, MA. https://dash.harvard.edu/bitstream/<br />
handle/1/16727933/15-094%20(2).pdf?sequence=4.<br />
Accessed 26 October <strong>2016</strong>.<br />
McKenzie, A.D. 2014. “A Billion Tons of Food Wasted<br />
Yearly While Millions Still Go Hungry.” Inter Press Service,<br />
9 October. www.ipsnews.net/2014/10/a-billion-tonsof-food-wasted-yearly-while-millions-still-go-hungry/.<br />
Accessed 24 August <strong>2016</strong>.<br />
McKinsey Global Institute. 2012. “Africa at Work: Job<br />
Creation and Inclusive Growth.” London. www.mckinsey.<br />
com/global-themes/middle-east-and-africa/africa-at-work.<br />
Accessed 28 November <strong>2016</strong>.<br />
———. 2014. “Global Flows in a Digital Age: How Trade,<br />
Finance, People, and Data Connect the World Economy.”<br />
New York. www.mckinsey.com/~/media/mckinsey/<br />
global%20themes/globalization/global%20flows%20<br />
in%20a%20digital%20age/mgi%20global%20flows%20<br />
in%20a%20digial%20age%20executive%20summary.<br />
ashx. Accessed 11 October <strong>2016</strong>.<br />
Mekonnen, M.M., and A. Hoekstra. <strong>2016</strong>. “Four Billion<br />
People Facing Severe Water Scarcity.” Science Advances<br />
2(2). http://advances.sciencemag.org/content/2/2/<br />
e1500323. Accessed 14 December <strong>2016</strong>.<br />
Mercurio, B. 2014. “International Investment Agreements<br />
and Public Health: Neutralizing a Threat through Treaty<br />
Drafting.” Bulletin of the World Health Organization 92:<br />
520–525.<br />
Milanović, B. <strong>2016</strong>. Global Inequality: A New Approach<br />
for the Age of Globalization. Cambridge, MA: Harvard<br />
University Press. www.hup.harvard.edu/catalog.<br />
php?isbn=9780674737136. Accessed 20 October <strong>2016</strong>.<br />
MINN (Minnesota International NGO Network). <strong>2016</strong>.<br />
Why Do So Many Developing Countries Fail to Develop?<br />
Minneapolis, MN. www.minnesotangos.org/event/whydo-so-many-developing-countries-fail-develop.<br />
Accessed<br />
7 November <strong>2016</strong>.<br />
Montes, M., and P. Lunenborg. <strong>2016</strong>. “Trade Rules and<br />
Integration Trends and <strong>Human</strong> <strong>Development</strong>.” Background<br />
paper for <strong>Human</strong> <strong>Development</strong> <strong>Report</strong> <strong>2016</strong>. United<br />
Nations <strong>Development</strong> Programme, <strong>Human</strong> <strong>Development</strong><br />
<strong>Report</strong> Office, New York.<br />
Moss-Racusin, C.A., J.F. Dovidio, V.L. Brescoll,<br />
M.J. Graham and J. Handelsman. 2012. “Science<br />
Faculty’s Subtle Gender Biases Favor Male Students.”<br />
Proceedings of the National Academy of Sciences 109(41):<br />
16474–16479.<br />
Murray, C.J.L., R.M. Barber, K.J. Foreman, A.A.<br />
Ozgoren, F. Abd-Allah, S.F. Abera, V. Aboyans and<br />
others. 2015. “Global, Regional, and National Disability-<br />
Adjusted Life Years (DALYs) for 306 Diseases and Injuries<br />
and Healthy Life Expectancy (HALE) for 188 Countries,<br />
1990–2013: Quantifying the Epidemiological Transition.”<br />
Lancet 386(10009): 2145–2191.<br />
Nair, R. <strong>2016</strong>. “Economic Survey Says the Rich<br />
Get Implicit Subsidy of More Than Rs1 Trillion.”<br />
Livemint, 10 December. www.livemint.com/Specials/<br />
d4pZ9spLnUtMu55D59GI8I/Why-should-rich-benefit-fromsubsidies.html.<br />
Accessed 7 November <strong>2016</strong>.<br />
Nave, A. 2000. “Marriage and the Maintenance of Ethnic<br />
Group Boundaries: The Case of Mauritius.” Ethnic and<br />
Racial Studies 23(2): 329–352.<br />
Neuvonen, A. <strong>2016</strong>. “Thousands to Receive Basic Income in<br />
Finland: A Trial That Could Lead to the Greatest Societal<br />
Transformation of Our Time.” Demos Helsinki, 30 August.<br />
www.demoshelsinki.fi/en/<strong>2016</strong>/08/30/thousands-toreceive-basic-income-in-finland-a-trial-that-could-leadto-the-greatest-societal-transformation-of-our-time/.<br />
Accessed 7 November <strong>2016</strong>.<br />
New York Times. <strong>2016</strong>. “Thousands Sign Petition to Abolish<br />
Guardianship of Women in Saudi Arabia.” Women in<br />
the World, 27 September. http://nytlive.nytimes.com/<br />
womenintheworld/<strong>2016</strong>/09/27/thousands-sign-petitionto-abolish-guardianship-of-women-in-saudi-arabia/.<br />
Accessed 14 October <strong>2016</strong>.<br />
Newbold, T., L.N. Hudson, A.P. Arnell, S. Contu, A. De<br />
Palma, S. Ferrier, S.L.L. Hill and others. <strong>2016</strong>. “Has<br />
Land Use Pushed Terrestrial Biodiversity beyond the<br />
Planetary Boundary? A Global Assessment.” Science<br />
353(6296): 288–291. http://science.sciencemag.org/<br />
content/353/6296/288. Accessed 20 October <strong>2016</strong>.<br />
Ng, M., T. Fleming, M. Robinson, N. Thomson, N.<br />
Graetz, C. Margono, E.C. Mullany and others. 2014.<br />
“Global, Regional, and National Prevalence of Overweight<br />
and Obesity in Children and Adults during 1980–2013:<br />
A Systematic Analysis for the Global Burden of Disease<br />
Study 2013.” Lancet 384(9945): 766–781.<br />
Niño-Zarazúa, M., L. Roope and F. Tarp. <strong>2016</strong>. “Global<br />
Inequality: Relatively Lower, Absolutely Higher.” Review<br />
of Income and Wealth. http://onlinelibrary.wiley.com/<br />
doi/10.1111/roiw.12240/full. Accessed 11 October <strong>2016</strong>.<br />
Nnochiri, I. 2012. “Nigeria Loses $400bn to Oil Thieves:<br />
Ezekwesili.” Vanguard, 28 August. www.vanguardngr.<br />
com/2012/08/nigeria-loses-400bn-to-oil-thievesezekwesili/.<br />
Accessed 7 November <strong>2016</strong>.<br />
Nussbaum, M.C. 2003. “Capabilities as Fundamental<br />
Entitlements: Sen and Social Justice.” Feminist Economics<br />
9(2–3): 33–59.<br />
Ocampo, J. 2015a. “Reforming the International Monetary<br />
and Financial Architecture.” In J. Alonso and J. Ocampo,<br />
eds., Global Governance and Rules for the Post-2015 Era:<br />
Addressing Emerging Issues in the Global Environment.<br />
New York: Bloomsbury.<br />
———. 2015b. A Special Moment for Special Drawing<br />
Rights. www.project-syndicate.org/commentary/hasmoment-come-for-special-drawing-right-by-jose-antonioocampo-2015-10.<br />
Accessed 8 November <strong>2016</strong>.<br />
ODI (Overseas <strong>Development</strong> Institute). <strong>2016</strong>. Leaving<br />
No One Behind: A Critical Path for the First 1,000 Days of<br />
the Sustainable <strong>Development</strong> Goals. London. www.odi.<br />
org/sites/odi.org.uk/files/resource-documents/10692.pdf.<br />
Accessed 14 October <strong>2016</strong>.<br />
OECD (Organisation for Economic Co-operation<br />
and <strong>Development</strong>). 2008. “The Paris Declaration on<br />
Aid Effectiveness and the Accra Agenda for Action<br />
2005/2008.” Paris. www.oecd.org/dac/ effectiveness/<br />
34428351.pdf. Accessed 2 December <strong>2016</strong>.<br />
———. 2011. “An Overview of Growing Income Inequalities<br />
in OECD Countries: Main Findings.” In Divided We Stand:<br />
Why Inequality Keeps Rising. Paris. www.oecd.org/els/<br />
soc/49499779.pdf. Accessed 27 October <strong>2016</strong>.<br />
———. 2015a. Health at a Glance 2015: OECD Indicators.<br />
Paris. http://apps.who.int/medicinedocs/documents/<br />
s22177en/s22177en.pdf. Accessed 28 October <strong>2016</strong>.<br />
———. 2015b. Integrating Social Services for Vulnerable<br />
Groups: Bridging Sectors for Better Service Delivery. Paris.<br />
www.keepeek.com/Digital-Asset-Management/oecd/<br />
social-issues-migration-health/integrating-the-delivery-<br />
of-social-services-for-vulnerable-groups_9789264233775-<br />
en#.WBOlnC0rIdU#page1. Accessed 28 October <strong>2016</strong>.<br />
———. 2015c. OECD Yearbook 2015. Paris.<br />
———. <strong>2016</strong>a. “Education at a Glance <strong>2016</strong>: OECD<br />
Indicators.” Paris. www.oecd.org/edu/education-at-aglance-19991487.htm.<br />
Accessed 28 October <strong>2016</strong>.<br />
———. <strong>2016</strong>b. How’s Life in Korea? Paris.<br />
———. <strong>2016</strong>c. OECD Better Life Index. Paris.<br />
———. <strong>2016</strong>d. OECD Statistics. Paris. http://stats.oecd.<br />
org/#. Accessed 21 October <strong>2016</strong>.<br />
———. <strong>2016</strong>e. Society at a Glance <strong>2016</strong>, OECD Social<br />
Indicators: A Spotlight on Youth. Paris. http://static.pulso.<br />
cl/<strong>2016</strong>1005/2338198.pdf. Accessed 28 October <strong>2016</strong>.<br />
———. <strong>2016</strong>f. “Statistics on Resource Flows to Developing<br />
Countries.” Paris. www.oecd.org/dac/financingsustainable-development/development-finance-data/<br />
statisticsonresourceflowstodevelopingcountries.htm.<br />
Accessed 16 December <strong>2016</strong>.<br />
OECD (Organisation for Economic Co-operation<br />
and <strong>Development</strong>) and UNDESA (United Nations<br />
Department of Economic and Social Affairs). 2013.<br />
“World Migration in Figures.” Paris. www.oecd.org/els/mig/<br />
World-Migration-in-Figures.pdf. Accessed 26 October <strong>2016</strong>.<br />
Office of the Secretary-General’s Envoy on Youth.<br />
<strong>2016</strong>. “#YouthStats: Information and Communication<br />
Technology.” New York. www.un.org/youthenvoy/<br />
information-communication-technology/. Accessed 11<br />
October <strong>2016</strong>.<br />
ONS (United Kingdom Office for National Statistics).<br />
2012. “Integrated Household Survey April 2011 to March<br />
2012: Experimental Statistics.” Statistical Bulletin, 28<br />
September. London. http://webarchive. nationalarchives.<br />
gov.uk/<strong>2016</strong>0105160709/www.ons.gov.uk/ons/<br />
dcp171778_280451.pdf. Accessed 26 October <strong>2016</strong>.<br />
Ortiz, I., S. Burke, M. Berrada and H. Cortés. 2013.<br />
“World Protests 2006–2013.” Working Paper. Initiative<br />
for Policy Dialogue and Friedrich-Ebert-Stiftung, New<br />
York. http://policydialogue.org/files/publications/World_<br />
Protests_2006-2013-Executive_Summary.pdf. Accessed<br />
27 October <strong>2016</strong>.<br />
Ostry, J., A. Ghosh, K. Habermeier, L. Laeven, M.<br />
Chamon, M. Qureshi and A. Kokenyne. 2011.<br />
“Managing Capital Inflows: What Tools to Use?” IMF<br />
Staff Discussion Note SDN/11/06. Washington, DC:<br />
International Monetary Fund.<br />
Pager, D., B. Western and B. Bonikowski. 2009.<br />
“Discrimination in a Low-Wage Labor Market: A Field<br />
Experiment.” American Sociological Review 74(5):<br />
777–799.<br />
PAHO-WHO (Pan American Health Organization–World<br />
Health Organization). <strong>2016</strong>a. “Region of the Americas<br />
Is Declared Free of Measles.” 27 September. Washington,<br />
DC. www.paho.org/hq/index.php?option=com_content<br />
&view=article&id=12528%3Aregion-americas-declaredfree-measles.<br />
Accessed 14 October <strong>2016</strong>.<br />
References | 181
———. <strong>2016</strong>b. “Guatemala Is the Fourth Country in the<br />
World to Eliminate Onchocerciasis, Known as ‘River<br />
Blindness’.” 26 September. Washington, DC. www.paho.<br />
org/hq/index.php?option=com_content&view=article&id<br />
=12520%3Aguatemala-eliminates-onchocerciasis-riverblindness&Itemid=135&lang=en.<br />
Accessed 14 October <strong>2016</strong>.<br />
Pan, L., and L. Christiaensen. 2012. “Who Is Vouching for the<br />
Input Voucher? Decentralized Targeting and Elite Capture in<br />
Tanzania.” World <strong>Development</strong> 40(8): 1619–1633.<br />
Parker, L. 2015. “Ocean Trash: 5.25 Trillion Pieces<br />
and Counting, but Big Questions Remain.” National<br />
Geographic, 11 January. http://news.nationalgeographic.<br />
com/news/2015/01/150109-oceans-plastic-sea-trashscience-marine-debris/.<br />
Accessed 26 October 2015.<br />
PATH. 2013. “Breakthrough Innovations That Can Save<br />
Women and Children Now.” Washington, DC. www.path.<br />
org/publications/files/APP_unga_innovations_rpt.pdf.<br />
Accessed 7 November <strong>2016</strong>.<br />
Patten, E., and R. Fry. 2015. “How Millennials Today<br />
Compare with Their Grandparents 50 Years Ago.” Factan,<br />
19 March. Pew Research Center, Washington, DC. www.<br />
pewresearch.org/fact-tank/2015/03/19/how-millennialscompare-with-their-grandparents/#!17.<br />
Accessed 7<br />
November <strong>2016</strong>.<br />
Peracod (Programme for the Promotion of Renewable<br />
Energy, Rural Electrification and a Sustainable<br />
Supply of Household Fuels). 2012. “The Rural<br />
Electrification Senegal (ERSEN) Project: Electricity for<br />
over 90,000 Persons.” Dakar. https://energypedia.info/<br />
images/6/61/Rural_Electrification_Senegal_ERSEN_<br />
Project_Factsheet.pdf. Accessed 25 August <strong>2016</strong>.<br />
Perlo-Freeman, S., A. Fleurant, P. Wezeman and S.<br />
Wezeman. <strong>2016</strong>. “Trends in World Military Expenditure,<br />
2015.” SIPRI Fact Sheet. Stockholm: Stockholm<br />
International Peace Research Institute.<br />
Pew Research Center. 2014. “Crime and Corruption Top<br />
Problems in Emerging and Developing Countries.” Global<br />
Attitudes & Trends. Washington, DC. www.pewglobal.<br />
org/2014/11/06/crime-and-corruption-top-problems-inemerging-and-developing-countries/.<br />
Accessed 26 October<br />
<strong>2016</strong>.<br />
———. 2015a. “Latest Trends in Religious Restrictions and<br />
Hostilities, Sidebar: Religious Hostilities and Religious<br />
Minorities in Europe.” 26 February. Washington, DC.<br />
www.pewforum.org/2015/02/26/sidebar-religioushostilities-and-religious-minorities-in-europe/.<br />
Accessed<br />
26 October <strong>2016</strong>.<br />
———. 2015b. “Gay Marriage around the World.” 26 June.<br />
Washington, DC. www.pewforum.org/2015/06/26/gaymarriage-around-the-world-2013/.<br />
Accessed 14 October<br />
<strong>2016</strong>.<br />
Phiri, J., and J.E. Ataguba. 2014. “Inequalities in Public<br />
Health Care Delivery in Zambia.” International Journal for<br />
Equity in Health 13(24).<br />
Piraino, P. 2015. “Intergenerational Earnings Mobility<br />
and Equality of Opportunity in South Africa.” World<br />
<strong>Development</strong> 67(C): 396–405.<br />
PlasticsEurope (Association of Plastics Manufacturers<br />
in Europe). 2013. “Plastics, the Facts 2013: An Analysis<br />
of European Latest Plastics Production, Demand and<br />
Waste Data.” Brussels. www.plasticseurope.de/cust/<br />
documentrequest.aspx?DocID=59179. Accessed 20<br />
October <strong>2016</strong>.<br />
Pollin, R. <strong>2016</strong>. “Global Green Growth for <strong>Human</strong><br />
<strong>Development</strong>.” Background paper for <strong>Human</strong> <strong>Development</strong><br />
<strong>Report</strong> <strong>2016</strong>. United Nations <strong>Development</strong> Programme,<br />
<strong>Human</strong> <strong>Development</strong> <strong>Report</strong> Office, New York.<br />
Power, S. <strong>2016</strong>. “Remarks at a UN Security Council Open<br />
Debate on Women, Peace, and Security.” 25 October. New<br />
York. https://usun.state.gov/remarks/7505. Accessed 7<br />
November <strong>2016</strong>.<br />
Purdie, E., and B.E. Khaltarkhuu. <strong>2016</strong>. “Obstacles to<br />
<strong>Development</strong>: What Data Are Available on Fragility,<br />
Conflict and Violence?” The Data Blog, 13 July. World<br />
Bank, Washington, DC. http://blogs.worldbank.<br />
org/ opendata/obstacles-development-what-data-areavailable-fragility-conflict-and-violence.<br />
Accessed 25<br />
August <strong>2016</strong>.<br />
Rasooly, M.H., P. Govindasamy, A. Agil, S. Rutstein,<br />
F. Arnold, B. Noormal, A. Way, S. Brock and A.<br />
Shadoul. 2014. “Success in Reducing Maternal and<br />
Child Mortality in Afghanistan.” Global Public Health<br />
9(Supplement 1): S29–542.<br />
Raub, A., A. Cassola, I. Latz and J. Heymann. <strong>2016</strong>.<br />
“Protections of Equal Rights across Sexual Orientation<br />
and Gender Identity: An Analysis of 193 National<br />
Constitutions.” Yale Journal of Law and Feminism 28(1):<br />
149–169. www.worldpolicycenter.org/sites/default/files/<br />
WORLD_Constitutions_SOGI.pdf. Accessed 25 August<br />
<strong>2016</strong>.<br />
Ravallion, M. <strong>2016</strong>. “The World Bank: Why It Is Still<br />
Needed and Why It Still Disappoints.” Journal of<br />
Economic Perspectives 30(1): 77–94.<br />
Reinhart, C., and Trebesch, C. <strong>2016</strong>. “The International<br />
Monetary Fund: 70 Years of Reinvention.” Journal of<br />
Economic Perspectives 30(1): 3–28.<br />
Republic of Ghana. 2012. “Ghana Open Data Initiative.”<br />
Accra. http://data.gov.gh. Accessed 26 September <strong>2016</strong>.<br />
Republic of Kenya. 2011. “Kenya Open Data.” Nairobi.<br />
www.opendata.go.ke. Accessed 26 September <strong>2016</strong>.<br />
Rizwanul, I., and I. Iyanatul. 2015. Employment and<br />
Inclusive <strong>Development</strong>. Routledge Studies in <strong>Development</strong><br />
Economics Series. New York: Routledge.<br />
Rodrik, D. 2011. The Globalization Paradox: Democracy and<br />
the Future of the World Economy. New York: Norton.<br />
Roy, R., A. Heuty and E. Letouzé. 2007. “Fiscal Space for<br />
What? Analytical Issues from a <strong>Human</strong> <strong>Development</strong><br />
Perspective.” Paper prepared for the G-20 workshop<br />
on fiscal policy, Istanbul, 30 June–2 July. www.undp.<br />
org/content/dam/aplaws/publication/en/publications/<br />
poverty-reduction/poverty-website/fiscal-space-for-what/<br />
FiscalSpaceforWhat.pdf. Accessed 7 November <strong>2016</strong>.<br />
Ruparelia, S. 2013. “A Progressive Juristocracy? The<br />
Unexpected Social Activism of India’s Supreme Court.”<br />
Helen Kellogg Institute Working Paper 391. University of<br />
Notre Dame, South Bend, IN. http://citeseerx.ist.psu.edu/<br />
viewdoc/download;jsessionid=12495ED2CD0B6B329183D<br />
D50898008F7?doi=10.1.1.352.2424&rep=rep1&type=pdf.<br />
Accessed 17 November <strong>2016</strong>.<br />
Rutkowski, M. <strong>2016</strong>. “Combating Poverty and Building<br />
Resilience through Social Protection.” Voices: Perspectives<br />
on <strong>Development</strong>, 21 September. World Bank, Washington,<br />
DC. http://blogs.worldbank.org/voices/combatingpoverty-and-building-resilience-through-social-protection.<br />
Accessed 7 November <strong>2016</strong>.<br />
S4YE (Solutions for Youth Employment). 2015. “Toward<br />
Solutions for Youth Employment: A Baseline for 2015.”<br />
Washington, DC. www.s4ye.org/sites/default/files/<br />
Toward_Solutions_for_Youth_Employment_Full.pdf.<br />
Accessed 11 October <strong>2016</strong>.<br />
Sachs, J. 2012. “How to Make Rich Countries Pay for<br />
Climate Change?” http://jeffsachs.org/2012/10/how-tomake-rich-countries-pay-for-climate-change/.<br />
Accessed 8<br />
November <strong>2016</strong>.<br />
Saez, E., and G. Zucman. 2014. “Wealth Inequality in<br />
the United States since 1913: Evidence from Capitalized<br />
Income Tax Data.” NBER Working Paper 20625. National<br />
Bureau of Economic Research, Cambridge, MA. http://<br />
gabriel-zucman.eu/files/SaezZucman2014.pdf. Accessed 1<br />
November <strong>2016</strong>.<br />
Sandefur, J. <strong>2016</strong>. “Measuring the Quality of Girls’<br />
Education across the Developing World.” Views from<br />
the Center: Education, Gender. Center for Global<br />
<strong>Development</strong>, Washington, DC. www.cgdev.org/blog/<br />
measuring-quality-girls-education-across-developingworld?utm_source=261018&utm_medium=cgd_<br />
email&utm_campaign=cgd_weekly&utm_&&&. Accessed<br />
31 October <strong>2016</strong>.<br />
Schmidt-Traub, G. 2015. “Investment Needs to Achieve<br />
the Sustainable <strong>Development</strong> Goals: Understanding the<br />
Billions and Trillions.” SDSN Working Paper Version 2.<br />
Sustainable <strong>Development</strong> Solutions Network, Paris. http://<br />
unsdsn.org/wp-content/uploads/2015/09/151112-SDG-<br />
Financing-Needs.pdf. Accessed 19 November <strong>2016</strong>.<br />
Schwab, K. <strong>2016</strong>. “How Can We Embrace the Opportunities<br />
of the Fourth Industrial Revolution?” World Economic<br />
Forum, Geneva. www.weforum.org/agenda/<strong>2016</strong>/01/<br />
how-can-we-embrace-the-opportunities-of-the-fourthindustrial-revolution/.<br />
Accessed 7 November <strong>2016</strong>.<br />
Sen, A. 1985. “Well-being, Agency and Freedom: The Dewey<br />
Lectures 1984.” Journal of Philosophy 2(4): 169–221.<br />
———. 2009. The Idea of Justice. Cambridge, MA: Harvard<br />
University Press.<br />
Serafina, P., and R. Tonkin. 2014. “Intergenerational<br />
Transmission of Disadvantage in the UK & EU, 2014.”<br />
23 September. UK Office for National Statistics,<br />
London. http://webarchive.nationalarchives.<br />
gov.uk/<strong>2016</strong>0105160709/www.ons.gov.uk/ons/<br />
dcp171766_378097.pdf. Accessed 26 October <strong>2016</strong>.<br />
Seth, A. <strong>2016</strong>. “Macroeconomic Policies for <strong>Human</strong><br />
<strong>Development</strong>.” Background paper for <strong>Human</strong> <strong>Development</strong><br />
<strong>Report</strong> <strong>2016</strong>. United Nations <strong>Development</strong> Programme,<br />
<strong>Human</strong> <strong>Development</strong> <strong>Report</strong> Office, New York.<br />
Shin, G.-W. 1998. “Agrarian Conflict and the Origins of<br />
Korean Capitalism.” American Journal of Sociology 103(5):<br />
1309–1351.<br />
Shriver Center (Sargent Shriver National Center on<br />
Poverty Law). <strong>2016</strong>. “Older Women and Poverty.”<br />
WomanView 19(9). Chicago. www.ncdsv.org/SSNCPL_<br />
Woman-View-Older-Women-and-Poverty_3-30-<strong>2016</strong>.pdf.<br />
Accessed 1 November <strong>2016</strong>.<br />
SIDA (Swedish International <strong>Development</strong> Agency).<br />
2015. “Women and Land Rights.” Gender Tool Box Brief.<br />
Stockholm. www.sida.se/contentassets/3a820dbd152<br />
f4fca98bacde8a8101e15/women-and-land-rights.pdf.<br />
Accessed 26 October <strong>2016</strong>.<br />
Simane, M. <strong>2016</strong>. “<strong>Human</strong> Resilience and <strong>Human</strong> Security in<br />
Latvia.” Background paper for <strong>Human</strong> <strong>Development</strong> <strong>Report</strong><br />
182 | HUMAN DEVELOPMENT REPORT <strong>2016</strong>
<strong>2016</strong>. United Nations <strong>Development</strong> Programme, <strong>Human</strong><br />
<strong>Development</strong> <strong>Report</strong> Office, New York.<br />
Smoke, P. 2015. “Quality Support Facilities in the Field of<br />
Decentralization, Local Governance and Local <strong>Development</strong>:<br />
Decentralization in Indonesia.” Letter of Contract No. 2,<br />
330793. IBF International Consulting and Local <strong>Development</strong><br />
International and European Union, Brussels.<br />
Social Progress Imperative. <strong>2016</strong>. “<strong>2016</strong> Social Progress<br />
Index.” Washington, DC. www.socialprogressimperative.<br />
org/global-index/. Accessed 19 July <strong>2016</strong>.<br />
Soura, A.B. 2015. “Climate Variability and Water Availability<br />
in Ouagadougou’s Informal Settlements.” International<br />
<strong>Development</strong> Research Centre of Canada, Climate Change<br />
and Water Programme, Ouagadougou. https://idl-bnc.<br />
idrc.ca/dspace/bitstream/10625/54180/1/IDL-54180.pdf.<br />
Accessed 22 November <strong>2016</strong>.<br />
Spacehive. <strong>2016</strong>. “Spacehive: About Us.” London. www.<br />
spacehive.com/Home/AboutUs. Accessed 11 October <strong>2016</strong>.<br />
Stampini, M., and L. Tornarolli. 2012. “The Growth of<br />
Conditional Cash Transfers in Latin America and the<br />
Caribbean: Did They Go Too Far?” Social Sector, Social<br />
Protection and Health Division Policy Brief IDB-PB-185.<br />
Inter-American <strong>Development</strong> Bank, Washington, DC.<br />
https://publications.iadb.org/handle/11319/1448?localeattribute=en.<br />
Accessed 27 October <strong>2016</strong>.<br />
State of Japan. 2013. “Japan’s Open Data Initiative.” Tokyo.<br />
www.data.go.jp. Accessed 26 September <strong>2016</strong>.<br />
Statista. <strong>2016</strong>. “Refugees and Forced Displacement in Focus:<br />
In 2015, 65.3 Million People Were Forcibly Displaced from<br />
Their Homes.” New York. www.statista.com/chart/5073/<br />
forced-displacement-in-focus/. Accessed 8 December <strong>2016</strong>.<br />
Stewart, F. 2013. “Capabilities and <strong>Human</strong> <strong>Development</strong>,<br />
Beyond the Individual: The Critical Role of Social<br />
Institutions and Social Competencies.” Occasional Paper<br />
2013/03, United Nations <strong>Development</strong> Programme, <strong>Human</strong><br />
<strong>Development</strong> <strong>Report</strong> Office, New York.<br />
Stone, L. 2015. “Quantitative Analysis of Women’s<br />
Participation in Peace Processes.” In M. O’Reilly, A.Ó.<br />
Súilleabháin and T. Paffenholz, eds., Reimagining<br />
Peacemaking: Women’s Roles in Peace Processes. New<br />
York: International Peace Institute.<br />
Street Child. 2014. “Ebola Orphans: Rays of Hope for<br />
2015, but 30,000+ at Crisis Point Now.” London. www.<br />
street-child.co.uk/news/2014/12/22/ebola-orphans-raysof-hope-for-2015-but-30000-at-crisis-point-now.<br />
Accessed<br />
11 October <strong>2016</strong>.<br />
Strong, A., and D.A. Schwartz. <strong>2016</strong>. “Sociocultural<br />
Aspects of Risk to Pregnant Women during the 2013–2015<br />
Multinational Ebola Virus Outbreak in West Africa.”<br />
Health Care for Women International 37(8): 922–942.<br />
Stuart, E., K. Bird, T. Bhatkal, R. Greenhill, S. Lally,<br />
G. Rabinowitz, E. Samman and M.B. Sarwar. <strong>2016</strong>.<br />
“Leaving No One Behind: A Critical Path for the First<br />
1,000 Days of the Sustainable <strong>Development</strong> Goals.”<br />
With Alainna Lynch, Overseas <strong>Development</strong> Institute,<br />
London. www.odi.org/sites/odi.org.uk/files/resourcedocuments/10692.pdf.<br />
Accessed 14 October <strong>2016</strong>.<br />
Suanes, M. <strong>2016</strong>. “Foreign Direct Investment and Income<br />
Inequality in Latin America: a Sectoral Analysis.” CEPAL<br />
Review 118, April.<br />
Subramanian, A., and S.-J. Wei. 2007. “The WTO<br />
Promotes Trade, Strongly But Unevenly.” Journal of<br />
International Economics 72(1): 151–75.<br />
Swartz, J. <strong>2016</strong>. “China’s National Emissions Trading<br />
System: Implications for Carbon Markets and Trade.” Issue<br />
Paper 6. International Centre for Trade and Sustainable<br />
<strong>Development</strong>, Geneva. www.ieta.org/resources/China/<br />
Chinas_National_ETS_Implications_for_Carbon_<br />
Markets_and_Trade_ICTSD_March<strong>2016</strong>_Jeff_Swartz.pdf.<br />
Accessed 16 November <strong>2016</strong>.<br />
Tanner, F. 2000. “Conflict Prevention and Conflict Resolution:<br />
Limits of Multilateralism.” International Review of the Red<br />
Cross 839.<br />
Teigen, M. 2012. “Gender Quotas on Corporate Boards.”<br />
Discussion paper presented at the European Commission<br />
“Exchange of Good Practices on Gender Equality: Women<br />
in Economic Decision-Making,” 10–11 May, Oslo. http://<br />
ec.europa.eu/justice/gender-equality/files/exchange_<br />
of_good_practice_no/no_discussion_paper_no_2012_<br />
en.pdf. Accessed 22 November <strong>2016</strong>.<br />
Thacker, S. 1999. “The High Politics of IMF Lending.” World<br />
Politics 52: 38–75.<br />
Thaler, R.H. 2015. Misbehaving: The Making of Behavioral<br />
Economics. New York: W.W. Norton & Company.<br />
Thaler, R.H., and C.R. Sunstein. 2008. Nudge: Improving<br />
Decisions about Health, Wealth, and Happiness. New<br />
Haven, CT: Yale University Press.<br />
Thomson, S. <strong>2016</strong>. “5,000 Women a Year Are Still Being<br />
Killed in the Name of ‘Honour’.” World Economic Forum,<br />
Geneva. www.weforum.org/agenda/<strong>2016</strong>/07/honourkillings-pakistan-qandeel-baloch/.<br />
Accessed 11 October<br />
<strong>2016</strong>.<br />
Timmer, M., A. Erumban, B. Los, R. Stehrer and G. de<br />
Vries. 2014. “Slicing Up Global Value Chains.” Journal of<br />
Economic Perspectives 28(2): 99–118.<br />
Torche, F. 2014. “Intergenerational Mobility and Inequality:<br />
The Latin American Case.” Annual Review of Sociology<br />
40(1): 619–642.<br />
———. <strong>2016</strong>. “Early-Life Exposures and the<br />
Intergenerational Persistence of Disadvantage.”<br />
Background paper for <strong>Human</strong> <strong>Development</strong> <strong>Report</strong><br />
<strong>2016</strong>. United Nations <strong>Development</strong> Programme, <strong>Human</strong><br />
<strong>Development</strong> <strong>Report</strong> Office, New York.<br />
UCDP (Uppsala Conflict Data Program). <strong>2016</strong>. “Uppsala<br />
Conflict Data Program Database.” www.ucdp.uu.se.<br />
Accessed 8 November <strong>2016</strong>.<br />
UCL Institute of Health Equity. 2010. Fair Society, Healthy<br />
Lives: Marmot Review, Strategic Review of Health<br />
Inequalities in England Post-2010. London. www.<br />
instituteofhealthequity.org/projects/fair-society-healthylives-the-marmot-review.<br />
Accessed 26 October <strong>2016</strong>.<br />
UNAIDS (Joint United Nations Programme on HIV/<br />
AIDS). 2014a. “The Gap <strong>Report</strong> 2014: Adolescent<br />
Girls and Young Women.” In The Gap <strong>Report</strong>. Geneva.<br />
www.unaids.org/sites/default/files/media_asset/02_<br />
Adolescentgirlsandyoungwomen.pdf. Accessed 14 October<br />
<strong>2016</strong>.<br />
———. 2014b. The Gap <strong>Report</strong>. Geneva. www.unaids.org/<br />
sites/default/files/media_asset/UNAIDS_Gap_ report_<br />
en.pdf. Accessed 14 October <strong>2016</strong>.<br />
———. 2015. World AIDS Day 2015: On the Fast-Track<br />
to End AIDS by 2030: Focus on Location and Population.<br />
Geneva. www.unaids.org/sites/default/files/media_asset/<br />
WAD2015_report_en_part01.pdf. Accessed 14 October<br />
<strong>2016</strong>.<br />
———. <strong>2016</strong>a. AIDS by the Numbers: AIDS Is Not Over,<br />
But It Can Be. Geneva. www.unaids.org/sites/default/<br />
files/media_asset/AIDS-by-the-numbers-<strong>2016</strong>_en.pdf.<br />
Accessed 23 August <strong>2016</strong>.<br />
———. <strong>2016</strong>b.”Children and HIV.” Fact sheet. Geneva.<br />
www.unaids.org/sites/default/files/media_asset/<br />
FactSheet_Children_en.pdf. Accessed 14 October <strong>2016</strong>.<br />
———. <strong>2016</strong>c. “Fast-Track Cities: Cities Ending the AIDS<br />
Epidemic.” Geneva. www.unaids.org/sites/default/files/<br />
media_asset/cities-ending-the-aids-epidemic_en.pdf.<br />
Accessed 16 November <strong>2016</strong>.<br />
———. <strong>2016</strong>d. Global Aids Update <strong>2016</strong>. Geneva. www.<br />
unaids.org/sites/default/files/media_asset/global-AIDSupdate-<strong>2016</strong>_en.pdf.<br />
Accessed 25 August <strong>2016</strong>.<br />
———. <strong>2016</strong>e. “Global HIV Statistics Fact Sheet November<br />
<strong>2016</strong>.” Geneva. www.unaids.org/sites/default/files/<br />
media_asset/UNAIDS_FactSheet_en.pdf. Accessed 30<br />
November <strong>2016</strong>.<br />
———. <strong>2016</strong>f. “On the Fast-Track to an AIDS-Free<br />
Generation.” Geneva. www.unaids.org/sites/default/<br />
files/media_asset/GlobalPlan<strong>2016</strong>_en.pdf. Accessed 7<br />
November <strong>2016</strong>.<br />
UNCCD (United Nations Convention to Combat<br />
Desertification). 2015. “Desertification, Land Degradation<br />
and Drought (DLDD): Some Global Facts and Figures. Bonn,<br />
Germany. www.unccd.int/Lists/SiteDocumentLibrary/<br />
WDCD/DLDD%20Facts.pdf. Accessed 11 October <strong>2016</strong>.<br />
UNCTAD (United Nations Conference on Trade and<br />
<strong>Development</strong>). 2014. World Investment <strong>Report</strong> 2014:<br />
Investing in the SDGs: An Action Plan. Geneva.<br />
———. 2015. UNCTADStat. Geneva. http://unctadstat.<br />
unctad.org/wds/<strong>Report</strong>Folders/reportFolders.aspx.<br />
Accessed 11 October <strong>2016</strong>.<br />
———. <strong>2016</strong>. World Investment <strong>Report</strong> <strong>2016</strong>: Investor<br />
Nationality: Policy Challenges. Geneva.<br />
UNDESA (United Nations Department of Economic and<br />
Social Affairs). 2009. State of the World’s Indigenous<br />
Peoples. <strong>Report</strong> ST/ESA/328. New York. www.un.org/esa/<br />
socdev/unpfii/documents/SOWIP/en/SOWIP_web.pdf.<br />
Accessed 28 October <strong>2016</strong>.<br />
———. 2012. World Economic and Social Survey 2012: In<br />
Search of New <strong>Development</strong> Finance. New York.<br />
———. 2013a. Indigenous Peoples’ Access to Health<br />
Services. Vol. 2 of State of the World’s Indigenous Peoples.<br />
New York. www.un.org/esa/socdev/unpfii/ documents/2015/<br />
sowip2volume-ac.pdf. Accessed 28 October <strong>2016</strong>.<br />
———. 2013b. International Migration Policies:<br />
Government Views and Priorities. New York.<br />
———. 2014a. United Nations E-government Survey 2014:<br />
E-Government for the Future We Want. <strong>Report</strong> ST/ESA/<br />
PAD/SER.E/188. New York. https://publicadministration.<br />
un.org/egovkb/Portals/egovkb/Documents/un/2014-<br />
Survey/E-Gov_Complete_Survey-2014.pdf. Accessed 7<br />
November <strong>2016</strong>.<br />
———. 2014b. World Urbanization Prospects: The 2014<br />
Revision. New York. https://esa.un.org/unpd/wup/<br />
Publications/Files/WUP2014-<strong>Report</strong>.pdf. Accessed 11<br />
October <strong>2016</strong>.<br />
———. 2015a. “Old-Age Dependency Ratio (Ratio of<br />
Population Aged 65+ per 100 Population 15–64).” https://<br />
esa.un.org/unpd/wpp/DataQuery/. Accessed 26 October<br />
<strong>2016</strong>.<br />
References | 183
———. 2015b.”Percentage of Total Population by Broad<br />
Age Group, Both Sexes (per 100 Total Population).” New<br />
York. https://esa.un.org/unpd/wpp/DataQuery/. Accessed<br />
26 October <strong>2016</strong>.<br />
———. 2015c. Trends in International Migrant Stock: The<br />
2015 Revision. New York.<br />
———. 2015d. World Population Prospects: Key Findings<br />
and Advance Tables: 2015 Revision. New York. https://<br />
esa.un.org/unpd/wpp/Publications/Files/Key_Findings_<br />
WPP_2015.pdf. Accessed 23 August <strong>2016</strong>.<br />
———. 2015e. The World’s Women 2015: Trends and<br />
Statistics. New York.<br />
———. 2015f. World Urbanization Prospects: The 2014<br />
Revision. <strong>Report</strong> ST/ESA/SER.A/366. New York. https://<br />
esa.un.org/unpd/wup/Publications/Files/WUP2014-<br />
<strong>Report</strong>.pdf. Accessed 16 November <strong>2016</strong>.<br />
———. <strong>2016</strong>a. Global Sustainable <strong>Development</strong> <strong>Report</strong><br />
<strong>2016</strong>. New York. https://sustainabledevelopment.un.org/<br />
content/documents/2328Global%20Sustainable%20<br />
development%20report%20<strong>2016</strong>%20(final).pdf. Accessed<br />
1 November <strong>2016</strong>.<br />
———. <strong>2016</strong>b. “NGO Branch.” New York. http://csonet.org.<br />
Accessed 18 October <strong>2016</strong>.<br />
———. <strong>2016</strong>c. <strong>Report</strong> on the World Social Situation <strong>2016</strong>,<br />
Leaving No One Behind: The Imperative of Inclusive<br />
<strong>Development</strong>. Document ST/ESA/362. New York. www.<br />
un.org/development/desa/dspd/2015/12/30/report-onworld-social-situation-<strong>2016</strong>-2/.<br />
Accessed 4 November<br />
<strong>2016</strong>.<br />
———. <strong>2016</strong>d. United Nations E-government Survey <strong>2016</strong>:<br />
E-government in Support of Sustainable <strong>Development</strong>.<br />
New York. http://workspace.unpan.org/sites/Internet/<br />
Documents/UNPAN96407.pdf. Accessed 4 December <strong>2016</strong>.<br />
———. <strong>2016</strong>e. World Youth <strong>Report</strong> on Youth Civic<br />
Engagement. New York. www.unworldyouthreport.org/<br />
images/docs/un_world_youth_report_youth_civic_<br />
engagement.pdf. Accessed 23 August <strong>2016</strong>.<br />
UNDP (United Nations <strong>Development</strong> Programme).<br />
1990. <strong>Human</strong> <strong>Development</strong> <strong>Report</strong> 1990: Concept and<br />
Measurement of <strong>Human</strong> <strong>Development</strong>. New York: Oxford<br />
University Press. http://hdr.undp.org/sites/default/<br />
files/ reports/219/hdr_1990_en_complete_nostats.pdf.<br />
Accessed 8 December <strong>2016</strong>.<br />
———. 1991. <strong>Human</strong> <strong>Development</strong> <strong>Report</strong> 1991. New York:<br />
Oxford University Press. http://hdr.undp.org/sites/default/<br />
files/reports/220/hdr_1991_en_complete_nostats.pdf.<br />
Accessed 7 November <strong>2016</strong>.<br />
———. 1992. <strong>Human</strong> <strong>Development</strong> <strong>Report</strong> 1992: Global<br />
Dimensions of <strong>Human</strong> <strong>Development</strong>. New York. http://hdr.<br />
undp.org/sites/default/files/reports/221/hdr_1992_en_<br />
complete_nostats.pdf. Accessed 7 November <strong>2016</strong>.<br />
———. 1994. <strong>Human</strong> <strong>Development</strong> <strong>Report</strong> 1994: New<br />
Dimensions of <strong>Human</strong> Security. New York: Oxford<br />
University Press. http://hdr.undp.org/sites/default/<br />
files/ reports/255/hdr_1994_en_complete_nostats.pdf.<br />
Accessed 11 October <strong>2016</strong>.<br />
———. 1995. <strong>Human</strong> <strong>Development</strong> <strong>Report</strong> 1995: Gender<br />
and <strong>Human</strong> <strong>Development</strong>. New York: Oxford University<br />
Press. http://hdr.undp.org/sites/default/files/reports/256/<br />
hdr_1995_en_complete_nostats.pdf. Accessed 11<br />
October <strong>2016</strong>.<br />
———. 1997. <strong>Human</strong> <strong>Development</strong> <strong>Report</strong> 1997: <strong>Human</strong><br />
<strong>Development</strong> to Eradicate Poverty. New York: Oxford<br />
University Press. http://hdr.undp.org/sites/default/<br />
files/ reports/258/hdr_1997_en_complete_nostats.pdf.<br />
Accessed 11 October <strong>2016</strong>.<br />
———. 2000. <strong>Human</strong> <strong>Development</strong> <strong>Report</strong> 2000: <strong>Human</strong><br />
Rights and <strong>Human</strong> <strong>Development</strong>. New York: Oxford<br />
University Press.<br />
———. 2002. <strong>Human</strong> <strong>Development</strong> <strong>Report</strong> 2002: Deepening<br />
Democracy in a Fragmented World. New York: Oxford<br />
University Press. http://hdr.undp.org/sites/default/files/<br />
reports/263/hdr_2002_en_complete.pdf. Accessed 11<br />
October <strong>2016</strong>.<br />
———. 2004. <strong>Human</strong> <strong>Development</strong> <strong>Report</strong> 2004: Cultural<br />
Liberty in Today’s Diverse World. New York: Oxford<br />
University Press. http://hdr.undp.org/sites/default/<br />
files/reports/265/hdr_2004_complete.pdf. Accessed 11<br />
October <strong>2016</strong>.<br />
———. 2007. <strong>Human</strong> <strong>Development</strong> <strong>Report</strong> 2007/2008:<br />
Fighting Climate Change: <strong>Human</strong> Solidarity in a Divided<br />
World. New York: Palgrave Macmillan. http://hdr.undp.<br />
org/sites/default/files/reports/268/hdr_20072008_en_<br />
complete.pdf. Accessed 11 October <strong>2016</strong>.<br />
———. 2009. <strong>Human</strong> <strong>Development</strong> <strong>Report</strong> 2009:<br />
Overcoming Barriers: <strong>Human</strong> Mobility and <strong>Development</strong>.<br />
New York: Palgrave Macmillan. www.hdr.undp.org/sites/<br />
default/files/reports/269/hdr_2009_en_complete.pdf.<br />
Accessed 26 October <strong>2016</strong>.<br />
———. 2010a. <strong>Human</strong> <strong>Development</strong> <strong>Report</strong> 2010: The Real<br />
Wealth of Nations: Pathways to <strong>Human</strong> <strong>Development</strong>.<br />
New York: Palgrave Macmillan.<br />
———. 2010b. Informe sobre Desarrollo <strong>Human</strong>o de los<br />
Pueblos Indígenas en México: El reto de la desigualdad de<br />
oportunidades. Mexico City.<br />
———. 2011a. “Empowering Lives, Building Resilience:<br />
<strong>Development</strong> Stories from Europe and Central Asia.”<br />
Volume 1. New York. www.scribd.com/doc/153150985/<br />
UNDP-development-stories-Europe-and-CIS. Accessed 7<br />
November <strong>2016</strong>.<br />
———. 2011b. <strong>Human</strong> <strong>Development</strong> <strong>Report</strong> 2011:<br />
Sustainability and Equity: A Better Future for All. New<br />
York: Palgrave Macmillan. http://hdr.undp.org/sites/<br />
default/files/reports/271/hdr_2011_en_complete.pdf.<br />
Accessed 11 October <strong>2016</strong>.<br />
———. 2012a. Desarrollo <strong>Human</strong>o en Chile 2012: Bienestar<br />
subjetivo: el desafío de repensar el desarrollo. Santiago.<br />
http://desarrollohumano.cl/idh/informes/2012-bienestarsubjetivo-el-desafio-de-repensar-el-desarrollo/.<br />
Accessed<br />
26 October <strong>2016</strong>.<br />
———. 2012b. Somalia <strong>Human</strong> <strong>Development</strong> <strong>Report</strong> 2012:<br />
Empowering Youth for Peace and <strong>Development</strong>. Mogadishu.<br />
www.hdr.undp.org/sites/default/files/reports/242/somalia_<br />
report_2012.pdf. Accessed 26 October <strong>2016</strong>.<br />
———. 2013a. Annual <strong>Report</strong> 2012–2013: Supporting<br />
Global Progress. New York. www.undp.org/content/dam/<br />
timorleste/img/UNDP_AR2013_English_v11-PRINT-Ready.<br />
pdf. Accessed 7 November <strong>2016</strong>.<br />
———. 2013b. China National <strong>Human</strong> <strong>Development</strong> <strong>Report</strong><br />
2013: Sustainable and Liveable Cities: Toward Ecological<br />
Civilization. Beijing. www.hdr.undp.org/sites/default/files/<br />
china_nhdr_2013_en_final.pdf. Accessed 1 November <strong>2016</strong>.<br />
———. 2013c. <strong>Human</strong> <strong>Development</strong> <strong>Report</strong> 2013: The Rise<br />
of the South: <strong>Human</strong> Progress in a Diverse World. New<br />
York. http://hdr.undp.org/sites/default/files/reports/14/<br />
hdr2013_en_complete.pdf. Accessed 4 December <strong>2016</strong>.<br />
———. 2014a. Beyond Geography: Unlocking <strong>Human</strong><br />
Potential. Kathmandu. www.hdr.undp.org/sites/default/<br />
files/nepal_nhdr_2014-final.pdf. Accessed 26 October <strong>2016</strong>.<br />
———. 2014b. <strong>Human</strong> <strong>Development</strong> <strong>Report</strong> 2014: Sustaining<br />
<strong>Human</strong> Progress: Reducing Vulnerabilities and Building<br />
Resilience. New York. http://hdr.undp.org/sites/default/<br />
files/hdr14-report-en-1.pdf. Accessed 26 October <strong>2016</strong>.<br />
———. 2014c. Informe Nacional de Desarrollo <strong>Human</strong>o<br />
Panamá 2014: El Futuro es ahora: Primera infancia,<br />
juventud y formación de capacidades para la vida. Panama<br />
City. www.hdr.undp.org/sites/default/files/idh-panamaene-10-14-final.pdf.<br />
Accessed 26 October <strong>2016</strong>.<br />
———. 2014d. National <strong>Human</strong> <strong>Development</strong> <strong>Report</strong> 2014:<br />
Ethiopia: Accelerating Inclusive Growth for Sustainable<br />
<strong>Human</strong> <strong>Development</strong> in Ethiopia. Addis Ababa. www.hdr.<br />
undp.org/sites/default/files/nhdr2015-ethiopia-en.pdf.<br />
Accessed 26 October <strong>2016</strong>.<br />
———. 2014e. Nepal <strong>Human</strong> <strong>Development</strong> <strong>Report</strong><br />
2014: Beyond Geography: Unlocking <strong>Human</strong> Potential.<br />
Kathmandu. http://hdr.undp.org/sites/default/files/ nepal_<br />
nhdr_2014-final.pdf. Accessed 26 October <strong>2016</strong>.<br />
———. 2015a. <strong>Human</strong> <strong>Development</strong> <strong>Report</strong> 2015: Work<br />
for <strong>Human</strong> <strong>Development</strong>. New York. http://hdr.undp.org/<br />
sites/default/files/2015_human_development_report.pdf.<br />
Accessed 11 October <strong>2016</strong>.<br />
———. 2015b. National <strong>Human</strong> <strong>Development</strong> <strong>Report</strong> 2015:<br />
<strong>Human</strong> Security and <strong>Human</strong> <strong>Development</strong> in Nigeria. Abuja.<br />
———. <strong>2016</strong>a. Africa <strong>Human</strong> <strong>Development</strong> <strong>Report</strong> <strong>2016</strong>:<br />
Accelerating Gender Equality and Women’s Empowerment<br />
in Africa. New York. www.undp.org/content/dam/undp/<br />
library/corporate/HDR/Africa%20HDR/AfHDR_<strong>2016</strong>_<br />
lowres_EN.pdf?download. Accessed 14 October <strong>2016</strong>.<br />
———. <strong>2016</strong>b. Caribbean <strong>Human</strong> <strong>Development</strong> <strong>Report</strong>:<br />
Multidimensional Progress: <strong>Human</strong> Resilience beyond<br />
Income. New York. www.bb.undp.org/content/barbados/<br />
en/home/presscenter/articles/<strong>2016</strong>/09/13/caribbeanhuman-development-report-<strong>2016</strong>-launched.html.<br />
Accessed<br />
28 November <strong>2016</strong>.<br />
———. <strong>2016</strong>c. China National <strong>Human</strong> <strong>Development</strong> <strong>Report</strong><br />
<strong>2016</strong>: Social Innovation for Inclusive <strong>Human</strong> <strong>Development</strong>.<br />
Beijing. www.cn.undp.org/content/china/en/home/<br />
library/human_development/china-human-developmentreport-<strong>2016</strong>.html.<br />
Accessed 13 December <strong>2016</strong>.<br />
———. <strong>2016</strong>d. Eurasia: 2015 in Review: Stories across the<br />
Region, from the Year that Changed the Global <strong>Development</strong><br />
Agenda. https://undpeurasia.exposure.co/eurasia-2015-inreview.<br />
New York. Accessed 7 November <strong>2016</strong>.<br />
———. <strong>2016</strong>e. Growth that Works for All: Viet Nam <strong>Human</strong><br />
<strong>Development</strong> <strong>Report</strong> 2015 on Inclusive Growth. Hanoi.<br />
www.hdr.undp.org/sites/default/files/nhdr_2015_e.pdf.<br />
Accessed 26 October <strong>2016</strong>.<br />
———. <strong>2016</strong>f. “Helen Clark: Remarks at the Panel on<br />
Ensuring that No-One Is Left Behind and the Challenge<br />
of Countries in Special Situations at the Ministerial<br />
Segment of the ECOSOC High Level Political Forum<br />
on Sustainable <strong>Development</strong>.” 18 July. New York.<br />
www.undp.org/ content/undp/en/home/presscenter/<br />
speeches/<strong>2016</strong>/07/18/helen-clark-remarks-at-the-panelon-ensuring-that-no-one-is-left-behind-at-the-ministerialsegment-of-the-ecosoc-high-level-political-forum-onsustainable-development.html.<br />
Accessed 11 October <strong>2016</strong>.<br />
184 | HUMAN DEVELOPMENT REPORT <strong>2016</strong>
———. <strong>2016</strong>g. “Legal Aid Service in Georgia.” New<br />
York. www.undp.org/content/undp/en/home/ourwork/<br />
democraticgovernance/projects_and_initiatives/ georgia_<br />
justice_forall.html. Accessed 17 November <strong>2016</strong>.<br />
———. <strong>2016</strong>h. “Managing Droughts and Floods in<br />
Azerbaijan.” New York. www.undp.org/content/undp/en/<br />
home/ourwork/ourstories/managing-droughts-and-floodsin-azerbaijan-.html.<br />
Accessed 16 November <strong>2016</strong>.<br />
———. <strong>2016</strong>i. Mongolia <strong>Human</strong> <strong>Development</strong> <strong>Report</strong><br />
<strong>2016</strong>: Building a Better Tomorrow: Including Youth in the<br />
<strong>Development</strong> of Mongolia. Ulaanbaatar. www.hdr.undp.<br />
org/sites/default/files/mongolia_human_ devlopment_<br />
report_<strong>2016</strong>_english_full_report_<strong>2016</strong>_06_28.pdf.<br />
Accessed 1 November <strong>2016</strong>.<br />
———. <strong>2016</strong>j. “Together, Sri Lankan Communities Build<br />
Back with Resilience.” New York. www.undp.org/content/<br />
undp/en/home/ourwork/ourstories/together-sri-lankancommunities-build-back-with-resilience.html.<br />
Accessed 16<br />
November <strong>2016</strong>.<br />
———. 2017. <strong>Human</strong> <strong>Development</strong> <strong>Report</strong> Office’s Library<br />
[online database]. http://hdr.undp.org/en/reports.<br />
Accessed 16 January 2017.<br />
UNDP (United Nations <strong>Development</strong> Programme) and<br />
IAER (Institute for Applied Economic Research, João<br />
Pinheiro Foundation). 2013. <strong>Human</strong> <strong>Development</strong> Atlas<br />
in Brazil. http://atlasbrasil.org.br/2013/en/o_atlas/o_<br />
atlas_/. Accessed 14 December <strong>2016</strong>.<br />
UNEP (United Nations Environment Programme). <strong>2016</strong>.<br />
“Developing Countries Show World Way Forward on<br />
Green Finance.” UNEP News Centre, 18 July. Geneva.<br />
www.unep.org/newscentre/default.aspx?DocumentID=27<br />
079&ArticleID=36231&l=en. Accessed 9 November <strong>2016</strong>.<br />
UNEP (United Nations Environment Programme) and<br />
UNDP (United Nations <strong>Development</strong> Programme).<br />
<strong>2016</strong>. “The Poverty-Environment Initiative in the Context<br />
of the Sustainable <strong>Development</strong> Goals: Relevance and<br />
Experience for National and Subnational Implementation.”<br />
UNDP-UNEP Poverty-Environment Facility, United Nations,<br />
Nairobi. www.undp.org/content/dam/undp/library/<br />
Environment%20and%20Energy/sustainable%20land%20<br />
management/Factsheet-PEI.pdf. Accessed 16 November<br />
<strong>2016</strong>.<br />
UNESCO (United Nations Educational, Scientific and<br />
Cultural Organization). 2013a. “Children Still Battling to<br />
go to School.” Education for all Global Monitoring <strong>Report</strong>,<br />
Policy Paper 10. Montreal. http://unesdoc.unesco.org/<br />
images/0022/002216/221668E.pdf. Accessed 26 October<br />
<strong>2016</strong>.<br />
———. 2013b. Education for All Global Monitoring <strong>Report</strong> –<br />
Girls’ Education – the Facts. Paris.<br />
———. 2013c. “Girls’ Education: The Facts.” Education for<br />
All Global Monitoring <strong>Report</strong>, Fact Sheet. Paris. http://<br />
en.unesco.org/gem-report/sites/gem-report/files/girlsfactsheet-en.pdf.<br />
Accessed 7 November <strong>2016</strong>.<br />
———. 2014a. Education for All: Global Monitoring <strong>Report</strong><br />
2014: Teaching and Learning: Achieving Quality for All.<br />
Paris.<br />
———. 2014b. Teaching and Learning: Achieving Quality for<br />
All: EFA Global Monitoring <strong>Report</strong> 2013/4: Summary. Paris.<br />
http://unesdoc.unesco.org/images/0022/002256/225654e.<br />
pdf. Accessed 3 November <strong>2016</strong>.<br />
———. 2015a. “A Growing Number of Children and<br />
Adolescents Are out of School as Aid Fails to Meet the<br />
Mark.” Policy Paper 22/Fact sheet 31. Paris. www.uis.<br />
unesco.org/Education/Documents/fs-31-out-of-schoolchildren-en.pdf.<br />
Accessed 25 August <strong>2016</strong>.<br />
———. 2015b. 2015 Global Monitoring <strong>Report</strong>: Education<br />
for All 2000-2015: Achievements and Challenges. Paris.<br />
http://unesdoc.unesco.org/images/0023/002322/232205e.<br />
pdf. Accessed 14 October <strong>2016</strong>.<br />
———. <strong>2016</strong>a. Global Education Monitoring <strong>Report</strong> <strong>2016</strong>:<br />
Education for People and Planet: Creating Sustainable<br />
Futures for All. Paris. http://unesdoc.unesco.org/<br />
images/0024/002457/245752e.pdf. Accessed 11 October<br />
<strong>2016</strong>.<br />
———. <strong>2016</strong>b. “UNESCO eAtlas of Gender Inequality in<br />
Education.” UNESCO Institute for Statistics, Montreal.<br />
www.tellmaps.com/uis/gender/#!/tellmap/-1195952519.<br />
Accessed 10 June <strong>2016</strong>.<br />
UNESCO (United Nations Educational, Scientific and<br />
Cultural Organization) Institute for Statistics. <strong>2016</strong>.<br />
“Education: Illiterate Population.” Montreal. http://data.<br />
uis.unesco.org. Accessed 8 December <strong>2016</strong>.<br />
UNESCO (United Nations Educational, Scientific<br />
and Cultural Organization) and UNICEF (United<br />
Nations Children’s Fund). 2015. “Fixing the Broken<br />
Promise of Education for All: Findings from the Global<br />
Initiative on Out-of-School Children.” UNESCO Institute<br />
for Statistics, Montreal. http://unesdoc.unesco.org/<br />
images/0023/002315/231511e.pdf. Accessed 26 October<br />
<strong>2016</strong>.<br />
UNFCCC (United Nations Framework Convention on<br />
Climate Change). 2015. “Paris Agreement on Climate<br />
Change.” Paris. http://unfccc.int/paris_agreement/<br />
items/9485.php. Accessed on 3 December <strong>2016</strong>.<br />
UNFPA (United Nations Population Fund). 2014. State of<br />
World Population 2014: The Power of 1.8 Billion. New York.<br />
www.unfpa.org/sites/default/files/pub-pdf/EN-SWOP14-<br />
<strong>Report</strong>_FINAL-web.pdf. Accessed 20 October <strong>2016</strong>.<br />
———. 2015. “Migration.” 23 December. New York. www.<br />
unfpa.org/migration. Accessed 26 October <strong>2016</strong>.<br />
———. <strong>2016</strong>. “World Population Day.” New York. www.<br />
unfpa.org/events/world-population-day. Accessed 11<br />
October <strong>2016</strong>.<br />
UNFPA (United Nations Population Fund) and HelpAge<br />
International. 2012. Ageing in the Twenty-First Century:<br />
A Celebration and a Challenge. New York. www.unfpa.<br />
org/publications/ageing-twenty-first-century. Accessed 22<br />
November <strong>2016</strong>.<br />
UN-Habitat (United Nations <strong>Human</strong> Settlements<br />
Programme). 2014. “Proportion of Urban Population<br />
Living in Slums 1990–2014.” Nairobi. http://unhabitat.<br />
org/wp-content/uploads/2014/03/Table-2.2-Proportion-ofurban-population-living-in-slums-1990-2014.pdf.<br />
Accessed<br />
26 October <strong>2016</strong>.<br />
UNHCR (United Nations High Commissioner for<br />
Refugees). 1997. “Memorandum of Understanding<br />
between the United Nations High Commissioner<br />
for Refugees and the International Organization for<br />
Migration.” Geneva. www.unhcr.org/4aa7a3ed9.pdf.<br />
Accessed 11 November <strong>2016</strong>.<br />
———. 2014. UNHCR Global <strong>Report</strong> 2014: Progressing<br />
towards Solutions. Geneva. www.unhcr.org/en-us/<br />
publications/fundraising/5575a78813/unhcr-global-report-<br />
2014-progressing-towards-solutions.html?query=17years.<br />
Accessed 26 September <strong>2016</strong>.<br />
———. 2015a. “Funding UNHCR’s Programmes.” In Global<br />
<strong>Report</strong> 2015. Geneva. www.unhcr.org/574ed5574.pdf.<br />
Accessed 7 November <strong>2016</strong>.<br />
———. 2015b. “Needs and Funding Requirements.” In<br />
UNHCR Global Appeal <strong>2016</strong>-2017. Geneva. www.unhcr.<br />
org/564da0e20.pdf. Accessed 16 December <strong>2016</strong>.<br />
———. <strong>2016</strong>a. Global Trends: Forced Displacement<br />
in 2015. Geneva. https://s3.amazonaws.com/<br />
unhcrsharedmedia/<strong>2016</strong>/<strong>2016</strong>-06-20-global-trends/<strong>2016</strong>-<br />
06-14-Global-Trends-2015.pdf. Accessed 23 August <strong>2016</strong>.<br />
———. <strong>2016</strong>b. “Syria Regional Refugee Response.”<br />
Geneva. http://data.unhcr.org/syrianrefugees/regional.<br />
php. Accessed 1 November <strong>2016</strong>.<br />
———. <strong>2016</strong>c. “UNHCR Statistics: The World in Numbers.”<br />
Geneva. http://popstats.unhcr.org/en/overview. Accessed<br />
26 October <strong>2016</strong>.<br />
UNICEF (United Nations Children’s Fund). 2004. “Nepal,<br />
Welcome to School: Enrolment and Retention in the<br />
Education for All Initiative.” New York. www.unicef.org/<br />
innovations/files/fa2_nepal_welcome_to_school(1).doc.<br />
Accessed 14 October <strong>2016</strong>.<br />
———. 2011. “Children’s Vulnerability to Climate Change<br />
and Disaster Impacts in East Asia and the Pacific.” UNICEF<br />
East Asia and Pacific Regional Office, Bangkok. www.<br />
unicef.org/environment/files/Climate_Change_Regional_<br />
<strong>Report</strong>_14_Nov_final.pdf. Accessed 26 October <strong>2016</strong>.<br />
———. 2014a. Ending Child Marriage: Progress and<br />
Prospects. New York. www.unicef.org/media/files/Child_<br />
Marriage_<strong>Report</strong>_7_17_LR..pdf. Accessed 23 August <strong>2016</strong><br />
———. 2014b. A Statistical Snapshot of Violence against<br />
Adolescent Girls. New York. www.unicef.org/publications/<br />
files/A_Statistical_Snapshot_of_Violence_Against_<br />
Adolescent_Girls.pdf. Accessed 25 August <strong>2016</strong>.<br />
———. <strong>2016</strong>a. “Female Genital Mutilation/Cutting: A<br />
Global Concern.” New York. www.unicef.org/media/<br />
files/FGMC_<strong>2016</strong>_brochure_final_UNICEF_SPREAD.pdf.<br />
Accessed 26 August <strong>2016</strong>.<br />
———. <strong>2016</strong>b. “Multiple Indicator Cluster Surveys.” New<br />
York. http://mics.unicef.org. Accessed 15 July <strong>2016</strong>.<br />
———. <strong>2016</strong>c. State of the World’s Children <strong>2016</strong>: A Fair<br />
Chance for Every Child. New York. www.unicef.org/<br />
publications/files/UNICEF_SOWC_<strong>2016</strong>.pdf. Accessed 24<br />
August <strong>2016</strong>.<br />
———. <strong>2016</strong>d. “UNICEF Data: Monitoring the Situation of<br />
Children and Women.” New York. http://data.unicef.org/<br />
child-protection/child-marriage.html. Accessed 27 October<br />
<strong>2016</strong>.<br />
———. <strong>2016</strong>e. Uprooted: The Growing Crisis of Migrant<br />
Children. New York. www.unicef.org/publications/files/<br />
Uprooted_growing_crisis_for_refugee_and_migrant_<br />
children.pdf. Accessed 11 October <strong>2016</strong>.<br />
UNICEF (United Nations Children’s Fund) and World<br />
Bank. <strong>2016</strong>. “Ending Extreme Poverty: A Focus on<br />
Children.” New York. www.unicef.org/publications/<br />
files/Ending_Extreme_Poverty_A_Focus_on_Children_<br />
Oct_<strong>2016</strong>.pdf. Accessed 11 October <strong>2016</strong>.<br />
UNISDR (United Nations Office for Disaster Risk<br />
Reduction). 2015. Global Assessment <strong>Report</strong> on Disaster<br />
Risk Reduction 2015: Making <strong>Development</strong> Sustainable:<br />
The Future of Disaster Risk Management. Geneva. www.<br />
preventionweb.net/english/hyogo/gar/2015/en/gar-pdf/<br />
GAR2015_EN.pdf. Accessed 11 October <strong>2016</strong>.<br />
References | 185
United Kingdom. 2010. “Opening up Government.” London.<br />
https://data.gov.uk. Accessed 26 September <strong>2016</strong>.<br />
United Nations. 1948. “Universal Declaration of <strong>Human</strong><br />
Rights.” Document A/RES/3/217 A. New York.<br />
———. 2000a. “Resolution 1325 (2000) Adopted by<br />
the Security Council at its 4213th meeting, on 31<br />
October 2000.” New York. https://documents-dds-ny.<br />
un.org/doc/UNDOC/GEN/N00/720/18/PDF/N0072018.<br />
pdf?OpenElement. Accessed 11 October <strong>2016</strong>.<br />
———. 2000b. United Nations Millennium Declaration, A/<br />
RES/55/2. New York. www.un.org/millennium/declaration/ares552e.htm/.<br />
Accessed 26 September <strong>2016</strong>.<br />
———. 2010. “Decade for Deserts and the Fight against<br />
Desertification: Why Now?” New York. www.un.org/en/<br />
events/desertification_decade/whynow.shtml. Accessed<br />
23 August <strong>2016</strong>.<br />
———. 2011. Innovative Mechanisms of Financing<br />
for <strong>Development</strong>. <strong>Report</strong> of the Secretary-General.<br />
New York. www.un.org/ga/search/view_doc.<br />
asp?symbol=A/66/334&Lang=E. Accessed 30 September<br />
<strong>2016</strong>.<br />
———. 2012. “The Future We Want.” General Assembly<br />
Resolution 66/288. New York. www.un.org/ga/search/<br />
view_doc.asp?symbol=A/RES/66/288&Lang=E. Accessed<br />
1 July 2015.<br />
———. 2013. “Promotion and Protection of the Right to<br />
Freedom of Opinion and Expression.” Note by the Secretary-<br />
General. A/68/362. New York. https:// documents-dds-ny.<br />
un.org/doc/UNDOC/GEN/N13/464/76/pdf/N1346476.<br />
pdf?OpenElement. Accessed 7 November <strong>2016</strong>.<br />
———. 2014. “Framework of Analysis for Atrocity Crimes:<br />
A Tool for Prevention.” United Nations Office on Genocide<br />
Prevention and the Responsibility to Protect, New<br />
York. www.un.org/en/preventgenocide/adviser/pdf/<br />
framework%20of%20analysis%20for%20atrocity%20<br />
crimes_en.pdf. Accessed 27 October <strong>2016</strong>.<br />
———. 2015a. The Millennium <strong>Development</strong> Goals <strong>Report</strong><br />
2015. New York. www.un.org/millenniumgoals/2015_<br />
MDG_<strong>Report</strong>/pdf/MDG%202015%20rev%20(July%201).<br />
pdf. Accessed 26 October <strong>2016</strong>.<br />
———. 2015b. “<strong>Report</strong> of the Secretary-General on<br />
Women, Peace and Security.” Document S/2015/716. UN<br />
Security Council, New York.<br />
———. 2015c. Transforming Our World: The 2030 Agenda<br />
for Sustainable <strong>Development</strong>. Resolution adopted by<br />
the General Assembly on 25 September 2015. New<br />
York. www.un.org/ga/search/view_doc.asp?symbol=A/<br />
RES/70/1&Lang=E. Accessed 26 September <strong>2016</strong>.<br />
———. 2015d. “The World’s Women 2015: Trends and<br />
Statistics.” New York. http://unstats.un.org/unsd/gender/<br />
downloads/Ch5_Power_and_decision_info.pdf. Accessed<br />
22 November <strong>2016</strong>.<br />
———. <strong>2016</strong>a. “Have Your Say.” My World Analytics. New<br />
York. http://data.myworld2015.org. Accessed 26 October<br />
<strong>2016</strong>.<br />
———. <strong>2016</strong>b. Leave No One Behind: A Call to Action for<br />
Gender Equality and Women’s Economic Empowerment.<br />
New York.<br />
———. <strong>2016</strong>c. “New York Declaration.” New York.<br />
http://refugeesmigrants.un.org/declaration. Accessed 7<br />
November <strong>2016</strong>.<br />
———. <strong>2016</strong>d. One <strong>Human</strong>ity: Shared Responsibility.<br />
<strong>Report</strong> of the Secretary General for the World<br />
<strong>Human</strong>itarian Summit. New York.<br />
———. <strong>2016</strong>e. “Paris Climate Agreement to Enter into<br />
Force on 4 November <strong>2016</strong>.” New York. www.un.org/<br />
sustainabledevelopment/blog/<strong>2016</strong>/10/paris-climateagreement-to-enter-into-force-on-4-november/.<br />
Accessed<br />
14 October <strong>2016</strong>.<br />
———. <strong>2016</strong>f. “Press Freedom: Freedom of Expression,<br />
a <strong>Human</strong> Right.” New York. www.un.org/en/events/<br />
pressfreedomday/background.shtml. Accessed 8<br />
December <strong>2016</strong>.<br />
———. <strong>2016</strong>g. “<strong>Report</strong> of the Special Rapporteur on Minority<br />
Issues.” Document A/HRC/31/56. New York. www.refworld.<br />
org/docid/56dfde5d4.html. Accessed 14 October <strong>2016</strong>.<br />
———. <strong>2016</strong>h. “The Sustainable <strong>Development</strong> Goals <strong>Report</strong><br />
<strong>2016</strong>.” New York. http://unstats.un.org/sdgs/report/<strong>2016</strong>/<br />
The%20Sustainable%20<strong>Development</strong>%20Goals%20<br />
<strong>Report</strong>%20<strong>2016</strong>.pdf. Accessed 23 August <strong>2016</strong>.<br />
———. <strong>2016</strong>i. “UN Summit for Refugees.” New York.<br />
http://refugeesmigrants.un.org/summit. Accessed on 3<br />
December <strong>2016</strong>.<br />
United Nations Broadband Commission for Digital<br />
<strong>Development</strong>, Working Group on Broadband and<br />
Gender. 2015. Cyber Violence against Women and Girls:<br />
A World-wide Wake-up Call. Geneva.<br />
United Nations Peacekeeping. <strong>2016</strong>. “Gender Statistics<br />
by Mission for the Month of August.” 7 September.<br />
New York. www.un.org/en/peacekeeping/contributors/<br />
gender/<strong>2016</strong>gender/aug16.pdf. Accessed 11 October<br />
<strong>2016</strong>.<br />
United Nations Secretary General’s High-Level Panel<br />
on Access to Medicines. <strong>2016</strong>. <strong>Report</strong> of the United<br />
Nations Secretary General’s High-Level Panel on Access<br />
to Medicines: Promoting Innovation and Access to Health<br />
Technologies. New York. https://static1.squarespace.com/<br />
static/562094dee4b0d00c1a3ef761/t/57d9c6ebf5e231b2f<br />
02cd3d4/1473890031320/UNSG+HLP+<strong>Report</strong>+FINAL+12+<br />
Sept+<strong>2016</strong>.pdf. Accessed 2 December <strong>2016</strong>.<br />
United States of America. 2009. “Open Government.”<br />
Washington, DC. www.data.gov/open-gov/. Accessed 26<br />
September <strong>2016</strong>.<br />
UN Maternal Mortality Estimation Group (World Health<br />
Organization, United Nations Children’s Fund,<br />
United Nations Population Fund and World Bank).<br />
<strong>2016</strong>. Maternal mortality data. http://data.unicef.org/<br />
topic/ maternal-health/maternal-mortality/. Accessed 28<br />
April <strong>2016</strong>.<br />
UNODC (United Nations Office on Drugs and Crime).<br />
2013. Global Study on Homicide 2013. Vienna.<br />
www. unodc.org/documents/gsh/pdfs/2014_GLOBAL_<br />
HOMICIDE_BOOK_web.pdf. Accessed 14 October <strong>2016</strong>.<br />
———. 2014a. Global Study on Homicide 2013: Trends,<br />
Contexts, Data. Vienna. www.unodc.org/documents/<br />
gsh/pdfs/2014_GLOBAL_HOMICIDE_BOOK_web.pdf.<br />
Accessed 14 October <strong>2016</strong>.<br />
———. 2014b. “Study Facilitating the Identification,<br />
Description and Evaluation of the Effects of New<br />
Information Technologies on the Abuse and Exploitation of<br />
Children.” Vienna. www.unodc.org/documents/commis-<br />
sions/CCPCJ/CCPCJ_Sessions/CCPCJ_23/E-CN15-2014-<br />
CRP1_E.pdf. Accessed 7 November <strong>2016</strong>.<br />
———. <strong>2016</strong>. “Statistics, UN-CTS Metadata<br />
2014–2015: Prisons.” Vienna. https://data.unodc.<br />
org/?lf=1&lng=en#state:6. Accessed 7 November <strong>2016</strong>.<br />
UNOHCHR (Office of the United Nations High<br />
Commissioner for <strong>Human</strong> Rights). <strong>2016</strong>. “Monitoring<br />
the Core International <strong>Human</strong> Rights Treaties.” Geneva.<br />
www.ohchr.org/EN/HRBodies/Pages/TreatyBodies.aspx.<br />
Accessed 7 November <strong>2016</strong>.<br />
UNOSSC (United Nations Office for South-South<br />
Cooperation). <strong>2016</strong>. Good Practices in South-South and<br />
Triangular Cooperation for Sustainable <strong>Development</strong>.<br />
New York.<br />
UNRWA (United Nations Relief and Works Agency<br />
for Palestine Refugees in the Near East). 2013. The<br />
Syrian Catastrophe: Socioeconomic Monitoring <strong>Report</strong>.<br />
First Quarterly <strong>Report</strong> (January–March). Amman. www.<br />
unrwa.org/userfiles/2013071244355.pdf. Accessed 26<br />
October <strong>2016</strong>.<br />
UNSD (United Nations Statistics Division). 2008.<br />
UNdata: A World of Information. New York. http://data.<br />
un.org/Default.aspx. Accessed 26 September <strong>2016</strong>.<br />
———. <strong>2016</strong>. “Millennium <strong>Development</strong> Goals Indicators:<br />
The Official United Nations Site for the MDG Indicators.”<br />
New York. http://mdgs.un.org/unsd/mdg/Data.aspx.<br />
Accessed 16 June <strong>2016</strong>.<br />
UNV (United Nations Volunteers). <strong>2016</strong>. Annual <strong>Report</strong>:<br />
Delivering at the Grassroots. New York. www.unv.org/<br />
annual-report-2015/pdf/UNV-Annual-report-2015.pdf.<br />
Accessed 19 November <strong>2016</strong>.<br />
UN Women (United Nations Entity for Gender Equality<br />
and the Empowerment of Women). 2012. “Women’s<br />
Participation in Peace Negotiations: Connections between<br />
Presence and Influence.” New York. www.unwomen.<br />
org/~/media/headquarters/attachments/sections/<br />
library/publications/2012/10/wpssourcebook-03awomenpeacenegotiations-en.pdf.<br />
Accessed 11 October<br />
<strong>2016</strong>.<br />
———. 2013. “Femicide in Latin America.” 4 April. New<br />
York. www.unwomen.org/en/news/stories/2013/4/<br />
femicide-in-latin-america. Accessed 14 October <strong>2016</strong>.<br />
———. 2014. The Premise and Promise of UN Women’s<br />
Partnerships with Civil Society. New York. www2.<br />
unwomen.org/-/media/headquarters/attachments/<br />
sections/partnerships/civil%20society/unwomencivilsociety-brochure-en.pdf?v=1&d=20141013T121445.<br />
Accessed 16 December <strong>2016</strong>.<br />
———. 2015a. Progress of the World’s Women 2015–<strong>2016</strong>:<br />
Transforming Economies, Realizing Rights. New York.<br />
http://progress.unwomen.org/en/2015/. Accessed 1<br />
November <strong>2016</strong>.<br />
———. 2015b. “World Leaders Agree: We Must Close<br />
the Gender Gap. Historic Gathering Boosts Political<br />
Commitment for Women’s Empowerment at the Highest<br />
Levels.” Press release, 27 September. New York. www.<br />
unwomen.org/en/news/stories/2015/9/press-releaseglobal-leaders-meeting.<br />
Accessed 12 December <strong>2016</strong>.<br />
———. <strong>2016</strong>a. “Facts and Figures: Leadership and Political<br />
Participation, Women in Parliaments.” New York. www.<br />
unwomen.org/en/what-we-do/leadership-and-politicalparticipation/facts-and-figures.<br />
Accessed 22 November<br />
<strong>2016</strong>.<br />
186 | HUMAN DEVELOPMENT REPORT <strong>2016</strong>
———. <strong>2016</strong>b. “Passing and Implementing Effective Laws<br />
and Policies.” New York. www.unwomen.org/en/whatwe-do/ending-violence-against-women/passing-stronglaws-and-policies.<br />
Accessed 14 October <strong>2016</strong>.<br />
———. <strong>2016</strong>c. “Let’s Change These Numbers and Get More<br />
Women in STEM.” Tweet, 3 October. https://twitter.com/<br />
un_women/status/782982362854461442.<br />
———. n.d. “Women at the Forefront of Peacebuilding.”<br />
New York. www.unwomen.org/en/news/in-focus/womenpeace-security.<br />
Accessed 7 November <strong>2016</strong>.<br />
US Bureau of Labor Statistics. <strong>2016</strong>. “Employment<br />
Projections.” United States Department of Labor,<br />
Washington, DC. www.bls.gov/emp/ep_chart_001.htm.<br />
Accessed 7 November <strong>2016</strong>.<br />
Vaughan, A. <strong>2016</strong>. “Biodiversity Is Below Safe Levels across<br />
More Than Half of World’s Land—Study.” The Guardian,<br />
14 July. www.theguardian.com/environment/<strong>2016</strong>/jul/14/<br />
biodiversity-below-safe-levels-across-over-half-of-worldsland-study.<br />
Accessed 7 November <strong>2016</strong>.<br />
W3 Techs. <strong>2016</strong>. “Usage of Content Languages for<br />
Websites.” https://w3techs.com/technologies/overview/<br />
content_language/all. Accessed 28 November <strong>2016</strong>.<br />
Walk Free Foundation. <strong>2016</strong>. The Global Slavery<br />
Index <strong>2016</strong>. Broadway Nedlands, Western Australia.<br />
http://assets.globalslaveryindex.org/downloads/<br />
Global+Slavery+Index+<strong>2016</strong>.pdf. Accessed 11 October <strong>2016</strong>.<br />
Wallach, L., and B. Beachy. 2012. “Occidental v. Ecuador<br />
Award Spotlights Perils of Investor-State System.” Global<br />
Trade Watch. www.citizen.org/documents/oxy-v-ecuadormemo.pdf.<br />
Accessed 16 December <strong>2016</strong>.<br />
Watkins, K. 2013. “Education without Borders: A <strong>Report</strong><br />
from Lebanon on Syria’s Out-of-School Children.” World<br />
at School, London. www.odi.org/sites/odi.org.uk/files/<br />
odi-assets/publications-opinion-files/8575.pdf. Accessed<br />
26 October <strong>2016</strong>.<br />
Watkins, K., J.W. van Fleet and L. Greubel. 2012.<br />
“Interactive: Africa Learning Barometer.” 17 September.<br />
Brookings Institution, Washington, DC. www.brookings.<br />
edu/interactives/africa-learning-barometer/. Accessed 4<br />
November <strong>2016</strong>.<br />
Watson, C. <strong>2016</strong>. “How Communications Can Change<br />
Social Norms around Adolescent Girls: Lessons Learned<br />
from Year 3 of a Multi-country Field Study.” Overseas<br />
<strong>Development</strong> Institute, London. www.odi.org/sites/odi.<br />
org.uk/files/resource-documents/10375.pdf. Accessed 20<br />
October <strong>2016</strong>.<br />
WEF (World Economic Forum). 2015. “Global Risks 2015,<br />
Part 2: Risks in Focus: 2.3 City Limits: The Risks of Rapid<br />
and Unplanned Urbanization in Developing Countries.”<br />
Geneva. http://reports.weforum.org/global-risks-2015/<br />
part-2-risks-in-focus/2-3-city-limits-the-risks-of-rapidand-unplanned-urbanization-in-developing-countries/.<br />
Accessed 11 October <strong>2016</strong>.<br />
———. <strong>2016</strong>a. The Future of Jobs. Employment, Skills and<br />
Workforce Strategy for the Fourth Industrial Revolution.<br />
Global Challenge Insight <strong>Report</strong>. Geneva. www3.weforum.<br />
org/docs/WEF_Future_of_Jobs.pdf. Accessed 25 August<br />
<strong>2016</strong>.<br />
———. <strong>2016</strong>b. Global Gender Gap <strong>Report</strong> <strong>2016</strong>. Davos.<br />
http://reports.weforum.org/global-gender-gap- report-<br />
<strong>2016</strong>/.Accessed 3 December <strong>2016</strong>.<br />
———. <strong>2016</strong>c. Insight <strong>Report</strong>: The <strong>Human</strong> Capital <strong>Report</strong><br />
<strong>2016</strong>. Geneva.<br />
Weiss, T. 2007. <strong>Human</strong>itarian Intervention: Ideas in Action.<br />
Cambridge: Polity Press.<br />
WFP (World Food Programme). 2014. “Brazil: A Champion<br />
in the Fight against Hunger.” www.wfp.org/stories/brazilchampions-fight-against-hunger.<br />
Accessed 30 September<br />
<strong>2016</strong>.<br />
———. <strong>2016</strong>a. “Hunger Statistics.” Rome. www.wfp.org/<br />
hunger/stats. Accessed 25 August <strong>2016</strong>.<br />
———. <strong>2016</strong>b. “School Meals.” Rome. www.wfp.org/<br />
school-meals. Accessed 7 November <strong>2016</strong>.<br />
WHO (World Health Organization). 2011a. mHealth: New<br />
Horizons for Health through Mobile Technologies. Geneva.<br />
www.who.int/goe/publications/goe_mhealth_web.pdf.<br />
Accessed 4 December <strong>2016</strong>.<br />
———. 2011b. World <strong>Report</strong> on Disability. Geneva. www.<br />
who.int/disabilities/world_report/2011/en/. Accessed 28<br />
November <strong>2016</strong>.<br />
———. 2013. UNITAID Strategy 2013-<strong>2016</strong>. Geneva.<br />
———. 2015a. “Ageing and Health.” Fact sheet 404.<br />
Geneva. www.who.int/mediacentre/factsheets/fs404/en/.<br />
Accessed 26 October <strong>2016</strong>.<br />
———. 2015b. “Cancer.” Fact sheet 297. Geneva. www.<br />
who.int/mediacentre/factsheets/fs297/en/. Accessed 14<br />
October <strong>2016</strong>.<br />
———. 2015c. “Maternal Mortality.” Fact sheet 348.<br />
Geneva. www.who.int/mediacentre/factsheets/fs348/en/.<br />
Accessed 11 October <strong>2016</strong>.<br />
———. 2015d. “Noncommunicable Diseases.” Fact sheet<br />
355. Geneva. www.who.int/mediacentre/factsheets/<br />
fs355/en/. Accessed 14 October <strong>2016</strong>.<br />
———. 2015e. World <strong>Report</strong> on Ageing and<br />
Health. Geneva. http://apps.who.int/iris/bitstre<br />
am/10665/186463/1/9789240694811_eng.pdf?ua=1.<br />
Accessed 25 August <strong>2016</strong>.<br />
———. <strong>2016</strong>a. “Call to Action: Combat Antimicrobial<br />
Resistance and Preserve Antimicrobials for Future<br />
Generations.” Geneva. http://apps.who.int/medicinedocs/<br />
documents/s22393en/s22393en.pdf. Accessed 14 October<br />
<strong>2016</strong>.<br />
———. <strong>2016</strong>b. “Children: Reducing Mortality.” Fact sheet<br />
178. Geneva. www.who.int/mediacentre/factsheets/<br />
fs178/en/. Accessed 11 October <strong>2016</strong>.<br />
———. <strong>2016</strong>c. “Climate Change and Health.” Fact sheet<br />
266. Geneva. www.who.int/mediacentre/factsheets/<br />
fs266/en/. Accessed 25 August <strong>2016</strong>.<br />
———. <strong>2016</strong>d. “Female Genital Mutilation.” Fact sheet<br />
241. Geneva. www.who.int/mediacentre/factsheets/<br />
fs241/en/. Accessed 27 October <strong>2016</strong>.<br />
———. <strong>2016</strong>e. “Global Health Observatory (GHO) Data.”<br />
Geneva. www.who.int/gho/mortality_burden_disease/<br />
life_tables/en/. Accessed 3 November <strong>2016</strong>.<br />
———. <strong>2016</strong>f. “Mental Disorders.” Fact sheet 396. Geneva.<br />
www.who.int/mediacentre/factsheets/fs396/en/.<br />
Accessed 26 October <strong>2016</strong>.<br />
———. <strong>2016</strong>g. “Violence against Women: Intimate Partner<br />
and Sexual Violence against Women.” Fact sheet 239.<br />
Geneva. www.who.int/mediacentre/factsheets/fs239/en/.<br />
Accessed 25 August <strong>2016</strong>.<br />
———. <strong>2016</strong>h. “WHO Issues New Guidance on HIV<br />
Self-testing ahead of World AIDS Day.” Press release, 29<br />
November. Geneva. www.who.int/mediacentre/news/<br />
releases/<strong>2016</strong>/world-aids-day/en/. Accessed 5 December<br />
<strong>2016</strong>.<br />
———. <strong>2016</strong>i. World Malaria <strong>Report</strong> <strong>2016</strong>.<br />
Geneva. http://apps.who.int/iris/bitstre<br />
am/10665/252038/1/9789241511711-eng.pdf?ua=1.<br />
Accessed 14 December <strong>2016</strong>.<br />
———. <strong>2016</strong>j. “Zika Strategic Response Plan.” Geneva.<br />
http://apps.who.int/iris/bitstream/10665/246091/1/<br />
WHO-ZIKV-SRF-16.3-eng.pdf?ua=1&ua=1&ua=1&ua=1.<br />
Accessed 30 November <strong>2016</strong>.<br />
Wiemann, M., and C. Eibs-Singer. <strong>2016</strong>. “Renewable<br />
Mini-grids: Unlocking Africa’s Rural Powerhouse.” ESI<br />
Africa Issue 1. www.ruralelec.org/sites/default/files/<br />
esiafrica-renewablemini-grids.pdf. Accessed 7 November<br />
<strong>2016</strong>.<br />
Wiist, W., K. Barker, N. Arya, J. Rohde, M. Donohoe,<br />
S. White, P. Lubens, G. Gorman and A. Hagopian.<br />
2014. “The Role of Public Health in the Prevention of War:<br />
Rationale and Competencies.” American Journal of Public<br />
Health 104(6): e34–e47 www.ncbi.nlm.nih.gov/pmc/<br />
articles/PMC4062030/. Accessed 19 November <strong>2016</strong>.<br />
Williams-Grut, O. <strong>2016</strong>. “3 of the World’s 10 Largest<br />
Employers Are Now Replacing Their Workers with Robots.”<br />
Business Insider, 9 June. www.businessinsider.com/<br />
clsa-wef-and-citi-on-the-future-of-robots-and-ai-in-theworkforce-<strong>2016</strong>-6?r=UK&IR=T.<br />
Accessed 7 November <strong>2016</strong>.<br />
Wimmer, A. 2012. Waves of War: Nationalism, State<br />
Formation, and Ethnic Exclusion in the Modern World.<br />
Cambridge Studies in Comparative Politics Series. New<br />
York: Cambridge University Press.<br />
Witton, B. <strong>2016</strong>. “How Immigration is Fuelling Sweden’s<br />
Economic Boom.” Independent, 5 October. www.<br />
independent.co.uk/news/world/europe/swedenimmigration-economic-boom-theresa-may-refugee-crisistory-conference-a7347136.html.<br />
Accessed 10 November<br />
<strong>2016</strong>.<br />
Woosey, B. 2005. “The Effect the Eight Million Illiterate<br />
Adults on the UK.” Where I Live Northhamptonshire,<br />
2 November. BBC Northamptonshire, Northampton,<br />
UK. www.bbc.co.uk/northamptonshire/content/<br />
articles/2005/02/11/becky_woosey_the_effect_the_<br />
eight_million_illiterate_adults_on_the_uk_feature.shtml.<br />
Accessed 26 October <strong>2016</strong>.<br />
World Bank. 2006. “Fiscal Policy for Growth and<br />
<strong>Development</strong>: An Interim <strong>Report</strong>.” <strong>Report</strong> DC2006-0003.<br />
Washington, DC. http://siteresources.worldbank.org/<br />
DEVCOMMINT/Documentation/20890698/DC2006-<br />
0003(E)-FiscalPolicy.pdf. Accessed 7 November <strong>2016</strong>.<br />
———. 2007. World <strong>Development</strong> Indicators 2007.<br />
Washington, DC.<br />
———. 2011a. “Water Supply and Sanitation in Burkina<br />
Faso: Turning Finance into Services for 2015 and Beyond.”<br />
AMCOW Country Status Overview, <strong>Report</strong> 74207, Water<br />
and Sanitation Program, Nairobi. https:// openknowledge.<br />
worldbank.org/handle/10986/17756. Accessed 7<br />
November <strong>2016</strong>.<br />
———. 2011b. “World Bank Open Data.” Washington DC.<br />
http://data.worldbank.org. Accessed 26 September <strong>2016</strong>.<br />
———. 2013. “The International Income Distribution Data<br />
Set (I2D2).” Washington, DC.<br />
———. 2014. Voice and Agency: Empowering Women and<br />
Girls for Shared Prosperity. Washington, DC.<br />
References | 187
———. 2015a. “5 Ways to Reduce the Drivers of Climate<br />
Change.” Washington, DC. www.worldbank.org/en/news/<br />
feature/2015/03/18/5-ways-reduce-drivers-climatechange?cid=CCG_TTccgEN_D_EXT.<br />
Accessed 7 November<br />
<strong>2016</strong>.<br />
———. 2015b. “Boosting the Health of Toddlers’ Bodies<br />
and Brains Brings Multiple Benefits: But Too Often the<br />
Wrong Methods Are Used.” Washington, DC. www.<br />
worldbank.org/en/topic/earlychildhooddevelopment/<br />
overview. Accessed 7 November <strong>2016</strong>.<br />
———. 2015c. “Dominican Republic: Integrated Social<br />
Protection and Promotion Project.” <strong>Report</strong> PAD1070.<br />
Washington, DC.<br />
———. 2015d. Ending Poverty and Hunger by 2030:<br />
An Agenda for the Global Food System. Washington,<br />
DC. http://documents.worldbank.org/curated/<br />
en/700061468334490682/pdf/95768-REVISED-WP-<br />
PUBLIC-Box391467B-Ending-Poverty-and-Hunger-by-2030-<br />
FINAL.pdf. Accessed 26 October <strong>2016</strong>.<br />
———. 2015e. “Overview.” 22 December. Washington, DC.<br />
www.worldbank.org/en/topic/earlychildhooddevelopment/<br />
overview. Accessed 7 November <strong>2016</strong>.<br />
———. 2015f. “Philippines: CCT Proven to Keep Poor<br />
Children Healthy and in School.” Press release, 23<br />
September. Washington, DC. www.worldbank.org/en/<br />
news/press-release/2015/09/23/philippines-cct-provento-keep-poor-children-healthy-and-in-school.<br />
Accessed 7<br />
November <strong>2016</strong>.<br />
———. 2015g. “Urban <strong>Development</strong>: Overview.” 10<br />
October. Washington, DC. www.worldbank.org/en/topic/<br />
urbandevelopment/overview. Accessed 11 October <strong>2016</strong>.<br />
———. 2015h. Women, Business and the Law <strong>2016</strong>:<br />
Getting to Equal. Washington, DC. http://wbl.worldbank.<br />
org/~/media/WBG/WBL/Documents/<strong>Report</strong>s/<strong>2016</strong>/<br />
Women-Business-and-the-Law-<strong>2016</strong>.pdf. Accessed 14<br />
October <strong>2016</strong>.<br />
———. 2015i. World <strong>Development</strong> <strong>Report</strong> 2015: Mind,<br />
Society, and Behavior. Washington, DC.<br />
———. <strong>2016</strong>a. “Climate-Driven Water Scarcity Could Hit<br />
Economic Growth by Up to 6 Percent in Some Regions,<br />
Says World Bank.” Press release, 3 May. www.worldbank.<br />
org/en/news/press-release/<strong>2016</strong>/05/03/climate-driven-<br />
water-scarcity-could-hit-economic-growth-by-up-to-<br />
6-percent-in-some-regions-says-world-bank. Accessed 14<br />
October <strong>2016</strong>.<br />
———. <strong>2016</strong>b. “Drug-Resistant Infections: A Threat to Our<br />
Economic Future.” Discussion Draft. Washington, DC.<br />
http://pubdocs.worldbank.org/en/527731474225046104/<br />
AMR-Discussion-Draft-Sept18updated.pdf. Accessed 14<br />
October <strong>2016</strong>.<br />
———. <strong>2016</strong>c. “The Economic Effects of War and<br />
Peace.” MENA Quarterly Economic Brief 6. Washington,<br />
DC. http://documents.worldbank.org/curated/<br />
en/644191468191061975/pdf/103013-REPLACEMENT-<br />
PUBLIC-MENA-QEB-ISSUE-6-JANUARY-<strong>2016</strong>.pdf.<br />
Accessed 14 October <strong>2016</strong>.<br />
———. <strong>2016</strong>d. “Eight Stubborn Facts about Housing<br />
Policies.” Washington, DC. http://blogs.worldbank.org/<br />
sustainablecities/eight-stubborn-facts-about-housingpolicies.<br />
Accessed 11 October <strong>2016</strong>.<br />
———. <strong>2016</strong>e. “High-Technology Exports (Current US$).”<br />
Washington, DC. http://data.worldbank.org/indicator/<br />
TX.VAL.TECH.CD. Accessed 4 December <strong>2016</strong>.<br />
———. <strong>2016</strong>f. “I4D, Identification for <strong>Development</strong>:<br />
Strategic Framework.” 25 January. Washington, DC.<br />
http://pubdocs.worldbank.org/en/21571460567481655/<br />
April-<strong>2016</strong>-ID4D-Strategic-RoadmapID4D.pdf. Accessed 7<br />
November <strong>2016</strong>.<br />
———. <strong>2016</strong>g. “Living Standards Measurement Study.”<br />
Washington, DC. http://go.worldbank.org/IPLXWMCNJ0.<br />
Accessed 7 November <strong>2016</strong>.<br />
———. <strong>2016</strong>h. “Personal Remittances, Received (% of<br />
GDP).” http://data.worldbank.org/indicator/BX.TRF.PWKR.<br />
DT.GD.ZS. Accessed 2 November <strong>2016</strong>.<br />
———. <strong>2016</strong>i. Poverty and Shared Prosperity <strong>2016</strong>: Taking<br />
on Inequality. Washington, DC. www.worldbank.org/en/<br />
publication/poverty-and-shared-prosperity. Accessed 22<br />
November <strong>2016</strong>.<br />
———. <strong>2016</strong>j. “Pricing Carbon.” Washington, DC. www.<br />
worldbank.org/en/programs/pricing-carbon. Accessed 7<br />
November <strong>2016</strong>.<br />
———. <strong>2016</strong>k. “Remittances to Developing Countries<br />
Edge Up Slightly in 2015.” Press release, 13 April.<br />
Washington, DC. www.worldbank.org/en/news/pressrelease/<strong>2016</strong>/04/13/remittances-to-developing-countriesedge-up-slightly-in-2015.<br />
Accessed 7 November <strong>2016</strong>.<br />
———. <strong>2016</strong>l. “Urban Violence: A Challenge of Epidemic<br />
Proportions.” 6 September. Washington, DC. www.<br />
worldbank.org/en/news/feature/<strong>2016</strong>/09/06/urbanviolence-a-challenge-of-epidemic-proportions.<br />
Accessed<br />
11 October <strong>2016</strong>.<br />
———. <strong>2016</strong>m. “World Bank Group Finances Top 8<br />
Countries Voting Power.” Washington, DC. https://<br />
finances.worldbank.org/Shareholder-Equity/Top-8-<br />
countries-voting-power/udm3-vzz9/data. Accessed 5<br />
December <strong>2016</strong>.<br />
———. <strong>2016</strong>n. “World Bank Group: Forest Action Plan<br />
FY16–20.” Washington, DC. http://documents.worldbank.<br />
org/curated/en/240231467291388831/pdf/106467-<br />
REVISED-v1-PUBLIC.pdf. Accessed 23 August <strong>2016</strong>.<br />
———. <strong>2016</strong>o. World <strong>Development</strong> Indicators database.<br />
Washington, DC. http://data.worldbank.org. Accessed<br />
14 October <strong>2016</strong>.<br />
———. <strong>2016</strong>p. World <strong>Development</strong> <strong>Report</strong>: Digital<br />
Dividends. Washington, DC. www.worldbank.org/en/<br />
publication/wdr<strong>2016</strong>. Accessed 22 November <strong>2016</strong>.<br />
———. 2017. PovcalNet [online database]. http:// iresearch.<br />
worldbank.org/PovcalNet/povDuplicateWB.aspx.<br />
Accessed 5 December <strong>2016</strong>.<br />
World Bank and ECOFYS. <strong>2016</strong>. “Carbon Pricing Watch<br />
<strong>2016</strong>.” Washington, DC. https://openknowledge.<br />
worldbank.org/handle/10986/24288. Accessed 26 August<br />
<strong>2016</strong>.<br />
World Bank and IHME (Institute for Health Metrics<br />
and Evaluation). <strong>2016</strong>. “The Cost of Air Pollution:<br />
Strengthening the Economic Case for Action.”<br />
Washington, DC. https://openknowledge. worldbank.<br />
org/bitstream/handle/10986/25013/108141.<br />
pdf?sequence=4&isAllowed=y. Accessed 20 October <strong>2016</strong>.<br />
World Resources Institute. <strong>2016</strong>. “The Roads to<br />
Decoupling: 21 Countries Are Reducing Carbon Emissions<br />
While Growing GDP.” www.wri.org/blog/<strong>2016</strong>/04/roadsdecoupling-21-countries-are-reducing-carbon-emissionswhile-growing-gdp.<br />
Accessed 26 September <strong>2016</strong>.<br />
WVSA (World Values Survey Association). <strong>2016</strong>.<br />
“Data and Documentation.” Institute for Comparative<br />
Survey Research, Vienna. www.worldvaluessurvey.org/<br />
WVSContents.jsp. Accessed 2 November <strong>2016</strong>.<br />
WWF-Korea. <strong>2016</strong>. Korea Ecological Footprint <strong>Report</strong> <strong>2016</strong>:<br />
Measuring Korea’s Impact on Nature. Seoul.<br />
Yi, I. 2012. “Economic and Social <strong>Development</strong> in the<br />
Republic of Korea: Processes, Institutions and Actors.”<br />
Research and Policy Brief 14. United Nations Research<br />
Institute for Social <strong>Development</strong>, Geneva.<br />
———. 2014. “How Could the Enhancement of Education<br />
and Health Contribute to Economic Growth in South<br />
Korea?” In I. Yi and T. Mkandawire, eds., Learning from<br />
the South Korean <strong>Development</strong>al Success: Effective<br />
<strong>Development</strong>al Cooperation and Synergistic Institutions<br />
and Policies. London: Palgrave Macmillan UK.<br />
Yi, I., C. Olive, H. Rhee and Y.-A. Chung. 2011. “The<br />
Korean Experience within the Context of <strong>Development</strong><br />
Cooperation Effectiveness.” Presentation at the 5th Seoul<br />
ODA International Conference, 13 Ocotober, Seoul.<br />
Yi, l., O. Cocoman, Y.-A. Chung and H. Rhee. 2014.<br />
“Effective Aid and <strong>Development</strong> Cooperation in South<br />
Korea.” In I. Yi and T. Mkandawire, eds., Learning from<br />
the South Korean <strong>Development</strong>al Success: Effective<br />
<strong>Development</strong> Cooperation and Synergistic Institutions and<br />
Policies. London: Palgrave Macmillan UK.<br />
Zimmer, C. <strong>2016</strong>. “Ebola Evolved Into Deadlier Enemy during<br />
the African Epidemic.” New York Times, 3 November.<br />
www.nytimes.com/<strong>2016</strong>/11/04/science/ebola-evolutionafrican-epidemic.html.<br />
Accessed 7 November <strong>2016</strong>.<br />
Zucman, G. 2015. The Hidden Wealth of Nations: The Scourge<br />
of Tax Havens. Chicago, IL: University of Chicago Press.<br />
188 | HUMAN DEVELOPMENT REPORT <strong>2016</strong>
<strong>Human</strong> <strong>Development</strong> <strong>Report</strong>s 1990–<strong>2016</strong><br />
1990 Concept and Measurement of <strong>Human</strong> <strong>Development</strong><br />
1991 Financing <strong>Human</strong> <strong>Development</strong><br />
1992 Global Dimensions of <strong>Human</strong> <strong>Development</strong><br />
1993 People’s Participation<br />
1994 New Dimensions of <strong>Human</strong> Security<br />
1995 Gender and <strong>Human</strong> <strong>Development</strong><br />
1996 Economic Growth and <strong>Human</strong> <strong>Development</strong><br />
1997 <strong>Human</strong> <strong>Development</strong> to Eradicate Poverty<br />
1998 Consumption for <strong>Human</strong> <strong>Development</strong><br />
1999 Globalization with a <strong>Human</strong> Face<br />
2000 <strong>Human</strong> Rights and <strong>Human</strong> <strong>Development</strong><br />
2001 Making New Technologies Work for <strong>Human</strong> <strong>Development</strong><br />
2002 Deepening Democracy in a Fragmented World<br />
2003 Millennium <strong>Development</strong> Goals: A Compact among Nations to End <strong>Human</strong> Poverty<br />
2004 Cultural Liberty in Today’s Diverse World<br />
2005 International Cooperation at a Crossroads: Aid, Trade and Security in an Unequal World<br />
2006 Beyond Scarcity: Power, Poverty and the Global Water Crisis<br />
2007/2008 Fighting Climate Change: <strong>Human</strong> Solidarity in a Divided World<br />
2009 Overcoming Barriers: <strong>Human</strong> Mobility and <strong>Development</strong><br />
2010 The Real Wealth of Nations: Pathways to <strong>Human</strong> <strong>Development</strong><br />
2011 Sustainability and Equity: A Better Future for All<br />
2013 The Rise of the South: <strong>Human</strong> Progress in a Diverse World<br />
2014 Sustaining <strong>Human</strong> Progress: Reducing Vulnerability and Building Resilience<br />
2015 Work for <strong>Human</strong> <strong>Development</strong><br />
<strong>2016</strong> <strong>Human</strong> <strong>Development</strong> for Everyone
HUMAN DEVELOPMENT REPORT <strong>2016</strong><br />
<strong>Human</strong> <strong>Development</strong> for Everyone<br />
Statistical annex<br />
Readers guide 193<br />
Statistical tables<br />
<strong>Human</strong> development composite indices<br />
1 <strong>Human</strong> <strong>Development</strong> Index and its components 198<br />
2 <strong>Human</strong> <strong>Development</strong> Index trends, 1990–2015 202<br />
3 Inequality-adjusted <strong>Human</strong> <strong>Development</strong> Index 206<br />
4 Gender <strong>Development</strong> Index 210<br />
5 Gender Inequality Index 214<br />
6 Multidimensional Poverty Index: developing countries 218<br />
<strong>Human</strong> development indicators<br />
7 Population trends 222<br />
8 Health outcomes 226<br />
9 Education achievements 230<br />
10 National income and composition of resources 234<br />
11 Work and employment 238<br />
12 <strong>Human</strong> security 242<br />
13 International integration 246<br />
14 Supplementary indicators: perceptions of well-being 250<br />
15 Status of fundamental human rights treaties 254<br />
<strong>Human</strong> development dashboards<br />
1 Life-course gender gap 259<br />
2 Sustainable development 264<br />
Regions 269<br />
Statistical references 270<br />
Statistical annex | 191
Readers guide<br />
The 17 statistical tables in this annex provide an overview of<br />
key aspects of human development. The first six tables contain<br />
the family of composite human development indices and their<br />
components estimated by the <strong>Human</strong> <strong>Development</strong> <strong>Report</strong><br />
Office (HDRO). The remaining tables present a broader set of<br />
indicators related to human development. The two dashboards<br />
introduce partial groupings of countries according to their<br />
performance on each indicator.<br />
Unless otherwise noted, tables use data available to the<br />
HDRO as of 1 September <strong>2016</strong>. All indices and indicators,<br />
along with technical notes on the calculation of composite indices<br />
and additional source information, are available at http://<br />
hdr.undp.org/en/data.<br />
Countries and territories are ranked by 2015 <strong>Human</strong> <strong>Development</strong><br />
Index (HDI) value. Robustness and reliability analysis<br />
has shown that for most countries differences in HDI are not<br />
statistically significant at the fourth decimal place. For this reason<br />
countries with the same HDI value at three decimal places<br />
are listed with tied ranks.<br />
Sources and definitions<br />
Unless otherwise noted, the HDRO uses data from international<br />
data agencies with the mandate, resources and expertise<br />
to collect national data on specific indicators.<br />
Definitions of indicators and sources for original data components<br />
are given at the end of each table, with full source<br />
details in Statistical references.<br />
Methodology updates<br />
The <strong>2016</strong> <strong>Report</strong> retains all the composite indices from<br />
the family of human development indices — the HDI, the<br />
Inequality- adjusted <strong>Human</strong> <strong>Development</strong> Index (IHDI), the<br />
Gender <strong>Development</strong> Index (GDI), the Gender Inequality<br />
Index (GII) and the Multidimensional Poverty Index (MPI).<br />
The methodology used to compute these indices is the same<br />
as the one used in the 2015 <strong>Report</strong>. See Technical notes 1–5<br />
at http://hdr.undp.org/sites/default/files/hdr<strong>2016</strong>_technical_notes.pdf<br />
for details.<br />
New in this year’s <strong>Report</strong> are two colour-coded dashboard<br />
tables, Life-course gender gap and Sustainable development. The<br />
dashboards introduce partial grouping of countries by their<br />
performance on each indicator.<br />
Comparisons over time and across editions<br />
of the <strong>Report</strong><br />
Because national and international agencies continually<br />
improve their data series, the data — including the HDI values<br />
and ranks — presented in this <strong>Report</strong> are not comparable to<br />
those published in earlier editions. For HDI comparability<br />
across years and countries see table 2, which presents trends<br />
using consistent data.<br />
Discrepancies between national and<br />
international estimates<br />
National and international data can differ because international<br />
agencies harmonize national data using a consistent<br />
methodology and occasionally produce estimates of missing<br />
data to allow comparability across countries. In other cases<br />
international agencies might not have access to the most recent<br />
national data. When HDRO becomes aware of discrepancies,<br />
it brings them to the attention of national and international<br />
data authorities.<br />
Country groupings and aggregates<br />
The tables present weighted aggregates for several country<br />
groupings. In general, an aggregate is shown only when data<br />
are available for at least half the countries and represent at least<br />
two-thirds of the population in that classification. Aggregates<br />
for each classification cover only the countries for which data<br />
are available.<br />
<strong>Human</strong> development classification<br />
HDI classifications are based on HDI fixed cutoff points,<br />
which are derived from the quartiles of distributions of the<br />
component indicators. The cutoff points are HDI of less than<br />
0.550 for low human development, 0.550–0.699 for medium<br />
human development, 0.700–0.799 for high human development<br />
and 0.800 or greater for very high human development.<br />
Regional groupings<br />
Regional groupings are based on United Nations <strong>Development</strong><br />
Programme regional classifications. Least developed countries<br />
and small island developing states are defined according to UN<br />
classifications (see www.unohrlls.org).<br />
Readers guide | 193
Developing countries<br />
Aggregates are provided for the group of all countries classified<br />
as developing countries, grouped by region.<br />
Organisation for Economic Co-operation and<br />
<strong>Development</strong><br />
Of the 35 OECD members, 32 are considered developed and 3<br />
developing (Chile, Mexico and Turkey). Aggregates refer to all<br />
countries from the group for which data are available.<br />
Country note<br />
Data for China do not include Hong Kong Special Administrative<br />
Region of China, Macao Special Administrative Region of<br />
China or Taiwan Province of China.<br />
Symbols<br />
A dash between two years, as in 2005–2014, indicates that the<br />
data are from the most recent year available during the period<br />
specified. A slash between years, as in 2005/2014, indicates<br />
that data are the average for the years shown. Growth rates are<br />
usually average annual rates of growth between the first and last<br />
years of the period shown.<br />
The following symbols are used in the tables:<br />
.. Not available<br />
0 or 0.0 Nil or negligible<br />
— Not applicable<br />
Statistical acknowledgements<br />
The <strong>Report</strong>’s composite indices and other statistical resources<br />
draw on a wide variety of the most respected international<br />
data providers in their specialized fields. HDRO is particularly<br />
grateful to the Centre for Research on the Epidemiology of<br />
Disasters; Economic Commission for Latin America and the<br />
Caribbean; Eurostat; Food and Agriculture Organization;<br />
Gallup; ICF Macro; Institute for Criminal Policy Research;<br />
Internal Displacement Monitoring Centre; International<br />
Labour Organization; International Monetary Fund; International<br />
Telecommunication Union; International Union<br />
for the Conservation of Nature; Inter-Parliamentary Union;<br />
Luxembourg Income Study; Office of the United Nations<br />
High Commissioner for <strong>Human</strong> Rights; Office of the United<br />
Nations High Commissioner for Refugees; Organisation for<br />
Economic Co- operation and <strong>Development</strong>; Socio-Economic<br />
Database for Latin America and the Caribbean; Syrian Center<br />
for Policy Research; United Nations Children’s Fund; United<br />
Nations Conference on Trade and <strong>Development</strong>; United<br />
Nations Department of Economic and Social Affairs; United<br />
Nations Economic and Social Commission for West Asia;<br />
United Nations Educational, Scientific and Cultural Organization<br />
Institute for Statistics; United Nations Entity for<br />
Gender Equality and the Empowerment of Women; United<br />
Nations Office on Drugs and Crime; United Nations Relief<br />
and Works Agency for Palestine Refugees in the Near East;<br />
United Nations World Tourism Organization; World Bank;<br />
and World Health Organization. The international education<br />
database maintained by Robert Barro (Harvard University)<br />
and Jong-Wha Lee (Korea University) was another invaluable<br />
source for the calculation of the <strong>Report</strong>’s indices.<br />
Statistical tables<br />
The first six tables relate to the five composite human development<br />
indices and their components.<br />
Since the 2010 <strong>Human</strong> <strong>Development</strong> <strong>Report</strong>, four composite<br />
human development indices — the HDI, the IHDI, the GII and<br />
the MPI for developing countries — have been calculated. The<br />
2014 <strong>Report</strong> introduced the GDI, which compares the HDI<br />
calculated separately for women and men.<br />
The remaining tables present a broader set of human development<br />
indicators and provide a more comprehensive picture of a<br />
country’s human development.<br />
Table 1, <strong>Human</strong> <strong>Development</strong> Index and its components,<br />
ranks countries by 2015 HDI value and details the values of<br />
the three HDI components: longevity, education (with two<br />
indicators) and income. The table also presents the difference<br />
in rankings by HDI and gross national income per capita, as<br />
well as the ranking on the 2014 HDI, calculated using the most<br />
recently revised historical data available in <strong>2016</strong>.<br />
Table 2, <strong>Human</strong> <strong>Development</strong> Index trends, 1990–2015,<br />
provides a time series of HDI values allowing 2015 HDI values<br />
to be compared with those for previous years. The table uses<br />
the most recently revised historical data available in <strong>2016</strong> and<br />
the same methodology applied to compute 2015 HDI values.<br />
The table also includes the change in HDI rank over the last<br />
five years and the average annual HDI growth rate across<br />
four time intervals: 1990–2000, 2000–2010, 2010–2015 and<br />
1990–2015.<br />
Table 3, Inequality-adjusted <strong>Human</strong> <strong>Development</strong> Index,<br />
contains two related measures of inequality — the IHDI and<br />
the loss in HDI due to inequality. The IHDI looks beyond the<br />
average achievements of a country in longevity, education and<br />
income to show how these achievements are distributed among<br />
its residents. An IHDI value can be interpreted as the level of<br />
human development when inequality is accounted for. The relative<br />
difference between IHDI and HDI values is the loss due to<br />
inequality in distribution of the HDI within the country. The<br />
table also presents the coefficient of human inequality, which<br />
194 | HUMAN DEVELOPMENT REPORT <strong>2016</strong>
HUMAN DEVELOPMENT REPORT <strong>2016</strong><br />
<strong>Human</strong> <strong>Development</strong> for Everyone<br />
is an unweighted average of inequalities in three dimensions.<br />
In addition, the table shows each country’s difference in rank<br />
on the HDI and the IHDI. A negative value means that taking<br />
inequality into account lowers a country’s rank on the HDI.<br />
The table also presents three standard measures of income<br />
inequality: the ratio of the top and the bottom quintiles; the<br />
Palma ratio, which is the ratio of income of the top 10 percent<br />
and the bottom 40 percent; and the Gini coefficient.<br />
Table 4, Gender <strong>Development</strong> Index, measures disparities<br />
on the HDI by gender. The table contains HDI values estimated<br />
separately for women and men; the ratio of which is the GDI<br />
value. The closer the ratio is to 1, the smaller the gap between<br />
women and men. Values for the three HDI components —<br />
longevity, education (with two indicators) and income — are<br />
also presented by gender. The table includes five country groupings<br />
by absolute deviation from gender parity in HDI values.<br />
Table 5, Gender Inequality Index, presents a composite<br />
measure of gender inequality using three dimensions: reproductive<br />
health, empowerment and the labour market. Reproductive<br />
health is measured by two indicators: the maternal mortality<br />
ratio and the adolescent birth rate. Empowerment is measured<br />
by the share of parliamentary seats held by women and the<br />
shares of population with at least some secondary education by<br />
gender. And labour market is measured by participation in the<br />
labour force by gender. A low GII value indicates low inequality<br />
between women and men, and vice-versa.<br />
Table 6, Multidimensional Poverty Index: developing<br />
countries, captures the multiple deprivations that people in<br />
developing countries face in their education, health and living<br />
standards. The MPI shows both the incidence of nonincome<br />
multidimensional poverty (a headcount of those in multidimensional<br />
poverty) and its intensity (the average deprivation<br />
score experienced by poor people). Based on deprivation score<br />
thresholds, people are classified as multidimensionally poor,<br />
near multidimensional poverty or in severe poverty. The contributions<br />
of deprivations in each dimension to overall poverty<br />
are also presented. In addition, the table provides measures of<br />
income poverty —population living below the national poverty<br />
line and population living on less than PPP $1.90 per day. MPI<br />
estimations for this year use the revised methodology introduced<br />
in the 2014 <strong>Report</strong>, which modified the original set of<br />
10 indicators in several ways. Height-for-age replaced weightfor-age<br />
for children under age 5 because stunting is a better<br />
indicator of chronic malnutrition. A child death is considered<br />
a health deprivation only if it happened in the five years prior<br />
to the survey. The minimum threshold for education deprivation<br />
was raised from five years of schooling to six to reflect the<br />
standard definition of primary schooling used in the Millennium<br />
<strong>Development</strong> Goals and in international measures of functional<br />
literacy. And the indicators for household assets were<br />
expanded to better reflect rural as well as urban households.<br />
Table 7, Population trends, contains major population<br />
indicators, including total population, median age, dependency<br />
ratios and total fertility rates, which can help assess the burden<br />
of support that falls on the labour force in a country.<br />
Table 8, Health outcomes, presents indicators of infant<br />
health (percentage of infants who are exclusively breastfed<br />
for the first six months of life, percentage of infants who lack<br />
immunization for DTP and measles, and infant mortality rate)<br />
and of child health (under-five mortality rate and percentage of<br />
children under age 5 whose height is stunted). The table also<br />
contains indicators of adult health (adult mortality rates by<br />
gender, mortality rates due to malaria and tuberculosis, HIV<br />
prevalence rates and life expectancy at age 60). Two indicators<br />
of quality of health care are also included: number of physicians<br />
per 10,000 people and public health expenditure as a share of<br />
GDP.<br />
Table 9, Education achievements, presents standard education<br />
indicators along with indicators on education quality.<br />
The table provides indicators of educational attainment — adult<br />
and youth literacy rates and the share of the adult population<br />
with at least some secondary education. Gross enrolment ratios<br />
at each level of education are complemented by primary school<br />
dropout rates. The table also includes two indicators of education<br />
quality — primary school teachers trained to teach and<br />
the pupil–teacher ratio — as well as government expenditure on<br />
education as a percentage of GDP.<br />
Table 10, National income and composition of resources,<br />
covers several macroeconomic indicators such as gross<br />
domestic product (GDP), gross fixed capital formation, and<br />
taxes on income, profit and capital gain as percentage of total<br />
tax revenue. Gross fixed capital formation is a rough indicator<br />
of national income that is invested rather than consumed. In<br />
times of economic uncertainty or recession, gross fixed capital<br />
formation typically declines. General government final consumption<br />
expenditure (presented as a share of GDP and as<br />
average annual growth) is an indicator of public spending. In<br />
addition, the table presents two indicators of debt — domestic<br />
credit provided by the financial sector and total debt service,<br />
both measured as a percentage of GDP or GNI. The consumer<br />
price index is a measure of inflation; two indicators related to<br />
the price of food are also presented — the price level index and<br />
the price volatility index.<br />
Table 11, Work and employment, presents indicators on two<br />
components: employment and unemployment. Two key indicators<br />
related to employment are the employment to population<br />
ratio and labour force participation rate. The table also reports<br />
employment in agriculture and in services and indicators related<br />
to vulnerable employment and different forms of unemployment.<br />
The table brings together indicators on child labour and the<br />
working poor. Two indicators — paid maternity leave and old-age<br />
pensions — reflect security stemming from employment.<br />
Table 12, <strong>Human</strong> security, reflects the extent to which<br />
the population is secure. The table begins with indicators of<br />
birth registration, refugees by country of origin and internally<br />
displaced persons. It then shows the size of the homeless<br />
Readers guide | 195
population due to natural disasters, the population of orphaned<br />
children and the prison population. Also provided are indicators<br />
of homicide and suicide (by gender), violence against<br />
women and the depth of food deficit.<br />
Table 13, International integration, provides indicators of<br />
several aspects of globalization. International trade is captured<br />
by measuring exports and imports as a share of GDP. Financial<br />
flows are represented by net inflows of foreign direct investment<br />
and flows of private capital, net official development assistance<br />
and inflows of remittances. <strong>Human</strong> mobility is captured by the<br />
net migration rate, the stock of immigrants, the net number of<br />
tertiary students from abroad (expressed as a percentage of total<br />
tertiary enrolment in that country) and the number of international<br />
inbound tourists. International communication is represented<br />
by the share of the population that uses the Internet,<br />
the number of mobile phone subscriptions per 100 people and<br />
the percentage change in mobile phone subscriptions between<br />
2010 and 2015.<br />
Table 14, Supplementary indicators: perceptions of<br />
well-being, includes indicators that reflect individuals’ perceptions<br />
of relevant dimensions of human development —education<br />
quality, health care quality, standard of living and labour<br />
market, personal safety and overall satisfaction with freedom<br />
of choice and life. The table also presents indicators reflecting<br />
perceptions about community and government.<br />
Table 15, Status of fundamental human rights treaties,<br />
shows when the key human rights conventions were ratified by<br />
countries. The 11 selected conventions cover civil and political<br />
rights; social, economic, and cultural rights; and rights and<br />
freedoms related to elimination of all forms of racial and gender<br />
discrimination and violence, protection of children’s rights,<br />
rights of migrant workers and persons with disabilities. They<br />
also cover torture and other cruel, inhuman and degrading<br />
treatment as well as protection from enforced disappearance.<br />
Dashboard 1, Life-course gender gap, contains a selection<br />
of indicators that indicate gender gaps over the life course —<br />
childhood and youth, adulthood and older age. The indicators<br />
refer to health, education, labour market and work, leadership,<br />
seats in parliament and social protection. Some indicators<br />
are presented only for women, and others are presented as a<br />
ratio of female to male values. Three-colour coding visualizes<br />
partial grouping of countries by indicator. For each indicator<br />
countries are divided into three groups of approximately<br />
equal size (terciles) — the top third, the middle third and the<br />
bottom third. Sex ratio at birth is an exception — countries are<br />
divided into two groups: the natural group (countries with a value<br />
between 1.04–1.07, inclusive) and the gender-biased group (all<br />
other countries). Deviations from the natural sex ratio at birth<br />
have implications for population replacement levels, suggest<br />
possible future social and economic problems and may indicate<br />
gender bias. Countries with values of a parity index concentrated<br />
around 1 form the group with the best achievements<br />
in that indicator. Deviations from parity are treated equally<br />
regardless of which gender is overachieving. The intention is<br />
not to suggest thresholds or target values for these indicators.<br />
See Technical note 6 at http://hdr.undp.org/sites/default/files/<br />
hdr<strong>2016</strong>_ technical_notes.pdf for details about partial grouping<br />
in the table.<br />
Dashboard 2, Sustainable development, contains a<br />
selection of indicators that cover environmental, economic<br />
and social sustainable development. A mix of level and<br />
change indicators is related to renewable energy consumption,<br />
carbon-dioxide emissions, forest areas and fresh water withdrawals.<br />
Economic sustainability indicators look at natural<br />
resource depletion, national savings, external debt stock, government<br />
spending on research and development, and diversity<br />
of economy. Social sustainability is captured by changes in<br />
income and gender inequality and by the old-age dependency<br />
ratio. Three-colour coding visualizes a partial grouping of<br />
countries by indicator. For each indicator countries are divided<br />
into three groups of approximately equal sizes (terciles) : the top<br />
third, the middle third and the bottom third. The intention is<br />
not to suggest thresholds or target values for these indicators.<br />
See Technical note 7 at http://hdr.undp.org/sites/default/files/<br />
hdr<strong>2016</strong>_ technical_notes.pdf for more details about partial<br />
grouping in the table.<br />
196 | HUMAN DEVELOPMENT REPORT <strong>2016</strong>
<strong>Human</strong> development<br />
composite indices
TABLE<br />
1<br />
<strong>Human</strong> <strong>Development</strong> Index and its components<br />
TABLE<br />
1<br />
<strong>Human</strong> <strong>Development</strong><br />
Index (HDI)<br />
Life expectancy<br />
at birth<br />
Expected years<br />
of schooling<br />
Mean years<br />
of schooling<br />
Gross national income<br />
(GNI) per capita<br />
Value (years) (years) (years) (2011 PPP $)<br />
GNI per capita rank<br />
minus HDI rank<br />
HDI rank 2015 2015 2015 a 2015 a 2015 2015 2014<br />
VERY HIGH HUMAN DEVELOPMENT<br />
1 Norway 0.949 81.7 17.7 12.7 67,614 5 1<br />
2 Australia 0.939 82.5 20.4 b 13.2 42,822 19 3<br />
2 Switzerland 0.939 83.1 16.0 13.4 56,364 7 2<br />
4 Germany 0.926 81.1 17.1 13.2 c 45,000 13 4<br />
5 Denmark 0.925 80.4 19.2 b 12.7 44,519 13 6<br />
5 Singapore 0.925 83.2 15.4 d 11.6 78,162 e –3 4<br />
7 Netherlands 0.924 81.7 18.1 b 11.9 46,326 8 6<br />
8 Ireland 0.923 81.1 18.6 b 12.3 43,798 11 8<br />
9 Iceland 0.921 82.7 19.0 b 12.2 c 37,065 20 9<br />
10 Canada 0.920 82.2 16.3 13.1 f 42,582 12 9<br />
10 United States 0.920 79.2 16.5 13.2 53,245 1 11<br />
12 Hong Kong, China (SAR) 0.917 84.2 15.7 11.6 54,265 –2 12<br />
13 New Zealand 0.915 82.0 19.2 b 12.5 32,870 20 13<br />
14 Sweden 0.913 82.3 16.1 12.3 46,251 2 15<br />
15 Liechtenstein 0.912 80.2 g 14.6 12.4 h 75,065 e,i –11 14<br />
16 United Kingdom 0.909 80.8 16.3 13.3 37,931 10 16<br />
17 Japan 0.903 83.7 15.3 12.5 c 37,268 10 17<br />
18 Korea (Republic of) 0.901 82.1 16.6 12.2 34,541 12 18<br />
19 Israel 0.899 82.6 16.0 12.8 31,215 16 19<br />
20 Luxembourg 0.898 81.9 13.9 12.0 62,471 –12 20<br />
21 France 0.897 82.4 16.3 11.6 38,085 4 22<br />
22 Belgium 0.896 81.0 16.6 11.4 41,243 1 21<br />
23 Finland 0.895 81.0 17.0 11.2 f 38,868 1 23<br />
24 Austria 0.893 81.6 15.9 11.3 c 43,609 –4 24<br />
25 Slovenia 0.890 80.6 17.3 12.1 28,664 13 25<br />
26 Italy 0.887 83.3 16.3 10.9 33,573 6 27<br />
27 Spain 0.884 82.8 17.7 9.8 32,779 7 26<br />
28 Czech Republic 0.878 78.8 16.8 12.3 28,144 11 28<br />
29 Greece 0.866 81.1 17.2 10.5 24,808 16 29<br />
30 Brunei Darussalam 0.865 79.0 14.9 9.0 f 72,843 –25 30<br />
30 Estonia 0.865 77.0 16.5 12.5 c 26,362 12 31<br />
32 Andorra 0.858 81.5 g 13.5 d 10.3 47,979 j –18 32<br />
33 Cyprus 0.856 80.3 14.3 11.7 29,459 4 34<br />
33 Malta 0.856 80.7 14.6 11.3 29,500 3 35<br />
33 Qatar 0.856 78.3 13.4 9.8 129,916 e –32 33<br />
36 Poland 0.855 77.6 16.4 11.9 24,117 11 36<br />
37 Lithuania 0.848 73.5 16.5 12.7 26,006 7 37<br />
38 Chile 0.847 82.0 16.3 9.9 21,665 16 38<br />
38 Saudi Arabia 0.847 74.4 16.1 9.6 51,320 –26 38<br />
40 Slovakia 0.845 76.4 15.0 12.2 26,764 1 40<br />
41 Portugal 0.843 81.2 16.6 8.9 26,104 2 41<br />
42 United Arab Emirates 0.840 77.1 13.3 k 9.5 c 66,203 –35 42<br />
43 Hungary 0.836 75.3 15.6 12.0 23,394 6 43<br />
44 Latvia 0.830 74.3 16.0 11.7 f 22,589 7 44<br />
45 Argentina 0.827 76.5 17.3 9.9 f 20,945 l 12 45<br />
45 Croatia 0.827 77.5 15.3 11.2 20,291 14 46<br />
47 Bahrain 0.824 76.7 14.5 k 9.4 m 37,236 –19 46<br />
48 Montenegro 0.807 76.4 15.1 11.3 n 15,410 24 49<br />
49 Russian Federation 0.804 70.3 15.0 12.0 23,286 1 48<br />
50 Romania 0.802 74.8 14.7 10.8 19,428 11 51<br />
51 Kuwait 0.800 74.5 13.3 7.3 76,075 e –48 50<br />
HIGH HUMAN DEVELOPMENT<br />
52 Belarus 0.796 71.5 15.7 12.0 15,629 19 51<br />
52 Oman 0.796 77.0 13.7 8.1 m 34,402 –21 53<br />
54 Barbados 0.795 75.8 15.3 10.5 n 14,952 20 54<br />
54 Uruguay 0.795 77.4 15.5 8.6 19,148 8 54<br />
56 Bulgaria 0.794 74.3 15.0 10.8 c 16,261 13 57<br />
56 Kazakhstan 0.794 69.6 15.0 11.7 f 22,093 –3 56<br />
58 Bahamas 0.792 75.6 12.7 k 10.9 21,565 –3 58<br />
59 Malaysia 0.789 74.9 13.1 10.1 24,620 –13 59<br />
60 Palau 0.788 72.9 g 14.3 12.3 k 13,771 21 62<br />
60 Panama 0.788 77.8 13.0 9.9 19,470 0 60<br />
HDI rank<br />
198 | HUMAN DEVELOPMENT REPORT <strong>2016</strong>
HUMAN DEVELOPMENT REPORT <strong>2016</strong><br />
<strong>Human</strong> <strong>Development</strong> for Everyone<br />
<strong>Human</strong> <strong>Development</strong><br />
Index (HDI)<br />
Life expectancy<br />
at birth<br />
Expected years<br />
of schooling<br />
Mean years<br />
of schooling<br />
Gross national income<br />
(GNI) per capita<br />
Value (years) (years) (years) (2011 PPP $)<br />
GNI per capita rank<br />
minus HDI rank<br />
HDI rank 2015 2015 2015 a 2015 a 2015 2015 2014<br />
62 Antigua and Barbuda 0.786 76.2 13.9 9.2 k 20,907 –4 61<br />
63 Seychelles 0.782 73.3 14.1 9.4 k 23,886 –15 63<br />
64 Mauritius 0.781 74.6 15.2 9.1 17,948 1 64<br />
65 Trinidad and Tobago 0.780 70.5 12.7 o 10.9 28,049 –25 64<br />
66 Costa Rica 0.776 79.6 14.2 8.7 14,006 14 66<br />
66 Serbia 0.776 75.0 14.4 10.8 12,202 22 66<br />
68 Cuba 0.775 79.6 13.9 11.8 m 7,455 p 48 69<br />
69 Iran (Islamic Republic of) 0.774 75.6 14.8 8.8 f 16,395 –2 68<br />
70 Georgia 0.769 75.0 13.9 12.2 8,856 38 71<br />
71 Turkey 0.767 75.5 14.6 7.9 18,705 –7 72<br />
71 Venezuela (Bolivarian Republic of) 0.767 74.4 14.3 9.4 15,129 2 70<br />
73 Sri Lanka 0.766 75.0 14.0 10.9 f 10,789 21 72<br />
74 Saint Kitts and Nevis 0.765 74.0 g 13.7 8.4 k 22,436 –22 75<br />
75 Albania 0.764 78.0 14.2 9.6 10,252 24 75<br />
76 Lebanon 0.763 79.5 13.3 8.6 m 13,312 8 74<br />
77 Mexico 0.762 77.0 13.3 8.6 16,383 –9 77<br />
78 Azerbaijan 0.759 70.9 12.7 11.2 16,413 –12 77<br />
79 Brazil 0.754 74.7 15.2 7.8 14,145 –1 79<br />
79 Grenada 0.754 73.6 15.8 8.6 k 11,502 13 80<br />
81 Bosnia and Herzegovina 0.750 76.6 14.2 9.0 10,091 22 82<br />
82 The former Yugoslav Republic of Macedonia 0.748 75.5 12.9 9.4 n 12,405 5 83<br />
83 Algeria 0.745 75.0 14.4 7.8 c 13,533 –1 84<br />
84 Armenia 0.743 74.9 12.7 11.3 8,189 28 85<br />
84 Ukraine 0.743 71.1 15.3 11.3 f 7,361 34 81<br />
86 Jordan 0.741 74.2 13.1 10.1 10,111 15 85<br />
87 Peru 0.740 74.8 13.4 9.0 11,295 6 89<br />
87 Thailand 0.740 74.6 13.6 7.9 14,519 –11 88<br />
89 Ecuador 0.739 76.1 14.0 8.3 10,536 6 87<br />
90 China 0.738 76.0 13.5 7.6 c 13,345 –7 91<br />
91 Fiji 0.736 70.2 15.3 k 10.5 f 8,245 20 91<br />
92 Mongolia 0.735 69.8 14.8 9.8 m 10,449 4 93<br />
92 Saint Lucia 0.735 75.2 13.1 9.3 m 9,791 14 90<br />
94 Jamaica 0.730 75.8 12.8 9.6 f 8,350 16 94<br />
95 Colombia 0.727 74.2 13.6 7.6 c 12,762 –10 95<br />
96 Dominica 0.726 77.9 g 12.8 k 7.9 m 10,096 6 95<br />
97 Suriname 0.725 71.3 12.7 8.3 m 16,018 –27 97<br />
97 Tunisia 0.725 75.0 14.6 7.1 c 10,249 3 97<br />
99 Dominican Republic 0.722 73.7 13.2 7.7 12,756 –13 101<br />
99 Saint Vincent and the Grenadines 0.722 73.0 13.3 m 8.6 k 10,372 –1 99<br />
101 Tonga 0.721 73.0 14.3 m 11.1 5,284 33 101<br />
102 Libya 0.716 71.8 13.4 k 7.3 c 14,303 –25 100<br />
103 Belize 0.706 70.1 12.8 10.5 7,375 14 103<br />
104 Samoa 0.704 73.7 12.9 d 10.3 d 5,372 27 104<br />
105 Maldives 0.701 77.0 12.7 o 6.2 q 10,383 –8 105<br />
105 Uzbekistan 0.701 69.4 r 12.2 12.0 m 5,748 21 108<br />
MEDIUM HUMAN DEVELOPMENT<br />
107 Moldova (Republic of) 0.699 71.7 11.8 11.9 5,026 31 105<br />
108 Botswana 0.698 64.5 12.6 9.2 c 14,663 –33 107<br />
109 Gabon 0.697 64.9 12.6 8.1 q 19,044 –46 109<br />
110 Paraguay 0.693 73.0 12.3 8.1 8,182 3 110<br />
111 Egypt 0.691 71.3 13.1 7.1 f 10,064 –7 111<br />
111 Turkmenistan 0.691 65.7 10.8 9.9 k 14,026 –32 111<br />
113 Indonesia 0.689 69.1 12.9 7.9 10,053 –8 113<br />
114 Palestine, State of 0.684 73.1 12.8 8.9 5,256 21 115<br />
115 Viet Nam 0.683 75.9 12.6 8.0 c 5,335 18 115<br />
116 Philippines 0.682 68.3 11.7 9.3 8,395 –7 114<br />
117 El Salvador 0.680 73.3 13.2 6.5 7,732 –3 115<br />
118 Bolivia (Plurinational State of) 0.674 68.7 13.8 8.2 6,155 6 118<br />
119 South Africa 0.666 57.7 13.0 10.3 12,087 –30 119<br />
120 Kyrgyzstan 0.664 70.8 13.0 10.8 c 3,097 32 120<br />
121 Iraq 0.649 69.6 10.1 k 6.6 n 11,608 –30 121<br />
122 Cabo Verde 0.648 73.5 13.5 4.8 k 6,049 3 122<br />
123 Morocco 0.647 74.3 12.1 5.0 f 7,195 –4 123<br />
HDI rank<br />
TABLE<br />
1<br />
TABLE 1 <strong>Human</strong> <strong>Development</strong> Index and its components | 199
TABLE 1 HUMAN DEVELOPMENT INDEX AND ITS COMPONENTS<br />
TABLE<br />
1<br />
<strong>Human</strong> <strong>Development</strong><br />
Index (HDI)<br />
Life expectancy<br />
at birth<br />
Expected years<br />
of schooling<br />
Mean years<br />
of schooling<br />
Gross national income<br />
(GNI) per capita<br />
Value (years) (years) (years) (2011 PPP $)<br />
GNI per capita rank<br />
minus HDI rank<br />
HDI rank 2015 2015 2015 a 2015 a 2015 2015 2014<br />
124 Nicaragua 0.645 75.2 11.7 6.5 f 4,747 16 124<br />
125 Guatemala 0.640 72.1 10.7 6.3 7,063 –4 126<br />
125 Namibia 0.640 65.1 11.7 6.7 f 9,770 –18 126<br />
127 Guyana 0.638 66.5 10.3 8.4 c 6,884 –5 125<br />
127 Micronesia (Federated States of) 0.638 69.3 11.7 k 9.7 d 3,291 22 126<br />
129 Tajikistan 0.627 69.6 11.3 10.4 q 2,601 30 129<br />
130 Honduras 0.625 73.3 11.2 6.2 4,466 11 130<br />
131 India 0.624 68.3 11.7 6.3 c 5,663 –4 131<br />
132 Bhutan 0.607 69.9 12.5 3.1 n 7,081 –12 132<br />
133 Timor-Leste 0.605 68.5 12.5 4.4 q 5,371 l –1 133<br />
134 Vanuatu 0.597 72.1 10.8 o 6.8 n 2,805 23 134<br />
135 Congo 0.592 62.9 11.1 6.3 c 5,503 –7 135<br />
135 Equatorial Guinea 0.592 57.9 9.2 k 5.5 q 21,517 –79 137<br />
137 Kiribati 0.588 66.2 11.9 7.8 k 2,475 23 136<br />
138 Lao People’s Democratic Republic 0.586 66.6 10.8 5.2 n 5,049 –2 137<br />
139 Bangladesh 0.579 72.0 10.2 5.2 c 3,341 8 140<br />
139 Ghana 0.579 61.5 11.5 6.9 f 3,839 5 140<br />
139 Zambia 0.579 60.8 12.5 6.9 f 3,464 7 139<br />
142 Sao Tome and Principe 0.574 66.6 12.0 5.3 3,070 12 142<br />
143 Cambodia 0.563 68.8 10.9 4.7 q 3,095 10 143<br />
144 Nepal 0.558 70.0 12.2 4.1 n 2,337 19 144<br />
145 Myanmar 0.556 66.1 9.1 m 4.7 f 4,943 –6 146<br />
146 Kenya 0.555 62.2 11.1 6.3 f 2,881 10 147<br />
147 Pakistan 0.550 66.4 8.1 5.1 5,031 –10 148<br />
LOW HUMAN DEVELOPMENT<br />
148 Swaziland 0.541 48.9 11.4 6.8 n 7,522 –33 149<br />
149 Syrian Arab Republic 0.536 69.7 9.0 5.1 s 2,441 t 13 145<br />
150 Angola 0.533 52.7 11.4 5.0 q 6,291 –27 150<br />
151 Tanzania (United Republic of) 0.531 65.5 8.9 5.8 2,467 10 152<br />
152 Nigeria 0.527 53.1 10.0 6.0 q 5,443 –23 151<br />
153 Cameroon 0.518 56.0 10.4 6.1 c 2,894 2 154<br />
154 Papua New Guinea 0.516 62.8 9.9 k 4.3 f 2,712 4 153<br />
154 Zimbabwe 0.516 59.2 10.3 7.7 1,588 20 158<br />
156 Solomon Islands 0.515 68.1 9.6 m 5.3 d 1,561 19 155<br />
157 Mauritania 0.513 63.2 8.5 4.3 f 3,527 –12 155<br />
158 Madagascar 0.512 65.5 10.3 6.1 n 1,320 25 157<br />
159 Rwanda 0.498 64.7 10.8 3.8 1,617 14 162<br />
160 Comoros 0.497 63.6 11.1 4.8 q 1,335 22 160<br />
160 Lesotho 0.497 50.1 10.7 6.1 f 3,319 –12 161<br />
162 Senegal 0.494 66.9 9.5 2.8 m 2,250 3 163<br />
163 Haiti 0.493 63.1 9.1 k 5.2 c 1,657 9 164<br />
163 Uganda 0.493 59.2 10.0 5.7 m 1,670 8 165<br />
165 Sudan 0.490 63.7 7.2 3.5 3,846 –22 165<br />
166 Togo 0.487 60.2 12.0 4.7 q 1,262 18 167<br />
167 Benin 0.485 59.8 10.7 3.5 c 1,979 1 168<br />
168 Yemen 0.482 64.1 9.0 3.0 c 2,300 –4 159<br />
169 Afghanistan 0.479 60.7 10.1 3.6 f 1,871 1 169<br />
170 Malawi 0.476 63.9 10.8 4.4 f 1,073 16 170<br />
171 Côte d’Ivoire 0.474 51.9 8.9 5.0 f 3,163 –20 172<br />
172 Djibouti 0.473 62.3 6.3 4.1 k 3,216 –22 171<br />
173 Gambia 0.452 60.5 8.9 3.3 f 1,541 3 173<br />
174 Ethiopia 0.448 64.6 8.4 2.6 q 1,523 5 174<br />
175 Mali 0.442 58.5 8.4 2.3 2,218 –9 175<br />
176 Congo (Democratic Republic of the) 0.435 59.1 9.8 6.1 680 15 178<br />
177 Liberia 0.427 61.2 9.9 4.4 f 683 13 177<br />
178 Guinea-Bissau 0.424 55.5 9.2 m 2.9 k 1,369 3 179<br />
179 Eritrea 0.420 64.2 5.0 3.9 k 1,490 1 181<br />
179 Sierra Leone 0.420 51.3 9.5 3.3 f 1,529 –1 176<br />
181 Mozambique 0.418 55.5 9.1 3.5 q 1,098 4 182<br />
181 South Sudan 0.418 56.1 4.9 4.8 n 1,882 –12 179<br />
183 Guinea 0.414 59.2 8.8 2.6 q 1,058 4 182<br />
184 Burundi 0.404 57.1 10.6 3.0 c 691 5 184<br />
185 Burkina Faso 0.402 59.0 7.7 1.4 q 1,537 –8 185<br />
HDI rank<br />
200 | HUMAN DEVELOPMENT REPORT <strong>2016</strong>
HUMAN DEVELOPMENT REPORT <strong>2016</strong><br />
<strong>Human</strong> <strong>Development</strong> for Everyone<br />
<strong>Human</strong> <strong>Development</strong><br />
Index (HDI)<br />
Life expectancy<br />
at birth<br />
Expected years<br />
of schooling<br />
Mean years<br />
of schooling<br />
Gross national income<br />
(GNI) per capita<br />
Value (years) (years) (years) (2011 PPP $)<br />
GNI per capita rank<br />
minus HDI rank<br />
HDI rank 2015 2015 2015 a 2015 a 2015 2015 2014<br />
186 Chad 0.396 51.9 7.3 2.3 n 1,991 –19 186<br />
187 Niger 0.353 61.9 5.4 1.7 f 889 1 187<br />
188 Central African Republic 0.352 51.5 7.1 4.2 n 587 4 188<br />
OTHER COUNTRIES OR TERRITORIES<br />
Korea (Democratic People’s Rep. of) .. 70.5 12.0 .. .. .. ..<br />
Marshall Islands .. .. .. .. 4,412 .. ..<br />
Monaco .. .. .. .. .. .. ..<br />
Nauru .. .. 9.7 k .. 12,058 .. ..<br />
San Marino .. .. 15.1 .. 50,063 .. ..<br />
Somalia .. 55.7 .. .. 294 .. ..<br />
Tuvalu .. .. .. .. 5,395 .. ..<br />
<strong>Human</strong> development groups<br />
Very high human development 0.892 79.4 16.4 12.2 39,605 — —<br />
High human development 0.746 75.5 13.8 8.1 13,844 — —<br />
Medium human development 0.631 68.6 11.5 6.6 6,281 — —<br />
Low human development 0.497 59.3 9.3 4.6 2,649 — —<br />
Developing countries 0.668 70.0 11.8 7.2 9,257 — —<br />
Regions<br />
Arab States 0.687 70.8 11.7 6.8 14,958 — —<br />
East Asia and the Pacific 0.720 74.2 13.0 7.7 12,125 — —<br />
Europe and Central Asia 0.756 72.6 13.9 10.3 12,862 — —<br />
Latin America and the Caribbean 0.751 75.2 14.1 8.3 14,028 — —<br />
South Asia 0.621 68.7 11.3 6.2 5,799 — —<br />
Sub-Saharan Africa 0.523 58.9 9.7 5.4 3,383 — —<br />
Least developed countries 0.508 63.6 9.4 4.4 2,385 — —<br />
Small island developing states 0.667 70.3 11.5 8.1 7,303 — —<br />
Organisation for Economic<br />
Co‐operation and <strong>Development</strong> 0.887 80.3 15.9 11.9 37,916 — —<br />
World 0.717 71.6 12.3 8.3 14,447 — —<br />
HDI rank<br />
TABLE<br />
1<br />
NOTES<br />
a Data refer to 2015 or the most recent year<br />
available.<br />
b In calculating the HDI value, expected years of<br />
schooling is capped at 18 years.<br />
c Updated by HDRO using Barro and Lee (<strong>2016</strong>)<br />
estimates.<br />
d Based on data from the national statistical office.<br />
e In calculating the HDI value, GNI per capita is<br />
capped at $75,000.<br />
f Based on Barro and Lee (<strong>2016</strong>).<br />
g Value from UNDESA (2011).<br />
h Calculated as the average of mean years of<br />
schooling for Austria and Switzerland.<br />
i Estimated using the purchasing power parity (PPP)<br />
rate and projected growth rate of Switzerland.<br />
j Estimated using the PPP rate and projected<br />
growth rate of Spain.<br />
k Based on cross-country regression.<br />
l HDRO estimate based on data from World Bank<br />
(<strong>2016</strong>a) and United Nations Statistics Division<br />
(<strong>2016</strong>a).<br />
m Updated by HDRO based on data from UNESCO<br />
Institute for Statistics (<strong>2016</strong>).<br />
n Based on data from United Nations Children’s<br />
Fund (UNICEF) Multiple Indicator Cluster Surveys<br />
for 2006–2015.<br />
o Updated by HDRO based on data from ICF Macro<br />
Demographic and Health Surveys for 2006–2015.<br />
p Based on a cross-country regression and the<br />
projected growth rate from UNECLAC (<strong>2016</strong>).<br />
q Based on data from ICF Macro Demographic and<br />
Health Surveys for 2006–2015.<br />
r Value from WHO (<strong>2016</strong>).<br />
s Updated by HDRO based on Syrian Centre for<br />
Policy Research (<strong>2016</strong>).<br />
t Based on projected growth rates from UNESCWA<br />
(<strong>2016</strong>) and World Bank (<strong>2016</strong>a).<br />
DEFINITIONS<br />
<strong>Human</strong> <strong>Development</strong> Index (HDI): A composite<br />
index measuring average achievement in three basic<br />
dimensions of human development — a long and<br />
healthy life, knowledge and a decent standard of<br />
living. See Technical note 1 at http://hdr.undp.org/<br />
sites/default/files/hdr<strong>2016</strong>_technical_notes.pdf for<br />
details on how the HDI is calculated.<br />
Life expectancy at birth: Number of years a<br />
newborn infant could expect to live if prevailing<br />
patterns of age-specific mortality rates at the time of<br />
birth stay the same throughout the infant’s life.<br />
Expected years of schooling: Number of years<br />
of schooling that a child of school entrance age<br />
can expect to receive if prevailing patterns of<br />
age-specific enrolment rates persist throughout the<br />
child’s life.<br />
Mean years of schooling: Average number of<br />
years of education received by people ages 25 and<br />
older, converted from education attainment levels<br />
using official durations of each level.<br />
Gross national income (GNI) per capita:<br />
Aggregate income of an economy generated by<br />
its production and its ownership of factors of<br />
production, less the incomes paid for the use of<br />
factors of production owned by the rest of the world,<br />
converted to international dollars using PPP rates,<br />
divided by midyear population.<br />
GNI per capita rank minus HDI rank: Difference<br />
in ranking by GNI per capita and by HDI value. A<br />
negative value means that the country is better<br />
ranked by GNI than by HDI value.<br />
HDI rank for 2014: Ranking by HDI value for 2014,<br />
which was calculated using the same most recently<br />
revised data available in <strong>2016</strong> that were used to<br />
calculate HDI values for 2015.<br />
MAIN DATA SOURCES<br />
Columns 1 and 7: HDRO calculations based on<br />
data from UNDESA (2015a), UNESCO Institute for<br />
Statistics (<strong>2016</strong>), United Nations Statistics Division<br />
(<strong>2016</strong>a), World Bank (<strong>2016</strong>a), Barro and Lee (<strong>2016</strong>)<br />
and IMF (<strong>2016</strong>).<br />
Column 2: UNDESA (2015a).<br />
Column 3: UNESCO Institute for Statistics (<strong>2016</strong>),<br />
ICF Macro Demographic and Health Surveys and<br />
UNICEF Multiple Indicator Cluster Surveys.<br />
Column 4: UNESCO Institute for Statistics (<strong>2016</strong>),<br />
Barro and Lee (<strong>2016</strong>), ICF Macro Demographic and<br />
Health Surveys and UNICEF Multiple Indicator<br />
Cluster Surveys.<br />
Column 5: World Bank (<strong>2016</strong>a), IMF (<strong>2016</strong>) and<br />
United Nations Statistics Division (<strong>2016</strong>a).<br />
Column 6: Calculated based on data in columns<br />
1 and 5.<br />
TABLE 1 <strong>Human</strong> <strong>Development</strong> Index and its components | 201
TABLE<br />
2<br />
<strong>Human</strong> <strong>Development</strong> Index trends, 1990–2015<br />
TABLE<br />
2<br />
<strong>Human</strong> <strong>Development</strong> Index (HDI)<br />
Change in<br />
HDI rank<br />
Average annual HDI growth<br />
Value (%)<br />
HDI rank 1990 2000 2010 2011 2012 2013 2014 2015 2010–2015 a 1990–2000 2000–2010 2010–2015 1990–2015<br />
VERY HIGH HUMAN DEVELOPMENT<br />
1 Norway 0.849 0.917 0.939 0.941 0.942 0.945 0.948 0.949 0 0.77 0.24 0.21 0.45<br />
2 Australia 0.866 0.899 0.927 0.930 0.933 0.936 0.937 0.939 1 0.38 0.31 0.24 0.32<br />
2 Switzerland 0.831 0.888 0.932 0.932 0.934 0.936 0.938 0.939 0 0.67 0.49 0.16 0.49<br />
4 Germany 0.801 0.860 0.912 0.916 0.919 0.920 0.924 0.926 0 0.71 0.59 0.30 0.58<br />
5 Denmark 0.799 0.862 0.910 0.922 0.924 0.926 0.923 0.925 2 0.76 0.55 0.32 0.59<br />
5 Singapore 0.718 0.820 0.911 0.917 0.920 0.922 0.924 0.925 0 1.34 1.05 0.30 1.02<br />
7 Netherlands 0.830 0.878 0.911 0.921 0.922 0.923 0.923 0.924 –2 0.56 0.37 0.29 0.43<br />
8 Ireland 0.762 0.857 0.909 0.895 0.902 0.910 0.920 0.923 1 1.17 0.60 0.29 0.77<br />
9 Iceland 0.797 0.854 0.894 0.901 0.907 0.915 0.919 0.921 7 0.70 0.46 0.60 0.58<br />
10 Canada 0.849 0.867 0.903 0.907 0.909 0.912 0.919 0.920 1 0.21 0.41 0.38 0.32<br />
10 United States 0.860 0.884 0.910 0.913 0.915 0.916 0.918 0.920 –3 0.28 0.29 0.20 0.27<br />
12 Hong Kong, China (SAR) 0.781 0.825 0.898 0.905 0.907 0.913 0.916 0.917 3 0.55 0.85 0.42 0.64<br />
13 New Zealand 0.818 0.868 0.901 0.904 0.908 0.910 0.913 0.915 0 0.61 0.36 0.32 0.45<br />
14 Sweden 0.815 0.877 0.901 0.903 0.904 0.906 0.909 0.913 –1 0.73 0.28 0.25 0.45<br />
15 Liechtenstein .. 0.862 0.904 0.909 0.908 0.912 0.911 0.912 –5 .. 0.48 0.16 ..<br />
16 United Kingdom 0.775 0.866 0.902 0.898 0.899 0.904 0.908 0.909 –4 1.13 0.41 0.16 0.64<br />
17 Japan 0.814 0.856 0.884 0.889 0.894 0.899 0.902 0.903 1 0.51 0.32 0.44 0.42<br />
18 Korea (Republic of) 0.731 0.820 0.884 0.889 0.891 0.896 0.899 0.901 0 1.15 0.76 0.37 0.84<br />
19 Israel 0.785 0.850 0.883 0.889 0.891 0.895 0.898 0.899 2 0.81 0.38 0.35 0.54<br />
20 Luxembourg 0.782 0.854 0.894 0.892 0.892 0.892 0.896 0.898 –4 0.88 0.46 0.11 0.56<br />
21 France 0.779 0.849 0.882 0.885 0.887 0.890 0.894 0.897 1 0.86 0.39 0.34 0.57<br />
22 Belgium 0.805 0.873 0.884 0.886 0.889 0.890 0.895 0.896 –4 0.81 0.12 0.27 0.42<br />
23 Finland 0.783 0.856 0.878 0.884 0.887 0.890 0.893 0.895 1 0.90 0.25 0.37 0.53<br />
24 Austria 0.794 0.837 0.880 0.884 0.887 0.892 0.892 0.893 –1 0.53 0.50 0.31 0.47<br />
25 Slovenia 0.767 0.824 0.876 0.877 0.878 0.888 0.888 0.890 0 0.73 0.61 0.33 0.60<br />
26 Italy 0.768 0.828 0.872 0.877 0.876 0.877 0.881 0.887 0 0.76 0.51 0.34 0.58<br />
27 Spain 0.755 0.825 0.867 0.871 0.874 0.877 0.882 0.884 0 0.90 0.49 0.40 0.64<br />
28 Czech Republic 0.761 0.821 0.861 0.864 0.865 0.871 0.875 0.878 0 0.76 0.47 0.39 0.57<br />
29 Greece 0.760 0.801 0.860 0.858 0.860 0.862 0.865 0.866 0 0.52 0.71 0.14 0.52<br />
30 Brunei Darussalam 0.782 0.819 0.846 0.852 0.860 0.863 0.864 0.865 1 0.46 0.33 0.43 0.40<br />
30 Estonia 0.728 0.781 0.838 0.850 0.856 0.860 0.863 0.865 2 0.71 0.70 0.65 0.69<br />
32 Andorra .. .. 0.819 0.819 0.843 0.850 0.857 0.858 9 .. .. 0.95 ..<br />
33 Cyprus 0.733 0.800 0.847 0.850 0.849 0.850 0.854 0.856 –3 0.88 0.58 0.20 0.62<br />
33 Malta 0.736 0.783 0.826 0.821 0.828 0.847 0.853 0.856 3 0.63 0.53 0.71 0.61<br />
33 Qatar 0.754 0.809 0.827 0.837 0.843 0.854 0.855 0.856 2 0.71 0.22 0.68 0.51<br />
36 Poland 0.712 0.784 0.829 0.834 0.838 0.850 0.852 0.855 –3 0.97 0.56 0.62 0.74<br />
37 Lithuania 0.731 0.757 0.826 0.830 0.834 0.841 0.846 0.848 –1 0.36 0.87 0.53 0.60<br />
38 Chile 0.700 0.761 0.820 0.826 0.831 0.841 0.845 0.847 2 0.84 0.75 0.65 0.76<br />
38 Saudi Arabia 0.698 0.742 0.803 0.818 0.830 0.841 0.845 0.847 9 0.61 0.80 1.05 0.77<br />
40 Slovakia 0.738 0.763 0.829 0.835 0.838 0.841 0.842 0.845 –7 0.34 0.83 0.39 0.54<br />
41 Portugal 0.711 0.782 0.818 0.824 0.827 0.837 0.841 0.843 1 0.97 0.45 0.59 0.68<br />
42 United Arab Emirates 0.726 0.798 0.824 0.826 0.829 0.832 0.836 0.840 –4 0.94 0.32 0.38 0.58<br />
43 Hungary 0.703 0.769 0.821 0.823 0.824 0.834 0.834 0.836 –4 0.89 0.67 0.36 0.70<br />
44 Latvia 0.703 0.728 0.810 0.812 0.814 0.822 0.828 0.830 1 0.35 1.07 0.49 0.67<br />
45 Argentina 0.705 0.771 0.816 0.822 0.823 0.825 0.826 0.827 –2 0.90 0.57 0.28 0.64<br />
45 Croatia 0.669 0.749 0.808 0.815 0.817 0.820 0.823 0.827 1 1.13 0.77 0.47 0.85<br />
47 Bahrain 0.745 0.794 0.812 0.812 0.815 0.820 0.823 0.824 –3 0.63 0.23 0.29 0.40<br />
48 Montenegro .. .. 0.792 0.797 0.799 0.803 0.804 0.807 2 .. .. 0.38 ..<br />
49 Russian Federation 0.733 0.720 0.785 0.792 0.799 0.803 0.805 0.804 5 –0.18 0.87 0.48 0.37<br />
50 Romania 0.700 0.708 0.798 0.797 0.794 0.797 0.798 0.802 –2 0.11 1.20 0.12 0.55<br />
51 Kuwait 0.713 0.786 0.792 0.794 0.796 0.787 0.799 0.800 –1 0.98 0.07 0.21 0.46<br />
HIGH HUMAN DEVELOPMENT<br />
52 Belarus .. 0.681 0.787 0.793 0.796 0.796 0.798 0.796 1 .. 1.45 0.23 ..<br />
52 Oman .. 0.705 0.797 0.797 0.796 0.796 0.795 0.796 –3 .. 1.25 –0.04 ..<br />
54 Barbados 0.714 0.750 0.780 0.785 0.792 0.793 0.794 0.795 2 0.49 0.39 0.37 0.43<br />
54 Uruguay 0.692 0.742 0.780 0.784 0.788 0.791 0.794 0.795 2 0.70 0.50 0.37 0.55<br />
56 Bulgaria 0.700 0.713 0.775 0.778 0.781 0.787 0.792 0.794 3 0.19 0.83 0.49 0.50<br />
56 Kazakhstan 0.690 0.685 0.766 0.774 0.782 0.789 0.793 0.794 7 –0.07 1.13 0.72 0.56<br />
58 Bahamas .. 0.778 0.788 0.789 0.790 0.789 0.790 0.792 –6 .. 0.13 0.08 ..<br />
59 Malaysia 0.643 0.725 0.774 0.776 0.779 0.783 0.787 0.789 1 1.20 0.67 0.39 0.83<br />
60 Palau .. 0.741 0.770 0.775 0.779 0.782 0.783 0.788 2 .. 0.38 0.47 ..<br />
60 Panama 0.662 0.721 0.758 0.765 0.773 0.780 0.785 0.788 4 0.86 0.50 0.76 0.70<br />
202 | HUMAN DEVELOPMENT REPORT <strong>2016</strong>
HUMAN DEVELOPMENT REPORT <strong>2016</strong><br />
<strong>Human</strong> <strong>Development</strong> for Everyone<br />
<strong>Human</strong> <strong>Development</strong> Index (HDI)<br />
Change in<br />
HDI rank<br />
Average annual HDI growth<br />
Value (%)<br />
HDI rank 1990 2000 2010 2011 2012 2013 2014 2015 2010–2015 a 1990–2000 2000–2010 2010–2015 1990–2015<br />
62 Antigua and Barbuda .. .. 0.782 0.778 0.781 0.782 0.784 0.786 –7 .. .. 0.08 ..<br />
63 Seychelles .. 0.714 0.744 0.755 0.762 0.766 0.781 0.782 11 .. 0.41 1.02 ..<br />
64 Mauritius 0.620 0.673 0.748 0.756 0.765 0.769 0.779 0.781 6 0.83 1.05 0.89 0.93<br />
65 Trinidad and Tobago 0.670 0.715 0.774 0.772 0.773 0.778 0.779 0.780 –5 0.65 0.79 0.16 0.61<br />
66 Costa Rica 0.653 0.708 0.752 0.758 0.762 0.768 0.775 0.776 3 0.82 0.61 0.64 0.70<br />
66 Serbia 0.714 0.709 0.757 0.767 0.766 0.771 0.775 0.776 0 –0.07 0.65 0.50 0.33<br />
68 Cuba 0.676 0.686 0.780 0.778 0.773 0.772 0.772 0.775 –12 0.15 1.28 –0.13 0.55<br />
69 Iran (Islamic Republic of) 0.572 0.666 0.745 0.755 0.769 0.770 0.774 0.774 3 1.53 1.12 0.78 1.22<br />
70 Georgia .. 0.673 0.742 0.749 0.755 0.759 0.768 0.769 5 .. 0.99 0.72 ..<br />
71 Turkey 0.576 0.653 0.737 0.750 0.754 0.759 0.764 0.767 9 1.26 1.22 0.81 1.15<br />
71 Venezuela (Bolivarian Republic of) 0.634 0.672 0.756 0.767 0.770 0.771 0.769 0.767 –4 0.58 1.18 0.29 0.76<br />
73 Sri Lanka 0.626 0.686 0.746 0.752 0.757 0.760 0.764 0.766 –2 0.92 0.84 0.56 0.82<br />
74 Saint Kitts and Nevis .. .. 0.741 0.746 0.749 0.756 0.762 0.765 2 .. .. 0.64 ..<br />
75 Albania 0.635 0.662 0.738 0.752 0.759 0.761 0.762 0.764 4 0.41 1.10 0.70 0.74<br />
76 Lebanon .. .. 0.758 0.763 0.766 0.763 0.763 0.763 –12 .. .. 0.14 ..<br />
77 Mexico 0.648 0.700 0.745 0.748 0.753 0.754 0.758 0.762 –5 0.77 0.63 0.44 0.65<br />
78 Azerbaijan .. 0.642 0.741 0.742 0.745 0.752 0.758 0.759 –2 .. 1.43 0.48 ..<br />
79 Brazil 0.611 0.685 0.724 0.730 0.734 0.747 0.754 0.754 7 1.15 0.55 0.83 0.85<br />
79 Grenada .. .. 0.741 0.744 0.745 0.749 0.751 0.754 –3 .. .. 0.33 ..<br />
81 Bosnia and Herzegovina .. .. 0.711 0.728 0.735 0.742 0.747 0.750 14 .. .. 1.07 ..<br />
82 The former Yugoslav Republic of Macedonia .. .. 0.735 0.739 0.741 0.743 0.746 0.748 0 .. .. 0.35 ..<br />
83 Algeria 0.577 0.644 0.724 0.732 0.737 0.741 0.743 0.745 3 1.11 1.18 0.56 1.03<br />
84 Armenia 0.634 0.644 0.729 0.732 0.736 0.739 0.741 0.743 1 0.16 1.24 0.39 0.64<br />
84 Ukraine 0.706 0.673 0.734 0.739 0.744 0.746 0.748 0.743 –1 –0.48 0.87 0.25 0.21<br />
86 Jordan 0.620 0.706 0.737 0.735 0.737 0.737 0.741 0.741 –6 1.31 0.43 0.13 0.72<br />
87 Peru 0.613 0.677 0.721 0.725 0.731 0.735 0.737 0.740 3 1.01 0.63 0.53 0.76<br />
87 Thailand 0.574 0.649 0.720 0.729 0.733 0.737 0.738 0.740 4 1.25 1.03 0.56 1.02<br />
89 Ecuador 0.643 0.670 0.710 0.717 0.725 0.737 0.739 0.739 7 0.41 0.58 0.83 0.56<br />
90 China 0.499 0.592 0.700 0.703 0.713 0.723 0.734 0.738 11 1.72 1.70 1.05 1.57<br />
91 Fiji 0.641 0.683 0.709 0.714 0.719 0.727 0.734 0.736 6 0.64 0.37 0.75 0.56<br />
92 Mongolia 0.579 0.588 0.701 0.712 0.720 0.729 0.733 0.735 8 0.17 1.77 0.94 0.96<br />
92 Saint Lucia .. 0.684 0.733 0.735 0.734 0.723 0.735 0.735 –8 .. 0.69 0.06 ..<br />
94 Jamaica 0.651 0.680 0.722 0.725 0.727 0.727 0.729 0.730 –6 0.44 0.60 0.22 0.46<br />
95 Colombia 0.592 0.653 0.700 0.707 0.712 0.720 0.724 0.727 6 0.99 0.70 0.76 0.83<br />
96 Dominica .. 0.695 0.722 0.722 0.721 0.724 0.724 0.726 –8 .. 0.38 0.13 ..<br />
97 Suriname .. .. 0.704 0.708 0.719 0.722 0.723 0.725 1 .. .. 0.58 ..<br />
97 Tunisia 0.569 0.654 0.714 0.717 0.720 0.722 0.723 0.725 –5 1.40 0.88 0.29 0.97<br />
99 Dominican Republic 0.596 0.656 0.703 0.706 0.709 0.712 0.718 0.722 0 0.96 0.69 0.54 0.77<br />
99 Saint Vincent and the Grenadines .. 0.673 0.712 0.713 0.717 0.720 0.720 0.722 –6 .. 0.55 0.28 ..<br />
101 Tonga 0.648 0.674 0.712 0.717 0.718 0.716 0.718 0.721 –8 0.38 0.56 0.24 0.42<br />
102 Libya 0.681 0.732 0.756 0.706 0.735 0.730 0.719 0.716 –35 0.72 0.32 –1.06 0.20<br />
103 Belize 0.648 0.677 0.700 0.702 0.706 0.705 0.706 0.706 –2 0.43 0.33 0.19 0.34<br />
104 Samoa 0.598 0.645 0.693 0.698 0.700 0.701 0.702 0.704 0 0.75 0.72 0.32 0.65<br />
105 Maldives .. 0.587 0.663 0.675 0.683 0.693 0.701 0.701 10 .. 1.24 1.11 ..<br />
105 Uzbekistan .. 0.594 0.664 0.673 0.681 0.690 0.697 0.701 6 .. 1.12 1.07 ..<br />
MEDIUM HUMAN DEVELOPMENT<br />
107 Moldova (Republic of) 0.652 0.597 0.672 0.679 0.686 0.696 0.701 0.699 0 –0.87 1.18 0.81 0.28<br />
108 Botswana 0.585 0.560 0.678 0.687 0.693 0.697 0.698 0.698 –3 –0.43 1.93 0.56 0.71<br />
109 Gabon 0.620 0.633 0.664 0.669 0.678 0.687 0.694 0.697 5 0.20 0.48 0.97 0.47<br />
110 Paraguay 0.580 0.624 0.675 0.679 0.679 0.688 0.692 0.693 –4 0.73 0.79 0.54 0.71<br />
111 Egypt 0.547 0.612 0.671 0.673 0.681 0.686 0.688 0.691 –3 1.12 0.93 0.60 0.94<br />
111 Turkmenistan .. .. 0.665 0.672 0.678 0.683 0.688 0.691 2 .. .. 0.78 ..<br />
113 Indonesia 0.528 0.604 0.662 0.669 0.677 0.682 0.686 0.689 3 1.36 0.92 0.78 1.07<br />
114 Palestine, State of .. .. 0.669 0.674 0.684 0.678 0.678 0.684 –5 .. .. 0.45 ..<br />
115 Viet Nam 0.477 0.576 0.655 0.662 0.668 0.675 0.678 0.683 2 1.92 1.29 0.85 1.45<br />
116 Philippines 0.586 0.622 0.669 0.666 0.671 0.676 0.679 0.682 –7 0.60 0.72 0.39 0.61<br />
117 El Salvador 0.529 0.615 0.666 0.670 0.675 0.676 0.678 0.680 –6 1.52 0.80 0.41 1.01<br />
118 Bolivia (Plurinational State of) 0.535 0.607 0.649 0.655 0.661 0.666 0.671 0.674 0 1.26 0.66 0.77 0.92<br />
119 South Africa 0.621 0.629 0.638 0.644 0.652 0.660 0.665 0.666 2 0.13 0.14 0.89 0.28<br />
120 Kyrgyzstan 0.615 0.593 0.632 0.638 0.647 0.656 0.662 0.664 3 –0.37 0.65 0.98 0.30<br />
121 Iraq 0.572 0.607 0.649 0.656 0.659 0.658 0.649 0.649 –3 0.59 0.67 0.01 0.51<br />
122 Cabo Verde .. 0.562 0.632 0.636 0.643 0.643 0.646 0.648 1 .. 1.19 0.50 ..<br />
123 Morocco 0.458 0.530 0.612 0.623 0.634 0.640 0.645 0.647 4 1.46 1.47 1.12 1.39<br />
TABLE<br />
2<br />
TABLE 2 <strong>Human</strong> <strong>Development</strong> Index trends, 1990–2015 | 203
TABLE 2 HUMAN DEVELOPMENT INDEX TRENDS, 1990–2015<br />
TABLE<br />
2<br />
<strong>Human</strong> <strong>Development</strong> Index (HDI)<br />
Change in<br />
HDI rank<br />
Average annual HDI growth<br />
Value (%)<br />
HDI rank 1990 2000 2010 2011 2012 2013 2014 2015 2010–2015 a 1990–2000 2000–2010 2010–2015 1990–2015<br />
124 Nicaragua 0.495 0.570 0.620 0.625 0.630 0.636 0.642 0.645 2 1.42 0.83 0.82 1.06<br />
125 Guatemala 0.478 0.546 0.609 0.616 0.611 0.614 0.637 0.640 5 1.34 1.09 1.00 1.17<br />
125 Namibia 0.578 0.556 0.612 0.619 0.625 0.632 0.637 0.640 2 –0.39 0.96 0.91 0.41<br />
127 Guyana 0.541 0.606 0.624 0.630 0.633 0.636 0.638 0.638 –2 1.14 0.29 0.45 0.66<br />
127 Micronesia (Federated States of) .. 0.604 0.638 0.640 0.641 0.639 0.637 0.638 –6 .. 0.56 –0.01 ..<br />
129 Tajikistan 0.616 0.535 0.608 0.613 0.617 0.622 0.625 0.627 2 –1.39 1.28 0.64 0.08<br />
130 Honduras 0.507 0.557 0.611 0.614 0.614 0.618 0.623 0.625 –1 0.94 0.94 0.45 0.84<br />
131 India 0.428 0.494 0.580 0.590 0.599 0.607 0.615 0.624 4 1.45 1.62 1.46 1.52<br />
132 Bhutan .. .. 0.572 0.581 0.589 0.596 0.604 0.607 5 .. .. 1.19 ..<br />
133 Timor-Leste .. 0.470 0.607 0.618 0.620 0.612 0.603 0.605 –1 .. 2.57 –0.03 ..<br />
134 Vanuatu .. .. 0.591 0.592 0.591 0.596 0.598 0.597 –1 .. .. 0.20 ..<br />
135 Congo 0.521 0.487 0.558 0.557 0.576 0.581 0.589 0.592 3 –0.67 1.38 1.20 0.52<br />
135 Equatorial Guinea .. 0.527 0.580 0.582 0.586 0.582 0.582 0.592 0 .. 0.96 0.44 ..<br />
137 Kiribati .. .. 0.585 0.581 0.589 0.597 0.586 0.588 –3 .. .. 0.10 ..<br />
138 Lao People’s Democratic Republic 0.397 0.463 0.542 0.554 0.563 0.573 0.582 0.586 5 1.54 1.59 1.59 1.57<br />
139 Bangladesh 0.386 0.468 0.545 0.557 0.565 0.570 0.575 0.579 2 1.95 1.54 1.21 1.64<br />
139 Ghana 0.455 0.485 0.554 0.563 0.570 0.576 0.575 0.579 0 0.63 1.34 0.88 0.97<br />
139 Zambia 0.398 0.424 0.543 0.554 0.565 0.570 0.576 0.579 3 0.64 2.50 1.30 1.51<br />
142 Sao Tome and Principe 0.454 0.497 0.546 0.553 0.559 0.562 0.565 0.574 –2 0.91 0.94 1.00 0.94<br />
143 Cambodia 0.357 0.412 0.533 0.540 0.546 0.553 0.558 0.563 1 1.46 2.61 1.09 1.84<br />
144 Nepal 0.378 0.446 0.529 0.538 0.545 0.551 0.555 0.558 2 1.66 1.73 1.07 1.57<br />
145 Myanmar 0.353 0.427 0.526 0.533 0.540 0.547 0.552 0.556 2 1.90 2.12 1.10 1.83<br />
146 Kenya 0.473 0.447 0.530 0.536 0.541 0.546 0.550 0.555 –1 –0.57 1.72 0.90 0.64<br />
147 Pakistan 0.404 0.450 0.525 0.529 0.538 0.542 0.548 0.550 2 1.09 1.55 0.95 1.24<br />
LOW HUMAN DEVELOPMENT<br />
148 Swaziland 0.548 0.506 0.526 0.534 0.539 0.541 0.541 0.541 –1 –0.78 0.38 0.57 –0.05<br />
149 Syrian Arab Republic 0.556 0.589 0.646 0.645 0.635 0.575 0.553 0.536 –29 0.58 0.94 –3.68 –0.15<br />
150 Angola .. 0.391 0.495 0.508 0.523 0.527 0.531 0.533 4 .. 2.38 1.49 ..<br />
151 Tanzania (United Republic of) 0.370 0.391 0.498 0.504 0.513 0.512 0.519 0.531 1 0.57 2.45 1.27 1.46<br />
152 Nigeria .. .. 0.500 0.507 0.514 0.521 0.525 0.527 –1 .. .. 1.08 ..<br />
153 Cameroon 0.444 0.437 0.486 0.496 0.501 0.507 0.514 0.518 5 –0.15 1.06 1.27 0.61<br />
154 Papua New Guinea 0.360 0.422 0.494 0.501 0.506 0.511 0.515 0.516 1 1.60 1.57 0.90 1.45<br />
154 Zimbabwe 0.499 0.427 0.452 0.464 0.488 0.498 0.507 0.516 15 –1.55 0.57 2.67 0.13<br />
156 Solomon Islands .. 0.442 0.497 0.505 0.509 0.512 0.513 0.515 –3 .. 1.19 0.71 ..<br />
157 Mauritania 0.378 0.444 0.487 0.491 0.501 0.509 0.513 0.513 0 1.62 0.94 1.04 1.23<br />
158 Madagascar .. 0.456 0.504 0.506 0.508 0.509 0.511 0.512 –8 .. 1.01 0.33 ..<br />
159 Rwanda 0.244 0.332 0.464 0.475 0.485 0.488 0.493 0.498 4 3.14 3.39 1.40 2.89<br />
160 Comoros .. .. 0.479 0.484 0.490 0.497 0.498 0.497 –1 .. .. 0.78 ..<br />
160 Lesotho 0.493 0.443 0.469 0.479 0.484 0.491 0.495 0.497 2 –1.06 0.56 1.20 0.04<br />
162 Senegal 0.367 0.381 0.455 0.463 0.474 0.483 0.491 0.494 4 0.37 1.80 1.65 1.20<br />
163 Haiti 0.408 0.443 0.470 0.477 0.483 0.487 0.490 0.493 –2 0.82 0.60 0.96 0.76<br />
163 Uganda 0.309 0.396 0.477 0.477 0.478 0.483 0.488 0.493 –3 2.51 1.88 0.66 1.88<br />
165 Sudan 0.331 0.399 0.463 0.468 0.478 0.485 0.488 0.490 –1 1.89 1.49 1.15 1.58<br />
166 Togo 0.404 0.426 0.457 0.464 0.470 0.475 0.484 0.487 –1 0.53 0.69 1.32 0.75<br />
167 Benin 0.345 0.395 0.454 0.458 0.466 0.475 0.481 0.485 0 1.38 1.40 1.32 1.37<br />
168 Yemen 0.405 0.444 0.493 0.494 0.498 0.500 0.499 0.482 –12 0.91 1.06 –0.44 0.70<br />
169 Afghanistan 0.295 0.340 0.454 0.463 0.470 0.476 0.479 0.479 –2 1.43 2.95 1.08 1.97<br />
170 Malawi 0.325 0.387 0.444 0.454 0.459 0.466 0.473 0.476 1 1.74 1.40 1.38 1.53<br />
171 Côte d’Ivoire 0.389 0.395 0.441 0.444 0.452 0.459 0.466 0.474 1 0.16 1.11 1.43 0.79<br />
172 Djibouti .. 0.363 0.451 0.460 0.464 0.467 0.470 0.473 –2 .. 2.19 0.98 ..<br />
173 Gambia 0.330 0.384 0.441 0.440 0.445 0.449 0.450 0.452 –1 1.54 1.40 0.46 1.27<br />
174 Ethiopia .. 0.283 0.411 0.422 0.427 0.435 0.441 0.448 1 .. 3.79 1.71 ..<br />
175 Mali 0.222 0.297 0.404 0.411 0.421 0.430 0.438 0.442 4 2.94 3.14 1.82 2.80<br />
176 Congo (Democratic Republic of the) 0.356 0.331 0.398 0.407 0.412 0.419 0.425 0.435 4 –0.73 1.89 1.79 0.81<br />
177 Liberia .. 0.386 0.406 0.416 0.419 0.425 0.427 0.427 0 .. 0.51 1.00 ..<br />
178 Guinea-Bissau .. .. 0.410 0.416 0.415 0.419 0.421 0.424 –2 .. .. 0.67 ..<br />
179 Eritrea .. .. 0.405 0.410 0.414 0.416 0.418 0.420 –1 .. .. 0.74 ..<br />
179 Sierra Leone 0.272 0.302 0.392 0.401 0.413 0.426 0.431 0.420 3 1.04 2.65 1.39 1.75<br />
181 Mozambique 0.209 0.298 0.397 0.400 0.405 0.409 0.414 0.418 0 3.63 2.90 1.03 2.82<br />
181 South Sudan .. .. 0.429 0.419 0.417 0.421 0.421 0.418 –7 .. .. –0.49 ..<br />
183 Guinea 0.271 0.322 0.385 0.396 0.406 0.412 0.414 0.414 0 1.74 1.80 1.45 1.71<br />
184 Burundi 0.270 0.268 0.385 0.393 0.398 0.404 0.406 0.404 –1 –0.06 3.67 0.97 1.62<br />
185 Burkina Faso .. .. 0.377 0.384 0.391 0.398 0.399 0.402 0 .. .. 1.27 ..<br />
204 | HUMAN DEVELOPMENT REPORT <strong>2016</strong>
HUMAN DEVELOPMENT REPORT <strong>2016</strong><br />
<strong>Human</strong> <strong>Development</strong> for Everyone<br />
<strong>Human</strong> <strong>Development</strong> Index (HDI)<br />
Change in<br />
HDI rank<br />
Average annual HDI growth<br />
Value (%)<br />
HDI rank 1990 2000 2010 2011 2012 2013 2014 2015 2010–2015 a 1990–2000 2000–2010 2010–2015 1990–2015<br />
186 Chad .. 0.300 0.370 0.381 0.387 0.390 0.394 0.396 0 .. 2.13 1.37 ..<br />
187 Niger 0.212 0.255 0.323 0.331 0.341 0.345 0.351 0.353 1 1.85 2.41 1.76 2.06<br />
188 Central African Republic 0.320 0.314 0.361 0.366 0.370 0.345 0.347 0.352 –1 –0.19 1.41 –0.47 0.39<br />
OTHER COUNTRIES OR TERRITORIES<br />
Korea (Democratic People’s Rep. of) .. .. .. .. .. .. .. .. .. .. .. .. ..<br />
Marshall Islands .. .. .. .. .. .. .. .. .. .. .. .. ..<br />
Monaco .. .. .. .. .. .. .. .. .. .. .. .. ..<br />
Nauru .. .. .. .. .. .. .. .. .. .. .. .. ..<br />
San Marino .. .. .. .. .. .. .. .. .. .. .. .. ..<br />
Somalia .. .. .. .. .. .. .. .. .. .. .. .. ..<br />
Tuvalu .. .. .. .. .. .. .. .. .. .. .. .. ..<br />
<strong>Human</strong> development groups<br />
Very high human development 0.791 0.836 0.876 0.881 0.884 0.887 0.890 0.892 — 0.55 0.48 0.35 0.48<br />
High human development 0.574 0.637 0.716 0.721 0.728 0.736 0.744 0.746 — 1.04 1.19 0.83 1.06<br />
Medium human development 0.465 0.525 0.598 0.606 0.613 0.620 0.626 0.631 — 1.23 1.31 1.09 1.23<br />
Low human development 0.356 0.388 0.475 0.481 0.486 0.490 0.494 0.497 — 0.89 2.02 0.92 1.35<br />
Developing countries 0.514 0.569 0.640 0.646 0.653 0.659 0.665 0.668 — 1.02 1.18 0.85 1.05<br />
Regions<br />
Arab States 0.556 0.611 0.672 0.677 0.684 0.685 0.686 0.687 — 0.96 0.95 0.45 0.85<br />
East Asia and the Pacific 0.516 0.595 0.688 0.692 0.700 0.709 0.717 0.720 — 1.45 1.45 0.92 1.35<br />
Europe and Central Asia 0.652 0.667 0.732 0.741 0.745 0.750 0.754 0.756 — 0.23 0.95 0.63 0.59<br />
Latin America and the Caribbean 0.626 0.685 0.730 0.735 0.739 0.745 0.750 0.751 — 0.92 0.63 0.58 0.74<br />
South Asia 0.438 0.502 0.583 0.592 0.601 0.607 0.614 0.621 — 1.38 1.51 1.25 1.40<br />
Sub-Saharan Africa 0.399 0.421 0.497 0.504 0.510 0.515 0.520 0.523 — 0.54 1.67 1.04 1.09<br />
Least developed countries 0.347 0.399 0.481 0.489 0.495 0.500 0.504 0.508 — 1.40 1.90 1.08 1.54<br />
Small island developing states 0.570 0.604 0.656 0.658 0.661 0.663 0.665 0.667 — 0.59 0.83 0.33 0.63<br />
Organisation for Economic<br />
Co‐operation and <strong>Development</strong> 0.785 0.835 0.872 0.876 0.879 0.882 0.885 0.887 — 0.62 0.44 0.33 0.49<br />
World 0.597 0.641 0.696 0.701 0.706 0.710 0.715 0.717 — 0.71 0.82 0.61 0.74<br />
TABLE<br />
2<br />
NOTES<br />
a A positive value indicates an improvement in rank.<br />
DEFINITIONS<br />
<strong>Human</strong> <strong>Development</strong> Index (HDI): A composite<br />
index measuring average achievement in three basic<br />
dimensions of human development — a long and<br />
healthy life, knowledge and a decent standard of<br />
living. See Technical note 1 at http://hdr.undp.org/<br />
sites/default/files/hdr<strong>2016</strong>_technical_notes.pdf for<br />
details on how the HDI is calculated.<br />
Average annual HDI growth: A smoothed<br />
annualized growth of the HDI in a given period,<br />
calculated as the annual compound growth rate.<br />
MAIN DATA SOURCES<br />
Columns 1–8: HDRO calculations based on data<br />
from UNDESA (2015a), UNESCO Institute for<br />
Statistics (<strong>2016</strong>), United Nations Statistics Division<br />
(<strong>2016</strong>a), World Bank (<strong>2016</strong>a), Barro and Lee (<strong>2016</strong>)<br />
and IMF (<strong>2016</strong>).<br />
Column 9: Calculated based on data in columns<br />
3 and 8.<br />
Columns 10–13: Calculated based on data in<br />
columns 1, 2, 3 and 8.<br />
TABLE 2 <strong>Human</strong> <strong>Development</strong> Index trends, 1990–2015 | 205
TABLE<br />
3<br />
Inequality-adjusted <strong>Human</strong> <strong>Development</strong> Index<br />
<strong>Human</strong><br />
<strong>Development</strong><br />
Index (HDI)<br />
Value<br />
Value<br />
Inequality-adjusted<br />
HDI (IHDI)<br />
Overall<br />
loss (%)<br />
Coefficient<br />
of human<br />
inequality<br />
Inequality<br />
in life<br />
expectancy<br />
Inequalityadjusted<br />
life Inequality<br />
expectancy in<br />
index<br />
Inequality<br />
in<br />
income a<br />
Inequalityadjusted<br />
education<br />
education a index<br />
Inequalityadjusted<br />
income<br />
index<br />
Difference<br />
from HDI<br />
rank b (%) Value (%) Value (%) Value<br />
Quintile<br />
ratio<br />
Income inequality<br />
Palma<br />
ratio<br />
Gini<br />
coefficient<br />
TABLE<br />
3<br />
HDI rank 2015 2015 2015 2015 2015 2010–2015 c 2015 2015 d 2015 2015 d 2015 2010–2015 e 2010–2015 e 2010–2015 e<br />
VERY HIGH HUMAN DEVELOPMENT<br />
1 Norway 0.949 0.898 5.4 0 5.4 3.3 0.918 2.4 0.894 10.4 0.882 3.8 0.9 25.9<br />
2 Australia 0.939 0.861 8.2 –1 8.0 4.3 0.921 1.9 0.921 17.7 0.753 6.0 1.4 34.9<br />
2 Switzerland 0.939 0.859 8.6 –4 8.4 3.8 0.934 5.7 0.840 15.7 0.806 4.9 1.2 31.6<br />
4 Germany 0.926 0.859 7.2 –1 7.0 3.7 0.905 2.6 0.891 14.8 0.787 4.6 1.1 30.1<br />
5 Denmark 0.925 0.858 7.2 –2 7.0 3.8 0.894 3.0 0.896 14.3 0.789 4.5 1.0 29.1<br />
5 Singapore 0.925 .. .. .. .. 3.0 0.943 .. .. .. .. .. .. ..<br />
7 Netherlands 0.924 0.861 6.9 2 6.8 3.7 0.914 4.2 0.859 12.4 0.812 4.2 1.0 28.0<br />
8 Ireland 0.923 0.850 7.9 –2 7.7 3.7 0.905 3.0 0.883 16.3 0.769 5.3 1.3 32.5<br />
9 Iceland 0.921 0.868 5.8 6 5.7 2.9 0.937 2.5 0.884 11.7 0.789 4.0 1.0 26.9<br />
10 Canada 0.920 0.839 8.9 –2 8.7 4.7 0.912 3.9 0.856 17.4 0.755 5.8 1.3 33.7<br />
10 United States 0.920 0.796 13.5 –10 12.9 6.1 0.856 5.6 0.850 27.0 0.692 9.1 2.0 41.1<br />
12 Hong Kong, China (SAR) 0.917 .. .. .. .. 2.8 0.959 .. .. .. .. .. .. ..<br />
13 New Zealand 0.915 .. .. .. .. 4.6 0.910 .. .. .. .. .. .. ..<br />
14 Sweden 0.913 0.851 6.7 3 6.6 3.3 0.928 3.4 0.826 13.1 0.806 4.2 0.9 27.3<br />
15 Liechtenstein 0.912 .. .. .. .. .. .. .. .. .. .. .. .. ..<br />
16 United Kingdom 0.909 0.836 8.0 –1 7.8 4.5 0.894 2.8 0.871 16.2 0.752 5.3 1.3 32.6<br />
17 Japan 0.903 0.791 12.4 –8 12.2 3.2 0.948 19.8 0.675 13.5 0.774 5.4 f 1.2 f 32.1 f<br />
18 Korea (Republic of) 0.901 0.753 16.4 –19 15.9 3.7 0.920 25.5 0.645 18.4 0.720 .. .. ..<br />
19 Israel 0.899 0.778 13.5 –11 12.9 3.9 0.925 8.4 0.796 26.4 0.639 10.3 2.2 42.8<br />
20 Luxembourg 0.898 0.827 8.0 1 7.8 2.6 0.927 5.8 0.738 15.1 0.826 5.9 1.4 34.8<br />
21 France 0.897 0.813 9.4 –1 9.3 4.0 0.921 7.5 0.776 16.3 0.752 5.3 1.3 33.1<br />
22 Belgium 0.896 0.821 8.3 2 8.3 4.0 0.901 8.1 0.773 12.7 0.794 4.2 1.0 27.6<br />
23 Finland 0.895 0.843 5.8 9 5.7 3.4 0.907 2.0 0.830 11.6 0.796 3.9 1.0 27.1<br />
24 Austria 0.893 0.815 8.7 3 8.5 3.7 0.912 4.3 0.785 17.5 0.757 4.9 1.1 30.5<br />
25 Slovenia 0.890 0.838 5.9 9 5.8 3.6 0.898 2.6 0.863 11.3 0.758 3.7 0.9 25.6<br />
26 Italy 0.887 0.784 11.5 –3 11.2 3.0 0.945 9.9 0.734 20.8 0.696 6.7 1.4 35.2<br />
27 Spain 0.884 0.791 10.5 1 10.1 3.5 0.932 5.1 0.777 21.8 0.684 7.3 1.5 35.9<br />
28 Czech Republic 0.878 0.830 5.4 10 5.3 3.5 0.873 1.4 0.866 11.1 0.757 3.8 0.9 26.1<br />
29 Greece 0.866 0.758 12.4 –6 12.2 3.7 0.905 11.7 0.733 21.1 0.657 7.6 1.6 36.7<br />
30 Brunei Darussalam 0.865 .. .. .. .. 4.4 0.868 .. .. .. .. .. .. ..<br />
30 Estonia 0.865 0.788 8.9 3 8.6 4.8 0.835 2.3 0.856 18.7 0.684 5.7 1.3 33.2<br />
32 Andorra 0.858 .. .. .. .. .. .. .. .. .. .. .. .. ..<br />
33 Cyprus 0.856 0.762 10.9 –2 10.8 4.0 0.891 12.4 0.688 15.9 0.722 5.4 1.4 34.3<br />
33 Malta 0.856 0.786 8.1 3 8.0 4.5 0.892 6.0 0.734 13.6 0.742 .. .. ..<br />
33 Qatar 0.856 .. .. .. .. 6.1 0.843 .. .. .. .. .. .. ..<br />
36 Poland 0.855 0.774 9.5 2 9.3 5.2 0.840 5.4 0.806 17.4 0.685 5.0 1.2 32.1<br />
37 Lithuania 0.848 0.759 10.5 0 10.2 5.5 0.778 5.6 0.833 19.6 0.675 6.5 1.4 35.2<br />
38 Chile 0.847 0.692 18.2 –12 17.1 7.6 0.881 8.2 0.719 35.5 0.524 12.2 3.2 50.5<br />
38 Saudi Arabia 0.847 .. .. .. .. 11.0 0.745 .. .. .. .. .. .. ..<br />
40 Slovakia 0.845 0.793 6.1 12 6.0 5.3 0.822 1.4 0.812 11.4 0.748 4.0 0.9 26.1<br />
41 Portugal 0.843 0.755 10.4 1 10.1 3.9 0.905 5.9 0.712 20.4 0.669 6.7 1.5 36.0<br />
42 United Arab Emirates 0.840 .. .. .. .. 5.8 0.828 .. .. .. .. .. .. ..<br />
43 Hungary 0.836 0.771 7.8 6 7.6 5.2 0.807 3.1 0.808 14.6 0.704 5.0 1.1 30.6<br />
44 Latvia 0.830 0.742 10.6 –1 10.3 6.7 0.780 3.8 0.803 20.3 0.653 6.7 1.4 35.5<br />
45 Argentina 0.827 0.698 15.6 –6 15.2 10.0 0.782 8.1 0.742 27.4 0.586 10.0 2.1 42.7<br />
45 Croatia 0.827 0.752 9.1 2 8.9 4.5 0.845 4.4 0.763 17.7 0.660 5.7 1.2 32.5<br />
47 Bahrain 0.824 .. .. .. .. 6.3 0.818 .. .. .. .. .. .. ..<br />
48 Montenegro 0.807 0.736 8.8 1 8.7 5.2 0.823 7.4 0.738 13.6 0.657 4.8 1.2 31.9<br />
49 Russian Federation 0.804 0.725 9.8 1 9.6 8.8 0.705 2.2 0.798 17.7 0.678 8.2 2.0 41.6<br />
50 Romania 0.802 0.714 11.1 0 10.8 8.4 0.773 4.6 0.734 19.5 0.641 4.1 1.0 27.5<br />
51 Kuwait 0.800 .. .. .. .. 7.2 0.779 .. .. .. .. .. .. ..<br />
HIGH HUMAN DEVELOPMENT<br />
52 Belarus 0.796 0.745 6.4 6 6.4 5.8 0.746 3.7 0.804 9.7 0.689 3.9 1.0 27.2<br />
52 Oman 0.796 .. .. .. .. 7.0 0.815 .. .. .. .. .. .. ..<br />
54 Barbados 0.795 .. .. .. .. 7.8 0.791 5.5 0.730 .. .. .. .. ..<br />
54 Uruguay 0.795 0.670 15.7 –7 15.4 9.5 0.799 10.4 0.642 26.2 0.586 9.1 2.0 41.6<br />
56 Bulgaria 0.794 0.709 10.7 2 10.5 7.8 0.771 5.5 0.735 18.2 0.629 6.9 1.5 36.0<br />
56 Kazakhstan 0.794 0.714 10.1 4 10.1 11.6 0.674 5.9 0.758 12.7 0.712 3.7 0.9 26.3<br />
58 Bahamas 0.792 .. .. .. .. 9.4 0.774 .. .. .. .. .. .. ..<br />
59 Malaysia 0.789 .. .. .. .. 6.7 0.788 .. .. .. .. 11.3 f 2.6 f 46.3 f<br />
206 | HUMAN DEVELOPMENT REPORT <strong>2016</strong>
HUMAN DEVELOPMENT REPORT <strong>2016</strong><br />
<strong>Human</strong> <strong>Development</strong> for Everyone<br />
<strong>Human</strong><br />
<strong>Development</strong><br />
Index (HDI)<br />
Value<br />
Value<br />
Inequality-adjusted<br />
HDI (IHDI)<br />
Overall<br />
loss (%)<br />
Coefficient<br />
of human<br />
inequality<br />
Inequality<br />
in life<br />
expectancy<br />
Inequalityadjusted<br />
life Inequality<br />
expectancy in<br />
index<br />
Inequality<br />
in<br />
income a<br />
Inequalityadjusted<br />
education<br />
education a index<br />
Inequalityadjusted<br />
income<br />
index<br />
Difference<br />
from HDI<br />
rank b (%) Value (%) Value (%) Value<br />
Quintile<br />
ratio<br />
Income inequality<br />
Palma<br />
ratio<br />
Gini<br />
coefficient<br />
HDI rank 2015 2015 2015 2015 2015 2010–2015 c 2015 2015 d 2015 2015 d 2015 2010–2015 e 2010–2015 e 2010–2015 e<br />
60 Palau 0.788 .. .. .. .. .. .. 12.0 0.711 23.0 0.573 .. .. ..<br />
60 Panama 0.788 0.614 22.0 –19 21.0 11.5 0.786 13.6 0.597 38.0 0.493 16.4 3.4 50.7<br />
62 Antigua and Barbuda 0.786 .. .. .. .. 8.4 0.792 .. .. .. .. .. .. ..<br />
63 Seychelles 0.782 .. .. .. .. 9.0 0.746 .. .. .. .. 9.8 2.6 46.8<br />
64 Mauritius 0.781 0.669 14.4 –4 14.3 9.8 0.758 13.2 0.629 19.8 0.628 5.9 1.5 35.8<br />
65 Trinidad and Tobago 0.780 0.661 15.3 –5 15.0 16.6 0.648 6.6 0.670 21.9 0.665 .. .. ..<br />
66 Costa Rica 0.776 0.628 19.1 –9 18.2 8.2 0.842 12.4 0.599 34.1 0.492 12.8 3.0 48.5<br />
66 Serbia 0.776 0.689 11.2 3 11.1 7.9 0.780 8.1 0.698 17.4 0.600 4.4 1.1 29.1<br />
68 Cuba 0.775 .. .. .. .. 5.5 0.866 10.9 0.694 .. .. .. .. ..<br />
69 Iran (Islamic Republic of) 0.774 0.518 33.1 –40 31.5 10.6 0.764 37.3 0.441 46.6 0.412 6.6 1.6 37.4<br />
70 Georgia 0.769 0.672 12.7 3 12.2 10.3 0.759 2.2 0.777 24.1 0.514 8.2 1.9 40.1<br />
71 Turkey 0.767 0.645 15.9 –3 15.8 11.5 0.756 14.2 0.574 21.8 0.618 8.0 1.9 40.2<br />
71 Venezuela (Bolivarian Republic of) 0.767 0.618 19.4 –11 19.1 11.4 0.741 17.6 0.586 28.4 0.543 16.0 f 2.8 f 46.9 f<br />
73 Sri Lanka 0.766 0.678 11.6 8 11.5 8.1 0.778 12.8 0.656 13.7 0.610 6.6 1.8 39.2<br />
74 Saint Kitts and Nevis 0.765 .. .. .. .. .. .. .. .. .. .. .. .. ..<br />
75 Albania 0.764 0.661 13.5 4 13.4 9.9 0.804 11.9 0.630 18.3 0.571 4.3 1.0 29.0<br />
76 Lebanon 0.763 0.603 21.0 –10 20.4 7.2 0.850 24.1 0.498 30.0 0.517 .. .. ..<br />
77 Mexico 0.762 0.587 22.9 –12 22.4 13.2 0.761 19.7 0.525 34.3 0.506 10.8 2.9 48.2<br />
78 Azerbaijan 0.759 0.659 13.2 5 13.0 21.7 0.613 8.3 0.663 8.9 0.702 4.8 f 1.2 f 31.8<br />
79 Brazil 0.754 0.561 25.6 –19 25.0 14.4 0.721 22.6 0.527 37.8 0.465 15.5 3.5 51.5<br />
79 Grenada 0.754 .. .. .. .. 8.7 0.752 .. .. .. .. .. .. ..<br />
81 Bosnia and Herzegovina 0.750 0.650 13.3 6 13.1 6.7 0.813 12.5 0.607 20.2 0.556 5.7 1.3 33.8<br />
82 The former Yugoslav Republic of Macedonia 0.748 0.623 16.7 1 16.1 7.6 0.789 10.6 0.602 30.1 0.509 9.3 f 2.3 f 44.1 f<br />
83 Algeria 0.745 .. .. .. .. 18.6 0.689 .. .. .. .. .. .. ..<br />
84 Armenia 0.743 0.674 9.3 15 9.2 10.1 0.759 3.7 0.703 13.9 0.573 4.7 1.2 31.5<br />
84 Ukraine 0.743 0.690 7.2 18 7.2 8.7 0.718 3.6 0.774 9.2 0.590 3.3 0.8 24.1<br />
86 Jordan 0.741 0.619 16.5 3 16.4 11.9 0.734 16.9 0.583 20.5 0.554 .. .. ..<br />
87 Peru 0.740 0.580 21.6 –8 21.3 14.2 0.724 20.3 0.536 29.5 0.503 10.8 2.3 44.1<br />
87 Thailand 0.740 0.586 20.8 –5 20.2 10.4 0.753 16.1 0.538 34.0 0.496 6.5 1.7 37.9<br />
89 Ecuador 0.739 0.587 20.5 –1 20.2 15.1 0.733 15.5 0.562 30.1 0.492 10.5 2.5 45.4<br />
90 China 0.738 .. .. .. .. 8.9 0.784 .. .. 29.5 0.521 9.2 2.1 42.2<br />
91 Fiji 0.736 0.624 15.3 9 15.1 12.3 0.677 10.5 0.695 22.6 0.516 8.2 f 2.1 f 42.8 f<br />
92 Mongolia 0.735 0.639 13.0 13 13.0 17.1 0.635 9.4 0.668 12.3 0.616 5.0 1.2 32.0<br />
92 Saint Lucia 0.735 0.618 16.0 7 15.6 10.1 0.763 9.2 0.614 27.4 0.503 .. .. ..<br />
94 Jamaica 0.730 0.609 16.6 6 15.9 11.9 0.757 5.6 0.640 30.1 0.467 .. .. ..<br />
95 Colombia 0.727 0.548 24.6 –9 23.7 14.4 0.714 17.4 0.520 39.4 0.444 17.3 3.9 53.5<br />
96 Dominica 0.726 .. .. .. .. .. .. .. .. .. .. .. .. ..<br />
97 Suriname 0.725 0.551 24.0 –7 23.3 13.6 0.682 19.0 0.510 37.3 0.481 .. .. ..<br />
97 Tunisia 0.725 0.562 22.5 –3 21.9 12.2 0.743 34.6 0.421 18.9 0.567 6.4 1.5 35.8<br />
99 Dominican Republic 0.722 0.565 21.7 1 21.6 16.8 0.687 19.9 0.498 28.1 0.527 10.8 2.7 47.1<br />
99 Saint Vincent and the Grenadines 0.722 .. .. .. .. 12.7 0.712 .. .. .. .. .. .. ..<br />
101 Tonga 0.721 .. .. .. .. 13.6 0.704 .. .. .. .. 6.9 f 1.7 f 38.1 f<br />
102 Libya 0.716 .. .. .. .. 15.8 0.671 .. .. .. .. .. .. ..<br />
103 Belize 0.706 0.546 22.7 –6 21.8 11.6 0.681 15.9 0.592 37.9 0.403 .. .. ..<br />
104 Samoa 0.704 .. .. .. .. 13.3 0.716 .. .. .. .. 7.9 f 2.2 f 42.7 f<br />
105 Maldives 0.701 0.529 24.6 –9 23.4 7.1 0.814 40.0 0.337 23.2 0.539 7.1 f 1.7 f 38.4 f<br />
105 Uzbekistan 0.701 0.590 15.8 10 15.3 24.3 0.575 1.4 0.729 20.1 0.489 .. .. ..<br />
MEDIUM HUMAN DEVELOPMENT<br />
107 Moldova (Republic of) 0.699 0.628 10.2 21 10.1 9.0 0.724 7.3 0.672 14.0 0.509 3.8 0.9 26.8<br />
108 Botswana 0.698 0.433 37.9 –23 36.2 20.9 0.542 32.1 0.447 55.5 0.335 22.9 f 5.8 f 60.5 f<br />
109 Gabon 0.697 0.531 23.9 –3 23.8 27.6 0.501 23.5 0.473 20.4 0.631 8.4 f 2.1 f 42.2 f<br />
110 Paraguay 0.693 0.524 24.3 –5 23.5 18.3 0.666 14.0 0.527 38.3 0.410 14.7 3.5 51.7<br />
111 Egypt 0.691 0.491 29.0 –10 28.2 13.4 0.684 35.0 0.390 36.3 0.444 .. .. ..<br />
111 Turkmenistan 0.691 .. .. .. .. 26.0 0.521 .. .. .. .. .. .. ..<br />
113 Indonesia 0.689 0.563 18.2 9 18.2 16.5 0.630 20.8 0.492 17.3 0.576 6.6 1.8 39.5<br />
114 Palestine, State of 0.684 0.581 15.1 13 15.1 13.7 0.705 16.5 0.547 15.0 0.509 5.5 f 1.4 f 34.5 f<br />
115 Viet Nam 0.683 0.562 17.8 9 17.8 14.2 0.738 17.6 0.508 21.4 0.472 6.8 1.6 37.6<br />
116 Philippines 0.682 0.556 18.4 8 18.2 16.2 0.623 11.6 0.563 26.8 0.490 8.4 2.2 43.0<br />
117 El Salvador 0.680 0.529 22.2 3 22.0 13.7 0.707 26.6 0.429 25.7 0.488 8.4 2.0 41.8<br />
118 Bolivia (Plurinational State of) 0.674 0.478 29.0 –6 28.7 29.0 0.532 20.8 0.520 36.4 0.396 14.7 3.0 48.4<br />
119 South Africa 0.666 0.435 34.7 –12 32.0 25.7 0.430 13.8 0.608 56.4 0.316 27.9 7.1 63.4<br />
TABLE<br />
3<br />
TABLE 3 Inequality-adjusted <strong>Human</strong> <strong>Development</strong> Index | 207
TABLE 3 INEQUALITY-ADJUSTED HUMAN DEVELOPMENT INDEX<br />
<strong>Human</strong><br />
<strong>Development</strong><br />
Index (HDI)<br />
Value<br />
Value<br />
Inequality-adjusted<br />
HDI (IHDI)<br />
Overall<br />
loss (%)<br />
Coefficient<br />
of human<br />
inequality<br />
Inequality<br />
in life<br />
expectancy<br />
Inequalityadjusted<br />
life Inequality<br />
expectancy in<br />
index<br />
Inequality<br />
in<br />
income a<br />
Inequalityadjusted<br />
education<br />
education a index<br />
Inequalityadjusted<br />
income<br />
index<br />
Difference<br />
from HDI<br />
rank b (%) Value (%) Value (%) Value<br />
Quintile<br />
ratio<br />
Income inequality<br />
Palma<br />
ratio<br />
Gini<br />
coefficient<br />
TABLE<br />
3<br />
HDI rank 2015 2015 2015 2015 2015 2010–2015 c 2015 2015 d 2015 2015 d 2015 2010–2015 e 2010–2015 e 2010–2015 e<br />
120 Kyrgyzstan 0.664 0.582 12.3 20 12.1 13.6 0.675 5.0 0.685 17.7 0.427 3.7 1.0 26.8<br />
121 Iraq 0.649 0.505 22.3 1 22.0 19.3 0.616 30.6 0.347 16.1 0.602 .. .. ..<br />
122 Cabo Verde 0.648 0.518 20.1 4 19.9 13.4 0.713 18.2 0.436 28.0 0.446 10.7 f 2.7 f 47.2 f<br />
123 Morocco 0.647 0.456 29.5 –2 28.3 16.0 0.702 45.8 0.273 23.0 0.497 7.4 f 1.9 f 40.7 f<br />
124 Nicaragua 0.645 0.479 25.8 1 25.4 14.6 0.725 29.5 0.382 32.1 0.396 10.9 2.7 47.1<br />
125 Guatemala 0.640 0.450 29.6 –2 29.1 17.0 0.665 36.2 0.324 34.1 0.424 12.1 3.0 48.7<br />
125 Namibia 0.640 0.415 35.2 –13 33.4 21.7 0.543 25.0 0.410 53.6 0.321 20.3 f 5.8 f 61.0 f<br />
127 Guyana 0.638 0.518 18.8 10 18.5 20.7 0.567 10.5 0.508 24.4 0.483 .. .. ..<br />
127 Micronesia (Federated States of) 0.638 .. .. .. .. 19.8 0.608 .. .. .. .. 9.6 2.1 42.5<br />
129 Tajikistan 0.627 0.532 15.2 16 14.9 23.2 0.586 6.5 0.615 15.0 0.418 4.5 1.2 30.8<br />
130 Honduras 0.625 0.443 29.2 0 28.5 19.6 0.660 24.4 0.391 41.5 0.336 15.8 3.4 50.6<br />
131 India 0.624 0.454 27.2 4 26.5 24.0 0.565 39.4 0.324 16.1 0.512 5.3 1.5 35.2<br />
132 Bhutan 0.607 0.428 29.4 –3 28.4 20.7 0.608 44.8 0.250 19.6 0.517 6.8 1.8 38.8<br />
133 Timor-Leste 0.605 0.416 31.2 –5 29.9 24.4 0.564 47.6 0.259 17.8 0.495 4.6 f 1.2 f 31.6 f<br />
134 Vanuatu 0.597 0.494 17.2 12 17.1 15.4 0.678 17.5 0.434 18.5 0.410 6.6 1.6 37.2<br />
135 Congo 0.592 0.446 24.8 6 24.6 31.1 0.455 21.5 0.408 21.2 0.477 12.8 3.1 48.9<br />
135 Equatorial Guinea 0.592 .. .. .. .. 38.4 0.359 .. .. .. .. .. .. ..<br />
137 Kiribati 0.588 0.394 33.1 –7 32.0 26.1 0.526 21.4 0.464 48.4 0.250 7.2 f 1.6 f 37.6 f<br />
138 Lao People’s Democratic Republic 0.586 0.427 27.1 1 26.9 26.2 0.529 34.1 0.313 20.3 0.472 6.3 1.7 37.9<br />
139 Bangladesh 0.579 0.412 28.9 –2 28.6 20.1 0.639 37.3 0.287 28.3 0.380 4.7 1.3 32.1<br />
139 Ghana 0.579 0.391 32.5 –8 32.5 30.8 0.442 34.9 0.358 31.7 0.377 9.3 f 2.2 f 42.8 f<br />
139 Zambia 0.579 0.373 35.6 –11 34.7 33.8 0.416 21.7 0.452 48.6 0.275 16.0 4.3 55.6<br />
142 Sao Tome and Principe 0.574 0.432 24.7 7 24.7 26.9 0.524 21.4 0.400 25.8 0.384 4.7 1.1 30.8<br />
143 Cambodia 0.563 0.436 22.5 11 22.4 19.7 0.603 27.3 0.333 20.3 0.413 4.4 1.2 30.8<br />
144 Nepal 0.558 0.407 27.0 2 25.8 19.6 0.618 43.9 0.267 13.9 0.410 5.0 1.3 32.8<br />
145 Myanmar 0.556 .. .. .. .. 26.0 0.525 19.4 0.330 .. .. .. .. ..<br />
146 Kenya 0.555 0.391 29.5 –1 29.4 32.1 0.440 22.9 0.400 33.1 0.339 11.6 f 2.9 f 48.5 f<br />
147 Pakistan 0.550 0.380 30.9 –2 29.6 32.8 0.479 44.4 0.220 11.6 0.523 4.4 1.2 30.7<br />
LOW HUMAN DEVELOPMENT<br />
148 Swaziland 0.541 0.361 33.3 –5 33.1 35.0 0.289 26.8 0.399 37.6 0.408 14.2 f 3.5 f 51.5 f<br />
149 Syrian Arab Republic 0.536 0.419 21.8 10 21.4 14.5 0.653 31.5 0.286 18.3 0.394 .. .. ..<br />
150 Angola 0.533 0.336 37.0 –8 36.6 46.2 0.271 34.6 0.316 28.9 0.445 8.9 f 2.2 f 42.7 f<br />
151 Tanzania (United Republic of) 0.531 0.396 25.4 7 25.4 25.0 0.525 28.5 0.315 22.7 0.374 6.2 1.7 37.8<br />
152 Nigeria 0.527 0.328 37.8 –10 37.5 40.8 0.301 43.3 0.270 28.4 0.432 9.1 f 2.2 f 43.0 f<br />
153 Cameroon 0.518 0.348 32.8 –1 32.4 39.4 0.335 34.8 0.322 23.1 0.391 11.4 2.7 46.5<br />
154 Papua New Guinea 0.516 .. .. .. .. 26.5 0.484 11.5 0.371 .. .. 10.4 f 2.3 f 43.9 f<br />
154 Zimbabwe 0.516 0.369 28.5 2 28.1 31.2 0.415 17.4 0.450 35.8 0.268 8.5 2.2 43.2<br />
156 Solomon Islands 0.515 0.392 23.8 9 23.8 22.3 0.575 22.8 0.343 26.3 0.306 10.5 f 2.6 f 46.1 f<br />
157 Mauritania 0.513 0.347 32.4 1 31.9 33.7 0.441 40.8 0.223 21.2 0.424 5.3 1.2 32.4<br />
158 Madagascar 0.512 0.374 27.0 7 26.8 24.8 0.527 35.0 0.320 20.4 0.310 8.6 2.1 42.7<br />
159 Rwanda 0.498 0.339 31.9 1 31.8 29.8 0.483 29.3 0.301 36.4 0.267 11.0 3.2 50.4<br />
160 Comoros 0.497 0.270 45.8 –18 44.8 30.9 0.463 47.6 0.246 56.0 0.172 .. .. ..<br />
160 Lesotho 0.497 0.320 35.6 –6 34.9 33.5 0.308 24.3 0.380 47.0 0.280 20.5 4.3 54.2<br />
162 Senegal 0.494 0.331 33.1 1 32.5 25.0 0.541 44.7 0.196 27.7 0.340 7.7 1.9 40.3<br />
163 Haiti 0.493 0.298 39.6 –7 39.2 30.9 0.458 38.3 0.262 48.4 0.219 32.5 6.5 60.8<br />
163 Uganda 0.493 0.341 30.9 6 30.8 35.7 0.388 29.4 0.330 27.3 0.309 7.6 2.0 41.0<br />
165 Sudan 0.490 .. .. .. .. 31.8 0.459 42.7 0.182 .. .. 6.2 f 1.4 f 35.4 f<br />
166 Togo 0.487 0.332 31.9 5 31.6 32.4 0.418 38.9 0.299 23.5 0.293 10.7 2.6 46.0<br />
167 Benin 0.485 0.304 37.4 –3 37.1 37.0 0.385 44.8 0.228 29.4 0.318 8.4 2.2 43.4<br />
168 Yemen 0.482 0.320 33.7 0 32.7 29.4 0.478 48.1 0.182 20.6 0.376 .. .. ..<br />
169 Afghanistan 0.479 0.327 31.8 3 30.4 35.7 0.403 44.8 0.219 10.8 0.395 .. .. ..<br />
170 Malawi 0.476 0.328 31.2 5 31.1 32.7 0.454 28.2 0.320 32.5 0.242 9.6 2.6 46.1<br />
171 Côte d’Ivoire 0.474 0.294 37.8 –2 37.4 39.7 0.296 45.1 0.228 27.4 0.379 9.6 f 2.2 f 43.2 f<br />
172 Djibouti 0.473 0.310 34.6 3 33.7 32.5 0.439 47.0 0.165 21.7 0.410 10.2 2.3 44.1<br />
173 Gambia 0.452 .. .. .. .. 31.3 0.428 .. .. 26.9 0.302 .. .. ..<br />
174 Ethiopia 0.448 0.330 26.3 10 25.5 30.3 0.478 36.6 0.202 9.5 0.372 5.2 1.3 33.2<br />
175 Mali 0.442 0.293 33.7 0 32.7 40.4 0.353 41.6 0.182 16.1 0.393 5.2 f 1.3 f 33.0 f<br />
176 Congo (Democratic Republic of the) 0.435 0.297 31.9 3 31.7 39.1 0.366 27.7 0.343 28.2 0.208 8.7 2.1 42.1<br />
177 Liberia 0.427 0.284 33.4 1 32.9 33.1 0.424 42.9 0.242 22.7 0.224 6.7 f 1.6 f 36.5 f<br />
178 Guinea-Bissau 0.424 0.257 39.3 –5 39.1 44.6 0.302 40.3 0.211 32.5 0.267 12.6 3.3 50.7<br />
179 Eritrea 0.420 .. .. .. .. 25.9 0.504 .. .. .. .. .. .. ..<br />
208 | HUMAN DEVELOPMENT REPORT <strong>2016</strong>
HUMAN DEVELOPMENT REPORT <strong>2016</strong><br />
<strong>Human</strong> <strong>Development</strong> for Everyone<br />
<strong>Human</strong><br />
<strong>Development</strong><br />
Index (HDI)<br />
Value<br />
Value<br />
Inequality-adjusted<br />
HDI (IHDI)<br />
Overall<br />
loss (%)<br />
Coefficient<br />
of human<br />
inequality<br />
Inequality<br />
in life<br />
expectancy<br />
Inequalityadjusted<br />
life Inequality<br />
expectancy in<br />
index<br />
Inequality<br />
in<br />
income a<br />
Inequalityadjusted<br />
education<br />
education a index<br />
Inequalityadjusted<br />
income<br />
index<br />
Difference<br />
from HDI<br />
rank b (%) Value (%) Value (%) Value<br />
Quintile<br />
ratio<br />
Income inequality<br />
Palma<br />
ratio<br />
Gini<br />
coefficient<br />
HDI rank 2015 2015 2015 2015 2015 2010–2015 c 2015 2015 d 2015 2015 d 2015 2010–2015 e 2010–2015 e 2010–2015 e<br />
179 Sierra Leone 0.420 0.262 37.8 –3 36.6 43.4 0.273 47.3 0.197 19.2 0.333 5.4 1.4 34.0<br />
181 Mozambique 0.418 0.280 33.0 3 32.9 36.4 0.347 33.8 0.244 28.4 0.259 9.9 f 2.5 f 45.6 f<br />
181 South Sudan 0.418 .. .. .. .. 40.7 0.330 39.6 0.180 .. .. 13.1 f 2.7 f 46.3 f<br />
183 Guinea 0.414 0.270 34.8 2 33.6 35.4 0.390 48.3 0.171 17.1 0.296 5.5 1.3 33.7<br />
184 Burundi 0.404 0.276 31.5 4 30.6 40.8 0.338 36.9 0.249 14.1 0.251 4.8 f 1.3 f 33.4 f<br />
185 Burkina Faso 0.402 0.267 33.6 2 33.3 37.1 0.377 38.6 0.161 24.2 0.313 5.3 1.5 35.3<br />
186 Chad 0.396 0.238 39.9 –1 39.6 46.2 0.264 41.9 0.163 30.7 0.313 10.0 2.2 43.3<br />
187 Niger 0.353 0.253 28.3 1 27.5 35.3 0.417 35.0 0.134 12.3 0.290 5.4 1.4 34.0<br />
188 Central African Republic 0.352 0.199 43.5 0 43.1 45.7 0.263 34.5 0.221 49.2 0.136 18.3 f 4.5 f 56.2 f<br />
OTHER COUNTRIES OR TERRITORIES<br />
Korea (Democratic People’s Rep. of) .. .. .. .. .. 15.4 0.658 .. .. .. .. .. .. ..<br />
Marshall Islands .. .. .. .. .. .. .. .. .. .. .. .. .. ..<br />
Monaco .. .. .. .. .. .. .. .. .. .. .. .. .. ..<br />
Nauru .. .. .. .. .. .. .. .. .. .. .. .. .. ..<br />
San Marino .. .. .. .. .. .. .. .. .. .. .. .. .. ..<br />
Somalia .. .. .. .. .. 42.1 0.318 43.5 .. .. .. .. .. ..<br />
Tuvalu .. .. .. .. .. .. .. 10.5 .. .. .. 7.7 1.9 41.1<br />
<strong>Human</strong> development groups<br />
Very high human development 0.892 0.793 11.1 — 10.9 5.4 0.865 7.2 0.797 19.9 0.723 — — —<br />
High human development 0.746 0.597 20.0 — 19.6 10.5 0.764 18.3 0.535 30.0 0.521 — — —<br />
Medium human development 0.631 0.469 25.7 — 25.5 22.6 0.578 33.7 0.357 20.1 0.500 — — —<br />
Low human development 0.497 0.337 32.3 — 32.0 35.1 0.392 37.1 0.258 23.9 0.377 — — —<br />
Developing countries 0.668 0.499 25.2 — 25.1 19.6 0.619 31.0 0.391 24.7 0.515 — — —<br />
Regions<br />
Arab States 0.687 0.498 27.5 — 27.1 17.9 0.642 37.1 0.347 26.2 0.556 — — —<br />
East Asia and the Pacific 0.720 0.581 19.3 — 19.0 11.2 0.740 18.3 0.505 27.4 0.526 — — —<br />
Europe and Central Asia 0.756 0.660 12.7 — 12.6 13.2 0.702 7.9 0.670 16.7 0.611 — — —<br />
Latin America and the Caribbean 0.751 0.575 23.4 — 22.9 14.0 0.730 19.7 0.537 34.9 0.486 — — —<br />
South Asia 0.621 0.449 27.7 — 27.1 23.9 0.570 39.5 0.314 17.8 0.504 — — —<br />
Sub-Saharan Africa 0.523 0.355 32.2 — 32.1 34.9 0.389 34.0 0.297 27.4 0.386 — — —<br />
Least developed countries 0.508 0.356 30.0 — 29.8 30.5 0.466 35.3 0.264 23.6 0.366 — — —<br />
Small island developing states 0.667 0.500 25.1 — 24.7 19.2 0.625 20.7 0.469 34.3 0.426 — — —<br />
Organisation for Economic<br />
Co‐operation and <strong>Development</strong> 0.887 0.776 12.6 — 12.3 5.9 0.873 9.5 0.758 21.5 0.704 — — —<br />
World 0.717 0.557 22.3 — 22.3 17.1 0.658 25.9 0.458 23.8 0.573 — — —<br />
TABLE<br />
3<br />
NOTES<br />
a See http://hdr.undp.org/en/composite/IHDI for<br />
the list of surveys used to estimate inequalities.<br />
b Based on countries for which an Inequality-adjusted<br />
<strong>Human</strong> <strong>Development</strong> Index value is calculated.<br />
c Calculated by HDRO from the 2010–2015 period<br />
life tables from UNDESA (2015a).<br />
d Data refer to 2015 or the most recent year available.<br />
e Data refer to the most recent year available<br />
during the period specified.<br />
f Data refer to a year earlier than 2010.<br />
DEFINITIONS<br />
<strong>Human</strong> <strong>Development</strong> Index (HDI): A composite<br />
index measuring average achievement in three basic<br />
dimensions of human development — a long and<br />
healthy life, knowledge and a decent standard of<br />
living. See Technical note 1 at http://hdr.undp.org/<br />
sites/default/files/hdr<strong>2016</strong>_technical_notes.pdf for<br />
details on how the HDI is calculated.<br />
Inequality-adjusted HDI (IHDI): HDI value adjusted<br />
for inequalities in the three basic dimensions of<br />
human development. See Technical note 2 at http://<br />
hdr.undp.org/sites/default/files/hdr<strong>2016</strong>_technical_<br />
notes.pdf for details on how the IHDI is calculated.<br />
Overall loss: Percentage difference between the<br />
IHDI value and the HDI value.<br />
Difference from HDI rank: Difference in ranks on<br />
the IHDI and the HDI, calculated only for countries<br />
for which an IHDI value is calculated.<br />
Coefficient of human inequality: Average inequality<br />
in three basic dimensions of human development.<br />
Inequality in life expectancy: Inequality in<br />
distribution of expected length of life based on<br />
data from life tables estimated using the Atkinson<br />
inequality index.<br />
Inequality-adjusted life expectancy index: HDI<br />
life expectancy index value adjusted for inequality in<br />
distribution of expected length of life based on data<br />
from life tables listed in Main data sources.<br />
Inequality in education: Inequality in distribution<br />
of years of schooling based on data from household<br />
surveys estimated using the Atkinson inequality index.<br />
Inequality-adjusted education index: HDI<br />
education index value adjusted for inequality in<br />
distribution of years of schooling based on data from<br />
household surveys listed in Main data sources.<br />
Inequality in income: Inequality in income<br />
distribution based on data from household surveys<br />
estimated using the Atkinson inequality index.<br />
Inequality-adjusted income index: HDI income<br />
index value adjusted for inequality in income<br />
distribution based on data from household surveys<br />
listed in Main data sources.<br />
Quintile ratio: Ratio of the average income of the<br />
richest 20 percent of the population to the average<br />
income of the poorest 20 percent of the population.<br />
Palma ratio: Ratio of the richest 10 percent of the<br />
population’s share of gross national income (GNI)<br />
divided by the poorest 40 percent’s share. It is based<br />
on the work of Palma (2011).<br />
Gini coefficient: Measure of the deviation of<br />
the distribution of income among individuals or<br />
households within a country from a perfectly equal<br />
distribution. A value of 0 represents absolute<br />
equality, a value of 100 absolute inequality.<br />
MAIN DATA SOURCES<br />
Column 1: HDRO calculations based on data from<br />
UNDESA (2015a), UNESCO Institute for Statistics (<strong>2016</strong>),<br />
United Nations Statistics Division (<strong>2016</strong>a), World Bank<br />
(<strong>2016</strong>a), Barro and Lee (<strong>2016</strong>) and IMF (<strong>2016</strong>).<br />
Column 2: Calculated as the geometric mean of the<br />
values in inequality-adjusted life expectancy index,<br />
inequality-adjusted education index and inequalityadjusted<br />
income index using the methodology in<br />
Technical note 2 (available at http://hdr.undp.org/<br />
sites/default/files/hdr<strong>2016</strong>_technical_notes.pdf).<br />
Column 3: Calculated based on data in columns 1 and 2.<br />
Column 4: Calculated based on IHDI values and<br />
recalculated HDI ranks for countries for which an IHDI<br />
value is calculated.<br />
Column 5: Calculated as the arithmetic mean of the<br />
values in inequality in life expectancy, inequality<br />
in education and inequality in income using the<br />
methodology in Technical note 2 (available at http://<br />
hdr.undp.org/sites/default/files/hdr<strong>2016</strong>_technical_<br />
notes.pdf).<br />
Column 6: Calculated based on abridged life tables<br />
from UNDESA (2015a).<br />
Column 7: Calculated based on inequality in life<br />
expectancy and the HDI life expectancy index.<br />
Columns 8 and 10: Calculated based on data from<br />
the Luxembourg Income Study database, Eurostat’s<br />
European Union Statistics on Income and Living<br />
Conditions, the World Bank’s International Income<br />
Distribution Database, ICF Macro Demographic<br />
and Health Surveys and United Nations Children’s<br />
Fund Multiple Indicator Cluster Surveys using the<br />
methodology in Technical note 2 (available at http://<br />
hdr.undp.org/sites/default/files/hdr<strong>2016</strong>_technical_<br />
notes.pdf).<br />
Column 9: Calculated based on inequality in<br />
education and the HDI education index.<br />
Column 11: Calculated based on inequality in<br />
income and the HDI income index.<br />
Columns 12 and 13: HDRO calculations based on<br />
data from World Bank (<strong>2016</strong>a).<br />
Column 14: World Bank (<strong>2016</strong>a).<br />
TABLE 3 Inequality-adjusted <strong>Human</strong> <strong>Development</strong> Index | 209
TABLE<br />
4<br />
Gender <strong>Development</strong> Index<br />
Gender <strong>Development</strong><br />
Index<br />
<strong>Human</strong> <strong>Development</strong><br />
Index (HDI)<br />
Life expectancy<br />
at birth<br />
Expected years<br />
of schooling<br />
Mean years<br />
of schooling<br />
Estimated gross national<br />
income per capita a<br />
Value Group b Value (years) (years) (years) (2011 PPP $)<br />
Female Male Female Male Female Male Female Male Female Male<br />
TABLE<br />
4<br />
HDI rank 2015 2015 2015 2015 2015 2015 2015 c 2015 c 2015 c 2015 c 2015 2015<br />
VERY HIGH HUMAN DEVELOPMENT<br />
1 Norway 0.993 1 0.944 0.951 83.7 79.7 18.3 17.1 12.8 12.7 59,800 75,314<br />
2 Australia 0.978 1 0.927 0.948 84.6 80.5 20.9 d 20.0 d 13.4 13.0 34,271 51,386<br />
2 Switzerland 0.974 2 0.926 0.951 85.1 81.0 16.0 16.1 13.3 13.5 46,798 66,116<br />
4 Germany 0.964 2 0.908 0.942 83.4 78.7 16.9 17.3 12.9 e 13.6 e 35,878 54,440<br />
5 Denmark 0.970 2 0.910 0.938 82.3 78.5 20.0 d 18.4 d 12.6 12.9 36,857 52,293<br />
5 Singapore 0.985 1 0.913 0.927 86.2 80.1 15.5 15.3 11.1 f 12.1 f 60,787 96,001 g<br />
7 Netherlands 0.946 3 0.895 0.946 83.5 79.9 18.2 d 18.1 d 11.6 12.2 30,117 62,773<br />
8 Ireland 0.976 1 0.909 0.931 83.1 79.0 18.6 d 18.6 d 12.5 11.9 33,497 54,135<br />
9 Iceland 0.965 2 0.905 0.938 84.2 81.2 20.1 d 17.9 12.2 e 12.6 e 30,530 43,576<br />
10 Canada 0.983 1 0.911 0.926 84.1 80.2 16.8 15.9 13.3 h 12.9 h 33,288 52,026<br />
10 United States 0.993 1 0.915 0.922 81.6 76.9 17.3 15.8 13.2 13.2 42,272 64,410<br />
12 Hong Kong, China (SAR) 0.964 2 0.903 0.937 87.0 81.4 15.8 15.5 11.5 12.4 39,525 70,921<br />
13 New Zealand 0.963 2 0.896 0.930 83.7 80.3 20.0 d 18.5 d 12.6 12.5 24,413 41,718<br />
14 Sweden 0.997 1 0.909 0.911 84.0 80.6 16.6 15.1 12.4 12.2 40,328 52,181<br />
15 Liechtenstein .. .. .. .. .. .. 13.5 15.9 .. .. .. ..<br />
16 United Kingdom 0.964 2 0.890 0.924 82.7 78.9 16.7 15.9 13.2 13.4 26,324 49,872<br />
17 Japan 0.970 2 0.887 0.914 86.9 80.4 15.2 15.5 12.6 e 12.4 e 25,385 49,818<br />
18 Korea (Republic of) 0.929 3 0.863 0.929 85.2 78.8 15.8 17.3 11.5 12.9 21,308 47,934<br />
19 Israel 0.973 2 0.884 0.909 84.2 80.8 16.5 15.5 12.8 12.7 23,323 39,239<br />
20 Luxembourg 0.966 2 0.881 0.911 84.1 79.6 14.0 13.7 11.6 12.3 47,539 77,291 g<br />
21 France 0.988 1 0.892 0.902 85.2 79.4 16.6 15.9 11.5 11.8 31,742 44,776<br />
22 Belgium 0.978 1 0.881 0.901 83.4 78.5 16.7 15.9 11.2 f 11.6 f 32,416 50,358<br />
23 Finland 1.000 1 0.895 0.895 83.8 78.2 17.6 16.5 11.5 h 11.1 h 32,069 45,882<br />
24 Austria 0.957 2 0.870 0.909 84.0 79.1 16.2 15.6 10.8 e 11.8 e 29,829 57,888<br />
25 Slovenia 1.003 1 0.890 0.888 83.5 77.6 18.1 16.7 11.9 12.2 25,654 31,726<br />
26 Italy 0.963 2 0.865 0.899 85.7 80.9 16.7 15.9 10.5 11.0 22,910 44,844<br />
27 Spain 0.974 2 0.870 0.894 85.4 80.0 18.0 17.4 9.6 10.0 24,382 41,500<br />
28 Czech Republic 0.983 1 0.869 0.883 81.6 75.9 17.6 16.1 12.1 12.6 20,997 35,543<br />
29 Greece 0.957 2 0.844 0.883 84.0 78.2 17.1 17.3 10.3 10.8 17,304 32,683<br />
30 Brunei Darussalam 0.986 1 0.854 0.866 80.9 77.2 15.4 14.6 9.0 h 9.1 h 55,402 89,256 g<br />
30 Estonia 1.032 2 0.878 0.851 81.4 72.2 17.3 15.7 13.0 e 12.2 e 21,976 31,347<br />
32 Andorra .. .. .. .. .. .. .. .. 10.2 10.3 .. ..<br />
33 Cyprus 0.979 1 0.846 0.864 82.6 78.2 14.7 13.8 11.6 11.9 23,450 35,227<br />
33 Malta 0.923 4 0.817 0.885 82.4 79.0 14.3 15.0 10.9 11.6 17,295 41,802<br />
33 Qatar 0.991 1 0.851 0.859 80.1 77.5 13.5 13.3 10.9 9.5 50,324 159,897 g<br />
36 Poland 1.006 1 0.857 0.852 81.5 73.6 17.2 15.5 11.9 12.0 18,928 29,658<br />
37 Lithuania 1.032 2 0.861 0.834 79.1 67.9 17.1 16.0 12.7 12.7 22,147 30,530<br />
38 Chile 0.966 2 0.829 0.858 84.7 79.0 16.6 16.1 9.8 10.0 14,955 28,556<br />
38 Saudi Arabia 0.882 5 0.779 0.884 75.9 73.2 15.3 17.0 9.0 10.0 19,300 75,923 g<br />
40 Slovakia 0.991 1 0.838 0.846 80.0 72.7 15.5 14.4 12.0 12.3 20,173 33,770<br />
41 Portugal 0.980 1 0.833 0.850 84.0 78.2 16.5 16.6 8.9 8.9 21,095 31,673<br />
42 United Arab Emirates 0.972 2 0.815 0.838 78.7 76.5 13.9 12.9 10.6 e 8.7 e 27,257 80,420 g<br />
43 Hungary 0.988 1 0.830 0.840 78.8 71.6 16.0 15.2 12.0 f 12.1 f 17,787 29,567<br />
44 Latvia 1.025 2 0.840 0.820 79.0 69.3 16.6 15.5 12.0 f,h 11.6 f,h 18,824 27,031<br />
45 Argentina 0.982 1 0.813 0.828 80.2 72.6 18.4 16.1 9.7 h 10.0 h 12,875 29,367<br />
45 Croatia 0.997 1 0.827 0.830 80.8 74.2 16.0 14.6 11.2 11.6 16,932 23,897<br />
47 Bahrain 0.970 2 0.806 0.831 77.8 75.9 15.1 13.7 9.4 i 9.4 i 25,717 44,303<br />
48 Montenegro 0.955 2 0.789 0.827 78.6 74.2 15.7 15.0 10.7 j 12.0 j 11,757 19,149<br />
49 Russian Federation 1.016 1 0.809 0.796 75.9 64.6 15.3 14.7 12.0 12.1 17,868 29,531<br />
50 Romania 0.990 1 0.796 0.805 78.4 71.3 15.1 14.4 10.3 11.0 16,272 22,786<br />
51 Kuwait 0.972 2 0.769 0.791 75.9 73.6 13.6 12.4 7.4 6.9 35,164 107,991 g<br />
HIGH HUMAN DEVELOPMENT<br />
52 Belarus 1.021 1 0.803 0.786 77.3 65.7 16.1 15.1 11.9 12.1 12,327 19,433<br />
52 Oman 0.927 3 0.755 0.814 79.4 75.3 13.9 13.6 7.7 i 8.5 i 15,703 43,894<br />
54 Barbados 1.006 1 0.795 0.791 78.1 73.3 16.7 13.9 10.6 j 10.3 j 11,801 18,377<br />
54 Uruguay 1.017 1 0.799 0.786 80.8 73.7 16.6 14.4 8.8 8.3 14,608 24,014<br />
56 Bulgaria 0.984 1 0.789 0.801 77.8 70.9 15.3 14.8 10.8 e 11.2 e 12,979 19,736<br />
56 Kazakhstan 1.006 1 0.795 0.790 74.3 64.8 15.4 14.6 11.7 h 11.7 h 16,364 28,226<br />
58 Bahamas .. .. .. .. 78.5 72.5 .. .. 11.5 10.5 18,070 25,209<br />
59 Malaysia .. .. .. .. 77.3 72.6 .. .. 10.0 10.8 17,170 32,208<br />
60 Palau .. .. .. .. .. .. 17.6 13.7 .. .. .. ..<br />
210 | HUMAN DEVELOPMENT REPORT <strong>2016</strong>
HUMAN DEVELOPMENT REPORT <strong>2016</strong><br />
<strong>Human</strong> <strong>Development</strong> for Everyone<br />
Gender <strong>Development</strong><br />
Index<br />
<strong>Human</strong> <strong>Development</strong><br />
Index (HDI)<br />
Life expectancy<br />
at birth<br />
Expected years<br />
of schooling<br />
Mean years<br />
of schooling<br />
Estimated gross national<br />
income per capita a<br />
Value Group b Value (years) (years) (years) (2011 PPP $)<br />
Female Male Female Male Female Male Female Male Female Male<br />
HDI rank 2015 2015 2015 2015 2015 2015 2015 c 2015 c 2015 c 2015 c 2015 2015<br />
60 Panama 0.997 1 0.783 0.785 80.9 74.8 13.2 12.4 10.3 9.5 14,550 24,365<br />
62 Antigua and Barbuda .. .. .. .. 78.6 73.7 14.6 13.3 .. .. .. ..<br />
63 Seychelles .. .. .. .. 78.2 69.1 14.8 13.5 .. .. .. ..<br />
64 Mauritius 0.954 2 0.759 0.796 78.2 71.1 15.5 14.8 8.8 9.5 10,540 25,539<br />
65 Trinidad and Tobago 1.004 1 0.786 0.783 74.2 67.1 14.3 k 12.3 k 10.8 11.0 21,104 35,179<br />
66 Costa Rica 0.969 2 0.762 0.786 82.1 77.2 14.5 13.8 8.7 8.7 9,955 18,052<br />
66 Serbia 0.969 2 0.763 0.787 77.9 72.2 14.8 13.9 10.3 11.4 9,600 14,932<br />
68 Cuba 0.946 3 0.750 0.792 81.6 77.6 14.4 13.5 11.5 i 12.0 i 5,013 9,874<br />
69 Iran (Islamic Republic of) 0.862 5 0.700 0.812 76.7 74.5 14.6 15.0 8.5 h 9.1 h 5,132 27,499<br />
70 Georgia 0.970 2 0.754 0.777 78.5 71.3 14.1 13.7 12.3 12.2 6,105 11,871<br />
71 Turkey 0.908 4 0.724 0.797 78.7 72.3 14.0 15.0 7.0 8.8 10,648 27,035<br />
71 Venezuela (Bolivarian Republic of) 1.028 2 0.776 0.754 78.6 70.4 15.4 13.2 9.7 9.0 11,579 18,709<br />
73 Sri Lanka 0.934 3 0.734 0.785 78.4 71.7 14.3 13.6 10.3 h 11.4 h 6,067 15,869<br />
74 Saint Kitts and Nevis .. .. .. .. .. .. 13.8 13.5 .. .. .. ..<br />
75 Albania 0.959 2 0.747 0.778 80.6 75.6 14.4 14.0 9.5 9.8 7,365 13,186<br />
76 Lebanon 0.893 5 0.709 0.793 81.5 77.9 13.0 13.6 8.3 i 8.7 i 5,844 20,712<br />
77 Mexico 0.951 2 0.737 0.775 79.4 74.6 13.5 13.1 8.2 8.6 10,710 22,115<br />
78 Azerbaijan 0.940 3 0.732 0.779 74.1 67.8 12.6 12.7 10.3 12.0 11,029 21,845<br />
79 Brazil 1.005 1 0.754 0.751 78.5 71.0 15.7 14.7 8.1 7.5 10,672 17,736<br />
79 Grenada .. .. .. .. 76.0 71.1 16.2 15.3 .. .. .. ..<br />
81 Bosnia and Herzegovina 0.923 4 0.721 0.781 79.2 74.1 14.8 14.0 7.8 10.6 6,950 13,261<br />
82 The former Yugoslav Republic of Macedonia 0.947 3 0.725 0.765 77.9 73.2 13.0 12.8 8.9 j 9.8 j 9,050 15,790<br />
83 Algeria 0.854 5 0.665 0.779 77.5 72.7 14.6 14.1 6.6 e 8.5 e 4,022 22,926<br />
84 Armenia 0.993 1 0.736 0.741 78.7 71.1 13.8 11.4 11.3 11.3 5,535 11,258<br />
84 Ukraine 1.000 1 0.741 0.741 76.0 66.2 15.5 15.1 11.3 h 11.3 h 5,791 9,181<br />
86 Jordan 0.864 5 0.670 0.776 75.9 72.6 13.4 12.9 9.7 10.7 3,203 16,694<br />
87 Peru 0.959 2 0.723 0.754 77.5 72.2 13.5 13.2 8.4 9.5 8,939 13,655<br />
87 Thailand 1.001 1 0.740 0.739 78.0 71.3 14.1 13.1 7.7 8.2 12,938 16,145<br />
89 Ecuador 0.976 1 0.730 0.748 78.9 73.4 14.4 13.9 8.2 8.4 8,278 12,795<br />
90 China 0.954 2 0.718 0.753 77.5 74.5 13.7 13.4 7.2 e 7.9 e 10,705 15,830<br />
91 Fiji .. .. .. .. 73.4 67.3 .. .. 10.9 h 10.2 h 4,695 11,676<br />
92 Mongolia 1.026 2 0.744 0.725 74.2 65.6 15.5 14.2 10.0 i 9.5 i 8,809 12,122<br />
92 Saint Lucia 0.986 1 0.729 0.740 78.0 72.5 13.4 12.9 9.4 i 9.3 i 8,033 11,617<br />
94 Jamaica 0.975 2 0.719 0.738 78.2 73.5 13.1 12.6 9.7 h 9.6 h 6,628 10,086<br />
95 Colombia 1.004 1 0.731 0.728 77.8 70.7 14.5 13.3 7.6 e 7.5 e 10,215 15,389<br />
96 Dominica .. .. .. .. .. .. .. .. .. .. .. ..<br />
97 Suriname 0.972 2 0.709 0.730 74.6 68.2 13.0 12.0 8.2 i 8.5 i 10,501 21,512<br />
97 Tunisia 0.904 4 0.680 0.752 77.4 72.7 15.1 14.2 6.7 e 7.8 e 4,662 15,967<br />
99 Dominican Republic 0.990 1 0.717 0.724 76.9 70.6 13.7 12.7 7.9 7.5 9,281 16,256<br />
99 Saint Vincent and the Grenadines .. .. .. .. 75.2 71.0 13.5 i 13.1 i .. .. 7,600 13,095<br />
101 Tonga 0.969 2 0.707 0.730 76.0 70.1 14.6 14.0 11.0 11.1 3,959 6,602<br />
102 Libya 0.950 2 0.691 0.727 74.8 69.0 13.6 13.2 7.7 e 7.0 e 7,163 21,364<br />
103 Belize 0.967 2 0.693 0.716 73.1 67.4 13.0 12.5 10.5 10.5 5,360 9,402<br />
104 Samoa .. .. .. .. 77.0 70.7 13.3 12.5 .. .. 3,444 7,182<br />
105 Maldives 0.937 3 0.676 0.721 78.0 76.0 12.8 k 12.7 k 6.2 f,k 6.3 f,k 7,155 13,591<br />
105 Uzbekistan 0.946 3 0.672 0.711 71.9 65.1 11.8 12.2 11.8 12.3 3,891 7,668<br />
MEDIUM HUMAN DEVELOPMENT<br />
107 Moldova (Republic of) 1.010 1 0.702 0.695 75.9 67.6 12.1 11.6 12.0 11.8 4,461 5,637<br />
108 Botswana 0.984 1 0.693 0.704 66.9 62.2 12.8 12.5 9.2 e 9.5 e 13,278 16,050<br />
109 Gabon 0.923 4 0.669 0.725 65.7 64.1 12.5 12.7 7.3 k 9.0 k 15,838 22,177<br />
110 Paraguay 0.966 2 0.679 0.703 75.2 70.9 12.6 12.0 8.1 8.2 6,138 10,165<br />
111 Egypt 0.884 5 0.640 0.724 73.6 69.2 13.0 13.2 6.4 h 7.9 h 4,750 15,267<br />
111 Turkmenistan .. .. .. .. 70.0 61.6 10.6 11.0 .. .. 9,359 18,856<br />
113 Indonesia 0.926 3 0.660 0.712 71.2 67.0 12.9 12.9 7.4 8.5 6,668 13,391<br />
114 Palestine, State of 0.867 5 0.616 0.710 75.1 71.1 13.7 12.1 8.6 9.3 1,766 8,651<br />
115 Viet Nam 1.010 1 0.687 0.681 80.6 71.2 12.9 12.5 7.9 e 8.2 e 4,834 5,846<br />
116 Philippines 1.001 1 0.682 0.681 71.9 65.0 12.1 11.4 9.5 f 9.2 f 6,845 9,917<br />
117 El Salvador 0.958 2 0.663 0.691 77.7 68.6 13.0 13.3 6.2 6.9 5,386 10,385<br />
118 Bolivia (Plurinational State of) 0.934 3 0.650 0.695 71.3 66.3 13.5 14.1 7.6 8.8 4,695 7,610<br />
119 South Africa 0.962 2 0.651 0.677 59.5 55.5 13.6 12.5 10.2 10.5 8,795 15,489<br />
120 Kyrgyzstan 0.967 2 0.648 0.671 74.8 66.8 13.3 12.7 10.9 e 10.7 e 2,123 4,090<br />
121 Iraq 0.804 5 0.569 0.708 71.8 67.4 9.7 k 11.5 k 5.4 j 7.8 j 3,552 19,467<br />
TABLE<br />
4<br />
TABLE 4 Gender <strong>Development</strong> Index | 211
TABLE 4 GENDER DEVELOPMENT INDEX<br />
TABLE<br />
4<br />
Gender <strong>Development</strong><br />
Index<br />
<strong>Human</strong> <strong>Development</strong><br />
Index (HDI)<br />
Life expectancy<br />
at birth<br />
Expected years<br />
of schooling<br />
Mean years<br />
of schooling<br />
Estimated gross national<br />
income per capita a<br />
Value Group b Value (years) (years) (years) (2011 PPP $)<br />
Female Male Female Male Female Male Female Male Female Male<br />
HDI rank 2015 2015 2015 2015 2015 2015 2015 c 2015 c 2015 c 2015 c 2015 2015<br />
122 Cabo Verde .. .. .. .. 75.2 71.6 13.9 13.1 .. .. 4,030 8,123<br />
123 Morocco 0.826 5 0.579 0.700 75.3 73.3 11.5 12.6 3.8 h 6.4 h 3,388 11,091<br />
124 Nicaragua 0.961 2 0.629 0.654 78.2 72.2 11.9 11.4 6.8 h 6.4 h 3,150 6,389<br />
125 Guatemala 0.959 2 0.624 0.651 75.6 68.5 10.5 11.0 6.3 6.3 5,132 9,081<br />
125 Namibia 0.986 1 0.635 0.644 67.5 62.5 11.8 11.5 6.9 h 6.5 h 7,971 11,667<br />
127 Guyana 0.943 3 0.615 0.652 68.9 64.2 10.5 10.2 8.5 e 8.4 e 4,346 9,397<br />
127 Micronesia (Federated States of) .. .. .. .. 70.3 68.2 .. .. .. .. .. ..<br />
129 Tajikistan 0.930 3 0.604 0.650 73.4 66.3 10.6 11.9 9.6 k 11.2 k 2,100 3,088<br />
130 Honduras 0.942 3 0.600 0.637 75.9 70.9 11.6 10.9 6.2 6.1 2,680 6,254<br />
131 India 0.819 5 0.549 0.671 69.9 66.9 11.9 11.3 4.8 e 8.2 e 2,184 8,897<br />
132 Bhutan 0.900 5 0.573 0.637 70.1 69.6 12.6 12.4 2.1 j 4.2 j 5,657 8,308<br />
133 Timor-Leste 0.858 5 0.558 0.651 70.4 66.8 12.1 13.7 3.6 k 5.3 k 3,124 7,549<br />
134 Vanuatu .. .. .. .. 74.3 70.2 10.4 11.1 .. .. 2,139 3,453<br />
135 Congo 0.932 3 0.568 0.610 64.4 61.4 11.0 11.3 5.5 e 6.7 e 4,731 6,274<br />
135 Equatorial Guinea .. .. .. .. 59.4 56.6 .. .. 4.0 k 7.3 k 17,462 25,375<br />
137 Kiribati .. .. .. .. 69.5 63.0 12.3 11.5 .. .. .. ..<br />
138 Lao People’s Democratic Republic 0.924 4 0.560 0.607 68.0 65.2 10.4 11.2 4.5 j 5.6 j 4,408 5,696<br />
139 Bangladesh 0.927 3 0.556 0.599 73.3 70.7 10.4 9.9 5.0 e 5.6 e 2,379 4,285<br />
139 Ghana 0.899 5 0.545 0.606 62.5 60.5 11.1 11.7 5.8 h 7.9 h 3,200 4,484<br />
139 Zambia 0.924 4 0.555 0.601 62.9 58.8 12.1 13.0 6.4 h 7.4 h 2,803 4,126<br />
142 Sao Tome and Principe 0.907 4 0.542 0.597 68.6 64.5 12.2 11.7 4.7 5.9 2,000 4,149<br />
143 Cambodia 0.892 5 0.529 0.592 70.8 66.7 10.1 11.7 3.7 5.5 2,650 3,563<br />
144 Nepal 0.925 4 0.538 0.582 71.5 68.6 12.7 12.2 3.2 j 5.0 j 1,979 2,718<br />
145 Myanmar .. .. .. .. 68.2 64.0 .. .. 4.9 h 4.9 h 4,182 5,740<br />
146 Kenya 0.919 4 0.531 0.577 64.1 60.3 10.8 11.4 5.7 h 7.0 h 2,357 3,405<br />
147 Pakistan 0.742 5 0.452 0.610 67.4 65.4 7.4 8.8 3.7 6.5 1,498 8,376<br />
LOW HUMAN DEVELOPMENT<br />
148 Swaziland 0.853 5 0.495 0.580 48.1 49.6 11.0 11.8 6.4 j 7.2 j 5,078 10,020<br />
149 Syrian Arab Republic 0.851 5 0.475 0.558 76.6 63.9 8.9 9.0 4.6 5.6 835 4,007<br />
150 Angola .. .. .. .. 54.2 51.2 8.7 14.0 .. .. 5,073 7,527<br />
151 Tanzania (United Republic of) 0.937 3 0.512 0.546 66.9 64.1 8.3 9.3 5.4 6.2 2,359 2,576<br />
152 Nigeria 0.847 5 0.482 0.569 53.4 52.7 9.2 10.8 4.9 k 7.1 k 4,132 6,706<br />
153 Cameroon 0.853 5 0.474 0.555 57.1 54.8 9.6 11.3 4.6 e 7.4 e 2,340 3,448<br />
154 Papua New Guinea .. .. .. .. 65.0 60.7 .. .. 3.7 h 5.3 h 2,362 3,047<br />
154 Zimbabwe 0.927 3 0.496 0.535 60.7 57.7 10.2 10.5 7.3 8.2 1,360 1,822<br />
156 Solomon Islands .. .. .. .. 69.6 66.7 9.1 i 10.1 i .. .. 1,061 2,045<br />
157 Mauritania 0.818 5 0.454 0.555 64.7 61.7 8.4 8.5 3.3 h 5.4 h 1,608 5,422<br />
158 Madagascar 0.948 3 0.500 0.527 67.0 64.0 10.2 10.5 6.7 6.1 1,091 1,549<br />
159 Rwanda 0.992 1 0.491 0.495 67.4 61.8 11.4 9.3 3.3 4.4 1,428 1,822<br />
160 Comoros 0.817 5 0.437 0.535 65.3 61.9 10.9 11.3 3.7 5.6 715 1,945<br />
160 Lesotho 0.962 2 0.485 0.505 50.0 49.9 11.2 10.3 7.0 f 5.3 f 2,631 4,020<br />
162 Senegal 0.886 5 0.464 0.523 68.8 64.9 9.2 9.7 2.1 i 3.6 i 1,706 2,814<br />
163 Haiti .. .. .. .. 65.3 61.0 .. .. 3.9 e 6.6 e 1,370 1,950<br />
163 Uganda 0.878 5 0.459 0.523 61.1 57.3 9.9 10.1 4.5 i 6.8 i 1,266 2,075<br />
165 Sudan 0.839 5 0.441 0.526 65.3 62.2 7.0 7.4 3.0 4.1 1,902 5,775<br />
166 Togo 0.841 5 0.444 0.528 60.9 59.4 10.8 13.1 3.2 k 6.3 k 1,116 1,412<br />
167 Benin 0.858 5 0.461 0.538 61.2 58.3 10.5 13.7 2.8 e 4.3 e 1,673 2,287<br />
168 Yemen 0.737 5 0.400 0.543 65.4 62.7 7.6 10.4 1.9 e 4.2 e 1,045 3,530<br />
169 Afghanistan 0.609 5 0.348 0.572 62.0 59.5 8.3 i 13.1 i 1.6 h 5.8 h 511 3,148<br />
170 Malawi 0.921 4 0.455 0.495 64.8 62.9 10.7 10.8 3.8 h 5.0 h 972 1,175<br />
171 Côte d’Ivoire 0.814 5 0.421 0.517 52.8 51.1 7.8 9.8 3.9 h 6.1 h 2,136 4,155<br />
172 Djibouti .. .. .. .. 64.0 60.7 5.8 6.8 .. .. 1,981 4,441<br />
173 Gambia 0.878 5 0.425 0.484 61.9 59.1 8.7 9.6 2.6 h 4.2 h 1,296 1,790<br />
174 Ethiopia 0.842 5 0.408 0.484 66.6 62.7 7.9 8.8 1.5 k 3.7 k 1,161 1,886<br />
175 Mali 0.786 5 0.385 0.491 58.3 58.6 7.5 9.4 1.7 3.0 1,349 3,071<br />
176 Congo (Democratic Republic of the) 0.832 5 0.390 0.469 60.5 57.6 8.7 10.0 4.0 8.1 599 761<br />
177 Liberia 0.830 5 0.387 0.466 62.2 60.2 9.3 10.6 3.1 6.0 575 788<br />
178 Guinea-Bissau .. .. .. .. 57.3 53.7 .. .. .. .. 1,139 1,603<br />
179 Eritrea .. .. .. .. 66.3 62.0 4.4 5.6 .. .. 1,286 1,693<br />
179 Sierra Leone 0.871 5 0.392 0.451 51.9 50.8 9.1 10.0 2.6 h 4.2 h 1,354 1,708<br />
181 Mozambique 0.879 5 0.391 0.444 56.8 54.0 8.6 9.5 2.5 k 4.6 k 1,016 1,184<br />
181 South Sudan .. .. .. .. 57.1 55.2 3.8 6.3 4.0 j 5.3 j .. ..<br />
212 | HUMAN DEVELOPMENT REPORT <strong>2016</strong>
HUMAN DEVELOPMENT REPORT <strong>2016</strong><br />
<strong>Human</strong> <strong>Development</strong> for Everyone<br />
Gender <strong>Development</strong><br />
Index<br />
<strong>Human</strong> <strong>Development</strong><br />
Index (HDI)<br />
Life expectancy<br />
at birth<br />
Expected years<br />
of schooling<br />
Mean years<br />
of schooling<br />
Estimated gross national<br />
income per capita a<br />
Value Group b Value (years) (years) (years) (2011 PPP $)<br />
Female Male Female Male Female Male Female Male Female Male<br />
HDI rank 2015 2015 2015 2015 2015 2015 2015 c 2015 c 2015 c 2015 c 2015 2015<br />
183 Guinea 0.784 5 0.364 0.464 59.7 58.7 7.5 10.1 1.5 k 3.9 k 848 1,267<br />
184 Burundi 0.919 4 0.388 0.422 59.2 55.1 10.2 11.1 2.6 e 3.6 e 632 752<br />
185 Burkina Faso 0.874 5 0.375 0.429 60.3 57.6 7.3 8.1 1.0 2.0 1,278 1,800<br />
186 Chad 0.765 5 0.340 0.445 53.0 50.8 5.8 8.8 1.2 3.4 1,581 2,400<br />
187 Niger 0.732 5 0.291 0.397 62.9 61.1 4.7 5.9 1.1 h 2.3 h 481 1,292<br />
188 Central African Republic 0.776 5 0.306 0.395 53.4 49.5 5.8 8.4 2.8 j 5.7 j 482 696<br />
OTHER COUNTRIES OR TERRITORIES<br />
Korea (Democratic People’s Rep. of) .. .. .. .. 73.9 66.9 11.5 12.5 .. .. .. ..<br />
Marshall Islands .. .. .. .. .. .. .. .. .. .. .. ..<br />
Monaco .. .. .. .. .. .. .. .. .. .. .. ..<br />
Nauru .. .. .. .. .. .. 10.2 9.2 .. .. .. ..<br />
San Marino .. .. .. .. .. .. 15.6 14.6 .. .. .. ..<br />
Somalia .. .. .. .. 57.4 54.1 .. .. .. .. 170 418<br />
Tuvalu .. .. .. .. .. .. .. .. .. .. .. ..<br />
<strong>Human</strong> development groups<br />
Very high human development 0.980 — 0.881 0.898 82.4 76.6 16.7 16.0 12.1 12.2 29,234 50,284<br />
High human development 0.958 — 0.728 0.760 77.7 73.4 14.1 13.6 7.8 8.3 10,214 17,384<br />
Medium human development 0.871 — 0.582 0.668 70.4 66.8 11.5 11.3 5.6 7.8 3,314 9,131<br />
Low human development 0.849 — 0.455 0.536 60.7 58.0 8.5 10.0 3.6 5.6 1,950 3,365<br />
Developing countries 0.913 — 0.635 0.695 71.9 68.2 11.8 11.9 6.5 7.9 6,053 12,390<br />
Regions<br />
Arab States 0.856 — 0.621 0.726 72.8 69.1 11.4 12.1 5.9 7.6 5,455 23,810<br />
East Asia and the Pacific 0.956 — 0.704 0.736 76.2 72.3 13.3 13.0 7.3 8.0 9,569 14,582<br />
Europe and Central Asia 0.951 — 0.733 0.770 76.3 68.7 13.7 14.0 9.9 10.7 8,453 17,547<br />
Latin America and the Caribbean 0.981 — 0.743 0.757 78.4 72.0 14.7 13.8 8.3 8.3 10,053 18,091<br />
South Asia 0.822 — 0.549 0.667 70.2 67.4 11.3 11.1 4.9 7.8 2,278 9,114<br />
Sub-Saharan Africa 0.877 — 0.488 0.557 60.2 57.6 9.1 10.3 4.5 6.3 2,637 4,165<br />
Least developed countries 0.874 — 0.473 0.541 65.1 62.1 8.9 9.9 3.7 5.2 1,792 2,994<br />
Small island developing states .. — .. .. 72.7 67.9 .. .. .. .. 5,223 9,256<br />
Organisation for Economic<br />
Co‐operation and <strong>Development</strong> 0.974 — 0.873 0.896 82.9 77.7 16.2 15.7 11.7 12.0 28,441 47,684<br />
World 0.938 — 0.693 0.738 73.8 69.6 12.4 12.3 7.7 8.8 10,306 18,555<br />
TABLE<br />
4<br />
NOTES<br />
a Because disaggregated income data are not<br />
available, data are crudely estimated. See<br />
Definitions and Technical note 3 at http://hdr.<br />
undp.org/sites/default/files/hdr<strong>2016</strong>_technical_<br />
notes.pdf for details on how the Gender<br />
<strong>Development</strong> Index is calculated.<br />
b Countries are divided into five groups by absolute<br />
deviation from gender parity in HDI values.<br />
c Data refer to 2015 or the most recent year available.<br />
d In calculating the HDI value, expected years of<br />
schooling is capped at 18 years.<br />
e Updated by HDRO using Barro and Lee (<strong>2016</strong>)<br />
estimates.<br />
f Updated by HDRO based on data from UNESCO<br />
Institute for Statistics (<strong>2016</strong>) and Barro and Lee<br />
(<strong>2016</strong>).<br />
g In calculating the male HDI value, estimated<br />
gross national income per capita is capped at<br />
$75,000.<br />
h Based on Barro and Lee (<strong>2016</strong>).<br />
i Updated by HDRO based on data from UNESCO<br />
Institute for Statistics (<strong>2016</strong>).<br />
j Based on data from United Nations Children’s<br />
Fund (UNICEF) Multiple Indicator Cluster Surveys<br />
for 2006–2015.<br />
k Updated by HDRO based on data from ICF Macro<br />
Demographic and Health Surveys for 2006–2015.<br />
DEFINITIONS<br />
Gender <strong>Development</strong> Index: Ratio of female<br />
to male HDI values. See Technical note 3 at<br />
http://hdr.undp.org/sites/default/files/hdr<strong>2016</strong>_<br />
technical_notes.pdf for details on how the Gender<br />
<strong>Development</strong> Index is calculated.<br />
Gender <strong>Development</strong> Index groups: Countries<br />
are divided into five groups by absolute deviation<br />
from gender parity in HDI values. Group 1 comprises<br />
countries with high equality in HDI achievements<br />
between women and men (absolute deviation of<br />
less than 2.5 percent), group 2 comprises countries<br />
with medium to high equality in HDI achievements<br />
between women and men (absolute deviation of 2.5–<br />
5 percent), group 3 comprises countries with medium<br />
equality in HDI achievements between women and<br />
men (absolute deviation of 5–7.5 percent), group 4<br />
comprises countries with medium to low equality<br />
in HDI achievements between women and men<br />
(absolute deviation of 7.5–10 percent) and group<br />
5 comprises countries with low equality in HDI<br />
achievements between women and men (absolute<br />
deviation from gender parity of more than 10 percent).<br />
<strong>Human</strong> <strong>Development</strong> Index (HDI): A composite<br />
index measuring average achievement in three basic<br />
dimensions of human development — a long and<br />
healthy life, knowledge and a decent standard of<br />
living. See Technical note 1 at http://hdr.undp.org/<br />
sites/default/files/hdr<strong>2016</strong>_technical_notes.pdf for<br />
details on how the HDI is calculated.<br />
Life expectancy at birth: Number of years a<br />
newborn infant could expect to live if prevailing<br />
patterns of age-specific mortality rates at the time of<br />
birth stay the same throughout the infant’s life.<br />
Expected years of schooling: Number of years<br />
of schooling that a child of school entrance age<br />
can expect to receive if prevailing patterns of<br />
age-specific enrolment rates persist throughout the<br />
child’s life.<br />
Mean years of schooling: Average number of<br />
years of education received by people ages 25 and<br />
older, converted from educational attainment levels<br />
using official durations of each level.<br />
Estimated gross national income per capita:<br />
Derived from the ratio of female to male wages,<br />
female and male shares of economically active<br />
population and gross national income (in 2011<br />
purchasing power parity terms). See Technical<br />
note 3 at http://hdr.undp.org/sites/default/files/<br />
hdr<strong>2016</strong>_technical_notes.pdf for details.<br />
MAIN DATA SOURCES<br />
Column 1: Calculated based on data in columns<br />
3 and 4.<br />
Column 2: Calculated based on data in column 1.<br />
Columns 3 and 4: HDRO calculations based on<br />
data from UNDESA (2015a), UNESCO Institute for<br />
Statistics (<strong>2016</strong>), Barro and Lee (<strong>2016</strong>), World Bank<br />
(<strong>2016</strong>a), ILO (<strong>2016</strong>a) and IMF (<strong>2016</strong>).<br />
Columns 5 and 6: UNDESA (2015a).<br />
Columns 7 and 8: UNESCO Institute for Statistics<br />
(<strong>2016</strong>), ICF Macro Demographic and Health Surveys<br />
and UNICEF Multiple Indicator Cluster Surveys.<br />
Columns 9 and 10: UNESCO Institute for<br />
Statistics (<strong>2016</strong>), Barro and Lee (<strong>2016</strong>), ICF Macro<br />
Demographic and Health Surveys and UNICEF<br />
Multiple Indicator Cluster Surveys.<br />
Columns 11 and 12: HDRO calculations based on<br />
ILO (<strong>2016</strong>a), UNDESA (2015a), World Bank (<strong>2016</strong>a)<br />
and IMF (<strong>2016</strong>).<br />
TABLE 4 Gender <strong>Development</strong> Index | 213
TABLE<br />
5<br />
Gender Inequality Index<br />
TABLE<br />
5<br />
Gender Inequality<br />
Index<br />
Value<br />
Rank<br />
Maternal<br />
mortality ratio<br />
(deaths per 100,000<br />
live births)<br />
Adolescent<br />
birth rate<br />
(births per 1,000 women<br />
ages 15–19)<br />
Share of seats<br />
in parliament<br />
(% held by women)<br />
Population with at least some<br />
secondary education<br />
Labour force<br />
participation rate<br />
(% ages 25 and older) (% ages 15 and older)<br />
Female Male Female Male<br />
HDI rank 2015 2015 2015 2015 a 2015 2005–2015 b 2005–2015 b 2015 2015<br />
VERY HIGH HUMAN DEVELOPMENT<br />
1 Norway 0.053 6 5 5.9 39.6 96.1 94.6 61.2 68.5<br />
2 Australia 0.120 24 6 14.1 30.5 91.4 91.5 58.6 70.9<br />
2 Switzerland 0.040 1 5 2.9 28.9 96.1 97.4 62.7 74.8<br />
4 Germany 0.066 9 6 6.7 36.9 96.4 97.0 54.5 66.4<br />
5 Denmark 0.041 2 6 4.0 37.4 89.1 98.5 58.0 66.2<br />
5 Singapore 0.068 11 10 3.8 23.9 75.5 81.9 58.2 76.4<br />
7 Netherlands 0.044 3 7 4.0 36.4 86.2 90.3 57.5 70.2<br />
8 Ireland 0.127 26 8 10.4 19.9 86.8 82.2 52.4 67.8<br />
9 Iceland 0.051 5 3 6.1 41.3 100.0 97.2 70.7 77.5<br />
10 Canada 0.098 18 7 9.8 28.3 100.0 100.0 61.0 70.3<br />
10 United States 0.203 43 14 22.6 19.5 95.4 95.1 56.0 68.4<br />
12 Hong Kong, China (SAR) .. .. .. 3.2 .. 80.9 74.7 53.4 68.5<br />
13 New Zealand 0.158 34 11 23.6 31.4 98.8 98.7 62.4 73.1<br />
14 Sweden 0.048 4 4 5.7 43.6 87.8 88.3 60.9 68.2<br />
15 Liechtenstein .. .. .. .. 20.0 .. .. .. ..<br />
16 United Kingdom 0.131 28 9 14.6 26.7 81.3 84.6 56.9 68.7<br />
17 Japan 0.116 21 5 4.1 11.6 93.0 90.6 49.1 70.2<br />
18 Korea (Republic of) 0.067 10 11 1.6 16.3 88.8 94.6 50.0 71.8<br />
19 Israel 0.103 20 5 9.7 26.7 87.3 90.3 58.9 69.4<br />
20 Luxembourg 0.075 13 10 5.9 28.3 100.6 99.4 52.2 66.1<br />
21 France 0.102 19 8 8.9 25.7 79.7 85.5 50.7 60.1<br />
22 Belgium 0.073 12 7 8.2 42.4 80.1 84.7 48.2 59.3<br />
23 Finland 0.056 8 3 6.5 41.5 100.0 100.0 55.0 62.1<br />
24 Austria 0.078 14 4 7.1 30.3 98.7 99.2 54.7 66.0<br />
25 Slovenia 0.053 6 9 3.8 27.7 96.5 98.3 52.2 63.0<br />
26 Italy 0.085 16 4 6.0 30.1 79.1 83.3 39.3 58.1<br />
27 Spain 0.081 15 5 8.4 38.0 70.9 76.7 52.3 64.8<br />
28 Czech Republic 0.129 27 4 9.9 19.6 99.8 99.8 51.1 68.2<br />
29 Greece 0.119 23 3 7.5 19.7 63.7 71.7 43.9 60.0<br />
30 Brunei Darussalam .. .. 23 21.0 .. 67.7 c 69.6 c 51.0 75.3<br />
30 Estonia 0.131 28 9 13.1 23.8 100.0 100.0 55.4 69.5<br />
32 Andorra .. .. .. .. 39.3 72.0 73.7 .. ..<br />
33 Cyprus 0.116 21 7 5.0 12.5 77.0 82.7 57.5 70.2<br />
33 Malta 0.217 44 9 16.6 12.9 72.7 81.2 38.8 66.0<br />
33 Qatar 0.542 127 13 10.7 0.0 d 70.9 67.8 53.6 94.2<br />
36 Poland 0.137 30 3 13.4 24.8 81.1 86.9 49.1 65.3<br />
37 Lithuania 0.121 25 10 11.0 23.4 91.1 95.6 53.9 65.5<br />
38 Chile 0.322 65 22 47.8 15.8 76.1 76.9 50.7 74.6<br />
38 Saudi Arabia 0.257 50 12 8.8 19.9 63.3 72.1 20.1 79.1<br />
40 Slovakia 0.179 39 6 20.2 18.7 99.2 99.5 51.4 68.3<br />
41 Portugal 0.091 17 10 9.9 34.8 50.8 52.2 53.6 64.2<br />
42 United Arab Emirates 0.232 46 6 29.7 22.5 77.4 64.5 41.9 91.6<br />
43 Hungary 0.252 49 17 18.0 10.1 95.6 97.9 46.4 62.5<br />
44 Latvia 0.191 41 18 13.6 18.0 99.3 98.8 54.4 67.7<br />
45 Argentina 0.362 77 52 63.8 37.1 e 63.5 61.4 48.4 74.5<br />
45 Croatia 0.141 31 8 9.5 15.2 92.0 96.0 46.4 58.7<br />
47 Bahrain 0.233 48 15 13.5 15.0 61.6 c 55.6 c 39.2 85.4<br />
48 Montenegro 0.156 33 7 12.2 17.3 86.9 96.2 42.0 56.1<br />
49 Russian Federation 0.271 52 25 23.4 14.5 94.6 94.7 56.6 71.7<br />
50 Romania 0.339 72 31 34.6 12.0 86.1 92.2 47.6 64.9<br />
51 Kuwait 0.335 70 4 9.8 1.5 56.8 58.1 48.4 84.5<br />
HIGH HUMAN DEVELOPMENT<br />
52 Belarus 0.144 32 4 18.2 29.2 87.0 92.2 54.5 68.2<br />
52 Oman 0.281 54 17 8.1 8.2 59.8 57.1 30.0 85.6<br />
54 Barbados 0.291 59 27 40.7 19.6 93.0 90.6 62.4 70.7<br />
54 Uruguay 0.284 55 15 56.1 19.2 55.0 51.6 55.4 76.3<br />
56 Bulgaria 0.223 45 11 37.7 20.4 93.1 95.5 48.6 60.1<br />
56 Kazakhstan 0.202 42 12 27.9 20.1 99.7 100.0 66.1 77.0<br />
58 Bahamas 0.362 77 80 29.6 16.7 87.4 87.6 69.4 79.1<br />
59 Malaysia 0.291 59 40 13.6 13.2 75.4 79.1 49.3 77.6<br />
60 Palau .. .. .. .. 10.3 .. .. .. ..<br />
214 | HUMAN DEVELOPMENT REPORT <strong>2016</strong>
HUMAN DEVELOPMENT REPORT <strong>2016</strong><br />
<strong>Human</strong> <strong>Development</strong> for Everyone<br />
Gender Inequality<br />
Index<br />
Value<br />
Rank<br />
Maternal<br />
mortality ratio<br />
(deaths per 100,000<br />
live births)<br />
Adolescent<br />
birth rate<br />
(births per 1,000 women<br />
ages 15–19)<br />
Share of seats<br />
in parliament<br />
(% held by women)<br />
Population with at least some<br />
secondary education<br />
Labour force<br />
participation rate<br />
(% ages 25 and older) (% ages 15 and older)<br />
Female Male Female Male<br />
HDI rank 2015 2015 2015 2015 a 2015 2005–2015 b 2005–2015 b 2015 2015<br />
60 Panama 0.457 100 94 74.5 18.3 70.1 66.1 50.5 80.5<br />
62 Antigua and Barbuda .. .. .. 44.8 25.7 .. .. .. ..<br />
63 Seychelles .. .. .. 57.4 43.8 .. .. .. ..<br />
64 Mauritius 0.380 82 53 28.5 11.6 57.0 62.0 46.8 74.9<br />
65 Trinidad and Tobago 0.324 67 63 31.5 31.5 70.6 68.4 52.6 73.6<br />
66 Costa Rica 0.308 63 25 56.5 33.3 54.5 53.8 46.8 76.6<br />
66 Serbia 0.185 40 17 19.0 34.0 82.3 91.6 43.4 60.1<br />
68 Cuba 0.304 62 39 45.6 48.9 83.9 86.7 42.6 68.6<br />
69 Iran (Islamic Republic of) 0.509 118 25 26.7 3.1 66.8 70.2 16.2 72.7<br />
70 Georgia 0.361 76 36 39.7 11.3 96.1 97.4 57.3 78.4<br />
71 Turkey 0.328 69 16 27.6 14.9 43.5 64.8 30.4 71.4<br />
71 Venezuela (Bolivarian Republic of) 0.461 101 95 79.4 17.0 72.6 65.0 51.4 78.4<br />
73 Sri Lanka 0.386 87 30 14.8 4.9 80.2 80.6 30.2 75.6<br />
74 Saint Kitts and Nevis .. .. .. .. 13.3 .. .. .. ..<br />
75 Albania 0.267 51 29 21.7 20.7 90.2 90.5 40.3 60.7<br />
76 Lebanon 0.381 83 15 12.4 3.1 53.0 55.4 23.5 70.3<br />
77 Mexico 0.345 73 38 62.8 40.6 56.1 59.0 45.4 79.5<br />
78 Azerbaijan 0.326 68 25 59.8 16.9 93.9 97.5 61.9 68.3<br />
79 Brazil 0.414 92 44 67.0 10.8 59.1 55.2 56.3 78.5<br />
79 Grenada .. .. 27 30.5 25.0 .. .. .. ..<br />
81 Bosnia and Herzegovina 0.158 34 11 8.6 19.3 69.5 87.5 34.4 58.0<br />
82 The former Yugoslav Republic of Macedonia 0.160 36 8 17.6 33.3 40.2 55.6 43.9 68.1<br />
83 Algeria 0.429 94 140 10.6 25.7 34.1 35.7 16.8 70.4<br />
84 Armenia 0.293 61 25 23.0 10.7 98.5 98.1 54.9 73.6<br />
84 Ukraine 0.284 55 24 24.1 12.1 94.3 96.0 52.2 67.4<br />
86 Jordan 0.478 111 58 23.2 11.6 78.5 82.7 14.2 64.4<br />
87 Peru 0.385 86 68 49.1 22.3 56.2 67.0 65.7 82.6<br />
87 Thailand 0.366 79 20 44.6 6.1 40.9 45.8 62.9 80.2<br />
89 Ecuador 0.391 88 64 75.9 41.6 48.2 49.4 49.0 79.7<br />
90 China 0.164 37 27 7.3 23.6 69.8 79.4 63.6 77.9<br />
91 Fiji 0.358 75 30 44.8 16.0 73.9 66.5 37.0 71.3<br />
92 Mongolia 0.278 53 44 15.7 14.5 89.7 85.8 56.5 68.8<br />
92 Saint Lucia 0.354 74 48 53.9 20.7 48.2 42.0 63.1 76.5<br />
94 Jamaica 0.422 93 89 59.7 16.7 67.1 59.4 57.7 72.2<br />
95 Colombia 0.393 89 64 50.2 20.9 50.3 59.6 57.9 79.8<br />
96 Dominica .. .. .. .. 21.9 .. .. .. ..<br />
97 Suriname 0.448 99 155 46.1 25.5 57.7 56.8 40.5 68.6<br />
97 Tunisia 0.289 58 62 6.8 31.3 37.5 49.9 25.1 71.3<br />
99 Dominican Republic 0.470 107 92 97.9 19.1 57.2 55.5 52.3 78.7<br />
99 Saint Vincent and the Grenadines .. .. 45 51.0 13.0 .. .. 56.3 77.2<br />
101 Tonga 0.659 152 124 15.2 0.0 d 91.2 91.1 52.8 74.0<br />
102 Libya 0.167 38 9 6.2 16.0 65.7 c 44.2 c 27.8 78.7<br />
103 Belize 0.375 81 28 65.9 13.3 77.9 77.4 56.3 83.6<br />
104 Samoa 0.439 97 51 25.0 6.1 77.8 70.4 23.1 58.0<br />
105 Maldives 0.312 64 68 6.7 5.9 34.3 30.9 57.3 78.8<br />
105 Uzbekistan 0.287 57 36 17.7 16.4 99.9 99.9 48.3 76.2<br />
MEDIUM HUMAN DEVELOPMENT<br />
107 Moldova (Republic of) 0.232 46 23 22.6 21.8 95.2 97.3 38.8 45.6<br />
108 Botswana 0.435 95 129 32.3 9.5 85.1 c 86.7 c 73.4 81.3<br />
109 Gabon 0.542 127 291 99.9 16.0 62.3 c 45.9 c 39.9 57.5<br />
110 Paraguay 0.464 104 132 57.4 16.8 46.2 47.0 58.1 84.6<br />
111 Egypt 0.565 135 33 51.9 2.2 f 54.5 c 68.2 c 22.8 76.1<br />
111 Turkmenistan .. .. 42 16.4 25.8 .. .. 47.3 77.5<br />
113 Indonesia 0.467 105 126 49.6 17.1 42.9 51.7 50.9 83.9<br />
114 Palestine, State of .. .. 45 58.6 .. 56.3 61.2 17.8 69.1<br />
115 Viet Nam 0.337 71 54 38.6 24.3 64.0 76.7 73.8 83.2<br />
116 Philippines 0.436 96 114 61.7 27.1 72.8 70.3 50.5 78.8<br />
117 El Salvador 0.384 85 54 65.2 32.1 39.4 44.8 49.1 79.2<br />
118 Bolivia (Plurinational State of) 0.446 98 206 70.8 51.8 49.6 58.7 63.9 82.5<br />
119 South Africa 0.394 90 138 45.5 41.2 g 73.7 76.2 46.2 60.2<br />
120 Kyrgyzstan 0.394 90 76 39.6 19.2 100.0 99.9 49.4 77.1<br />
121 Iraq 0.525 123 50 84.0 26.5 35.8 c 55.5 c 15.1 69.7<br />
TABLE<br />
5<br />
TABLE 5 Gender Inequality Index | 215
TABLE 5 GENDER INEQUALITY INDEX<br />
TABLE<br />
5<br />
Gender Inequality<br />
Index<br />
Value<br />
Rank<br />
Maternal<br />
mortality ratio<br />
(deaths per 100,000<br />
live births)<br />
Adolescent<br />
birth rate<br />
(births per 1,000 women<br />
ages 15–19)<br />
Share of seats<br />
in parliament<br />
(% held by women)<br />
Population with at least some<br />
secondary education<br />
Labour force<br />
participation rate<br />
(% ages 25 and older) (% ages 15 and older)<br />
Female Male Female Male<br />
HDI rank 2015 2015 2015 2015 a 2015 2005–2015 b 2005–2015 b 2015 2015<br />
122 Cabo Verde .. .. 42 73.4 20.8 h .. .. 53.2 84.2<br />
123 Morocco 0.494 113 121 31.7 15.7 25.7 c 33.2 c 25.3 74.3<br />
124 Nicaragua 0.462 103 150 88.8 41.3 45.7 c 44.1 c 49.1 80.3<br />
125 Guatemala 0.494 113 88 80.7 13.9 37.4 36.2 41.3 83.6<br />
125 Namibia 0.474 108 265 76.8 37.7 38.1 39.0 55.7 63.3<br />
127 Guyana 0.508 117 229 88.0 30.4 68.1 c 53.2 c 41.8 77.2<br />
127 Micronesia (Federated States of) .. .. 100 15.0 0.0 d .. .. .. ..<br />
129 Tajikistan 0.322 65 32 38.1 14.7 98.1 88.2 59.4 77.5<br />
130 Honduras 0.461 101 129 65.0 25.8 33.4 31.1 47.2 84.4<br />
131 India 0.530 125 174 24.5 12.2 35.3 c 61.4 c 26.8 79.1<br />
132 Bhutan 0.477 110 148 21.4 8.3 5.8 13.4 58.7 72.8<br />
133 Timor-Leste .. .. 215 46.6 38.5 .. .. 26.8 55.5<br />
134 Vanuatu .. .. 78 43.1 0.0 d .. .. 61.6 80.5<br />
135 Congo 0.592 141 442 117.7 11.5 45.0 c 50.0 c 67.1 72.6<br />
135 Equatorial Guinea .. .. 342 108.7 19.7 .. .. 71.3 92.0<br />
137 Kiribati .. .. 90 17.2 8.7 .. .. .. ..<br />
138 Lao People’s Democratic Republic 0.468 106 197 64.1 25.0 30.4 c 42.8 c 77.7 77.0<br />
139 Bangladesh 0.520 119 176 83.0 20.0 42.0 c 44.3 c 43.1 81.0<br />
139 Ghana 0.547 131 319 66.8 10.9 51.8 68.5 75.5 78.5<br />
139 Zambia 0.526 124 224 90.4 12.7 52.3 48.9 69.8 80.9<br />
142 Sao Tome and Principe 0.524 122 156 84.3 18.2 30.8 44.8 45.3 76.2<br />
143 Cambodia 0.479 112 161 51.6 19.0 13.2 26.1 75.5 86.7<br />
144 Nepal 0.497 115 258 71.9 29.5 24.1 c 41.2 c 79.7 86.8<br />
145 Myanmar 0.374 80 178 16.5 13.0 27.1 c 20.0 c 75.1 81.1<br />
146 Kenya 0.565 135 510 90.9 20.8 27.8 34.1 62.1 72.1<br />
147 Pakistan 0.546 130 178 38.7 20.0 26.5 46.1 24.3 82.2<br />
LOW HUMAN DEVELOPMENT<br />
148 Swaziland 0.566 137 389 70.4 14.7 27.3 c 30.5 c 40.0 64.2<br />
149 Syrian Arab Republic 0.554 133 68 39.4 12.4 34.8 43.4 12.2 70.8<br />
150 Angola .. .. 477 164.3 36.8 .. .. 59.9 77.1<br />
151 Tanzania (United Republic of) 0.544 129 398 118.6 36.0 10.1 15.3 74.0 83.3<br />
152 Nigeria .. .. 814 110.6 5.8 .. .. 48.4 64.0<br />
153 Cameroon 0.568 138 596 104.6 27.1 31.7 37.9 71.0 81.1<br />
154 Papua New Guinea 0.595 143 215 54.8 2.7 8.8 c 14.7 c 69.6 71.0<br />
154 Zimbabwe 0.540 126 443 109.7 35.1 51.9 64.7 77.8 87.3<br />
156 Solomon Islands .. .. 114 48.4 2.0 .. .. 61.1 73.5<br />
157 Mauritania 0.626 147 602 78.6 22.2 11.1 c 23.5 c 29.1 65.3<br />
158 Madagascar .. .. 353 116.2 20.5 .. .. 83.8 89.1<br />
159 Rwanda 0.383 84 290 26.3 57.5 10.5 16.4 86.4 83.2<br />
160 Comoros .. .. 335 68.3 3.0 .. .. 35.3 79.4<br />
160 Lesotho 0.549 132 487 92.7 24.8 23.6 22.5 59.2 73.9<br />
162 Senegal 0.521 120 315 78.6 42.7 10.2 19.2 45.0 70.2<br />
163 Haiti 0.593 142 359 39.3 3.5 25.7 c 38.7 c 61.5 71.4<br />
163 Uganda 0.522 121 343 111.9 35.0 25.9 32.1 82.3 87.7<br />
165 Sudan 0.575 140 311 74.0 31.0 13.7 c 18.8 c 24.3 72.2<br />
166 Togo 0.556 134 368 92.0 17.6 23.1 36.1 81.1 80.6<br />
167 Benin 0.613 144 405 83.2 7.2 15.8 30.8 70.0 73.4<br />
168 Yemen 0.767 159 385 61.5 0.5 15.6 c 33.2 c 25.8 73.1<br />
169 Afghanistan 0.667 154 396 74.0 27.4 8.8 c 35.4 c 19.1 83.6<br />
170 Malawi 0.614 145 634 136.2 16.7 14.9 24.2 81.2 80.8<br />
171 Côte d’Ivoire 0.672 155 645 135.5 9.2 16.6 c 32.7 c 52.4 80.9<br />
172 Djibouti .. .. 229 21.5 12.7 .. .. 36.5 68.1<br />
173 Gambia 0.641 148 706 113.0 9.4 25.3 c 39.1 c 72.2 82.7<br />
174 Ethiopia 0.499 116 353 58.4 37.3 10.8 20.7 77.0 89.1<br />
175 Mali 0.689 156 587 174.6 8.8 7.3 16.2 50.1 82.3<br />
176 Congo (Democratic Republic of the) 0.663 153 693 122.6 8.2 14.5 c 35.0 c 70.5 71.8<br />
177 Liberia 0.649 150 725 108.8 10.7 17.3 c 39.7 c 58.0 63.9<br />
178 Guinea-Bissau .. .. 549 89.5 13.7 .. .. 67.2 78.3<br />
179 Eritrea .. .. 501 54.3 22.0 .. .. 77.7 90.2<br />
179 Sierra Leone 0.650 151 1,360 118.2 12.4 16.8 c 29.7 c 65.0 68.6<br />
216 | HUMAN DEVELOPMENT REPORT <strong>2016</strong>
HUMAN DEVELOPMENT REPORT <strong>2016</strong><br />
<strong>Human</strong> <strong>Development</strong> for Everyone<br />
Gender Inequality<br />
Index<br />
Maternal<br />
mortality ratio<br />
Adolescent<br />
birth rate<br />
Share of seats<br />
in parliament<br />
Population with at least some<br />
secondary education<br />
Labour force<br />
participation rate<br />
Value<br />
Rank<br />
(deaths per 100,000<br />
live births)<br />
(births per 1,000 women<br />
ages 15–19)<br />
(% held by women)<br />
(% ages 25 and older) (% ages 15 and older)<br />
Female Male Female Male<br />
HDI rank 2015 2015 2015 2015 a 2015 2005–2015 b 2005–2015 b 2015 2015<br />
181 Mozambique 0.574 139 489 139.7 39.6 2.8 c 8.0 c 82.5 75.4<br />
181 South Sudan .. .. 789 65.9 24.3 .. .. 71.2 75.3<br />
183 Guinea .. .. 679 140.6 21.9 .. .. 79.5 85.1<br />
184 Burundi 0.474 108 712 28.3 37.8 7.1 c 9.6 c 84.6 82.7<br />
185 Burkina Faso 0.615 146 371 108.5 9.4 6.0 11.5 76.6 90.7<br />
186 Chad 0.695 157 856 133.5 14.9 1.7 9.9 64.0 79.3<br />
187 Niger 0.695 157 553 202.4 13.3 3.6 c 8.4 c 40.2 89.4<br />
188 Central African Republic 0.648 149 882 91.9 12.5 f 12.3 c 29.8 c 71.7 84.6<br />
OTHER COUNTRIES OR TERRITORIES<br />
Korea (Democratic People’s Rep. of) .. .. 82 0.5 16.3 .. .. 73.6 85.9<br />
Marshall Islands .. .. .. .. 9.1 91.6 92.5 .. ..<br />
Monaco .. .. .. .. 20.8 .. .. .. ..<br />
Nauru .. .. .. .. 5.3 .. .. .. ..<br />
San Marino .. .. .. .. 16.7 .. .. .. ..<br />
Somalia .. .. 732 103.9 13.8 .. .. 33.2 75.9<br />
Tuvalu .. .. .. .. 6.7 .. .. .. ..<br />
<strong>Human</strong> development groups<br />
Very high human development 0.174 — 14 17.0 25.8 88.4 89.3 52.6 68.6<br />
High human development 0.291 — 36 27.4 21.6 66.9 74.0 56.5 77.1<br />
Medium human development 0.491 — 164 40.8 19.9 40.4 57.6 37.2 79.4<br />
Low human development 0.590 — 553 101.8 22.0 14.8 25.9 60.3 77.1<br />
Developing countries 0.469 — 231 48.8 21.0 51.7 63.4 48.7 78.2<br />
Regions<br />
Arab States 0.535 — 142 47.7 15.5 41.6 52.3 22.3 75.1<br />
East Asia and the Pacific 0.315 — 63 23.1 19.6 64.1 73.0 62.3 79.1<br />
Europe and Central Asia 0.279 — 24 26.6 19.0 78.1 85.7 45.4 70.5<br />
Latin America and the Caribbean 0.390 — 67 64.3 28.1 57.8 58.1 52.8 78.6<br />
South Asia 0.520 — 175 33.7 17.4 36.9 58.6 28.3 79.4<br />
Sub-Saharan Africa 0.572 — 551 103.0 23.3 25.3 33.9 64.9 76.1<br />
Least developed countries 0.555 — 436 T 91.4 22.3 21.8 29.5 61.5 80.9<br />
Small island developing states 0.463 — 204 59.0 23.4 55.2 58.2 53.4 72.7<br />
Organisation for Economic<br />
Co‐operation and <strong>Development</strong> 0.194 — 15 22.4 27.7 84.2 86.9 51.1 68.6<br />
World 0.443 — 216 T 44.7 22.5 60.3 69.2 49.6 76.2<br />
TABLE<br />
5<br />
NOTES<br />
a Data are average of period estimates for<br />
2010–2015 and projections for 2015–2020.<br />
b Data refer to the most recent year available<br />
during the period specified.<br />
c Based on Barro and Lee (<strong>2016</strong>).<br />
d In calculating the Gender Inequality Index, a value<br />
of 0.1 percent was used.<br />
e Refers to 2014.<br />
f Refers to 2012.<br />
g Excludes the 36 special rotating delegates<br />
appointed on an ad hoc basis.<br />
h Refers to 2013.<br />
T From original data source.<br />
DEFINITIONS<br />
Gender Inequality Index: A composite measure<br />
reflecting inequality in achievement between women<br />
and men in three dimensions: reproductive health,<br />
empowerment and the labour market. See Technical<br />
note 4 at http://hdr.undp.org/sites/default/files/<br />
hdr<strong>2016</strong>_technical_notes.pdf for details on how the<br />
Gender Inequality Index is calculated.<br />
Maternal mortality ratio: Number of deaths due to<br />
pregnancy-related causes per 100,000 live births.<br />
Adolescent birth rate: Number of births to women<br />
ages 15–19 per 1,000 women ages 15–19.<br />
Share of seats in parliament: Proportion of seats<br />
held by women in the national parliament expressed<br />
as percentage of total seats. For countries with a<br />
bicameral legislative system, the share of seats is<br />
calculated based on both houses.<br />
Population with at least some secondary<br />
education: Percentage of the population ages 25<br />
and older that has reached (but not necessarily<br />
completed) a secondary level of education.<br />
Labour force participation rate: Proportion of<br />
the working-age population (ages 15 and older) that<br />
engages in the labour market, either by working or<br />
actively looking for work, expressed as a percentage<br />
of the working-age population.<br />
MAIN DATA SOURCES<br />
Column 1: HDRO calculations based on data in<br />
columns 3–9.<br />
Column 2: Calculated based on data in column 1.<br />
Column 3: UN Maternal Mortality Estimation Group<br />
(<strong>2016</strong>).<br />
Column 4: UNDESA (2015a).<br />
Column 5: IPU (<strong>2016</strong>).<br />
Columns 6 and 7: UNESCO Institute for Statistics<br />
(<strong>2016</strong>).<br />
Columns 8 and 9: ILO (<strong>2016</strong>a).<br />
TABLE 5 Gender Inequality Index | 217
TABLE<br />
6<br />
Multidimensional Poverty Index: developing countries<br />
TABLE<br />
6<br />
Country<br />
Multidimensional<br />
Poverty Index a<br />
Year and<br />
survey b Index Headcount<br />
Population in multidimensional<br />
poverty a<br />
Population<br />
near<br />
multidimensional<br />
poverty a<br />
Population<br />
in severe<br />
multidimensional<br />
poverty a<br />
Contribution of deprivation in<br />
dimension to overall poverty a<br />
Intensity of<br />
deprivation (%)<br />
2005–2015 Value (%) (thousands) (%) (%) (%) Education Health<br />
Population living below<br />
income poverty line<br />
National<br />
poverty line<br />
(%)<br />
PPP $1.90<br />
a day<br />
Living<br />
standards 2005–2014 c 2005–2014 c<br />
Afghanistan 2010/2011 M 0.293 d 58.8 d 16,942 d 49.9 d 16.0 d 29.8 d 45.6 d 19.2 d 35.2 d 35.8 ..<br />
Albania 2008/2009 D 0.005 1.2 35 38.3 7.2 0.1 22.4 47.1 30.5 14.3 1.1<br />
Argentina 2005 N 0.015 e 3.7 e 1,457 e 39.1 e 5.2 e 0.5 e 38.2 e 27.8 e 34.0 e .. 1.7<br />
Armenia 2010 D 0.002 0.6 18 37.0 3.0 0.1 3.4 87.8 8.7 30.0 2.3<br />
Azerbaijan 2006 D 0.009 2.4 210 38.2 11.5 0.2 20.0 50.7 29.3 6.0 0.5<br />
Bangladesh 2014 D 0.188 40.7 64,816 46.2 19.6 16.0 28.4 26.1 45.5 31.5 18.5<br />
Barbados 2012 M 0.004 f 1.2 f 3 f 33.7 f 0.3 f 0.0 f 1.5 f 95.9 f 2.6 f .. ..<br />
Belarus 2005 M 0.001 0.4 41 34.5 1.1 0.0 2.6 89.7 7.7 5.1 0.0<br />
Belize 2011 M 0.030 7.4 24 41.2 6.4 1.5 36.2 34.8 29.0 .. ..<br />
Benin 2011/2012 D 0.343 64.2 6,454 53.3 16.9 37.7 33.1 24.8 42.1 36.2 53.1<br />
Bhutan 2010 M 0.128 29.4 212 43.5 18.0 8.8 40.3 26.3 33.4 12.0 2.2<br />
Bolivia (Plurinational State of) 2008 D 0.097 20.6 1,974 47.0 17.3 7.8 21.9 27.9 50.2 38.6 6.8<br />
Bosnia and Herzegovina 2011/2012 M 0.006 f 1.7 f 65 f 37.3 f 3.2 f 0.0 f 7.8 f 79.5 f 12.7 f 17.9 0.1<br />
Brazil 2014 N 0.010 d,g 2.4 d,g 4,994 d,g 40.0 d,g 6.7 d,g 0.3 d,g 24.9 d,g 45.1 d,g 30.1 d,g 7.4 3.7<br />
Burkina Faso 2010 D 0.508 82.8 12,951 61.3 7.6 63.8 39.0 22.5 38.5 40.1 43.7<br />
Burundi 2010 D 0.442 81.8 7,740 54.0 12.0 48.2 25.0 26.3 48.8 64.6 77.7<br />
Cambodia 2014 D 0.150 33.8 5,180 44.3 21.6 11.4 30.8 26.4 42.8 17.7 2.2<br />
Cameroon 2011 D 0.260 48.2 10,170 54.1 17.8 27.1 24.5 31.3 44.2 37.5 24.0<br />
Central African Republic 2010 M 0.424 76.3 3,392 55.6 15.7 48.5 23.8 26.2 50.0 62.0 66.3<br />
Chad 2010 M 0.545 86.9 10,339 62.7 8.8 67.6 32.3 22.5 45.2 46.7 38.4<br />
China 2012 N 0.023 g 5.2 g 70,807 g 43.3 g 22.7 g 1.0 g 30.0 g 36.6 g 33.4 g .. 1.9<br />
Colombia 2010 D 0.032 7.6 3,494 42.2 10.2 1.8 34.3 24.7 41.0 27.8 5.7<br />
Comoros 2012 D/M 0.165 34.3 252 48.1 23.1 14.9 29.1 25.9 45.0 44.8 13.5<br />
Congo 2011/2012 D 0.192 43.0 1,844 44.7 26.2 12.2 10.6 32.8 56.6 46.5 37.0<br />
Congo (Democratic Republic of the) 2013/2014 D 0.369 72.5 54,314 50.8 18.5 36.7 15.6 31.0 53.4 63.6 77.1<br />
Côte d’Ivoire 2011/2012 D 0.307 59.3 12,521 51.7 17.9 32.4 36.5 25.8 37.7 46.3 29.0<br />
Djibouti 2006 M 0.127 26.9 213 47.3 16.0 11.1 36.1 22.7 41.2 .. 22.5<br />
Dominican Republic 2013 D 0.025 6.0 613 41.6 20.6 1.0 28.4 39.6 32.0 32.4 2.3<br />
Ecuador 2013/2014 N 0.015 3.7 585 39.6 8.4 0.5 23.6 42.4 34.0 23.3 3.8<br />
Egypt 2014 D 0.016 h 4.2 h 3,750 h 37.4 h 5.6 h 0.4 h 45.6 h 46.7 h 7.8 h 25.2 ..<br />
Ethiopia 2011 D 0.537 88.2 79,298 60.9 6.7 67.0 27.4 25.2 47.4 29.6 33.5<br />
Gabon 2012 D 0.073 16.7 270 43.4 19.9 4.4 15.2 43.8 40.9 32.7 8.0<br />
Gambia 2013 D 0.289 57.2 1,068 50.5 21.3 31.7 32.9 30.9 36.2 48.4 ..<br />
Georgia 2005 M 0.008 2.2 99 37.6 4.1 0.1 7.4 67.4 25.2 14.8 9.8<br />
Ghana 2014 D 0.147 32.4 8,688 45.4 20.5 11.1 27.2 31.5 41.2 24.2 25.2<br />
Guinea 2012 D/M 0.425 73.8 8,588 57.6 12.7 49.8 36.6 22.8 40.6 55.2 35.3<br />
Guinea-Bissau 2006 M 0.495 80.4 1,201 61.6 10.5 58.4 30.5 27.9 41.6 69.3 67.1<br />
Guyana 2009 D 0.031 7.8 59 40.0 18.8 1.2 16.8 51.2 32.0 .. ..<br />
Haiti 2012 D 0.242 50.2 5,161 48.1 22.2 20.1 24.8 23.4 51.8 58.5 53.9<br />
Honduras 2011/2012 D 0.098 i 20.7 i 1,601 i 47.4 i 28.6 i 7.2 i 36.6 i 23.1 i 40.3 i 62.8 16.0<br />
India 2005/2006 D 0.282 55.3 642,391 51.1 18.2 27.8 22.7 32.5 44.8 21.9 21.2<br />
Indonesia 2012 D 0.024 d 5.9 d 14,644 d 41.3 d 8.1 d 1.1 d 24.7 d 35.1 d 40.2 d 11.3 8.3<br />
Iraq 2011 M 0.052 13.3 4,241 39.4 7.4 2.5 50.1 38.6 11.3 18.9 ..<br />
Jamaica 2012 N 0.011 f,g 2.7 f,g 76 f,g 40.5 f,g 9.6 f,g 0.5 f,g 8.8 f,g 52.0 f,g 39.2 f,g 19.9 1.7<br />
Jordan 2012 D 0.004 1.2 85 35.3 1.0 0.1 31.5 65.0 3.5 14.4 ..<br />
Kazakhstan 2010/2011 M 0.004 1.1 178 36.4 2.3 0.0 4.3 83.9 11.8 2.7 0.0<br />
Kenya 2014 D 0.166 36.0 16,170 46.1 32.0 10.7 12.3 32.2 55.5 45.9 33.6<br />
Kyrgyzstan 2014 M 0.008 2.2 127 36.3 6.5 0.0 13.0 73.5 13.5 32.1 1.3<br />
Lao People’s Democratic Republic 2011/2012 M 0.186 36.8 2,383 50.5 18.5 18.8 37.7 25.4 36.9 23.2 16.7<br />
Lesotho 2009 D 0.227 49.5 984 45.9 20.4 18.2 14.8 33.8 51.4 57.1 59.7<br />
Liberia 2013 D 0.356 70.1 3,010 50.8 21.5 35.4 23.0 25.6 51.4 63.8 68.6<br />
Libya 2007 P 0.005 1.4 82 37.5 6.3 0.1 31.9 47.9 20.2 .. ..<br />
Madagascar 2008/2009 D 0.420 77.0 15,774 54.6 11.7 48.0 31.6 24.5 43.9 75.3 77.8<br />
Malawi 2013/2014 M 0.273 56.1 9,369 48.6 27.2 24.3 19.3 27.2 53.5 50.7 70.9<br />
Maldives 2009 D 0.008 2.0 7 37.5 8.5 0.1 27.8 60.2 11.9 15.7 7.3<br />
Mali 2012/2013 D 0.456 78.4 13,009 58.2 10.8 55.9 37.9 22.4 39.7 43.6 49.3<br />
Mauritania 2011 M 0.291 55.6 2,049 52.4 16.8 29.9 34.5 20.3 45.3 42.0 5.9<br />
Mexico 2012 N 0.024 6.0 7,346 39.9 10.1 1.1 31.4 25.6 43.0 53.2 3.0<br />
Moldova (Republic of) 2012 M 0.004 1.1 44 38.4 2.2 0.1 11.0 66.9 22.1 11.4 0.0<br />
Mongolia 2010 M 0.047 11.1 302 42.5 19.3 2.3 18.1 27.7 54.2 21.6 0.2<br />
Montenegro 2013 M 0.002 0.5 3 38.9 2.0 0.0 22.0 59.9 18.1 8.6 0.0<br />
218 | HUMAN DEVELOPMENT REPORT <strong>2016</strong>
HUMAN DEVELOPMENT REPORT <strong>2016</strong><br />
<strong>Human</strong> <strong>Development</strong> for Everyone<br />
Country<br />
Multidimensional<br />
Poverty Index a<br />
Year and<br />
survey b Index Headcount<br />
Population in multidimensional<br />
poverty a<br />
Population<br />
near<br />
multidimensional<br />
poverty a<br />
Population<br />
in severe<br />
multidimensional<br />
poverty a<br />
Contribution of deprivation in<br />
dimension to overall poverty a<br />
Intensity of<br />
deprivation (%)<br />
2005–2015 Value (%) (thousands) (%) (%) (%) Education Health<br />
Population living below<br />
income poverty line<br />
National<br />
poverty line<br />
(%)<br />
PPP $1.90<br />
a day<br />
Living<br />
standards 2005–2014 c 2005–2014 c<br />
Morocco 2011 P 0.069 15.6 5,090 44.3 12.6 4.9 44.8 21.8 33.4 8.9 3.1<br />
Mozambique 2011 D 0.390 70.2 17,552 55.6 14.8 44.1 30.4 22.3 47.3 54.7 68.7<br />
Namibia 2013 D 0.205 44.9 1,054 45.5 19.3 13.4 11.0 39.2 49.8 28.7 22.6<br />
Nepal 2014 M 0.116 26.6 7,493 43.7 14.4 9.3 32.2 25.6 42.2 25.2 15.0<br />
Nicaragua 2011/2012 D 0.088 19.4 1,127 45.6 14.8 6.9 37.8 12.6 49.6 29.6 6.2<br />
Niger 2012 D 0.584 89.8 15,838 65.0 5.9 73.5 35.9 24.0 40.0 48.9 45.7<br />
Nigeria 2013 D 0.279 50.9 88,018 54.8 18.4 30.0 29.8 29.8 40.4 46.0 53.5<br />
Pakistan 2012/2013 D 0.237 45.6 82,612 52.0 14.9 26.5 36.2 32.3 31.6 29.5 6.1<br />
Palestine, State of 2014 M 0.005 1.4 65 38.2 5.4 0.2 20.8 67.8 11.5 25.8 0.1<br />
Peru 2012 D 0.043 10.4 3,150 41.4 12.3 2.1 19.4 29.8 50.8 21.8 3.1<br />
Philippines 2013 D 0.033 d,j 6.3 d,j 6,169 d,j 51.9 d,j 8.4 d,j 4.2 d,j 35.3 d,j 30.2 d,j 34.5 d,j 25.2 13.1<br />
Rwanda 2014/2015 D 0.253 53.9 6,263 47.0 25.0 20.5 28.6 18.4 53.0 44.9 60.4<br />
Saint Lucia 2012 M 0.003 f 0.8 f 2 f 34.5 f 0.9 f 0.0 f 15.8 f 65.2 f 19.0 f .. ..<br />
Sao Tome and Principe 2008/2009 D 0.217 47.5 79 45.5 21.5 16.4 29.1 26.5 44.4 61.7 32.3<br />
Senegal 2014 D 0.278 51.9 7,621 53.5 18.1 30.8 43.6 23.1 33.4 46.7 38.0<br />
Serbia 2014 M 0.002 0.4 38 40.6 2.7 0.1 30.7 40.7 28.7 25.4 0.2<br />
Sierra Leone 2013 D 0.411 77.5 4,791 53.0 14.6 43.9 25.7 28.5 45.9 52.9 52.3<br />
Somalia 2006 M 0.500 81.8 7,104 61.1 8.3 63.6 33.7 18.8 47.5 .. ..<br />
South Africa 2012 N 0.041 10.3 5,446 39.6 17.1 1.3 8.4 61.4 30.2 53.8 16.6<br />
South Sudan 2010 M 0.551 89.3 8,980 61.7 8.5 69.6 39.3 14.3 46.3 50.6 42.7<br />
Sudan 2010 M 0.290 53.1 19,161 54.6 17.9 31.9 30.4 20.7 48.9 46.5 14.9<br />
Suriname 2010 M 0.033 f 7.6 f 39 f 43.1 f 4.7 f 2.0 f 31.0 f 37.2 f 31.8 f .. ..<br />
Swaziland 2010 M 0.113 25.9 309 43.5 20.5 7.4 13.7 41.0 45.3 63.0 42.0<br />
Syrian Arab Republic 2009 P 0.028 7.2 1,485 39.1 7.4 1.3 54.7 34.0 11.3 35.2 ..<br />
Tajikistan 2012 D 0.031 7.9 623 39.0 23.4 1.2 13.4 52.6 34.0 31.3 19.5<br />
Tanzania (United Republic of) 2010 D 0.335 66.4 30,290 50.4 21.5 32.1 16.9 28.2 54.9 28.2 46.6<br />
Thailand 2005/2006 M 0.004 1.0 667 38.8 4.4 0.1 19.4 51.3 29.4 10.5 0.0<br />
The former Yugoslav Republic of Macedonia 2011 M 0.007 f 1.7 f 35 f 38.4 f 2.4 f 0.1 f 18.5 f 57.2 f 24.3 f 22.1 1.3<br />
Timor-Leste 2009/2010 D 0.322 64.3 680 50.1 21.4 31.5 20.0 30.4 49.6 41.8 46.8<br />
Togo 2013/2014 D 0.242 48.5 3,454 49.9 19.9 23.2 26.4 28.8 44.9 55.1 54.2<br />
Trinidad and Tobago 2006 M 0.007 d 1.7 d 23 d 38.0 d 0.5 d 0.2 d 2.2 d 86.1 d 11.7 d .. ..<br />
Tunisia 2011/2012 M 0.006 1.5 161 39.3 3.2 0.2 33.7 48.2 18.1 15.5 2.0<br />
Turkmenistan 2006 M 0.011 3.0 144 37.0 6.5 0.1 7.4 82.5 10.1 .. ..<br />
Uganda 2011 D 0.359 70.3 24,088 51.1 20.6 33.3 18.0 30.2 51.9 19.5 34.6<br />
Ukraine 2012 M 0.001 d 0.4 d 161 d 34.5 d 0.0 d 0.0 d 19.0 d 77.5 d 3.5 d 6.4 0.0<br />
Uzbekistan 2006 M 0.013 3.5 931 36.6 6.2 0.1 3.7 83.4 12.8 14.1 ..<br />
Vanuatu 2007 M 0.135 31.2 69 43.1 32.6 7.3 24.4 24.1 51.6 12.7 15.4<br />
Viet Nam 2013/2014 M 0.016 d 3.9 d 3,646 d 39.9 d 4.3 d 0.6 d 39.6 d 24.3 d 36.1 d 13.5 3.1<br />
Yemen 2013 D 0.200 40.0 10,204 50.1 22.4 19.4 29.5 32.2 38.2 34.8 ..<br />
Zambia 2013/2014 D 0.264 54.4 8,554 48.6 23.1 22.5 17.9 29.8 52.3 60.5 64.4<br />
Zimbabwe 2014 M 0.128 28.9 4,409 44.1 29.3 7.8 10.8 34.5 54.8 72.3 21.4<br />
TABLE<br />
6<br />
NOTES<br />
a Not all indicators were available for all countries,<br />
so caution should be used in cross-country<br />
comparisons. Where an indicator is missing,<br />
weights of available indicators are adjusted<br />
to total 100 percent. See Technical note 5 at<br />
http://hdr.undp.org/sites/default/files/hdr<strong>2016</strong>_<br />
technical_notes.pdf for details.<br />
b D indicates data from Demographic and<br />
Health Surveys, M from Multiple Indicator<br />
Cluster Surveys, P from Pan Arab Population<br />
and Family Health Survey and N from national<br />
surveys (see http://hdr.undp.org/en/faq-page/<br />
multidimensional-poverty-index-mpi for the list of<br />
national surveys).<br />
c Data refer to the most recent year available<br />
during the period specified.<br />
d Missing indicators on nutrition.<br />
e Refers to urban areas only<br />
f Missing indicator on child mortality.<br />
g Missing indicator on type of floor.<br />
h Missing indicator on cooking fuel.<br />
i Missing indicator on electricity.<br />
j Missing indicator on school attendance.<br />
DEFINITIONS<br />
Multidimensional Poverty Index: Percentage<br />
of the population that is multidimensionally poor<br />
adjusted by the intensity of the deprivations. See<br />
Technical note 5 at http://hdr.undp.org/sites/<br />
default/files/hdr<strong>2016</strong>_technical_notes.pdf for<br />
details on how the Multidimensional Poverty Index<br />
is calculated.<br />
Multidimensional poverty headcount:<br />
Percentage of the population with a deprivation<br />
score of at least 33 percent. It is also expressed in<br />
thousands of the population in the survey year.<br />
Intensity of deprivation of multidimensional<br />
poverty: Average deprivation score experienced by<br />
people in multidimensional poverty.<br />
Population near multidimensional poverty:<br />
Percentage of the population at risk of suffering<br />
multiple deprivations — that is, those with a<br />
deprivation score of 20–33 percent.<br />
Population in severe multidimensional<br />
poverty: Percentage of the population in severe<br />
multidimensional poverty — that is, those with a<br />
deprivation score of 50 percent or more.<br />
Contribution of deprivation to overall poverty:<br />
Percentage of the Multidimensional Poverty Index<br />
attributed to deprivations in each dimension.<br />
Population living below national poverty<br />
line: Percentage of the population living below<br />
the national poverty line, which is the poverty<br />
line deemed appropriate for a country by its<br />
authorities. National estimates are based on<br />
population‐weighted subgroup estimates from<br />
household surveys.<br />
Population living below PPP$1.90 a day:<br />
Percentage of the population living below the<br />
international poverty line $1.90 (in purchasing power<br />
parity terms) a day.<br />
MAIN DATA SOURCES<br />
Column 1: Refers to the year and the survey<br />
whose data were used to calculate the country’s<br />
multidimensional poverty index and its components.<br />
Columns 2–10: HDRO calculations based on data<br />
on household deprivations in education, health and<br />
living standards from various household surveys<br />
listed in column 1 using a revised methodology<br />
described in Technical note 5 (available at at http://<br />
hdr.undp.org/sites/default/files/hdr<strong>2016</strong>_technical_<br />
notes.pdf).<br />
Columns 11 and 12: World Bank (<strong>2016</strong>a).<br />
TABLE 6 Multidimensional Poverty Index: developing countries | 219
<strong>Human</strong> development<br />
indicators
TABLE<br />
7<br />
Population trends<br />
Total<br />
Population<br />
Average annual<br />
Under<br />
growth Urban a age 5<br />
Ages<br />
15–64<br />
Ages 65<br />
and older<br />
Median<br />
age<br />
(millions) (%) (%) (millions) (years)<br />
Dependency ratio<br />
(per 100 people<br />
ages 15–64)<br />
Young age<br />
(0–14)<br />
Old age<br />
(65 and older)<br />
Total fertility rate<br />
(births<br />
per woman)<br />
TABLE<br />
7<br />
HDI rank 2015 2030 b 2000/2005 2010/2015 2015 2015 2015 2015 2015 2015 2015 2000/2005 2010/2015<br />
VERY HIGH HUMAN DEVELOPMENT<br />
1 Norway c 5.2 5.9 0.6 1.3 80.5 0.3 3.4 0.9 39.1 27.3 24.9 1.8 1.8<br />
2 Australia d 24.0 28.5 1.2 1.6 89.4 1.5 15.9 3.6 37.5 28.2 22.7 1.8 1.9<br />
2 Switzerland 8.3 9.2 0.7 1.2 73.9 0.4 5.6 1.5 42.3 22.0 26.9 1.4 1.5<br />
4 Germany 80.7 79.3 –0.2 0.1 75.3 3.4 53.2 17.1 46.2 19.6 32.2 1.4 1.4<br />
5 Denmark 5.7 6.0 0.3 0.4 87.7 0.3 3.6 1.1 41.6 26.3 29.6 1.8 1.7<br />
5 Singapore 5.6 6.4 2.7 2.0 100.0 0.3 4.1 0.7 40.0 21.4 16.1 1.3 1.2<br />
7 Netherlands 16.9 17.6 0.5 0.4 90.5 0.9 11.0 3.1 42.7 25.3 27.9 1.7 1.8<br />
8 Ireland 4.7 5.2 1.8 0.3 63.2 0.4 3.1 0.6 36.9 33.5 20.2 2.0 2.0<br />
9 Iceland 0.3 0.4 1.1 0.7 94.1 0.0 0.2 0.0 36.0 30.8 20.8 2.0 2.0<br />
10 Canada 35.9 40.4 1.0 1.0 81.8 1.9 .. 5.8 40.6 23.5 23.8 1.5 1.6<br />
10 United States 321.8 355.8 0.9 0.8 81.6 19.7 213.2 47.6 38.0 28.6 22.3 2.0 1.9<br />
12 Hong Kong, China (SAR) 7.3 8.0 0.2 0.8 100.0 0.4 5.3 1.1 43.2 16.4 20.6 1.0 1.2<br />
13 New Zealand 4.5 5.1 1.4 0.7 86.3 0.3 2.9 0.7 38.0 31.1 22.9 1.9 2.1<br />
14 Sweden 9.8 10.8 0.4 0.8 85.8 0.6 6.1 1.9 41.0 27.5 31.8 1.7 1.9<br />
15 Liechtenstein 0.0 0.0 0.9 0.7 14.3 .. .. .. .. .. .. .. ..<br />
16 United Kingdom 64.7 70.1 0.5 0.6 82.6 4.1 41.7 11.5 40.0 27.6 27.6 1.7 1.9<br />
17 Japan 126.6 120.1 0.2 –0.1 93.5 5.3 77.0 33.3 46.5 21.1 43.3 1.3 1.4<br />
18 Korea (Republic of) 50.3 52.5 0.6 0.5 82.5 2.3 36.7 6.6 40.6 19.2 18.0 1.2 1.3<br />
19 Israel 8.1 10.0 1.9 1.7 92.1 0.8 4.9 0.9 30.3 45.7 18.4 2.9 3.1<br />
20 Luxembourg 0.6 0.7 1.0 2.2 90.2 0.0 0.4 0.1 39.2 23.6 20.1 1.7 1.6<br />
21 France 64.4 68.0 0.6 0.5 79.5 3.9 40.2 12.3 41.2 29.6 30.6 1.9 2.0<br />
22 Belgium 11.3 12.0 0.6 0.7 97.9 0.7 7.3 2.1 41.5 26.1 28.1 1.7 1.8<br />
23 Finland e 5.5 5.7 0.3 0.5 84.2 0.3 3.5 1.1 42.5 25.9 32.4 1.8 1.7<br />
24 Austria 8.5 8.8 0.5 0.4 66.0 0.4 5.7 1.6 43.2 21.2 28.0 1.4 1.5<br />
25 Slovenia 2.1 2.1 0.1 0.1 49.7 0.1 1.4 0.4 43.1 22.0 26.7 1.2 1.6<br />
26 Italy 59.8 59.1 0.5 0.1 69.0 2.6 38.2 13.4 45.9 21.5 35.1 1.3 1.4<br />
27 Spain f 46.1 45.9 1.5 –0.2 79.6 2.1 30.6 8.7 43.2 22.4 28.3 1.3 1.3<br />
28 Czech Republic 10.5 10.5 –0.1 0.1 73.0 0.5 7.1 1.9 41.5 22.5 27.0 1.2 1.5<br />
29 Greece 11.0 10.5 0.2 –0.4 78.0 0.5 7.0 2.3 43.6 22.8 33.4 1.3 1.3<br />
30 Brunei Darussalam 0.4 0.5 1.8 1.5 77.2 0.0 0.3 0.0 30.6 31.9 6.1 2.1 1.9<br />
30 Estonia 1.3 1.2 –0.6 –0.3 67.5 0.1 0.9 0.2 41.7 24.7 28.8 1.4 1.6<br />
32 Andorra 0.1 0.1 4.3 –3.6 85.1 .. .. .. .. .. .. .. ..<br />
33 Cyprus g 1.2 1.3 1.8 1.1 66.9 0.1 0.8 0.1 35.9 23.4 18.2 1.6 1.5<br />
33 Malta 0.4 0.4 0.5 0.3 95.4 0.0 0.3 0.1 41.5 21.8 29.0 1.5 1.4<br />
33 Qatar 2.2 2.8 6.9 4.7 99.2 0.1 1.9 0.0 30.7 18.6 1.4 3.0 2.1<br />
36 Poland 38.6 37.2 0.0 0.0 60.5 2.0 26.8 6.0 39.6 21.5 22.3 1.3 1.4<br />
37 Lithuania 2.9 2.7 –0.8 –1.6 66.5 0.2 1.9 0.5 43.1 21.8 28.3 1.3 1.6<br />
38 Chile 17.9 20.2 1.2 1.1 89.5 1.2 12.4 2.0 34.4 29.3 16.0 2.0 1.8<br />
38 Saudi Arabia 31.5 39.1 2.9 2.3 83.1 3.2 21.6 0.9 28.3 41.7 4.2 3.6 2.9<br />
40 Slovakia 5.4 5.4 0.0 0.1 53.6 0.3 3.9 0.8 39.1 21.3 19.5 1.2 1.4<br />
41 Portugal 10.3 9.8 0.4 –0.4 63.5 0.4 6.7 2.2 44.0 21.6 31.9 1.5 1.3<br />
42 United Arab Emirates 9.2 11.0 7.7 1.9 85.5 0.5 7.8 0.1 33.3 16.4 1.3 2.4 1.8<br />
43 Hungary 9.9 9.3 –0.3 –0.3 71.2 0.5 6.7 1.8 41.3 21.5 26.3 1.3 1.3<br />
44 Latvia 2.0 1.8 –1.3 –1.2 67.4 0.1 1.3 0.4 42.9 22.7 29.5 1.3 1.5<br />
45 Argentina 43.4 49.4 1.1 1.0 91.8 3.7 27.7 4.7 30.8 39.4 17.1 2.5 2.3<br />
45 Croatia 4.2 4.0 –0.2 –0.4 59.0 0.2 2.8 0.8 42.8 22.5 28.6 1.4 1.5<br />
47 Bahrain 1.4 1.6 5.3 1.8 88.8 0.1 1.0 0.0 30.3 28.2 3.2 2.7 2.1<br />
48 Montenegro 0.6 0.6 0.1 0.1 64.0 0.0 0.4 0.1 37.6 27.6 20.2 1.9 1.7<br />
49 Russian Federation 143.5 138.7 –0.4 0.0 74.0 9.2 100.3 19.2 38.7 24.0 19.1 1.3 1.7<br />
50 Romania 19.5 17.6 –0.7 –0.8 54.6 0.9 13.1 3.4 42.1 23.1 25.8 1.3 1.5<br />
51 Kuwait 3.9 5.0 3.2 4.8 98.3 0.3 2.9 0.1 31.0 29.5 2.6 2.6 2.2<br />
HIGH HUMAN DEVELOPMENT<br />
52 Belarus 9.5 9.0 –0.6 0.0 76.7 0.6 6.6 1.3 39.6 23.0 20.0 1.3 1.6<br />
52 Oman 4.5 5.2 2.3 8.4 77.6 0.4 3.5 0.1 29.0 26.7 3.4 3.2 2.9<br />
54 Barbados 0.3 0.3 0.3 0.3 31.5 0.0 0.2 0.0 38.5 29.1 21.3 1.8 1.8<br />
54 Uruguay 3.4 3.6 0.0 0.3 95.3 0.2 2.2 0.5 34.9 33.4 22.5 2.2 2.0<br />
56 Bulgaria 7.1 6.3 –0.8 –0.7 73.9 0.3 4.7 1.4 43.5 21.5 30.4 1.2 1.5<br />
56 Kazakhstan 17.6 20.1 0.7 1.6 53.2 1.9 11.7 1.2 29.3 40.1 10.1 2.0 2.6<br />
58 Bahamas 0.4 0.4 2.0 1.5 82.9 0.0 0.3 0.0 32.4 29.6 11.7 1.9 1.9<br />
59 Malaysia h 30.3 36.1 1.9 1.5 74.7 2.5 21.1 1.8 28.5 35.2 8.4 2.5 2.0<br />
222 | HUMAN DEVELOPMENT REPORT <strong>2016</strong>
HUMAN DEVELOPMENT REPORT <strong>2016</strong><br />
<strong>Human</strong> <strong>Development</strong> for Everyone<br />
Total<br />
Population<br />
Average annual<br />
Under<br />
growth Urban a age 5<br />
Ages<br />
15–64<br />
Ages 65<br />
and older<br />
Median<br />
age<br />
(millions) (%) (%) (millions) (years)<br />
Dependency ratio<br />
(per 100 people<br />
ages 15–64)<br />
Young age<br />
(0–14)<br />
Old age<br />
(65 and older)<br />
Total fertility rate<br />
(births<br />
per woman)<br />
HDI rank 2015 2030 b 2000/2005 2010/2015 2015 2015 2015 2015 2015 2015 2015 2000/2005 2010/2015<br />
60 Palau 0.0 0.0 0.8 0.8 87.1 .. .. .. .. .. .. .. ..<br />
60 Panama 3.9 4.8 1.8 1.6 66.6 0.4 2.6 0.3 28.7 41.7 11.7 2.6 2.5<br />
62 Antigua and Barbuda 0.1 0.1 1.2 1.0 23.8 0.0 0.1 0.0 30.9 35.2 10.4 2.3 2.1<br />
63 Seychelles 0.1 0.1 1.8 0.7 53.9 0.0 0.1 0.0 32.6 33.6 9.9 2.2 2.3<br />
64 Mauritius i 1.3 1.3 0.6 0.4 39.7 0.1 0.9 0.1 35.2 27.2 13.4 1.9 1.5<br />
65 Trinidad and Tobago 1.4 1.4 0.5 0.5 8.4 0.1 0.9 0.1 33.8 29.8 13.5 1.8 1.8<br />
66 Costa Rica 4.8 5.4 1.6 1.1 76.8 0.4 3.3 0.4 31.4 32.4 12.9 2.2 1.9<br />
66 Serbia j 8.9 8.3 –0.6 –0.5 55.6 0.5 5.9 1.5 40.6 24.5 25.6 1.7 1.6<br />
68 Cuba 11.4 11.2 0.3 0.1 77.1 0.6 7.9 1.6 41.2 23.4 20.0 1.6 1.6<br />
69 Iran (Islamic Republic of) 79.1 88.5 1.3 1.3 73.4 6.9 56.4 4.0 29.5 33.1 7.1 2.0 1.7<br />
70 Georgia k 4.0 3.9 –1.2 –1.2 53.6 0.3 2.7 0.6 37.5 25.2 20.4 1.6 1.8<br />
71 Turkey 78.7 87.7 1.4 1.7 73.4 6.8 52.5 5.9 29.8 38.4 11.3 2.4 2.1<br />
71 Venezuela (Bolivarian Republic of) 31.1 36.7 1.8 1.4 89.0 3.0 20.4 2.0 27.4 42.8 9.5 2.7 2.4<br />
73 Sri Lanka 20.7 21.5 0.8 0.5 18.4 1.6 13.7 1.9 32.3 37.2 14.1 2.3 2.1<br />
74 Saint Kitts and Nevis 0.1 0.1 1.5 1.2 32.0 .. .. .. .. .. .. .. ..<br />
75 Albania 2.9 3.0 –0.3 0.0 57.4 0.2 2.0 0.4 34.3 26.9 18.0 1.9 1.8<br />
76 Lebanon 5.9 5.3 4.2 6.0 87.8 0.5 4.0 0.5 28.5 35.4 12.0 2.0 1.7<br />
77 Mexico 127.0 148.1 1.3 1.4 79.2 11.6 83.7 8.2 27.4 41.9 9.8 2.6 2.3<br />
78 Azerbaijan l 9.8 10.7 1.1 1.4 54.6 0.9 7.1 0.5 30.9 30.3 7.8 2.0 2.3<br />
79 Brazil 207.8 228.7 1.4 0.9 85.7 15.0 143.7 16.3 31.3 33.3 11.3 2.3 1.8<br />
79 Grenada 0.1 0.1 0.3 0.4 35.6 0.0 0.1 0.0 27.2 39.9 10.8 2.4 2.2<br />
81 Bosnia and Herzegovina 3.8 3.6 0.2 –0.1 39.8 0.2 2.7 0.6 41.5 19.0 21.7 1.2 1.3<br />
82 The former Yugoslav Republic of Macedonia 2.1 2.1 0.3 0.2 57.1 0.1 1.5 0.3 37.5 24.0 17.4 1.6 1.5<br />
83 Algeria 39.7 48.3 1.3 1.9 70.7 4.6 26.0 2.4 27.6 43.6 9.1 2.4 2.9<br />
84 Armenia 3.0 3.0 –0.4 0.4 62.7 0.2 2.1 0.3 34.6 26.0 15.3 1.7 1.6<br />
84 Ukraine m 44.8 40.9 –0.8 –0.4 69.7 2.5 31.3 6.9 40.3 21.4 21.9 1.1 1.5<br />
86 Jordan 7.6 9.1 2.2 3.1 83.7 1.0 4.6 0.3 22.5 58.5 6.2 3.9 3.5<br />
87 Peru 31.4 36.9 1.3 1.3 78.6 3.0 20.5 2.1 27.5 42.7 10.5 2.8 2.5<br />
87 Thailand 68.0 68.3 1.0 0.4 50.4 3.8 48.8 7.1 38.0 24.7 14.6 1.6 1.5<br />
89 Ecuador 16.1 19.6 1.7 1.6 63.7 1.6 10.4 1.1 26.6 45.1 10.4 2.9 2.6<br />
90 China 1,376.0 1,415.5 0.6 0.5 55.6 83.2 1,000.0 131.4 37.0 23.5 13.0 1.5 1.6<br />
91 Fiji 0.9 0.9 0.3 0.7 53.7 0.1 0.6 0.1 27.6 43.9 8.9 3.0 2.6<br />
92 Mongolia 3.0 3.5 1.0 1.7 72.0 0.3 2.0 0.1 27.3 41.7 6.0 2.1 2.7<br />
92 Saint Lucia 0.2 0.2 1.1 0.8 18.5 0.0 0.1 0.0 31.2 34.1 13.3 2.1 1.9<br />
94 Jamaica 2.8 2.9 0.6 0.4 54.8 0.2 1.9 0.3 29.1 35.0 13.6 2.5 2.1<br />
95 Colombia 48.2 53.2 1.4 1.0 76.4 3.7 33.1 3.4 30.0 35.4 10.2 2.3 1.9<br />
96 Dominica 0.1 0.1 0.2 0.4 69.5 .. .. .. .. .. .. .. ..<br />
97 Suriname 0.5 0.6 0.5 0.9 66.0 0.0 0.4 0.0 29.0 40.4 10.4 2.7 2.4<br />
97 Tunisia 11.3 12.7 0.8 1.1 66.8 1.0 7.8 0.9 31.2 33.8 11.0 2.0 2.2<br />
99 Dominican Republic 10.5 12.1 1.5 1.2 79.0 1.1 6.7 0.7 26.1 47.3 10.5 2.8 2.5<br />
99 Saint Vincent and the Grenadines 0.1 0.1 0.2 0.0 50.6 0.0 0.1 0.0 29.8 36.0 10.8 2.2 2.0<br />
101 Tonga 0.1 0.1 0.6 0.4 23.7 0.0 0.1 0.0 21.3 64.1 10.2 4.2 3.8<br />
102 Libya 6.3 7.4 1.7 0.0 78.6 0.6 4.1 0.3 27.5 45.5 6.9 2.8 2.5<br />
103 Belize 0.4 0.5 2.7 2.2 44.0 0.0 0.2 0.0 23.5 50.9 5.9 3.4 2.6<br />
104 Samoa 0.2 0.2 0.6 0.8 19.1 0.0 0.1 0.0 21.2 64.9 9.1 4.4 4.2<br />
105 Maldives 0.4 0.4 1.7 1.8 45.5 0.0 0.2 0.0 26.4 40.5 6.9 2.6 2.2<br />
105 Uzbekistan 29.9 34.4 1.1 1.5 36.4 3.2 20.0 1.4 26.3 42.7 7.0 2.5 2.5<br />
MEDIUM HUMAN DEVELOPMENT<br />
107 Moldova (Republic of) n 4.1 3.8 –0.2 –0.1 45.0 0.2 3.0 0.4 35.6 21.2 13.4 1.2 1.3<br />
108 Botswana 2.3 2.8 1.4 2.0 57.4 0.3 1.5 0.1 24.2 49.7 5.6 3.2 2.9<br />
109 Gabon 1.7 2.3 2.2 2.2 87.2 0.2 1.0 0.1 21.4 64.3 8.8 4.4 4.0<br />
110 Paraguay 6.6 7.8 1.8 1.3 59.7 0.7 4.2 0.4 24.9 47.2 9.4 3.2 2.6<br />
111 Egypt 91.5 117.1 1.8 2.2 43.1 12.1 56.4 4.8 24.7 53.8 8.5 3.2 3.4<br />
111 Turkmenistan 5.4 6.2 1.1 1.3 50.0 0.5 3.6 0.2 26.4 41.7 6.1 2.8 2.3<br />
113 Indonesia 257.6 295.5 1.3 1.3 53.7 24.9 172.9 13.3 28.4 41.2 7.7 2.5 2.5<br />
114 Palestine, State of o 4.7 6.8 2.1 2.8 75.3 0.7 2.7 0.1 19.3 70.8 5.2 5.0 4.3<br />
115 Viet Nam 93.4 105.2 1.0 1.1 33.6 7.7 65.6 6.3 30.4 32.9 9.6 1.9 2.0<br />
116 Philippines 100.7 123.6 2.0 1.6 44.4 11.3 63.9 4.6 24.2 50.3 7.2 3.7 3.0<br />
117 El Salvador 6.1 6.4 0.5 0.3 66.7 0.5 4.0 0.5 26.7 41.7 12.6 2.6 2.0<br />
118 Bolivia (Plurinational State of) 10.7 13.2 1.8 1.6 68.5 1.2 6.6 0.7 24.1 53.1 10.6 3.8 3.0<br />
119 South Africa 54.5 60.0 1.5 1.1 64.8 5.4 35.8 2.7 25.7 44.5 7.7 2.8 2.4<br />
TABLE<br />
7<br />
TABLE 7 Population trends | 223
TABLE 7<br />
POPULATION TRENDS<br />
Total<br />
Population<br />
Average annual<br />
Under<br />
growth Urban a age 5<br />
Ages<br />
15–64<br />
Ages 65<br />
and older<br />
Median<br />
age<br />
(millions) (%) (%) (millions) (years)<br />
Dependency ratio<br />
(per 100 people<br />
ages 15–64)<br />
Young age<br />
(0–14)<br />
Old age<br />
(65 and older)<br />
Total fertility rate<br />
(births<br />
per woman)<br />
TABLE<br />
7<br />
HDI rank 2015 2030 b 2000/2005 2010/2015 2015 2015 2015 2015 2015 2015 2015 2000/2005 2010/2015<br />
120 Kyrgyzstan 5.9 7.1 0.6 1.7 35.7 0.8 3.8 0.3 25.1 48.8 6.6 2.5 3.1<br />
121 Iraq 36.4 54.1 2.7 3.3 69.5 5.7 20.4 1.1 19.3 73.2 5.5 4.7 4.6<br />
122 Cabo Verde 0.5 0.6 1.6 1.2 65.5 0.1 0.3 0.0 24.5 45.1 7.0 3.2 2.4<br />
123 Morocco 34.4 39.8 1.0 1.4 60.2 3.4 22.9 2.1 28.0 40.9 9.3 2.5 2.6<br />
124 Nicaragua 6.1 7.0 1.4 1.2 58.8 0.6 3.9 0.3 25.2 46.3 7.8 2.8 2.3<br />
125 Guatemala 16.3 21.4 2.4 2.1 51.6 2.1 9.6 0.8 21.2 62.6 8.3 4.2 3.3<br />
125 Namibia 2.5 3.3 1.3 2.3 46.7 0.3 1.5 0.1 21.2 61.4 5.9 3.8 3.6<br />
127 Guyana 0.8 0.8 0.0 0.4 28.6 0.1 0.5 0.0 24.7 43.5 7.6 2.9 2.6<br />
127 Micronesia (Federated States of) 0.1 0.1 –0.2 0.2 22.4 0.0 0.1 0.0 21.5 55.3 7.1 4.1 3.3<br />
129 Tajikistan 8.5 11.1 1.9 2.2 26.8 1.2 5.3 0.3 22.5 56.0 4.8 3.7 3.6<br />
130 Honduras 8.1 9.7 1.9 1.5 54.7 0.8 5.1 0.4 23.4 50.1 7.7 3.6 2.5<br />
131 India 1,311.1 1,527.7 1.7 1.3 32.7 123.7 860.0 73.6 26.6 43.9 8.6 3.1 2.5<br />
132 Bhutan 0.8 0.9 2.9 1.5 38.6 0.1 0.5 0.0 26.7 39.5 7.4 3.1 2.1<br />
133 Timor-Leste 1.2 1.6 3.1 2.3 32.8 0.2 0.6 0.1 18.5 81.5 10.7 7.0 5.9<br />
134 Vanuatu 0.3 0.4 2.5 2.3 26.1 0.0 0.2 0.0 22.2 61.6 7.1 4.1 3.4<br />
135 Congo 4.6 6.8 2.4 2.6 65.4 0.8 2.5 0.2 18.7 79.4 6.8 5.1 5.0<br />
135 Equatorial Guinea 0.8 1.2 3.3 3.0 39.9 0.1 0.5 0.0 20.5 67.9 5.0 5.6 5.0<br />
137 Kiribati 0.1 0.1 1.8 1.8 44.3 0.0 0.1 0.0 22.4 57.0 6.0 4.0 3.8<br />
138 Lao People’s Democratic Republic 6.8 8.5 1.5 1.7 38.6 0.8 4.2 0.3 21.9 56.6 6.2 3.9 3.1<br />
139 Bangladesh 161.0 186.5 1.7 1.2 34.3 15.3 105.6 8.0 25.6 44.9 7.6 2.9 2.2<br />
139 Ghana 27.4 36.9 2.6 2.4 54.0 4.1 15.8 0.9 20.6 67.2 5.9 4.6 4.2<br />
139 Zambia 16.2 25.3 2.6 3.1 40.9 2.9 8.3 0.5 16.9 89.7 5.7 6.1 5.5<br />
142 Sao Tome and Principe 0.2 0.3 2.2 2.2 65.1 0.0 0.1 0.0 18.5 78.5 5.7 5.1 4.7<br />
143 Cambodia 15.6 19.0 1.8 1.6 20.7 1.8 10.0 0.6 23.9 49.2 6.4 3.4 2.7<br />
144 Nepal 28.5 33.1 1.4 1.2 18.6 2.8 17.6 1.6 23.1 52.9 9.0 3.6 2.3<br />
145 Myanmar 53.9 60.2 0.9 0.8 34.1 4.6 36.2 2.9 27.9 41.1 8.0 2.9 2.3<br />
146 Kenya 46.1 65.4 2.6 2.7 25.6 7.2 25.5 1.3 18.9 75.8 5.1 5.0 4.4<br />
147 Pakistan 188.9 244.9 2.1 2.1 38.8 24.7 114.3 8.5 22.5 57.9 7.4 4.2 3.7<br />
LOW HUMAN DEVELOPMENT<br />
148 Swaziland 1.3 1.5 0.8 1.5 21.3 0.2 0.8 0.0 20.5 63.2 6.1 4.0 3.4<br />
149 Syrian Arab Republic 18.5 28.6 2.1 –2.3 57.7 2.2 10.9 0.8 20.8 63.1 6.9 3.7 3.0<br />
150 Angola 25.0 39.4 3.5 3.3 44.1 4.7 12.5 0.6 16.1 95.2 4.6 6.8 6.2<br />
151 Tanzania (United Republic of) p 53.5 82.9 2.8 3.2 31.6 9.4 27.6 1.7 17.3 87.6 6.2 5.7 5.2<br />
152 Nigeria 182.2 262.6 2.6 2.7 47.8 31.1 97.1 5.0 17.9 82.6 5.1 6.1 5.7<br />
153 Cameroon 23.3 32.9 2.6 2.5 54.4 3.7 12.7 0.7 18.5 78.4 5.9 5.5 4.8<br />
154 Papua New Guinea 7.6 10.1 2.5 2.1 13.0 1.0 4.6 0.2 21.2 62.1 5.0 4.4 3.8<br />
154 Zimbabwe 15.6 21.4 0.8 2.2 32.4 2.5 8.7 0.5 18.9 75.0 5.3 4.0 4.0<br />
156 Solomon Islands 0.6 0.8 2.6 2.1 22.3 0.1 0.3 0.0 19.9 69.1 5.9 4.6 4.1<br />
157 Mauritania 4.1 5.7 3.0 2.5 59.9 0.6 2.3 0.1 19.8 70.5 5.7 5.3 4.7<br />
158 Madagascar 24.2 36.0 3.0 2.8 35.1 3.8 13.4 0.7 18.7 75.2 5.1 5.3 4.5<br />
159 Rwanda 11.6 15.8 2.3 2.4 28.8 1.7 6.5 0.3 19.2 73.1 5.0 5.4 4.1<br />
160 Comoros 0.8 1.1 2.4 2.4 28.3 0.1 0.4 0.0 19.7 70.7 4.9 5.2 4.6<br />
160 Lesotho 2.1 2.5 0.7 1.2 27.3 0.3 1.3 0.1 21.0 60.3 6.9 3.8 3.3<br />
162 Senegal 15.1 22.8 2.7 3.1 43.7 2.6 8.1 0.4 18.0 82.1 5.5 5.4 5.2<br />
163 Haiti 10.7 12.6 1.6 1.4 58.6 1.2 6.6 0.5 23.0 54.8 7.5 4.0 3.1<br />
163 Uganda 39.0 61.9 3.3 3.3 16.1 7.3 19.3 1.0 15.9 97.3 5.0 6.7 5.9<br />
165 Sudan 40.2 56.4 2.6 2.2 33.8 6.0 22.6 1.3 19.4 72.1 5.9 5.3 4.5<br />
166 Togo 7.3 10.5 2.7 2.7 40.0 1.2 4.0 0.2 18.7 76.8 5.0 5.3 4.7<br />
167 Benin 10.9 15.6 3.3 2.7 44.0 1.7 6.0 0.3 18.6 76.7 5.3 5.8 4.9<br />
168 Yemen 26.8 36.3 2.8 2.6 34.6 3.9 15.3 0.7 19.3 70.7 4.9 6.0 4.4<br />
169 Afghanistan 32.5 43.9 4.3 3.0 26.7 5.0 17.4 0.8 17.5 82.3 4.6 7.2 5.1<br />
170 Malawi 17.2 26.6 2.6 3.1 16.3 3.0 8.8 0.6 17.2 87.9 6.7 6.1 5.3<br />
171 Côte d’Ivoire 22.7 32.1 1.9 2.4 54.2 3.7 12.4 0.7 18.4 77.9 5.6 5.7 5.1<br />
172 Djibouti 0.9 1.1 1.5 1.3 77.3 0.1 0.6 0.0 23.6 51.9 6.6 4.2 3.3<br />
173 Gambia 2.0 3.1 3.2 3.2 59.6 0.4 1.0 0.0 16.8 89.7 4.5 5.9 5.8<br />
174 Ethiopia 99.4 138.3 2.8 2.5 19.5 14.6 54.7 3.5 18.6 75.2 6.3 6.1 4.6<br />
175 Mali 17.6 27.4 3.1 3.0 39.9 3.3 8.8 0.4 16.2 95.1 5.0 6.9 6.4<br />
176 Congo (Democratic Republic of the) 77.3 120.3 3.1 3.2 42.5 13.9 39.4 2.3 16.9 90.1 5.8 7.0 6.2<br />
177 Liberia 4.5 6.4 2.5 2.6 49.7 0.7 2.5 0.1 18.6 77.4 5.5 5.7 4.8<br />
178 Guinea-Bissau 1.8 2.5 2.1 2.4 49.3 0.3 1.0 0.1 19.4 72.8 5.7 5.6 5.0<br />
179 Eritrea 5.2 7.3 3.4 2.2 22.6 0.8 2.9 0.1 18.6 78.4 4.8 5.1 4.4<br />
224 | HUMAN DEVELOPMENT REPORT <strong>2016</strong>
HUMAN DEVELOPMENT REPORT <strong>2016</strong><br />
<strong>Human</strong> <strong>Development</strong> for Everyone<br />
Population<br />
Dependency ratio<br />
Total<br />
Average annual<br />
Under<br />
growth Urban a age 5<br />
Ages<br />
15–64<br />
Ages 65<br />
and older<br />
Median<br />
age<br />
(per 100 people<br />
ages 15–64)<br />
Total fertility rate<br />
(millions) (%) (%) (millions) (years)<br />
Young age<br />
(0–14)<br />
Old age<br />
(65 and older)<br />
(births<br />
per woman)<br />
HDI rank 2015 2030 b 2000/2005 2010/2015 2015 2015 2015 2015 2015 2015 2015 2000/2005 2010/2015<br />
179 Sierra Leone 6.5 8.6 4.4 2.2 39.9 1.0 3.5 0.2 18.5 77.1 4.9 6.0 4.8<br />
181 Mozambique 28.0 41.4 2.9 2.8 32.2 4.8 14.4 0.9 17.1 88.2 6.5 5.8 5.5<br />
181 South Sudan 12.3 17.8 3.8 4.1 18.8 2.0 6.7 0.4 18.6 77.3 6.4 6.0 5.2<br />
183 Guinea 12.6 18.3 1.9 2.7 37.2 2.0 6.9 0.4 18.5 78.2 5.6 5.9 5.1<br />
184 Burundi 11.2 17.4 3.2 3.3 12.1 2.1 5.9 0.3 17.6 85.0 4.7 6.9 6.1<br />
185 Burkina Faso 18.1 27.2 2.9 2.9 29.9 3.1 9.4 0.4 17.0 87.6 4.6 6.4 5.6<br />
186 Chad 14.0 21.9 3.8 3.3 22.5 2.6 7.0 0.3 16.0 95.8 4.9 7.2 6.3<br />
187 Niger 19.9 36.0 3.7 4.0 18.7 4.1 9.3 0.5 14.8 107.5 5.5 7.7 7.6<br />
188 Central African Republic 4.9 6.5 1.7 2.0 40.0 0.7 2.8 0.2 20.0 68.4 6.8 5.3 4.4<br />
OTHER COUNTRIES OR TERRITORIES<br />
Korea (Democratic People’s Rep. of) 25.2 26.7 0.8 0.5 60.9 1.7 17.4 2.4 33.9 30.5 13.8 2.0 2.0<br />
Marshall Islands 0.1 0.1 0.0 0.2 72.7 .. .. .. .. .. .. .. ..<br />
Monaco 0.0 0.0 1.0 0.5 100.0 .. .. .. .. .. .. .. ..<br />
Nauru 0.0 0.0 0.1 0.4 100.0 .. .. .. .. .. .. .. ..<br />
San Marino 0.0 0.0 1.3 0.7 94.2 .. .. .. .. .. .. .. ..<br />
Somalia 10.8 16.5 2.7 2.4 39.6 2.0 5.4 0.3 16.5 92.5 5.6 7.4 6.6<br />
Tuvalu 0.0 0.0 0.6 0.2 59.7 .. .. .. .. .. .. .. ..<br />
<strong>Human</strong> development groups<br />
Very high human development 1,350.1 1,414.3 0.6 0.5 80.4 77.1 870.8 225.3 40.2 25.7 25.2 1.6 1.7<br />
High human development 2,379.4 2,524.4 0.8 0.8 62.7 165.3 1,683.6 210.4 34.4 28.3 12.4 1.8 1.8<br />
Medium human development 2,622.3 3,124.5 1.7 1.4 38.5 269.8 1,696.4 138.2 25.9 46.4 8.1 3.2 2.7<br />
Low human development 929.2 1,361.4 2.8 2.7 35.8 153.3 496.3 27.7 17.9 81.7 5.6 6.0 5.2<br />
Developing countries 6,071.2 7,178.3 1.5 1.4 48.5 601.1 3,971.0 385.6 28.1 42.9 9.7 2.9 2.7<br />
Regions<br />
Arab States 387.6 504.2 2.2 2.1 57.9 48.4 242.3 16.8 24.3 53.0 7.0 3.6 3.4<br />
East Asia and the Pacific 2,041.6 2,176.5 0.8 0.7 52.9 144.1 1,448.7 171.3 34.3 28.5 11.8 1.8 1.8<br />
Europe and Central Asia 239.4 255.4 0.5 1.0 60.3 20.1 162.4 22.1 32.3 33.9 13.6 2.0 2.1<br />
Latin America and the Caribbean 629.0 715.5 1.4 1.1 79.8 53.1 419.3 47.5 29.3 38.7 11.3 2.5 2.2<br />
South Asia 1,823.0 2,147.4 1.7 1.4 34.8 180.1 1,185.8 98.5 26.1 45.4 8.3 3.2 2.6<br />
Sub-Saharan Africa 949.5 1,378.0 2.7 2.7 37.9 155.2 511.8 29.3 18.3 79.8 5.7 5.7 5.1<br />
Least developed countries 954.4 1,325.9 2.5 2.4 31.5 139.6 538.7 34.1 19.9 70.8 6.3 5.1 4.3<br />
Small island developing states 55.7 63.9 1.3 1.2 55.5 5.5 35.5 4.0 27.9 45.2 11.3 3.1 2.8<br />
Organisation for Economic<br />
Co‐operation and <strong>Development</strong> 1,276.4 1,359.2 0.7 0.6 80.3 76.3 813.5 207.1 39.1 27.7 24.8 1.8 1.8<br />
World 7,349.5 T 8,500.8 T 1.2 T 1.2 T 54.0 T 670.9 T 4,825.5 T 608.2 T 29.6 T 39.7 T 12.6 T 2.6 T 2.5 T<br />
TABLE<br />
7<br />
NOTES<br />
a Because data are based on national definitions<br />
of what constitutes a city or metropolitan area,<br />
cross-country comparison should be made with<br />
caution.<br />
b Projections based on medium-fertility variant.<br />
c Includes Svalbard and Jan Mayen Islands.<br />
d Includes Christmas Island, Cocos (Keeling) Islands<br />
and Norfolk Island.<br />
e Includes Åland Islands.<br />
f Includes Canary Islands, Ceuta and Melilla.<br />
g Includes Northern Cyprus.<br />
h Includes Sabah and Sarawak.<br />
i Includes Agalega, Rodrigues and Saint Brandon.<br />
j Includes Kosovo.<br />
k Includes Abkhazia and South Ossetia.<br />
l Includes Nagorno-Karabakh.<br />
m Includes Crimea.<br />
n Includes Transnistria.<br />
o Includes East Jerusalem.<br />
p Includes Zanzibar.<br />
T From original data source.<br />
DEFINITIONS<br />
Total population: De facto population in a country,<br />
area or region as of 1 July.<br />
Population average annual growth: Average<br />
annual exponential growth rate for the period<br />
specified.<br />
Urban population: De facto population living in<br />
areas classified as urban according to the criteria<br />
used by each country or area as of 1 July.<br />
Population under age 5: De facto population in a<br />
country, area or region under age 5 as of 1 July.<br />
Population ages 15–64: De facto population in a<br />
country, area or region ages 15–64 as of 1 July.<br />
Population ages 65 and older: De facto<br />
population in a country, area or region ages 65 and<br />
older as of 1 July.<br />
Median age: Age that divides the population<br />
distribution into two equal parts — that is, 50 percent<br />
of the population is above that age and 50 percent<br />
is below it.<br />
Young age dependency ratio: Ratio of the<br />
population ages 0–14 to the population ages 15–64,<br />
expressed as the number of dependants per 100<br />
people of working age (ages 15–64).<br />
Old-age dependency ratio: Ratio of the<br />
population ages 65 and older to the population ages<br />
15–64, expressed as the number of dependants per<br />
100 people of working age (ages 15–64).<br />
Total fertility rate: Number of children who would<br />
be born to a woman if she were to live to the end<br />
of her child-bearing years and bear children at each<br />
age in accordance with prevailing age-specific<br />
fertility rates.<br />
MAIN DATA SOURCES<br />
Columns 1–4 and 6–13: UNDESA (2015a).<br />
Column 5: UNDESA (2014).<br />
TABLE 7 Population trends | 225
TABLE<br />
8<br />
Health outcomes<br />
TABLE<br />
8<br />
Infants<br />
exclusively<br />
breastfed<br />
(% ages 0–5<br />
months)<br />
Infants lacking<br />
immunization<br />
DTP<br />
Measles<br />
(% of one-year-olds)<br />
Child<br />
malnutrition Mortality rate Deaths due to<br />
Stunting<br />
(moderate<br />
or severe) Infant Under-five Female Male Malaria Tuberculosis<br />
(% under<br />
age 5)<br />
(per 1,000 live births)<br />
Adult<br />
(per 1,000 people)<br />
(per 100,000 people)<br />
HIV<br />
prevalence,<br />
adult<br />
Life<br />
expectancy<br />
at age 60 Physicians<br />
(% ages<br />
15–49) (years)<br />
HDI rank 2010–2015 a 2014 2014 2010–2015 a 2015 2015 2014 2014 2012 2014 2015 2010/2015 b 2001–2014 a 2014<br />
VERY HIGH HUMAN DEVELOPMENT<br />
1 Norway .. 1 6 .. 2.0 2.6 44 69 .. 0.2 .. 23.9 42.8 8.3<br />
2 Australia .. 8 7 2.0 c 3.0 3.8 .. .. .. 0.2 0.2 24.9 32.7 6.3<br />
2 Switzerland .. 2 7 .. 3.4 3.9 .. .. .. 0.1 .. 25.0 40.5 7.7<br />
4 Germany .. 2 3 1.3 c 3.1 3.7 .. .. .. 0.4 .. 23.5 38.9 8.7<br />
5 Denmark .. 4 10 .. 2.9 3.5 .. .. .. 0.4 .. 22.8 34.9 9.2<br />
5 Singapore .. 2 5 4.4 c 2.1 2.7 39 71 .. 1.0 .. 25.1 19.5 2.1<br />
7 Netherlands .. 2 4 .. 3.2 3.8 .. .. .. 0.1 .. 23.8 28.6 9.5<br />
8 Ireland .. 2 7 .. 3.0 3.6 .. .. .. 0.4 .. 23.4 26.7 5.1<br />
9 Iceland .. 4 10 .. 1.6 2.0 39 d 67 d .. 0.3 .. 24.5 34.8 7.2<br />
10 Canada .. 2 5 .. 4.3 4.9 .. .. .. 0.2 .. 24.7 20.7 7.4<br />
10 United States .. 2 9 2.1 5.6 6.5 78 d 131 d .. 0.1 .. 23.3 24.5 8.3<br />
12 Hong Kong, China (SAR) .. .. .. .. .. .. 32 64 .. 2.5 .. 25.8 .. ..<br />
13 New Zealand .. 7 7 .. 4.7 5.7 52 d 81 d .. 0.1 .. 24.5 27.4 9.1<br />
14 Sweden .. 1 3 .. 2.4 3.0 43 66 .. 0.3 .. 24.3 39.3 10.0<br />
15 Liechtenstein .. .. .. .. .. .. .. .. .. .. .. .. .. ..<br />
16 United Kingdom .. 2 7 .. 3.5 4.2 54 d 85 d .. 0.5 .. 23.5 28.1 7.6<br />
17 Japan .. 1 2 7.1 2.0 2.7 .. .. .. 1.8 .. 25.8 23.0 8.6<br />
18 Korea (Republic of) .. 1 1 2.5 2.9 3.4 37 90 0.0 3.8 .. 24.3 21.4 4.0<br />
19 Israel .. 5 4 .. 3.2 4.0 .. .. .. 0.2 .. 24.6 33.4 4.8<br />
20 Luxembourg .. 1 1 .. 1.5 1.9 .. .. .. 0.2 .. 23.9 29.0 5.8<br />
21 France .. 1 10 .. 3.5 4.3 51 d 105 d .. 0.6 .. 25.2 31.9 9.0<br />
22 Belgium .. 1 4 .. 3.3 4.1 .. .. .. 0.3 .. 23.7 48.9 8.2<br />
23 Finland .. 1 3 .. 1.9 2.3 .. .. .. 0.2 .. 23.7 29.1 7.3<br />
24 Austria .. 7 24 .. 2.9 3.5 46 86 .. 0.7 .. 23.8 48.3 8.7<br />
25 Slovenia .. 2 6 .. 2.1 2.6 .. .. .. 0.8 .. 23.1 25.2 6.6<br />
26 Italy .. 2 14 .. 2.9 3.5 .. .. .. 0.4 0.4 25.1 37.6 7.0<br />
27 Spain .. 1 4 .. 3.5 4.1 .. .. .. 0.5 0.4 24.8 49.5 6.4<br />
28 Czech Republic .. 1 1 2.6 c 2.8 3.4 53 115 .. 0.6 .. 21.5 36.2 6.3<br />
29 Greece .. 1 3 .. 3.6 4.6 45 101 .. 1.0 0.3 23.6 61.7 5.0<br />
30 Brunei Darussalam .. 1 3 19.7 c 8.6 10.2 52 85 .. 3.6 .. 21.4 14.4 2.5<br />
30 Estonia .. 5 7 .. 2.3 2.9 .. .. .. 2.1 .. 21.3 32.4 5.0<br />
32 Andorra .. 1 4 .. 2.1 2.8 .. .. .. 0.8 .. .. 40.0 6.3<br />
33 Cyprus .. 1 14 .. 2.5 2.7 35 70 .. 0.4 .. 22.1 23.3 3.3<br />
33 Malta .. 1 2 .. 5.1 6.4 41 70 .. 0.3 .. 22.8 34.9 6.7<br />
33 Qatar 29.3 1 1 .. 6.8 8.0 47 76 .. 0.2 .. 21.0 77.4 1.9<br />
36 Poland .. 1 2 .. 4.5 5.2 .. .. .. 1.4 .. 21.5 22.2 4.5<br />
37 Lithuania .. 3 7 .. 3.3 5.2 92 d 266 d .. 7.7 .. 19.2 41.2 4.4<br />
38 Chile .. 4 6 1.8 7.0 8.1 44 96 .. 1.6 0.3 25.2 10.3 3.9<br />
38 Saudi Arabia .. 1 2 9.3 c 12.5 14.5 80 94 0.0 2.1 .. 18.5 24.9 3.5<br />
40 Slovakia .. 1 3 .. 5.8 7.3 .. .. .. 0.5 .. 20.3 33.2 5.8<br />
41 Portugal .. 1 2 .. 3.0 3.6 .. .. .. 1.2 .. 23.7 41.0 6.2<br />
42 United Arab Emirates 34.0 c 6 6 .. 5.9 6.8 57 81 .. 0.3 .. 19.8 25.3 2.6<br />
43 Hungary .. 1 1 .. 5.3 5.9 .. .. .. 0.7 .. 20.1 30.8 4.9<br />
44 Latvia .. 7 5 .. 6.9 7.9 94 d 243 d .. 2.7 0.7 19.8 35.8 3.7<br />
45 Argentina 32.7 2 5 8.2 c 11.1 12.5 75 154 .. 1.4 0.4 21.4 38.6 2.7<br />
45 Croatia 23.3 c 2 6 .. 3.6 4.3 57 134 .. 1.1 .. 20.6 30.0 6.4<br />
47 Bahrain 33.8 c 1 1 .. 5.3 6.2 60 75 .. 0.4 .. 19.4 9.2 3.2<br />
48 Montenegro 16.8 3 12 9.4 4.3 4.7 73 130 .. 0.6 .. 19.8 21.1 3.7<br />
49 Russian Federation .. 3 2 .. 8.2 9.6 .. .. .. 11.0 .. 18.4 43.1 3.7<br />
50 Romania 15.8 c 2 11 12.8 c 9.7 11.1 79 195 .. 5.5 .. 19.8 24.5 4.5<br />
51 Kuwait 11.9 c 3 6 5.8 7.3 8.6 58 98 .. 0.2 .. 17.7 27.0 2.6<br />
HIGH HUMAN DEVELOPMENT<br />
52 Belarus 19.0 3 1 4.5 c 3.4 4.6 90 261 .. 7.7 0.6 18.1 39.3 3.7<br />
52 Oman 32.8 1 1 14.1 9.9 11.6 70 111 .. 0.6 .. 20.6 24.3 3.2<br />
54 Barbados 19.7 e 2 5 7.7 12.0 13.0 75 125 .. 0.0 1.6 19.5 18.1 4.7<br />
54 Uruguay .. 1 4 10.7 8.7 10.1 77 136 .. 1.7 0.5 22.0 37.4 6.1<br />
56 Bulgaria .. 10 7 8.8 c 9.3 10.4 .. .. .. 2.1 .. 19.2 38.7 4.6<br />
56 Kazakhstan 31.8 4 1 13.1 12.6 14.1 124 302 .. 8.6 0.2 17.1 36.2 2.4<br />
(per 10,000<br />
people)<br />
Public health<br />
expenditure<br />
(% of GDP)<br />
226 | HUMAN DEVELOPMENT REPORT <strong>2016</strong>
HUMAN DEVELOPMENT REPORT <strong>2016</strong><br />
<strong>Human</strong> <strong>Development</strong> for Everyone<br />
Infants<br />
exclusively<br />
breastfed<br />
(% ages 0–5<br />
months)<br />
Infants lacking<br />
immunization<br />
DTP<br />
Measles<br />
(% of one-year-olds)<br />
Child<br />
malnutrition Mortality rate Deaths due to<br />
Stunting<br />
(moderate<br />
or severe) Infant Under-five Female Male Malaria Tuberculosis<br />
(% under<br />
age 5)<br />
(per 1,000 live births)<br />
Adult<br />
(per 1,000 people)<br />
(per 100,000 people)<br />
HIV<br />
prevalence,<br />
adult<br />
Life<br />
expectancy<br />
at age 60 Physicians<br />
(% ages<br />
15–49) (years)<br />
HDI rank 2010–2015 a 2014 2014 2010–2015 a 2015 2015 2014 2014 2012 2014 2015 2010/2015 b 2001–2014 a 2014<br />
58 Bahamas .. 4 8 .. 9.9 12.1 120 200 .. 0.6 3.2 22.3 28.2 3.6<br />
59 Malaysia 29.0 c 1 6 17.2 c 6.0 7.0 80 167 1.0 8.0 0.4 19.3 12.0 2.3<br />
60 Palau .. 1 17 .. 14.2 16.4 .. .. .. 1.2 .. .. 13.8 6.5<br />
60 Panama 21.5 4 10 19.1 c 14.6 17.0 81 153 0.0 5.5 0.7 23.9 16.5 5.9<br />
62 Antigua and Barbuda .. 1 2 .. 5.8 8.1 108 154 .. 3.8 .. 21.5 .. 3.8<br />
63 Seychelles .. 1 1 .. 11.7 13.6 92 238 .. 0.0 .. 19.4 10.7 3.1<br />
64 Mauritius 21.0 c 3 2 .. 11.8 13.5 95 194 .. 1.3 0.9 20.2 10.6 2.4<br />
65 Trinidad and Tobago 12.8 c 7 4 5.3 c 18.2 20.4 124 217 .. 2.0 1.2 18.2 11.8 3.2<br />
66 Costa Rica 32.5 9 5 5.6 c 8.5 9.7 61 114 0.0 0.8 0.3 23.6 11.1 6.8<br />
66 Serbia 12.8 3 14 6.0 5.9 6.7 79 152 .. 1.4 .. 19.1 21.1 6.4<br />
68 Cuba 33.2 2 1 7.0 c 4.0 5.5 72 109 .. 0.3 0.3 23.1 67.2 10.6<br />
69 Iran (Islamic Republic of) 53.1 1 1 6.8 13.4 15.5 64 105 0.0 3.5 0.1 19.4 8.9 2.8<br />
70 Georgia 54.8 c 1 8 11.3 c 10.6 11.9 64 171 0.0 6.6 0.4 19.8 42.7 1.6<br />
71 Turkey 30.1 3 6 9.5 11.6 13.5 73 142 0.0 0.6 .. 20.8 17.1 4.2<br />
71 Venezuela (Bolivarian Republic of) 7.1 c 12 11 13.4 c 12.9 14.9 91 195 2.2 1.8 0.5 20.7 19.4 1.5<br />
73 Sri Lanka 75.8 c 1 1 14.7 8.4 9.8 75 201 0.0 6.1 0.1 f 20.4 6.8 2.0<br />
74 Saint Kitts and Nevis .. 1 7 .. 8.4 10.5 .. .. .. 2.7 .. .. 11.7 2.1<br />
75 Albania 38.6 c 1 2 23.1 c 12.5 14.0 50 85 .. 0.6 .. 21.2 11.5 2.9<br />
76 Lebanon 26.6 c 16 21 16.5 c 7.1 8.3 50 71 .. 1.6 0.1 f 22.0 32.0 3.0<br />
77 Mexico 14.4 10 3 13.6 11.3 13.2 81 143 0.0 1.7 0.2 22.7 21.0 3.3<br />
78 Azerbaijan 12.1 4 2 18.0 27.9 31.7 86 178 0.1 0.4 0.2 18.3 34.0 1.2<br />
79 Brazil 38.6 c 1 3 7.1 c 14.6 16.4 93 194 0.6 2.6 0.6 21.3 18.9 3.8<br />
79 Grenada 39.0 c 3 6 .. 10.8 11.8 98 186 .. 0.4 .. 18.8 6.6 2.8<br />
81 Bosnia and Herzegovina 18.5 8 11 8.9 5.1 5.4 66 130 .. 3.8 .. 20.2 19.3 6.8<br />
82 The former Yugoslav Republic of Macedonia 23.0 2 7 4.9 4.8 5.5 71 134 .. 2.3 .. 19.1 26.3 4.1<br />
83 Algeria 25.7 1 5 11.7 21.9 25.5 84 135 0.0 11.0 0.1 f 21.6 12.1 5.2<br />
84 Armenia 34.6 3 3 20.8 12.6 14.1 70 170 .. 4.7 0.2 19.6 27.0 1.9<br />
84 Ukraine 19.7 10 21 3.7 c 7.7 9.0 111 d 292 d .. 13.0 0.9 18.1 35.4 3.6<br />
86 Jordan 22.7 2 2 7.8 15.4 17.9 94 128 .. 0.3 .. 19.0 25.6 5.2<br />
87 Peru 68.4 2 11 14.6 13.1 16.9 96 154 0.7 7.2 0.3 21.3 11.3 3.3<br />
87 Thailand 12.3 1 1 16.3 10.5 12.3 105 207 0.9 11.0 1.1 21.4 3.9 5.6<br />
89 Ecuador 40.0 c 16 15 25.2 18.4 21.6 87 164 0.0 2.9 0.3 22.9 17.2 4.5<br />
90 China 27.6 c 1 1 9.4 9.2 10.7 72 98 0.0 2.8 .. 19.4 19.4 3.1<br />
91 Fiji 39.8 c 1 6 7.5 c 19.1 22.4 139 236 .. 4.7 .. 17.0 4.3 3.0<br />
92 Mongolia 47.1 1 2 10.8 19.0 22.4 132 300 .. 2.2 0.1 f 18.0 28.4 2.6<br />
92 Saint Lucia .. 1 1 2.5 12.7 14.3 110 168 .. 2.4 .. 21.1 1.1 3.6<br />
94 Jamaica 23.8 3 8 5.7 13.5 15.7 101 166 .. 0.3 1.6 22.2 4.1 2.8<br />
95 Colombia 42.8 9 9 12.7 13.6 15.9 90 192 0.9 1.5 0.5 21.4 14.7 5.4<br />
96 Dominica .. 1 6 .. 19.6 21.2 .. .. .. 2.7 .. .. 15.9 3.8<br />
97 Suriname 2.8 9 15 8.8 19.0 21.3 121 222 1.2 2.1 1.1 18.5 9.1 2.9<br />
97 Tunisia 8.5 2 2 10.1 12.1 14.0 73 126 .. 2.0 0.1 f 19.5 12.2 4.0<br />
99 Dominican Republic 4.7 9 12 7.1 25.7 30.9 121 205 0.1 3.9 1.0 21.7 14.9 2.9<br />
99 Saint Vincent and the Grenadines .. 1 1 .. 16.6 18.3 130 182 .. 1.0 .. 19.9 5.3 4.4<br />
101 Tonga 52.2 14 33 8.1 14.4 16.7 102 167 .. 2.1 .. 18.6 5.6 4.3<br />
102 Libya .. 4 7 21.0 c 11.4 13.4 99 173 .. 9.7 .. 18.2 19.0 3.7<br />
103 Belize 14.7 4 5 19.3 14.2 16.5 132 224 0.0 1.8 1.5 17.0 8.3 3.9<br />
104 Samoa 51.3 c 1 9 .. 15.0 17.5 93 159 .. 3.4 .. 18.9 4.8 6.5<br />
105 Maldives 47.8 c 1 1 20.3 c 7.4 8.6 59 83 .. 2.3 .. 19.5 14.2 10.8<br />
105 Uzbekistan 26.4 c 1 1 19.6 c 33.9 39.1 133 238 .. 9.1 0.2 18.3 25.3 3.1<br />
MEDIUM HUMAN DEVELOPMENT<br />
107 Moldova (Republic of) 36.4 6 10 6.4 13.6 15.8 101 244 .. 7.8 0.6 17.3 29.8 5.3<br />
108 Botswana 20.3 c 2 3 31.4 c 34.8 43.6 262 346 0.4 28.0 22.2 17.1 3.4 3.2<br />
109 Gabon 6.0 23 39 17.5 36.1 50.8 246 245 67.4 55.0 3.8 18.3 2.9 2.4<br />
110 Paraguay 24.4 c 2 10 10.9 17.5 20.5 126 166 0.0 2.9 0.4 21.0 12.3 4.5<br />
111 Egypt 39.7 4 7 22.3 20.3 24.0 113 189 .. 0.3 0.1 f 17.3 28.3 2.2<br />
111 Turkmenistan 10.9 c 1 1 18.9 c 43.7 51.4 153 297 .. 3.4 .. 17.0 23.9 1.3<br />
113 Indonesia 41.5 6 23 36.4 22.8 27.2 147 205 9.8 41.0 0.5 16.5 2.0 1.1<br />
114 Palestine, State of 38.6 1 1 7.4 18.0 21.1 98 143 .. 0.2 .. 18.5 8.4 ..<br />
115 Viet Nam 24.3 5 3 19.4 17.3 21.7 68 186 0.2 18.0 0.5 22.4 11.9 3.8<br />
(per 10,000<br />
people)<br />
Public health<br />
expenditure<br />
(% of GDP)<br />
TABLE<br />
8<br />
TABLE 8 Health outcomes | 227
TABLE 8 HEALTH OUTCOMES<br />
TABLE<br />
8<br />
Infants<br />
exclusively<br />
breastfed<br />
(% ages 0–5<br />
months)<br />
Infants lacking<br />
immunization<br />
DTP<br />
Measles<br />
(% of one-year-olds)<br />
Child<br />
malnutrition Mortality rate Deaths due to<br />
Stunting<br />
(moderate<br />
or severe) Infant Under-five Female Male Malaria Tuberculosis<br />
(% under<br />
age 5)<br />
(per 1,000 live births)<br />
Adult<br />
(per 1,000 people)<br />
(per 100,000 people)<br />
HIV<br />
prevalence,<br />
adult<br />
Life<br />
expectancy<br />
at age 60 Physicians<br />
(% ages<br />
15–49) (years)<br />
HDI rank 2010–2015 a 2014 2014 2010–2015 a 2015 2015 2014 2014 2012 2014 2015 2010/2015 b 2001–2014 a 2014<br />
116 Philippines 34.0 c 14 12 30.3 22.2 28.0 144 272 0.1 10.0 0.1 f 16.8 11.5 1.6<br />
117 El Salvador 47.0 4 6 14.0 14.4 16.8 105 265 0.0 1.9 0.5 21.5 16.0 4.5<br />
118 Bolivia (Plurinational State of) 64.3 2 5 18.1 30.6 38.4 156 219 0.1 3.1 0.3 21.1 4.7 4.6<br />
119 South Africa 8.3 c 27 30 23.9 c 33.6 40.5 419 464 2.2 44.0 19.2 16.1 7.8 4.2<br />
120 Kyrgyzstan 41.1 4 4 12.9 19.0 21.3 111 251 0.0 11.0 0.2 17.7 19.7 3.6<br />
121 Iraq 19.6 23 43 22.6 26.5 32.0 132 198 .. 2.2 .. 17.5 6.1 3.3<br />
122 Cabo Verde 59.6 c 1 7 .. 20.7 24.5 97 137 0.0 31.0 1.0 18.6 3.1 3.6<br />
123 Morocco 27.8 1 1 14.9 23.7 27.6 87 106 .. 7.9 0.1 19.1 6.2 2.0<br />
124 Nicaragua 31.7 1 1 23.0 c 18.8 22.1 106 194 0.1 3.4 0.3 22.3 9.0 5.1<br />
125 Guatemala 53.2 11 33 46.5 24.3 29.1 129 236 0.0 1.6 0.6 21.3 9.3 2.3<br />
125 Namibia 48.5 8 17 23.1 32.8 45.4 249 325 0.1 63.0 13.3 17.3 3.7 5.4<br />
127 Guyana 23.3 2 1 12.0 32.0 39.4 173 250 23.6 21.0 1.5 16.0 2.1 3.1<br />
127 Micronesia (Federated States of) 60.0 c 2 9 .. 28.6 34.7 150 178 .. 16.0 .. 17.3 1.8 12.4<br />
129 Tajikistan 34.3 2 2 26.8 38.5 44.8 118 207 0.0 3.3 0.3 18.3 19.2 2.0<br />
130 Honduras 31.2 14 12 22.7 17.4 20.4 122 174 0.1 1.0 0.4 22.1 3.7 4.4<br />
131 India 46.4 c 10 17 38.7 37.9 47.7 145 217 4.1 17.0 .. 17.7 7.0 1.4<br />
132 Bhutan 51.4 1 3 33.6 27.2 32.9 216 210 0.0 9.5 .. 20.2 2.6 2.6<br />
133 Timor-Leste 62.3 19 26 50.2 44.7 52.6 128 174 16.2 94.0 .. 16.9 0.7 1.3<br />
134 Vanuatu 72.6 25 47 28.5 23.1 27.5 108 156 3.7 7.9 .. 18.0 1.2 4.5<br />
135 Congo 32.9 5 20 21.2 33.2 45.0 247 286 103.8 46.0 .. 17.9 1.0 4.2<br />
135 Equatorial Guinea 7.4 35 56 26.2 68.2 94.1 286 326 69.3 6.6 4.9 16.8 3.0 2.9<br />
137 Kiribati 69.0 c 17 9 .. 43.6 55.9 159 240 .. 49.0 .. 16.8 3.8 8.3<br />
138 Lao People’s Democratic Republic 40.4 6 13 43.8 50.7 66.7 176 217 9.5 55.0 .. 16.6 1.8 0.9<br />
139 Bangladesh 55.3 3 11 36.1 30.7 37.6 107 152 13.9 51.0 0.1 f 18.7 3.6 0.8<br />
139 Ghana 52.3 1 8 18.8 42.8 61.6 231 270 67.0 36.0 1.6 15.6 1.0 2.1<br />
139 Zambia 72.5 4 15 40.0 43.3 64.0 270 331 79.2 32.0 12.9 17.7 1.7 2.8<br />
142 Sao Tome and Principe 73.8 2 8 17.2 34.6 47.3 165 219 42.5 7.3 .. 18.2 4.9 3.6<br />
143 Cambodia 65.2 1 6 32.4 24.6 28.7 145 210 3.7 58.0 0.6 17.1 1.7 1.3<br />
144 Nepal 56.9 6 12 37.4 29.4 35.8 139 177 0.2 17.0 0.2 17.3 2.1 2.3<br />
145 Myanmar 23.6 10 14 35.1 39.5 50.0 173 229 11.3 53.0 0.8 16.7 6.1 1.0<br />
146 Kenya 61.4 12 21 26.0 35.5 49.4 251 296 49.6 21.0 5.9 17.8 2.0 3.5<br />
147 Pakistan 37.7 21 37 45.0 65.8 81.1 143 179 1.8 26.0 0.1 f 17.8 8.3 0.9<br />
LOW HUMAN DEVELOPMENT<br />
148 Swaziland 63.8 1 14 25.5 44.5 60.7 612 576 1.2 51.0 28.8 16.3 1.7 7.0<br />
149 Syrian Arab Republic 42.6 c 35 46 27.5 c 11.1 12.9 86 283 .. 0.1 .. 18.7 14.6 1.5<br />
150 Angola .. 1 15 29.2 c 96.0 156.9 321 369 100.9 52.0 2.2 15.7 1.7 2.1<br />
151 Tanzania (United Republic of) 41.1 1 1 34.7 35.2 48.7 243 281 50.5 58.0 4.7 18.5 0.3 2.6<br />
152 Nigeria 17.4 25 49 32.9 69.4 108.8 346 379 106.6 97.0 3.1 13.7 4.0 0.9<br />
153 Cameroon 28.2 7 20 31.7 57.1 87.9 345 370 64.7 31.0 4.5 16.5 0.8 0.9<br />
154 Papua New Guinea 56.1 c 13 35 49.5 44.5 57.3 237 313 40.3 40.0 0.8 14.9 0.6 3.5<br />
154 Zimbabwe 41.0 2 8 27.6 46.6 70.7 382 413 18.4 15.0 14.7 17.5 0.8 2.5<br />
156 Solomon Islands 73.7 c 5 7 32.8 c 23.6 28.1 157 198 5.5 13.0 .. 16.9 2.2 4.6<br />
157 Mauritania 26.9 12 16 22.0 65.1 84.7 183 228 67.2 22.0 0.6 16.5 0.7 1.9<br />
158 Madagascar 41.9 17 36 49.2 c 35.9 49.6 199 248 41.4 51.0 0.4 16.9 1.6 1.5<br />
159 Rwanda 87.3 1 2 37.9 31.1 41.7 178 296 33.2 6.4 2.9 17.9 0.6 2.9<br />
160 Comoros 12.1 17 20 32.1 55.1 73.5 204 254 70.4 7.5 .. 16.2 1.5 2.2<br />
160 Lesotho 66.9 3 8 33.2 69.2 90.2 599 581 .. 64.0 22.7 15.5 0.5 8.1<br />
162 Senegal 33.0 6 20 19.4 41.7 47.2 160 227 59.5 21.0 0.5 16.6 0.6 2.4<br />
163 Haiti 39.7 28 47 21.9 52.2 69.0 215 277 5.1 20.0 1.7 17.8 .. 1.6<br />
163 Uganda 63.2 11 18 34.2 37.7 54.6 283 346 57.9 12.0 7.1 17.3 1.2 1.8<br />
165 Sudan 55.4 1 14 38.2 47.6 70.1 197 254 16.5 21.0 0.3 17.8 2.8 1.8<br />
166 Togo 57.5 9 18 27.5 52.3 78.4 256 289 82.8 8.8 2.4 15.1 0.5 2.0<br />
167 Benin 41.4 16 37 34.0 64.2 99.5 223 270 79.6 9.8 1.1 15.6 0.6 2.3<br />
168 Yemen 10.3 6 25 46.5 33.8 41.9 201 245 10.0 4.4 0.1 f 16.3 2.0 1.3<br />
169 Afghanistan .. 18 34 40.9 66.3 91.1 238 281 0.2 44.0 0.1 f 15.7 2.7 2.9<br />
170 Malawi 70.2 3 15 42.4 43.4 64.0 262 279 62.9 17.0 9.1 18.8 0.2 6.0<br />
171 Côte d’Ivoire 12.1 22 37 29.6 66.6 92.6 388 424 70.6 .. 3.2 14.1 1.4 1.7<br />
172 Djibouti 1.3 c 7 29 33.5 54.2 65.3 230 277 27.9 120.0 1.6 17.5 2.3 6.8<br />
173 Gambia 46.8 2 4 24.5 47.9 68.9 237 291 83.7 18.0 1.8 15.2 0.4 5.0<br />
(per 10,000<br />
people)<br />
Public health<br />
expenditure<br />
(% of GDP)<br />
228 | HUMAN DEVELOPMENT REPORT <strong>2016</strong>
HUMAN DEVELOPMENT REPORT <strong>2016</strong><br />
<strong>Human</strong> <strong>Development</strong> for Everyone<br />
Infants<br />
exclusively<br />
breastfed<br />
Infants lacking<br />
immunization<br />
Child<br />
malnutrition Mortality rate Deaths due to<br />
DTP<br />
Measles<br />
Stunting<br />
(moderate<br />
or severe) Infant Under-five Female Male Malaria Tuberculosis<br />
HIV<br />
prevalence,<br />
adult<br />
Life<br />
expectancy<br />
at age 60 Physicians<br />
Public health<br />
expenditure<br />
(% ages 0–5<br />
months)<br />
(% of one-year-olds)<br />
(% under<br />
age 5)<br />
(per 1,000 live births)<br />
Adult<br />
(per 1,000 people)<br />
(per 100,000 people)<br />
(% ages<br />
15–49) (years)<br />
(per 10,000<br />
people)<br />
(% of GDP)<br />
HDI rank 2010–2015 a 2014 2014 2010–2015 a 2015 2015 2014 2014 2012 2014 2015 2010/2015 b 2001–2014 a 2014<br />
174 Ethiopia 52.0 14 30 40.4 41.4 59.2 203 255 48.1 33.0 .. 17.8 0.2 2.9<br />
175 Mali 37.8 c 20 20 38.5 c 74.5 114.7 263 258 92.1 11.0 1.3 15.2 0.8 1.6<br />
176 Congo (Democratic Republic of the) 47.6 19 23 42.6 74.5 98.3 241 290 106.6 69.0 0.8 16.6 1.1 1.6<br />
177 Liberia 55.2 26 42 32.1 52.8 69.9 231 269 69.2 68.0 1.1 15.4 0.1 3.2<br />
178 Guinea-Bissau 52.5 8 31 27.6 60.3 92.5 252 306 96.2 63.0 .. 15.0 0.5 1.1<br />
179 Eritrea 68.7 3 4 50.3 34.1 46.5 228 295 3.6 14.0 0.6 15.4 0.5 1.5<br />
179 Sierra Leone 32.0 12 22 37.9 87.1 120.4 399 407 108.7 45.0 1.3 13.0 0.2 1.9<br />
181 Mozambique 41.0 7 15 43.1 56.7 78.5 382 425 71.4 67.0 10.5 17.0 0.4 3.9<br />
181 South Sudan 45.1 51 78 31.1 60.3 92.6 321 348 55.4 29.0 2.5 16.4 .. 1.1<br />
183 Guinea 20.5 40 48 31.3 61.0 93.7 260 285 104.8 29.0 1.6 15.0 1.0 2.7<br />
184 Burundi 69.3 2 6 57.5 54.1 81.7 267 327 63.7 23.0 1.0 16.4 0.3 4.0<br />
185 Burkina Faso 50.1 5 12 32.9 60.9 88.6 250 279 103.3 9.1 0.8 15.1 0.5 2.6<br />
186 Chad 0.3 40 46 39.9 85.0 138.7 346 388 152.6 23.0 2.0 15.7 0.4 2.0<br />
187 Niger 23.3 11 28 43.0 57.1 95.5 203 239 131.1 18.0 0.5 16.0 0.2 3.2<br />
188 Central African Republic 34.3 31 51 40.7 91.5 130.1 382 423 114.9 48.0 3.7 15.8 0.5 2.1<br />
OTHER COUNTRIES OR TERRITORIES<br />
Korea (Democratic People’s Rep. of) 68.9 6 1 27.9 19.7 24.9 106 176 0.0 20.0 .. 16.8 32.9 ..<br />
Marshall Islands 31.3 c 3 21 .. 29.6 36.0 .. .. .. 38.0 .. .. 4.4 14.4<br />
Monaco .. 1 1 .. 2.8 3.5 .. .. .. 0.2 .. .. 71.7 3.8<br />
Nauru 67.2 c 1 2 24.0 c 29.1 35.4 .. .. .. 6.0 .. .. 7.1 2.9<br />
San Marino .. 18 43 .. 2.6 2.9 .. .. .. 0.0 .. .. 51.0 5.7<br />
Somalia 5.3 c 48 54 25.9 c 85.0 136.8 285 346 33.5 67.0 0.5 16.1 0.4 ..<br />
Tuvalu 34.7 c 1 4 10.0 c 22.8 27.1 .. .. .. 14.0 .. .. 10.9 16.4<br />
<strong>Human</strong> development groups<br />
Very high human development .. 2 6 .. 5.4 6.3 .. .. .. 2.0 0.4 23.4 30.9 7.5<br />
High human development 29.3 3 3 10.4 11.6 13.4 79 129 .. 3.5 0.4 19.9 19.0 3.4<br />
Medium human development 43.0 10 18 35.0 35.5 44.6 147 215 7.1 22.7 1.6 17.8 7.3 1.8<br />
Low human development 37.8 15 29 36.7 57.3 84.0 269 316 71.0 46.8 3.0 16.3 1.8 1.7<br />
Developing countries 37.7 9 17 28.3 34.4 45.8 133 190 14.2 18.4 1.6 18.9 11.5 3.0<br />
Regions<br />
Arab States 31.4 8 16 23.3 26.8 34.9 118 169 .. 7.1 0.1 18.6 15.6 3.0<br />
East Asia and the Pacific 31.4 4 7 18.4 14.9 17.9 90 134 1.8 11.3 0.5 19.2 15.4 3.0<br />
Europe and Central Asia 27.4 4 6 12.5 18.2 20.5 97 210 .. 5.7 0.5 19.0 25.8 3.7<br />
Latin America and the Caribbean 32.9 6 8 13.0 15.1 17.8 92 176 .. 2.7 0.5 21.8 19.6 3.6<br />
South Asia 46.6 11 19 37.9 40.7 50.8 137 202 4.4 20.7 0.1 17.9 6.8 1.6<br />
Sub-Saharan Africa 38.7 15 28 34.9 56.1 82.2 288 331 73.2 48.4 5.1 16.2 1.9 2.4<br />
Least developed countries 46.1 11 21 37.9 51.0 72.0 208 254 47.9 39.5 1.9 17.3 1.8 1.8<br />
Small island developing states 35.7 13 24 22.8 34.9 44.9 148 212 .. 15.4 1.0 20.7 22.5 5.3<br />
Organisation for Economic<br />
Co‐operation and <strong>Development</strong> .. 3 6 .. 5.9 6.9 .. .. .. 0.8 0.3 24.0 27.7 7.7<br />
World 37.7 9 16 26.9 31.6 41.7 127 183 .. 15.5 1.5 20.4 14.9 6.0<br />
TABLE<br />
8<br />
NOTES<br />
a Data refer to the most recent year available<br />
during the period specified.<br />
b Data are annual average of projected values for<br />
2010–2015.<br />
c Refers to a year earlier than that specified.<br />
d Refers to 2013.<br />
e Based on small denominators (typically 25–49<br />
unweighted cases).<br />
f 0.1 or less.<br />
DEFINITIONS<br />
Infants exclusively breastfed: Percentage of<br />
children ages 0–5 months who are fed exclusively<br />
with breast milk in the 24 hours prior to the survey.<br />
Infants lacking immunization against DPT:<br />
Percentage of surviving infants who have not<br />
received their first dose of diphtheria, pertussis and<br />
tetanus vaccine.<br />
Infants lacking immunization against measles:<br />
Percentage of surviving infants who have not<br />
received the first dose of measles vaccine.<br />
Child malnutrition (stunting moderate or<br />
severe): Percentage of children ages 0–59 months<br />
who are more than two standard deviations below<br />
the median height-for-age of the World Health<br />
Organization Child Growth Standards.<br />
Infant mortality rate: Probability of dying between<br />
birth and exactly age 1, expressed per 1,000 live<br />
births.<br />
Under-five mortality rate: Probability of dying<br />
between birth and exactly age 5, expressed per<br />
1,000 live births.<br />
Adult mortality rate: Probability that a 15-year-old<br />
will die before reaching age 60, expressed per 1,000<br />
people.<br />
Deaths due to malaria: Number of deaths due<br />
to malaria from confirmed and probable cases,<br />
expressed per 100,000 people.<br />
Deaths due to tuberculosis: Number of deaths<br />
due to tuberculosis from confirmed and probable<br />
cases, expressed per 100,000 people.<br />
HIV prevalence, adult: Percentage of the<br />
population ages 15–49 that is living with HIV.<br />
Life expectancy at age 60: Additional number<br />
of years that a 60-year-old could expect to live if<br />
prevailing patterns of age-specific mortality rates<br />
stay the same throughout the rest of his or her life.<br />
Physicians: Number of medical doctors<br />
(physicians), both generalists and specialists,<br />
expressed per 10,000 people.<br />
Public health expenditure: Current and capital<br />
spending on health from government (central and<br />
local) budgets, external borrowing and grants<br />
(including donations from international agencies<br />
and nongovernmental organizations) and social (or<br />
compulsory) health insurance funds, expressed as a<br />
percentage of GDP.<br />
MAIN DATA SOURCES<br />
Columns 1 and 4: UNICEF (<strong>2016</strong>).<br />
Columns 2 and 3: WHO and UNICEF (<strong>2016</strong>).<br />
Columns 5 and 6: UN Inter-agency Group for Child<br />
Mortality Estimation (2015).<br />
Columns 7, 8, 11, 13 and 14: World Bank (<strong>2016</strong>a).<br />
Column 9: United Nations Statistics Division (<strong>2016</strong>b).<br />
Column 10: United Nations Statistics Division (<strong>2016</strong>c).<br />
Column 12: UNDESA (2015a).<br />
TABLE 8 Health outcomes | 229
TABLE<br />
9<br />
Education achievements<br />
TABLE<br />
9<br />
Adult<br />
(% ages 15<br />
and older)<br />
Literacy rate<br />
Gross enrolment ratio<br />
Population<br />
with at<br />
least some<br />
Youth<br />
(% ages 15–24)<br />
secondary<br />
education Pre-primary Primary Secondary Tertiary<br />
Female<br />
Male<br />
(% ages 25<br />
and older)<br />
(% of<br />
preschool-age<br />
children)<br />
(% of primary<br />
school–age<br />
population)<br />
(% of<br />
secondary<br />
school–age<br />
population)<br />
(% of tertiary<br />
school–age<br />
population)<br />
Primary<br />
school<br />
dropout rate<br />
Education quality<br />
Primary<br />
school<br />
teachers<br />
trained to<br />
teach<br />
(% of primary<br />
school cohort) (%)<br />
Pupil–<br />
teacher<br />
ratio,<br />
primary<br />
school<br />
(number of<br />
pupils per<br />
teacher)<br />
Government<br />
expenditure<br />
on education<br />
HDI rank 2005–2015 a 2005–2015 a 2005–2015 a 2005–2015 a 2010–2015 a 2010–2015 a 2010–2015 a 2010–2015 a 2005–2015 a 2005–2015 a 2010–2015 a 2010–2014 a<br />
VERY HIGH HUMAN DEVELOPMENT<br />
1 Norway .. .. .. 95.3 98 100 113 77 0.4 .. 9 7.4<br />
2 Australia .. .. .. 91.5 109 107 138 87 .. .. .. 5.3<br />
2 Switzerland .. .. .. 96.7 105 103 100 57 .. .. 10 5.1<br />
4 Germany .. .. .. 96.7 111 103 102 65 3.5 .. 12 4.9<br />
5 Denmark .. .. .. 89.5 96 101 130 82 0.5 .. .. 8.5<br />
5 Singapore 96.8 99.9 99.9 78.6 .. .. .. .. 1.3 94 .. 2.9<br />
7 Netherlands .. .. .. 88.2 95 104 132 79 .. .. 12 5.6<br />
8 Ireland .. .. .. 85.5 108 103 126 73 .. .. 16 5.8<br />
9 Iceland .. .. .. 98.6 97 99 111 82 2.1 .. 10 7.0<br />
10 Canada .. .. .. 100.0 74 101 110 .. .. .. .. 5.3<br />
10 United States .. .. .. 95.3 71 100 98 87 .. .. 15 5.2<br />
12 Hong Kong, China (SAR) .. .. .. 77.4 109 111 101 69 1.6 96 14 3.6<br />
13 New Zealand .. .. .. 98.7 92 99 117 81 .. .. 14 6.4<br />
14 Sweden .. .. .. 88.0 96 121 133 62 0.4 .. 10 7.7<br />
15 Liechtenstein .. .. .. .. 106 103 116 37 20.6 .. 7 2.6<br />
16 United Kingdom .. .. .. 82.9 88 108 128 56 .. .. 17 5.7<br />
17 Japan .. .. .. 91.8 90 102 102 62 0.2 .. 17 3.8<br />
18 Korea (Republic of) .. .. .. 91.4 92 99 98 95 0.4 .. 17 4.6<br />
19 Israel .. .. .. 88.8 111 104 102 66 0.8 .. 13 5.9<br />
20 Luxembourg .. .. .. 100.0 93 97 102 19 15.2 .. 8 ..<br />
21 France .. .. .. 82.5 109 105 111 64 .. .. 18 5.5<br />
22 Belgium .. .. .. 82.3 118 105 165 73 7.8 .. 11 6.4<br />
23 Finland .. .. .. 100.0 80 101 145 89 0.4 .. 13 7.2<br />
24 Austria .. .. .. 98.9 102 102 99 80 0.5 .. 11 5.6<br />
25 Slovenia 99.7 99.9 99.8 97.3 93 99 111 83 1.0 .. 17 5.7<br />
26 Italy 99.2 99.9 99.9 82.3 100 102 102 63 1.1 .. 12 4.1<br />
27 Spain 98.1 99.8 99.7 73.7 98 105 130 89 3.7 .. 13 4.3<br />
28 Czech Republic .. .. .. 99.8 105 99 105 66 0.7 .. 19 4.3<br />
29 Greece 97.7 99.4 99.5 67.5 76 99 108 110 9.3 .. 9 ..<br />
30 Brunei Darussalam 96.4 99.7 99.5 68.6 b 74 107 99 32 3.6 87 10 3.8<br />
30 Estonia 99.8 100.0 100.0 100.0 88 101 109 73 3.4 .. 11 4.7<br />
32 Andorra .. .. .. 72.8 .. .. .. .. 29.3 100 10 3.1<br />
33 Cyprus 99.1 99.9 99.8 79.0 77 99 99 53 9.2 .. 13 6.6<br />
33 Malta 94.1 99.5 98.8 76.9 115 97 85 45 3.1 .. 11 6.8<br />
33 Qatar 97.8 99.7 98.3 68.4 58 101 109 16 2.3 49 11 3.5<br />
36 Poland 99.8 100.0 100.0 83.9 77 101 109 71 1.5 .. 10 4.8<br />
37 Lithuania 99.8 99.9 99.9 93.1 88 102 107 69 2.8 .. 13 4.8<br />
38 Chile 97.3 99.7 99.0 76.5 128 101 100 87 0.5 .. 20 4.6<br />
38 Saudi Arabia 94.7 99.3 99.4 66.5 16 109 108 61 1.3 100 11 ..<br />
40 Slovakia 99.6 99.5 99.4 99.3 92 101 92 53 2.1 .. 15 4.1<br />
41 Portugal 95.7 99.6 99.5 51.4 92 109 116 66 .. .. 13 5.1<br />
42 United Arab Emirates 93.8 99.1 99.6 67.7 92 107 .. 22 8.0 100 19 ..<br />
43 Hungary 99.1 99.0 98.7 96.6 84 102 107 53 1.7 .. 11 4.6<br />
44 Latvia 99.9 99.9 99.8 99.1 91 100 115 67 6.5 .. 11 4.9<br />
45 Argentina 98.1 99.5 99.1 62.4 72 111 106 80 5.4 .. .. 5.3<br />
45 Croatia 99.3 99.8 99.7 95.8 61 99 99 70 0.6 .. 14 4.2<br />
47 Bahrain 95.7 99.7 99.8 57.9 b 55 .. .. 37 2.2 83 12 2.6<br />
48 Montenegro 98.7 99.0 99.3 89.2 55 94 90 55 19.5 .. .. ..<br />
49 Russian Federation 99.7 99.8 99.7 94.6 84 99 101 79 3.6 .. 20 4.2<br />
50 Romania 98.8 99.3 99.3 89.1 90 96 95 53 6.0 .. 18 2.9<br />
51 Kuwait 96.2 99.5 99.6 57.4 81 103 94 27 4.3 79 9 ..<br />
HIGH HUMAN DEVELOPMENT<br />
52 Belarus 99.7 99.9 99.8 89.3 105 99 107 89 1.7 99 16 5.0<br />
52 Oman 94.8 99.1 99.1 58.8 54 110 102 29 1.3 .. .. 5.0<br />
54 Barbados .. .. .. 92.6 84 94 109 65 6.6 100 18 6.7<br />
54 Uruguay 98.4 99.3 98.5 53.4 70 110 94 63 5.3 .. 14 4.4<br />
56 Bulgaria 98.4 97.8 98.2 94.2 83 99 101 71 2.2 .. 18 3.5<br />
56 Kazakhstan 99.8 99.9 99.8 100.0 60 111 109 46 1.2 100 16 ..<br />
(% of GDP)<br />
230 | HUMAN DEVELOPMENT REPORT <strong>2016</strong>
HUMAN DEVELOPMENT REPORT <strong>2016</strong><br />
<strong>Human</strong> <strong>Development</strong> for Everyone<br />
Adult<br />
(% ages 15<br />
and older)<br />
Literacy rate<br />
Gross enrolment ratio<br />
Population<br />
with at<br />
least some<br />
Youth<br />
(% ages 15–24)<br />
secondary<br />
education Pre-primary Primary Secondary Tertiary<br />
Female<br />
Male<br />
(% ages 25<br />
and older)<br />
(% of<br />
preschool-age<br />
children)<br />
(% of primary<br />
school–age<br />
population)<br />
(% of<br />
secondary<br />
school–age<br />
population)<br />
(% of tertiary<br />
school–age<br />
population)<br />
Primary<br />
school<br />
dropout rate<br />
Education quality<br />
Primary<br />
school<br />
teachers<br />
trained to<br />
teach<br />
(% of primary<br />
school cohort) (%)<br />
Pupil–<br />
teacher<br />
ratio,<br />
primary<br />
school<br />
(number of<br />
pupils per<br />
teacher)<br />
Government<br />
expenditure<br />
on education<br />
HDI rank 2005–2015 a 2005–2015 a 2005–2015 a 2005–2015 a 2010–2015 a 2010–2015 a 2010–2015 a 2010–2015 a 2005–2015 a 2005–2015 a 2010–2015 a 2010–2014 a<br />
58 Bahamas .. .. .. 87.5 .. 108 93 .. 10.5 92 14 ..<br />
59 Malaysia 94.6 98.5 98.3 77.1 99 107 79 30 5.8 99 11 6.1<br />
60 Palau 99.5 99.8 99.8 .. 74 114 114 62 .. .. .. ..<br />
60 Panama 95.0 98.0 98.3 68.6 71 105 75 39 6.8 90 25 3.3<br />
62 Antigua and Barbuda 99.0 .. .. .. 75 97 102 23 8.7 70 14 ..<br />
63 Seychelles 95.2 99.6 98.6 .. 93 104 75 6 .. 87 13 3.6<br />
64 Mauritius 90.6 99.1 98.4 59.7 102 103 98 39 1.8 100 19 5.0<br />
65 Trinidad and Tobago 99.0 99.6 99.6 69.8 .. 106 .. .. 10.6 88 .. ..<br />
66 Costa Rica 97.8 99.4 99.2 54.2 53 111 120 53 9.6 94 13 7.0<br />
66 Serbia 98.1 98.4 98.6 86.7 59 101 94 58 1.7 56 16 4.4<br />
68 Cuba 99.7 99.9 99.9 84.8 98 98 100 41 3.5 100 9 12.8<br />
69 Iran (Islamic Republic of) 86.8 98.2 98.5 67.7 42 109 88 66 3.8 100 26 3.0<br />
70 Georgia 99.8 99.8 99.7 96.7 .. 117 99 39 1.3 95 9 2.0<br />
71 Turkey 95.0 98.8 99.7 54.0 28 107 100 79 10.0 .. 20 ..<br />
71 Venezuela (Bolivarian Republic of) 95.4 98.3 97.1 68.9 73 101 92 .. 12.9 .. .. ..<br />
73 Sri Lanka 92.6 99.2 98.4 80.5 95 101 100 21 1.8 80 24 1.6<br />
74 Saint Kitts and Nevis .. .. .. .. 94 84 92 79 7.2 68 14 ..<br />
75 Albania 97.6 99.1 99.0 90.3 89 112 96 63 1.3 .. 19 3.5<br />
76 Lebanon 93.9 99.3 98.8 54.2 84 97 68 43 6.7 97 12 2.6<br />
77 Mexico 94.4 98.8 98.7 57.4 69 103 91 30 4.3 96 27 5.2<br />
78 Azerbaijan 99.8 99.9 100.0 95.6 23 106 103 23 2.7 100 13 2.5<br />
79 Brazil 92.6 99.2 98.6 57.5 86 110 102 46 .. .. 21 5.9<br />
79 Grenada .. .. .. .. 91 103 101 .. .. 63 14 ..<br />
81 Bosnia and Herzegovina 98.5 99.6 99.7 78.0 15 100 89 48 13.5 .. 17 ..<br />
82 The former Yugoslav Republic of Macedonia 97.8 98.5 98.7 47.8 29 86 82 39 2.5 .. 15 ..<br />
83 Algeria 80.2 95.5 95.6 34.9 79 119 100 35 6.6 95 24 ..<br />
84 Armenia 99.8 99.9 99.8 98.3 52 .. .. 44 9.8 77 .. 2.2<br />
84 Ukraine 99.8 99.8 99.7 95.1 104 104 99 82 1.5 100 17 6.7<br />
86 Jordan 96.7 99.4 99.0 81.3 32 89 84 48 2.1 .. .. ..<br />
87 Peru 94.5 99.0 98.9 61.5 88 101 96 41 9.5 .. 18 3.7<br />
87 Thailand 96.7 98.2 98.3 43.3 73 104 86 53 6.5 100 15 4.1<br />
89 Ecuador 94.5 98.8 98.8 48.8 62 113 104 40 11.1 82 24 4.2<br />
90 China 96.4 99.7 99.7 75.0 82 104 94 39 .. .. 16 ..<br />
91 Fiji .. .. .. 72.9 .. 106 89 .. 2.8 100 28 3.9<br />
92 Mongolia 98.4 99.0 98.1 87.8 86 102 91 64 .. 100 27 4.6<br />
92 Saint Lucia .. .. .. 45.2 65 .. 86 17 9.9 79 14 4.8<br />
94 Jamaica 88.7 98.9 94.2 63.4 105 .. 69 28 5.1 96 22 6.0<br />
95 Colombia 94.7 99.1 98.2 54.9 55 114 99 51 16.5 98 24 4.7<br />
96 Dominica .. .. .. .. 85 118 97 .. 15.0 65 14 ..<br />
97 Suriname 95.6 99.7 98.4 57.6 94 120 78 .. 14.1 6 14 ..<br />
97 Tunisia 81.8 97.8 98.3 43.9 43 113 88 35 6.0 100 17 6.2<br />
99 Dominican Republic 91.8 98.6 97.3 56.4 44 101 78 48 21.4 85 21 ..<br />
99 Saint Vincent and the Grenadines .. .. .. .. 69 105 105 .. 31.4 76 16 5.1<br />
101 Tonga 99.4 99.5 99.4 91.2 39 108 90 .. 9.6 97 22 ..<br />
102 Libya 91.0 99.9 100.0 55.1 b .. .. .. .. .. .. .. ..<br />
103 Belize 82.7 89.9 87.3 77.6 50 112 80 24 5.3 61 22 6.2<br />
104 Samoa 99.0 99.4 98.9 74.5 37 106 87 .. 10.0 .. 30 ..<br />
105 Maldives 99.3 99.5 100.0 32.6 .. .. .. .. 17.8 86 12 5.2<br />
105 Uzbekistan 99.6 100.0 99.9 99.9 25 97 95 9 1.9 100 16 ..<br />
MEDIUM HUMAN DEVELOPMENT<br />
107 Moldova (Republic of) 99.4 100.0 100.0 96.2 84 93 87 41 4.9 94 17 7.5<br />
108 Botswana 88.5 99.6 96.1 85.9 b 18 109 84 28 6.0 99 23 ..<br />
109 Gabon 83.2 90.5 87.8 54.1 b 37 142 .. .. .. .. 25 ..<br />
110 Paraguay 95.6 99.5 98.6 46.6 38 106 77 35 15.9 92 24 5.0<br />
111 Egypt 75.2 92.1 94.5 61.4 b 30 104 86 32 3.9 73 23 ..<br />
111 Turkmenistan 99.7 99.9 99.8 .. 63 89 85 8 .. .. .. 3.0<br />
113 Indonesia 93.9 99.1 98.9 47.3 58 106 82 31 18.1 .. 17 3.3<br />
114 Palestine, State of 96.7 99.3 99.4 58.8 51 95 82 44 2.5 100 24 ..<br />
115 Viet Nam 94.5 98.0 98.2 71.7 81 109 .. 30 10.4 100 19 6.3<br />
(% of GDP)<br />
TABLE<br />
9<br />
TABLE 9 Education achievements | 231
TABLE 9 EDUCATION ACHIEVEMENTS<br />
TABLE<br />
9<br />
Adult<br />
(% ages 15<br />
and older)<br />
Literacy rate<br />
Gross enrolment ratio<br />
Population<br />
with at<br />
least some<br />
Youth<br />
(% ages 15–24)<br />
secondary<br />
education Pre-primary Primary Secondary Tertiary<br />
Female<br />
Male<br />
(% ages 25<br />
and older)<br />
(% of<br />
preschool-age<br />
children)<br />
(% of primary<br />
school–age<br />
population)<br />
(% of<br />
secondary<br />
school–age<br />
population)<br />
(% of tertiary<br />
school–age<br />
population)<br />
Primary<br />
school<br />
dropout rate<br />
Education quality<br />
Primary<br />
school<br />
teachers<br />
trained to<br />
teach<br />
(% of primary<br />
school cohort) (%)<br />
Pupil–<br />
teacher<br />
ratio,<br />
primary<br />
school<br />
(number of<br />
pupils per<br />
teacher)<br />
Government<br />
expenditure<br />
on education<br />
HDI rank 2005–2015 a 2005–2015 a 2005–2015 a 2005–2015 a 2010–2015 a 2010–2015 a 2010–2015 a 2010–2015 a 2005–2015 a 2005–2015 a 2010–2015 a 2010–2014 a<br />
116 Philippines 96.3 98.9 97.0 71.6 .. 117 88 36 24.2 100 31 3.4<br />
117 El Salvador 88.4 97.9 97.5 41.0 72 112 81 29 17.4 96 24 3.4<br />
118 Bolivia (Plurinational State of) 95.7 98.9 99.2 54.2 63 .. 85 .. 3.3 .. .. 7.3<br />
119 South Africa 94.3 99.4 98.6 74.9 76 100 94 20 .. .. 32 6.1<br />
120 Kyrgyzstan 99.5 99.8 99.7 100.0 25 108 91 46 1.2 72 25 6.8<br />
121 Iraq 79.7 80.6 82.4 45.6 b .. .. .. .. .. .. .. ..<br />
122 Cabo Verde 87.6 98.6 98.1 .. 70 113 93 23 9.4 96 23 5.0<br />
123 Morocco 72.4 93.5 96.6 29.4 b 60 116 69 25 10.7 100 26 ..<br />
124 Nicaragua 82.8 93.6 89.7 45.0 b 58 123 74 .. 51.6 75 30 4.5<br />
125 Guatemala 79.3 91.0 95.5 36.8 66 104 64 18 28.2 .. 23 2.8<br />
125 Namibia 81.9 93.3 86.5 38.5 21 111 .. .. 9.4 96 30 8.3<br />
127 Guyana 88.5 94.8 94.1 60.9 b 94 85 89 12 7.8 70 23 3.2<br />
127 Micronesia (Federated States of) .. .. .. .. .. 98 .. .. .. .. .. ..<br />
129 Tajikistan 99.8 99.9 99.9 93.3 11 98 88 26 1.4 100 22 4.0<br />
130 Honduras 88.5 98.1 96.2 32.3 47 109 68 21 24.6 .. 14 5.9<br />
131 India 72.1 87.2 91.8 48.7 b 10 111 69 24 .. .. 32 3.8<br />
132 Bhutan 64.9 87.3 89.9 9.6 17 102 84 11 21.1 91 27 5.9<br />
133 Timor-Leste 67.5 82.9 81.9 .. 17 137 73 18 18.8 .. 31 7.7<br />
134 Vanuatu 85.2 96.0 95.5 .. 97 124 60 .. 28.5 100 23 4.9<br />
135 Congo 79.3 76.9 85.7 47.4 14 111 55 10 29.7 80 44 6.2<br />
135 Equatorial Guinea 95.3 98.8 97.7 .. 68 84 .. .. 27.9 49 26 ..<br />
137 Kiribati .. .. .. .. .. 113 .. .. .. 85 26 ..<br />
138 Lao People’s Democratic Republic 79.9 87.3 93.1 36.4 b 30 116 57 17 22.4 98 25 4.2<br />
139 Bangladesh 61.5 85.8 80.6 43.1 b 32 112 58 13 33.8 58 40 2.0<br />
139 Ghana 76.6 89.9 91.3 59.8 121 110 71 16 16.3 55 31 6.0<br />
139 Zambia 63.4 62.1 69.4 51.8 .. 104 .. .. 44.5 93 48 ..<br />
142 Sao Tome and Principe 74.9 82.3 84.0 37.7 51 114 85 13 20.5 34 39 3.9<br />
143 Cambodia 77.2 91.9 91.1 19.6 18 116 .. 16 53.1 100 45 2.0<br />
144 Nepal 64.7 87.4 92.6 32.0 b 85 135 67 16 29.9 94 23 4.7<br />
145 Myanmar 93.1 96.3 96.3 23.8 b 23 100 51 14 25.2 100 28 ..<br />
146 Kenya 78.0 86.6 85.2 32.0 74 111 68 .. .. 97 57 5.5<br />
147 Pakistan 58.7 69.3 81.5 35.4 70 94 42 10 20.4 84 47 2.5<br />
LOW HUMAN DEVELOPMENT<br />
148 Swaziland 87.5 96.0 93.5 28.8 b 25 113 63 5 25.3 79 28 8.6<br />
149 Syrian Arab Republic 86.4 95.6 97.1 38.9 6 80 50 33 83.9 .. .. ..<br />
150 Angola 71.1 67.3 78.6 .. 79 129 29 10 68.1 47 43 3.4<br />
151 Tanzania (United Republic of) 80.3 87.2 87.4 12.6 32 87 32 4 33.3 99 43 3.5<br />
152 Nigeria 59.6 65.3 79.9 .. 13 85 44 .. 20.7 66 38 ..<br />
153 Cameroon 75.0 80.4 87.1 31.8 34 114 56 12 30.2 79 44 3.0<br />
154 Papua New Guinea 64.2 78.8 66.3 11.7 b .. 115 40 .. .. .. .. ..<br />
154 Zimbabwe 86.5 93.5 90.0 57.7 42 100 48 6 23.1 86 36 2.0<br />
156 Solomon Islands .. .. .. .. 98 114 48 .. 28.5 65 20 10.0<br />
157 Mauritania 52.1 55.0 70.0 17.3 b 3 98 30 6 35.9 91 34 3.3<br />
158 Madagascar 64.7 64.8 65.4 .. 14 147 38 4 59.9 17 42 2.1<br />
159 Rwanda 70.5 82.2 78.5 13.2 14 134 39 8 65.3 95 58 5.0<br />
160 Comoros 77.8 88.2 86.9 .. 23 105 59 9 .. 75 28 5.1<br />
160 Lesotho 79.4 93.4 77.0 23.0 31 107 52 10 32.6 76 33 ..<br />
162 Senegal 55.7 63.6 75.9 13.9 15 81 40 7 38.6 70 32 5.6<br />
163 Haiti 60.7 81.6 82.6 32.0 b .. .. .. .. .. .. .. ..<br />
163 Uganda 73.9 86.6 87.4 30.8 11 110 28 4 75.2 95 46 2.2<br />
165 Sudan 75.9 87.8 91.3 16.3 b 34 70 43 17 20.6 60 25 ..<br />
166 Togo 66.5 81.4 88.9 33.3 15 125 55 10 47.2 76 41 4.8<br />
167 Benin 38.4 42.5 62.6 23.3 21 126 54 15 46.6 68 46 4.4<br />
168 Yemen 70.1 82.7 97.6 24.4 b 1 97 49 10 30.5 .. 30 ..<br />
169 Afghanistan 38.2 46.3 69.6 22.2 b .. 112 56 9 .. .. 46 4.8<br />
170 Malawi 65.8 75.2 74.9 19.6 .. 147 39 1 50.9 91 61 6.9<br />
171 Côte d’Ivoire 43.1 40.7 59.6 24.9 b 7 90 40 9 26.0 85 43 4.7<br />
172 Djibouti .. .. .. .. 5 66 47 5 15.6 100 33 4.5<br />
173 Gambia 55.5 70.8 75.6 31.9 b 34 86 57 3 22.7 84 37 2.8<br />
(% of GDP)<br />
232 | HUMAN DEVELOPMENT REPORT <strong>2016</strong>
HUMAN DEVELOPMENT REPORT <strong>2016</strong><br />
<strong>Human</strong> <strong>Development</strong> for Everyone<br />
Adult<br />
(% ages 15<br />
and older)<br />
Literacy rate<br />
Gross enrolment ratio<br />
Population<br />
with at<br />
least some<br />
Youth<br />
(% ages 15–24)<br />
secondary<br />
education Pre-primary Primary Secondary Tertiary<br />
Female<br />
Male<br />
(% ages 25<br />
and older)<br />
(% of<br />
preschool-age<br />
children)<br />
(% of primary<br />
school–age<br />
population)<br />
(% of<br />
secondary<br />
school–age<br />
population)<br />
(% of tertiary<br />
school–age<br />
population)<br />
Primary<br />
school<br />
dropout rate<br />
Education quality<br />
Primary<br />
school<br />
teachers<br />
trained to<br />
teach<br />
(% of primary<br />
school cohort) (%)<br />
Pupil–<br />
teacher<br />
ratio,<br />
primary<br />
school<br />
(number of<br />
pupils per<br />
teacher)<br />
Government<br />
expenditure<br />
on education<br />
HDI rank 2005–2015 a 2005–2015 a 2005–2015 a 2005–2015 a 2010–2015 a 2010–2015 a 2010–2015 a 2010–2015 a 2005–2015 a 2005–2015 a 2010–2015 a 2010–2014 a<br />
174 Ethiopia 49.1 67.8 71.1 15.8 25 100 36 8 63.4 95 64 4.5<br />
175 Mali 38.7 46.4 61.5 11.5 4 77 44 7 38.4 52 42 4.3<br />
176 Congo (Democratic Republic of the) 77.3 80.5 91.6 24.6 b 4 107 44 7 44.6 95 35 2.2<br />
177 Liberia 47.6 44.0 64.7 28.3 b .. 96 38 12 32.2 56 26 2.8<br />
178 Guinea-Bissau 59.9 73.7 80.8 .. 6 114 .. .. .. 39 52 2.4<br />
179 Eritrea 73.8 91.9 94.5 .. 15 51 36 3 22.4 80 40 ..<br />
179 Sierra Leone 48.1 59.3 75.8 23.1 b 10 130 43 .. 52.2 57 35 2.8<br />
181 Mozambique 58.8 69.7 83.7 5.2 b .. 104 25 6 69.3 90 54 6.5<br />
181 South Sudan 31.9 41.7 46.9 .. 6 84 .. .. .. 44 50 0.8<br />
183 Guinea 30.4 47.5 43.0 .. 15 91 39 11 34.1 75 46 3.5<br />
184 Burundi 85.6 87.8 87.4 8.7 b 7 128 38 4 47.4 92 44 5.4<br />
185 Burkina Faso 36.0 43.2 47.6 8.5 4 87 30 5 30.5 86 44 4.5<br />
186 Chad 40.2 50.2 55.3 5.5 1 101 22 3 49.0 65 62 2.9<br />
187 Niger 19.1 17.1 36.4 6.1 b 7 71 19 2 35.6 50 36 6.8<br />
188 Central African Republic 36.8 27.0 48.9 20.9 b 6 93 17 3 53.4 58 80 1.2<br />
OTHER COUNTRIES OR TERRITORIES<br />
Korea (Democratic People’s Rep. of) 100.0 100.0 100.0 .. .. .. .. 30 .. .. .. ..<br />
Marshall Islands .. .. .. 92.1 48 105 .. 43 16.5 .. .. ..<br />
Monaco .. .. .. .. .. .. .. .. .. .. .. 1.0<br />
Nauru .. .. .. .. 90 105 83 .. .. 74 39 ..<br />
San Marino .. .. .. .. 107 93 95 60 3.8 .. 6 2.4<br />
Somalia .. .. .. .. .. .. .. .. .. .. .. ..<br />
Tuvalu .. .. .. .. 93 101 81 .. .. .. .. ..<br />
<strong>Human</strong> development groups<br />
Very high human development .. .. .. 88.8 84 102 106 75 .. .. 14 5.1<br />
High human development 95.3 99.3 99.2 70.6 74 105 95 43 .. .. 18 ..<br />
Medium human development 76.4 88.5 91.5 49.1 34 109 68 23 .. .. 29 3.9<br />
Low human development 60.9 69.1 77.5 20.3 18 98 40 8 42.2 76 42 3.8<br />
Developing countries 83.3 88.7 91.8 57.7 42 105 71 29 .. .. 26 ..<br />
Regions<br />
Arab States 80.7 91.6 94.6 47.0 37 98 76 30 16.1 85 21 ..<br />
East Asia and the Pacific 95.7 99.0 98.9 68.9 74 106 88 37 .. .. 17 ..<br />
Europe and Central Asia 98.1 99.4 99.7 81.7 44 104 98 55 5.2 .. 18 ..<br />
Latin America and the Caribbean 93.2 98.4 98.0 58.1 74 107 95 44 .. .. 22 5.4<br />
South Asia 70.3 84.8 89.5 47.9 23 109 65 23 .. .. 33 3.4<br />
Sub-Saharan Africa 64.3 71.1 78.3 29.6 26 100 43 8 41.7 78 43 4.8<br />
Least developed countries 63.3 74.3 78.9 25.7 22 104 44 9 45.4 78 41 3.3<br />
Small island developing states 82.8 90.0 87.8 56.6 .. 107 73 .. .. .. .. ..<br />
Organisation for Economic<br />
Co‐operation and <strong>Development</strong> .. .. .. 85.5 80 103 104 70 .. .. 16 5.1<br />
World 84.3 89.1 92.1 64.9 47 105 76 35 .. .. 24 5.0<br />
(% of GDP)<br />
TABLE<br />
9<br />
NOTES<br />
a Data refer to the most recent year available<br />
during the period specified.<br />
b Based on Barro and Lee (<strong>2016</strong>).<br />
DEFINITIONS<br />
Adult literacy rate: Percentage of the population<br />
ages 15 and older that can, with understanding,<br />
both read and write a short simple statement on<br />
everyday life.<br />
Youth literacy rate: Percentage of the population<br />
ages 15–24 that can, with understanding, both read<br />
and write a short simple statement on everyday life.<br />
Population with at least some secondary<br />
education: Percentage of the population ages 25<br />
and older that has reached (but not necessarily<br />
completed) a secondary level of education.<br />
Gross enrolment ratio: Total enrolment in a given<br />
level of education (pre-primary, primary, secondary<br />
or tertiary), regardless of age, expressed as a<br />
percentage of the official school-age population for<br />
the same level of education.<br />
Primary school dropout rate: Percentage of<br />
students from a given cohort who have enrolled in<br />
primary school but who drop out before reaching<br />
the last grade of primary education. It is calculated<br />
as 100 minus the survival rate to the last grade of<br />
primary education and assumes that observed flow<br />
rates remain unchanged throughout the cohort life<br />
and that dropouts do not re-enter school.<br />
Primary school teachers trained to teach:<br />
Percentage of primary school teachers who have<br />
received the minimum organized teacher training<br />
(pre-service or in-service) required for teaching at<br />
the primary level.<br />
Pupil–teacher ratio, primary school: Average<br />
number of pupils per teacher in primary education in<br />
a given school year.<br />
Government expenditure on education:<br />
Current, capital and transfer spending on education,<br />
expressed as a percentage of GDP.<br />
MAIN DATA SOURCES<br />
Columns 1–11: UNESCO Institute for Statistics<br />
(<strong>2016</strong>).<br />
Column 12: World Bank (<strong>2016</strong>a).<br />
TABLE 9 Education achievements | 233
TABLE<br />
10<br />
National income and composition of resources<br />
Gross domestic<br />
product (GDP)<br />
Total<br />
(2011 PPP<br />
$ billions)<br />
Gross<br />
fixed capital<br />
formation<br />
Per capita<br />
(2011 PPP $) (% of GDP)<br />
General government<br />
final consumption<br />
expenditure<br />
Total<br />
(% of GDP)<br />
Average<br />
annual<br />
growth (%)<br />
Total tax<br />
revenue<br />
(% of GDP)<br />
Debts<br />
Domestic<br />
Taxes on credit<br />
income, provided by<br />
profits and financial<br />
capital gains sector<br />
Total debt<br />
service<br />
Consumer<br />
price index<br />
Prices<br />
(% of total<br />
tax revenue) (% of GDP) (% of GNI) (2010=100) Index<br />
Domestic<br />
food price level<br />
Volatility<br />
index<br />
TABLE<br />
10<br />
HDI rank 2015 2015 2010–2015 a 2010–2015 a 2010–2015 a 2005–2014 a 2005–2014 a 2010–2015 a 2014 2015 2010–2014 a 2010–2014 a<br />
VERY HIGH HUMAN DEVELOPMENT<br />
1 Norway 334.9 64,451 23.3 23.2 1.9 23.8 26.2 .. .. 109 1.5 11.3<br />
2 Australia 1,038.2 43,655 26.5 18.0 1.3 22.2 63.6 177.2 .. 112 1.4 ..<br />
2 Switzerland 456.7 55,112 23.7 11.3 2.4 9.6 20.9 178.8 .. 98 1.4 6.6<br />
4 Germany 3,586.5 44,053 20.0 19.4 2.5 11.5 16.5 135.1 .. 107 1.5 5.6<br />
5 Denmark 246.4 43,415 19.1 26.2 0.6 34.8 44.0 219.0 .. 107 1.3 6.0<br />
5 Singapore 443.9 80,192 25.5 10.4 0.1 13.9 34.7 121.1 .. 113 1.0 4.0<br />
7 Netherlands 785.4 46,374 19.5 25.3 0.3 20.9 24.1 218.9 .. 109 1.4 5.6<br />
8 Ireland 240.8 51,899 22.0 17.2 –0.8 23.8 37.6 130.5 .. 105 1.2 3.3<br />
9 Iceland 14.0 42,449 19.2 23.8 1.8 25.7 29.8 108.0 .. 118 1.8 5.4<br />
10 Canada 1,537.7 42,891 23.3 21.2 1.7 11.8 52.9 .. .. 109 1.3 7.1<br />
10 United States 16,890.2 52,549 19.6 14.3 0.4 10.9 52.8 238.3 .. 109 1.0 0.0<br />
12 Hong Kong, China (SAR) 390.0 53,380 22.6 9.6 3.4 12.5 36.2 211.5 .. 123 .. ..<br />
13 New Zealand 159.8 34,762 22.4 18.6 2.3 26.7 50.8 150.7 .. 108 2.0 ..<br />
14 Sweden 443.9 45,296 24.2 26.1 2.5 26.4 14.3 152.4 .. 104 1.5 6.7<br />
15 Liechtenstein .. .. .. .. .. .. .. .. .. .. .. ..<br />
16 United Kingdom 2,518.1 38,658 17.3 19.4 1.5 25.0 32.6 163.2 .. 112 1.2 5.0<br />
17 Japan 4,545.7 35,804 21.7 20.4 1.2 10.9 47.6 376.6 .. 104 1.9 5.6<br />
18 Korea (Republic of) 1,740.5 34,387 29.1 15.2 3.4 14.4 30.3 166.5 .. 110 1.9 9.1<br />
19 Israel 265.4 31,671 18.6 22.3 2.9 23.5 28.9 83.2 .. 107 2.2 5.9<br />
20 Luxembourg 53.3 93,553 17.4 16.6 2.7 25.9 29.1 191.2 .. 109 1.3 8.9<br />
21 France 2,492.3 37,306 21.5 23.9 1.4 23.3 25.4 148.4 .. 106 1.7 4.8<br />
22 Belgium 464.3 41,138 23.3 24.2 0.2 26.1 36.5 148.3 .. 109 1.7 6.0<br />
23 Finland 211.8 38,643 20.3 24.6 –0.9 20.8 14.8 158.6 .. 109 1.6 6.2<br />
24 Austria 378.0 43,893 22.1 20.1 1.4 26.4 28.1 126.1 .. 111 1.4 5.9<br />
25 Slovenia 59.7 28,942 19.4 18.5 0.7 17.6 10.4 71.3 .. 106 2.2 9.4<br />
26 Italy 2,042.2 33,587 16.5 19.0 –0.7 23.6 31.6 171.4 .. 107 2.0 5.0<br />
27 Spain 1,523.2 32,814 20.4 19.3 2.7 12.2 28.2 193.6 .. 107 2.0 8.4<br />
28 Czech Republic 314.5 29,805 25.8 19.3 2.8 13.5 14.5 70.8 .. 108 2.3 10.7<br />
29 Greece 266.4 24,617 11.7 20.0 0.0 24.6 18.8 135.4 .. 101 2.6 11.2<br />
30 Brunei Darussalam 28.2 66,647 27.3 21.6 1.1 .. .. 33.4 .. 102 3.0 4.7<br />
30 Estonia 35.3 26,930 24.2 19.9 2.1 1.0 10.4 76.5 .. 111 2.8 7.4<br />
32 Andorra .. .. .. .. .. .. .. .. .. .. .. ..<br />
33 Cyprus 25.5 30,310 10.8 15.7 –8.7 24.5 23.3 314.2 .. 102 2.0 12.7<br />
33 Malta 12.2 b 28,822 b 14.3 20.2 0.9 28.0 32.6 151.5 .. 108 2.6 8.6<br />
33 Qatar 302.5 135,322 .. 19.4 8.3 14.7 40.2 120.2 .. 112 1.8 6.3<br />
36 Poland 943.8 24,836 20.1 18.0 3.4 15.5 19.1 73.6 .. 108 2.7 7.0<br />
37 Lithuania 76.8 26,397 18.9 16.9 1.3 4.6 15.1 47.5 .. 108 3.5 5.5<br />
38 Chile 397.5 22,145 22.7 13.4 5.8 17.1 28.9 123.6 .. 118 2.6 7.4<br />
38 Saudi Arabia 1,586.0 50,284 28.8 29.6 12.0 .. .. 20.8 .. 118 2.9 3.8<br />
40 Slovakia 148.6 27,394 23.0 19.0 3.4 16.1 28.3 74.4 .. 109 2.6 9.2<br />
41 Portugal 276.2 26,690 15.0 18.1 0.6 22.7 25.1 167.0 .. 107 2.5 9.0<br />
42 United Arab Emirates 605.3 66,102 23.7 7.5 3.7 0.4 .. 100.1 .. 109 .. ..<br />
43 Hungary 240.9 24,474 21.7 20.2 2.9 23.0 15.0 59.4 .. 111 2.4 5.8<br />
44 Latvia 44.8 22,628 22.9 17.6 4.9 14.0 8.7 58.0 .. 108 2.9 7.9<br />
45 Argentina .. .. 15.6 18.3 6.7 .. .. 41.2 .. 106 c .. ..<br />
45 Croatia 86.3 20,430 19.1 19.7 0.6 19.6 7.9 88.7 .. 107 3.2 2.7<br />
47 Bahrain 60.8 44,182 15.3 15.7 2.9 1.1 0.5 87.8 .. 111 2.2 18.5<br />
48 Montenegro 9.3 15,010 22.9 17.6 –3.0 .. .. 59.9 5.8 111 5.6 9.1<br />
49 Russian Federation 3,498.4 23,895 21.9 19.1 –1.8 13.4 1.9 54.5 .. 152 4.3 5.2<br />
50 Romania 395.2 19,926 24.7 13.5 1.8 18.0 18.7 37.5 12.5 114 3.7 4.3<br />
51 Kuwait 261.2 67,113 .. 19.4 8.8 .. .. 88.0 .. 118 2.6 3.7<br />
HIGH HUMAN DEVELOPMENT<br />
52 Belarus 158.1 16,621 28.6 14.9 –0.4 15.1 3.5 51.5 7.2 .. 5.3 6.0<br />
52 Oman 161.6 35,983 28.0 25.0 3.9 2.6 2.6 64.2 .. 110 3.3 9.2<br />
54 Barbados 4.4 15,426 13.0 20.6 31.3 25.2 27.6 .. .. 117 2.4 5.4<br />
54 Uruguay 68.5 19,952 19.9 13.9 2.6 18.8 18.4 36.3 .. 150 3.1 6.4<br />
56 Bulgaria 121.7 16,956 21.2 16.3 0.3 18.6 14.6 61.8 10.4 107 3.2 5.9<br />
56 Kazakhstan 427.2 24,353 19.9 10.3 10.3 .. .. 44.9 15.2 137 .. ..<br />
234 | HUMAN DEVELOPMENT REPORT <strong>2016</strong>
HUMAN DEVELOPMENT REPORT <strong>2016</strong><br />
<strong>Human</strong> <strong>Development</strong> for Everyone<br />
Gross domestic<br />
product (GDP)<br />
Total<br />
(2011 PPP<br />
$ billions)<br />
Gross<br />
fixed capital<br />
formation<br />
Per capita<br />
(2011 PPP $) (% of GDP)<br />
General government<br />
final consumption<br />
expenditure<br />
Total<br />
(% of GDP)<br />
Average<br />
annual<br />
growth (%)<br />
Total tax<br />
revenue<br />
(% of GDP)<br />
Debts<br />
Domestic<br />
Taxes on credit<br />
income, provided by<br />
profits and financial<br />
capital gains sector<br />
Total debt<br />
service<br />
Consumer<br />
price index<br />
Prices<br />
(% of total<br />
tax revenue) (% of GDP) (% of GNI) (2010=100) Index<br />
Domestic<br />
food price level<br />
Volatility<br />
index<br />
HDI rank 2015 2015 2010–2015 a 2010–2015 a 2010–2015 a 2005–2014 a 2005–2014 a 2010–2015 a 2014 2015 2010–2014 a 2010–2014 a<br />
58 Bahamas 8.7 22,394 20.6 15.7 4.4 .. .. 99.4 .. 109 1.6 5.4<br />
59 Malaysia 767.6 25,308 26.2 13.2 4.3 15.6 52.0 144.8 4.0 113 2.9 4.3<br />
60 Palau 0.3 14,386 .. .. .. .. .. .. .. .. .. ..<br />
60 Panama 82.1 20,885 43.3 9.9 3.0 .. .. 82.4 3.1 120 3.0 2.1<br />
62 Antigua and Barbuda 2.0 21,615 25.0 23.0 41.5 18.6 12.0 68.0 .. 110 2.6 ..<br />
63 Seychelles 2.4 25,668 33.7 26.3 .. 28.4 27.9 33.7 .. 121 6.7 7.2<br />
64 Mauritius 23.1 18,333 17.7 14.4 4.3 18.7 19.9 118.1 28.2 120 4.9 11.7<br />
65 Trinidad and Tobago 41.7 30,677 13.8 15.5 8.3 27.6 49.6 33.5 .. 134 4.0 16.5<br />
66 Costa Rica 69.6 14,472 21.8 17.8 3.5 13.7 15.6 69.9 7.2 122 3.2 7.6<br />
66 Serbia 91.3 12,863 18.1 16.9 –1.2 19.7 7.6 55.5 19.6 133 4.0 8.5<br />
68 Cuba 226.7 b 19,950 b 10.4 33.3 2.2 .. .. .. .. .. .. ..<br />
69 Iran (Islamic Republic of) 1,289.9 c 16,507 c 26.2 10.7 2.7 7.7 19.3 .. 0.1 285 4.5 13.0<br />
70 Georgia 33.5 9,109 28.5 16.5 6.6 24.1 35.2 52.6 11.4 115 .. ..<br />
71 Turkey 1,491.4 18,959 20.3 15.7 6.7 21.1 17.4 92.8 7.1 146 3.8 12.9<br />
71 Venezuela (Bolivarian Republic of) 485.4 15,603 22.2 12.4 0.6 15.5 21.5 61.9 .. 730 4.5 12.8<br />
73 Sri Lanka 231.6 11,048 26.5 8.8 10.3 10.4 16.2 66.9 3.2 128 6.9 8.3<br />
74 Saint Kitts and Nevis 1.3 22,934 29.0 22.6 .. 20.2 9.8 79.0 .. 106 2.9 ..<br />
75 Albania 30.0 10,397 27.3 10.9 –2.8 .. .. 62.6 2.5 111 6.4 10.3<br />
76 Lebanon 76.7 13,117 27.6 13.8 –0.3 14.8 19.3 206.0 7.2 115 .. ..<br />
77 Mexico 2,096.0 16,502 22.2 12.3 2.3 .. .. 53.7 4.1 119 3.7 4.7<br />
78 Azerbaijan 161.1 16,695 28.6 12.5 2.2 13.0 13.6 35.4 2.5 .. .. ..<br />
79 Brazil 3,004.4 14,455 18.2 20.2 –1.0 14.1 26.5 108.7 2.5 138 2.6 4.4<br />
79 Grenada 1.3 12,203 15.0 15.0 .. 18.7 16.9 58.0 2.9 104 3.4 ..<br />
81 Bosnia and Herzegovina 38.2 10,024 18.9 22.3 0.9 19.8 6.5 58.5 4.4 104 4.8 6.3<br />
82 The former Yugoslav Republic of Macedonia 26.4 12,725 25.0 16.7 4.6 16.4 10.7 59.6 8.8 110 5.1 7.9<br />
83 Algeria 548.3 13,823 36.7 19.4 1.1 37.2 60.2 39.8 0.1 127 5.1 5.5<br />
84 Armenia 23.8 7,899 20.4 13.8 3.1 17.5 21.3 48.2 11.8 125 8.9 11.9<br />
84 Ukraine 319.2 7,450 13.3 19.0 –15.8 18.3 11.8 85.6 13.7 181 5.2 3.9<br />
86 Jordan 77.8 10,240 22.1 18.9 –1.1 15.3 13.6 105.5 3.9 116 4.5 6.1<br />
87 Peru 366.2 11,672 24.3 13.0 9.5 16.5 34.0 27.6 2.6 118 3.9 3.4<br />
87 Thailand 1,042.9 15,345 24.7 17.1 1.7 16.0 34.6 173.4 3.9 110 4.5 2.8<br />
89 Ecuador 173.0 10,718 27.0 14.6 1.1 .. .. 30.9 4.0 121 3.4 5.7<br />
90 China 18,374.7 13,400 44.3 13.6 3.1 10.4 24.9 196.9 0.5 115 3.3 8.1<br />
91 Fiji 7.7 8,620 17.1 15.2 .. 23.2 32.5 119.9 1.2 116 5.1 8.3<br />
92 Mongolia 33.9 11,471 18.2 11.9 –7.8 15.3 11.6 69.3 12.1 163 4.8 16.7<br />
92 Saint Lucia 1.9 10,344 20.8 19.3 .. 22.9 27.1 97.4 2.7 111 3.4 12.3<br />
94 Jamaica 23.2 8,529 22.0 14.8 –1.0 26.6 29.0 50.4 11.3 141 5.0 7.0<br />
95 Colombia 626.4 12,988 26.7 18.2 2.8 14.7 19.4 52.6 3.6 118 2.7 4.5<br />
96 Dominica 0.8 10,614 12.3 21.3 .. 23.1 16.2 51.6 3.8 104 .. ..<br />
97 Suriname 8.7 15,970 50.1 17.0 34.0 19.5 31.9 53.4 .. 139 6.2 9.7<br />
97 Tunisia 119.1 10,726 19.6 19.7 10.3 21.1 26.7 90.2 4.2 127 3.9 4.7<br />
99 Dominican Republic 140.8 13,375 21.3 11.8 8.8 13.8 27.2 54.8 5.3 122 4.1 5.2<br />
99 Saint Vincent and the Grenadines 1.1 10,379 23.4 16.6 .. .. .. 58.4 4.3 105 3.4 4.8<br />
101 Tonga 0.5 c 4,972 c 33.6 19.2 .. .. .. 29.5 1.5 110 .. ..<br />
102 Libya 83.6 13,321 .. .. .. .. .. 2.7 .. 126 b .. ..<br />
103 Belize 2.9 8,025 19.7 15.0 5.5 22.6 28.7 66.6 5.8 98 3.0 27.9<br />
104 Samoa 1.1 5,574 .. .. .. 0.0 20.3 76.1 2.5 108 .. ..<br />
105 Maldives 4.9 11,892 .. .. .. 13.7 2.8 80.1 2.9 133 3.5 14.2<br />
105 Uzbekistan 176.6 5,643 23.8 15.8 .. .. .. .. 1.4 .. .. ..<br />
MEDIUM HUMAN DEVELOPMENT<br />
107 Moldova (Republic of) 16.9 4,742 24.2 20.4 0.0 18.6 2.7 37.2 6.7 136 4.8 5.7<br />
108 Botswana 33.7 14,876 29.5 17.4 8.7 26.9 23.9 12.4 0.4 133 2.9 3.6<br />
109 Gabon 32.5 18,832 29.3 15.0 –7.3 .. .. 16.9 2.4 110 5.2 21.0<br />
110 Paraguay 57.4 8,644 17.1 12.9 6.0 12.8 11.6 48.7 9.3 125 4.3 11.2<br />
111 Egypt 938.0 10,250 13.7 11.8 7.0 12.5 26.2 95.8 2.0 157 7.5 9.8<br />
111 Turkmenistan 83.4 15,527 47.2 8.9 .. .. .. .. 0.1 .. .. ..<br />
113 Indonesia 2,674.9 10,385 33.2 9.8 5.4 11.4 34.8 46.7 5.4 132 6.7 10.7<br />
114 Palestine, State of 20.9 4,715 23.8 26.6 11.8 5.7 3.5 11.2 .. 111 .. ..<br />
115 Viet Nam 519.8 5,668 24.7 6.3 7.0 .. .. 128.3 3.8 145 .. ..<br />
TABLE<br />
10<br />
TABLE 10 National income and composition of resources | 235
TABLE 10 NATIONAL INCOME AND COMPOSITION OF RESOURCES<br />
Gross domestic<br />
product (GDP)<br />
Total<br />
(2011 PPP<br />
$ billions)<br />
Gross<br />
fixed capital<br />
formation<br />
Per capita<br />
(2011 PPP $) (% of GDP)<br />
General government<br />
final consumption<br />
expenditure<br />
Total<br />
(% of GDP)<br />
Average<br />
annual<br />
growth (%)<br />
Total tax<br />
revenue<br />
(% of GDP)<br />
Debts<br />
Domestic<br />
Taxes on credit<br />
income, provided by<br />
profits and financial<br />
capital gains sector<br />
Total debt<br />
service<br />
Consumer<br />
price index<br />
Prices<br />
(% of total<br />
tax revenue) (% of GDP) (% of GNI) (2010=100) Index<br />
Domestic<br />
food price level<br />
Volatility<br />
index<br />
TABLE<br />
10<br />
HDI rank 2015 2015 2010–2015 a 2010–2015 a 2010–2015 a 2005–2014 a 2005–2014 a 2010–2015 a 2014 2015 2010–2014 a 2010–2014 a<br />
116 Philippines 697.4 6,926 21.7 11.0 9.4 12.9 42.1 59.2 1.8 117 6.8 2.6<br />
117 El Salvador 49.6 8,096 14.0 11.9 4.7 15.4 25.8 77.8 5.2 108 4.3 3.0<br />
118 Bolivia (Plurinational State of) 69.5 6,476 21.0 14.7 6.7 17.0 9.6 66.7 3.2 134 5.9 12.2<br />
119 South Africa 680.9 12,390 20.0 20.3 0.3 26.6 48.4 180.1 2.9 130 3.0 6.2<br />
120 Kyrgyzstan 19.2 3,225 32.8 17.5 –0.5 18.1 19.1 19.0 5.6 146 .. ..<br />
121 Iraq 510.6 14,018 23.5 22.4 .. .. .. 9.3 .. 116 5.1 16.4<br />
122 Cabo Verde 3.3 6,296 46.7 18.5 3.4 18.4 18.2 82.8 2.5 109 5.7 5.4<br />
123 Morocco 257.3 7,361 29.4 19.9 –0.5 23.3 25.4 107.4 4.5 106 5.7 4.9<br />
124 Nicaragua 29.7 4,884 30.3 7.2 4.1 15.1 30.0 48.2 6.5 137 4.5 6.4<br />
125 Guatemala 118.5 7,253 13.2 10.4 –0.1 10.8 29.4 42.8 3.6 122 7.1 5.5<br />
125 Namibia 24.1 9,801 33.4 26.9 9.4 23.1 32.6 56.6 .. 129 3.5 7.2<br />
127 Guyana 5.4 7,064 25.2 17.0 .. .. .. 56.8 2.2 109 .. ..<br />
127 Micronesia (Federated States of) 0.3 c 3,177 c .. .. .. .. .. –26.2 .. .. .. ..<br />
129 Tajikistan 22.2 2,616 14.1 11.7 1.1 .. .. 20.2 3.7 .. .. ..<br />
130 Honduras 38.6 4,785 23.1 15.2 1.6 16.7 21.5 59.7 3.9 129 4.8 4.8<br />
131 India 7,512.5 5,730 30.8 10.9 12.8 10.8 44.8 76.8 4.6 148 4.7 8.4<br />
132 Bhutan 5.9 7,601 56.8 17.7 2.4 9.2 15.9 54.3 4.5 146 5.1 6.4<br />
133 Timor-Leste 2.6 2,126 37.9 67.2 –24.0 .. .. –9.0 .. 143 .. ..<br />
134 Vanuatu 0.7 c 2,891 c 25.9 14.9 –1.1 16.0 .. 72.1 1.0 107 .. ..<br />
135 Congo 27.7 5,993 40.9 18.1 –6.5 7.6 4.6 21.5 2.6 117 6.3 18.8<br />
135 Equatorial Guinea 23.9 28,272 54.6 9.3 –2.8 18.8 35.7 16.9 .. 123 .. ..<br />
137 Kiribati 0.2 1,749 .. .. .. .. .. .. .. .. .. ..<br />
138 Lao People’s Democratic Republic 36.3 5,341 32.9 14.2 .. 14.8 17.6 26.5 3.2 126 8.6 3.6<br />
139 Bangladesh 505.0 3,137 28.9 5.4 8.8 8.7 22.4 59.7 0.9 144 8.0 4.5<br />
139 Ghana 108.4 3,953 23.6 19.0 4.3 14.9 24.7 35.1 2.1 179 5.4 18.3<br />
139 Zambia 58.8 3,626 25.9 2.8 .. 16.1 48.0 29.4 1.6 144 10.1 3.2<br />
142 Sao Tome and Principe 0.6 c 3,030 c .. .. .. 13.9 12.8 26.2 4.1 154 9.1 50.5<br />
143 Cambodia 51.1 3,278 21.2 5.3 4.0 14.6 15.2 53.9 1.0 117 7.8 4.7<br />
144 Nepal 66.0 2,313 23.0 11.1 18.0 15.3 18.7 75.1 1.1 152 9.5 10.2<br />
145 Myanmar .. .. .. .. .. .. 25.2 32.1 0.1 131 8.5 8.1<br />
146 Kenya 133.6 2,901 21.5 14.5 15.4 15.9 40.9 45.2 2.0 150 5.8 6.0<br />
147 Pakistan 896.4 4,745 13.5 11.8 16.0 11.2 27.9 48.8 2.3 145 7.1 13.2<br />
LOW HUMAN DEVELOPMENT<br />
148 Swaziland 10.2 7,930 14.3 16.5 –5.8 .. .. 16.8 0.7 135 .. ..<br />
149 Syrian Arab Republic .. .. .. .. .. 14.2 30.2 .. 1.7 d 143 e .. ..<br />
150 Angola 173.6 6,937 10.3 17.9 .. 18.8 31.9 31.0 6.4 161 7.2 13.7<br />
151 Tanzania (United Republic of) 130.3 2,510 31.3 14.3 10.0 11.7 21.9 22.8 0.5 158 11.5 4.8<br />
152 Nigeria 1,027.4 5,639 15.1 7.4 5.6 1.6 28.3 21.8 0.1 159 6.3 4.0<br />
153 Cameroon 68.6 2,939 21.0 11.4 54.8 .. .. 14.8 1.4 113 7.8 10.0<br />
154 Papua New Guinea 20.3 c 2,723 c .. .. .. .. .. 51.0 7.1 128 .. ..<br />
154 Zimbabwe 26.3 1,688 13.2 25.1 4.5 .. .. .. 25.3 106 .. ..<br />
156 Solomon Islands 1.2 2,058 .. .. .. .. .. 24.3 1.6 125 .. ..<br />
157 Mauritania 14.7 c 3,694 c 42.9 21.3 2.3 .. .. 29.6 4.3 120 10.1 3.1<br />
158 Madagascar 33.3 1,373 14.8 13.1 3.5 10.1 21.2 18.0 0.9 140 7.1 3.5<br />
159 Rwanda 19.2 1,655 25.7 12.3 –14.7 13.4 25.7 .. 0.7 122 8.6 10.5<br />
160 Comoros 1.0 c 1,364 c 20.4 16.7 1.4 .. .. 29.2 0.1 98 .. ..<br />
160 Lesotho 5.3 c 2,517 c 35.2 35.1 –0.9 58.7 17.4 0.7 1.6 127 4.4 6.4<br />
162 Senegal 34.6 2,288 27.0 15.4 4.6 19.2 23.1 36.0 2.3 105 8.4 8.7<br />
163 Haiti 17.8 1,658 .. .. .. .. .. 31.6 0.3 139 9.7 3.4<br />
163 Uganda 67.1 1,718 24.9 9.6 17.6 11.0 30.6 17.9 0.4 157 5.2 21.8<br />
165 Sudan 158.0 3,927 17.9 7.0 4.1 .. .. 20.9 0.4 349 .. ..<br />
166 Togo 10.0 1,374 21.3 14.6 3.6 20.0 11.1 42.0 1.5 110 6.8 15.5<br />
167 Benin 21.6 1,986 26.0 15.1 4.6 15.5 16.7 19.6 1.1 110 8.1 21.8<br />
168 Yemen 93.5 b 3,663 b .. .. .. .. .. 33.9 0.8 b 158 c 7.6 11.0<br />
169 Afghanistan 59.2 1,820 21.2 13.6 .. 7.5 3.7 0.4 0.2 131 .. ..<br />
170 Malawi 19.2 1,113 12.8 13.6 11.7 .. .. 15.1 1.1 251 7.6 23.6<br />
171 Côte d’Ivoire 74.7 3,290 16.1 14.9 –20.9 14.4 22.1 31.5 5.1 111 6.7 8.8<br />
172 Djibouti 2.7 c 3,120 c .. .. .. .. .. 33.2 2.3 f 115 c .. ..<br />
173 Gambia 3.0 c 1,556 c 21.2 9.3 0.7 .. .. 53.7 5.3 122 c 7.3 2.7<br />
236 | HUMAN DEVELOPMENT REPORT <strong>2016</strong>
HUMAN DEVELOPMENT REPORT <strong>2016</strong><br />
<strong>Human</strong> <strong>Development</strong> for Everyone<br />
Debts<br />
Prices<br />
Gross domestic<br />
product (GDP)<br />
Gross<br />
fixed capital<br />
formation<br />
General government<br />
final consumption<br />
expenditure<br />
Total tax<br />
revenue<br />
Domestic<br />
Taxes on credit<br />
income, provided by<br />
profits and financial<br />
capital gains sector<br />
Total debt<br />
service<br />
Consumer<br />
price index<br />
Domestic<br />
food price level<br />
Total<br />
(2011 PPP<br />
$ billions)<br />
Per capita<br />
(2011 PPP $) (% of GDP)<br />
Total<br />
(% of GDP)<br />
Average<br />
annual<br />
growth (%)<br />
(% of GDP)<br />
(% of total<br />
tax revenue) (% of GDP) (% of GNI) (2010=100) Index<br />
Volatility<br />
index<br />
HDI rank 2015 2015 2010–2015 a 2010–2015 a 2010–2015 a 2005–2014 a 2005–2014 a 2010–2015 a 2014 2015 2010–2014 a 2010–2014 a<br />
174 Ethiopia 152.1 1,530 39.3 9.0 5.5 9.2 16.0 .. 1.4 209 6.3 9.0<br />
175 Mali 40.2 2,285 16.7 16.2 12.4 13.0 21.9 21.9 0.6 110 7.7 9.4<br />
176 Congo (Democratic Republic of the) 56.9 737 16.1 15.0 2.6 8.8 11.9 9.7 1.4 129 b .. ..<br />
177 Liberia 3.5 787 20.0 16.7 5.2 .. .. 36.2 1.0 137 c .. ..<br />
178 Guinea-Bissau 2.5 1,367 6.4 8.5 .. .. .. 19.9 0.2 108 .. ..<br />
179 Eritrea 6.8 g 1,411 g 10.0 21.1 –9.5 .. .. 104.0 0.9 g .. .. ..<br />
179 Sierra Leone 9.7 1,497 13.3 11.1 3.6 .. .. 17.2 0.7 168 6.8 3.3<br />
181 Mozambique 31.2 1,116 38.1 25.8 6.3 20.4 29.5 43.5 1.1 125 8.6 6.7<br />
181 South Sudan 21.5 1,741 11.2 35.8 0.4 .. .. 39.5 .. 331 .. ..<br />
183 Guinea 14.3 1,135 13.2 8.6 2.5 .. .. 34.3 1.2 186 9.9 7.3<br />
184 Burundi 7.7 693 21.7 21.9 –0.4 .. .. 28.5 0.9 154 7.0 8.3<br />
185 Burkina Faso 28.3 1,562 31.2 20.7 0.3 15.2 19.9 29.3 0.8 108 8.4 11.8<br />
186 Chad 28.7 2,044 28.0 5.2 –55.3 .. .. 17.8 0.9 116 8.0 11.7<br />
187 Niger 17.9 897 38.8 16.7 15.4 .. .. 16.3 0.7 106 7.2 9.4<br />
188 Central African Republic 2.8 562 11.4 13.8 .. 9.4 6.9 34.8 0.9 187 .. ..<br />
OTHER COUNTRIES OR TERRITORIES<br />
Korea (Democratic People’s Rep. of) .. .. .. .. .. .. .. .. .. .. .. ..<br />
Marshall Islands 0.2 c 3,628 c .. .. .. .. .. .. .. .. .. ..<br />
Monaco .. .. .. .. .. .. .. .. .. .. .. ..<br />
Nauru .. .. .. .. .. .. .. .. .. .. .. ..<br />
San Marino .. .. .. .. .. 22.3 15.5 .. .. 108 .. ..<br />
Somalia .. .. 8.0 6.9 .. .. .. .. 0.0 .. .. ..<br />
Tuvalu 0.0 c 3,592 c .. .. .. .. .. .. .. .. .. ..<br />
<strong>Human</strong> development groups<br />
Very high human development 52,478.7 39,989 20.7 17.7 1.3 14.9 36.5 200.0 .. — — —<br />
High human development 33,383.7 14,079 35.5 14.5 2.8 12.2 26.3 154.6 1.9 — — —<br />
Medium human development 16,333.5 6,361 27.0 11.8 9.1 12.7 38.5 73.1 3.8 — — —<br />
Low human development 2,516.9 2,775 18.7 11.1 5.5 .. .. 23.8 1.5 — — —<br />
Developing countries 55,360.8 9,376 32.2 14.2 4.5 12.0 29.3 125.3 2.3 — — —<br />
Regions<br />
Arab States 5,863.9 16,377 24.7 19.1 6.8 .. .. 64.9 2.2 — — —<br />
East Asia and the Pacific 24,233.9 12,386 41.7 13.3 .. .. .. 179.4 1.1 — — —<br />
Europe and Central Asia 3,128.1 13,226 21.5 14.9 4.5 20.0 15.6 76.5 8.3 — — —<br />
Latin America and the Caribbean 8,221.0 14,041 20.4 16.5 2.2 .. .. 73.8 3.4 — — —<br />
South Asia 10,571.4 5,806 28.3 10.6 11.4 10.3 38.2 71.8 3.4 — — —<br />
Sub-Saharan Africa 3,317.0 3,493 20.1 13.7 4.6 13.0 38.4 60.7 2.1 — — —<br />
Least developed countries 2,041.5 2,306 24.5 11.3 5.7 12.5 25.6 35.5 1.5 — — —<br />
Small island developing states 557.4 10,032 .. .. .. .. .. 57.5 7.2 — — —<br />
Organisation for Economic<br />
Co‐operation and <strong>Development</strong> 48,239.7 37,660 20.6 17.5 1.2 15.1 37.5 206.6 .. — — —<br />
World 104,713.0 14,600 24.8 16.4 2.3 14.0 34.7 176.4 2.4 — — —<br />
TABLE<br />
10<br />
NOTES<br />
a Data refer to the most recent year available<br />
during the period specified.<br />
b Refers to 2013.<br />
c Refers to 2014.<br />
d Refers to 2007.<br />
e Refers to 2012.<br />
f Refers to 2005.<br />
g Refers to 2011.<br />
DEFINITIONS<br />
Gross domestic product (GDP): Sum of gross<br />
value added by all resident producers in the<br />
economy plus any product taxes and minus any<br />
subsidies not included in the value of the products,<br />
expressed in 2011 international dollars using<br />
purchasing power parity (PPP) rates.<br />
GDP per capita: GDP in a particular period divided<br />
by the total population in the same period.<br />
Gross fixed capital formation: Value of<br />
acquisitions of new or existing fixed assets by<br />
the business sector, governments and households<br />
(excluding their unincorporated enterprises) less<br />
disposals of fixed assets, expressed as a percentage<br />
of GDP. No adjustment is made for depreciation of<br />
fixed assets.<br />
General government final consumption<br />
expenditure: All government current expenditures<br />
for purchases of goods and services (including<br />
compensation of employees and most expenditures<br />
on national defence and security but excluding<br />
government military expenditures that are part<br />
of government capital formation), expressed as a<br />
percentage of GDP.<br />
Total tax revenue: Compulsory transfers to the<br />
central government for public purposes, expressed<br />
as a percentage of GDP.<br />
Taxes on income, profits and capital gains:<br />
Taxes levied on the actual or presumptive net income<br />
of individuals, on the profits of corporations and<br />
enterprises and on capital gains, whether realized or<br />
not, on land, securities and other assets.<br />
Domestic credit provided by financial sector:<br />
Credit to various sectors on a gross basis (except<br />
credit to the central government, which is net),<br />
expressed as a percentage of GDP.<br />
Total debt service: Sum of principal repayments<br />
and interest actually paid in foreign currency, goods<br />
or services on long-term debt; interest paid on shortterm<br />
debt; and repayments (repurchases and charges)<br />
to the International Monetary Fund, expressed as a<br />
percentage of gross national income (GNI).<br />
Consumer price index: Index that reflects changes<br />
in the cost to the average consumer of acquiring a<br />
basket of goods and services that may be fixed or<br />
changed at specified intervals, such as yearly.<br />
Domestic food price level index: Food PPP rate<br />
divided by the general PPP rate. The index shows the<br />
price of food in a country relative to the price of the<br />
generic consumption basket in the country.<br />
Domestic food price level volatility index:<br />
Measure of variation of the domestic food price<br />
level index, computed as the standard deviation<br />
of the deviations from the trend over the previous<br />
eight months.<br />
MAIN DATA SOURCES<br />
Columns 1–10: World Bank (<strong>2016</strong>a).<br />
Columns 11 and 12: FAO (<strong>2016</strong>a).<br />
TABLE 10 National income and composition of resources | 237
TABLE<br />
11<br />
Work and employment<br />
Employment<br />
Unemployment<br />
Employment Labour force<br />
to population participation Employment<br />
ratio a rate a in agriculture Employment<br />
in services Total Youth<br />
(% ages 15 and older) (% of total employment)<br />
(% of labour<br />
force) (% ages 15–24)<br />
Youth not in<br />
school or Vulnerable<br />
employment employment<br />
(% of total<br />
employment)<br />
Work that is a risk to<br />
human development<br />
Child<br />
labour<br />
(% ages<br />
5–14)<br />
Working<br />
poor at<br />
PPP$3.10<br />
a day<br />
(% of total<br />
employment)<br />
Employment-related<br />
social security<br />
Mandatory<br />
paid<br />
maternity<br />
leave<br />
(days)<br />
Old-age<br />
pension<br />
recipients<br />
(% of statutory<br />
pension age<br />
population)<br />
TABLE<br />
11<br />
HDI rank 2015 2015 2010–2014 b 2010–2014 b 2015 2015 2010–2014 b 2005–2014 b 2009–2015 b 2004–2013 b 2015 2004–2013 b,c<br />
VERY HIGH HUMAN DEVELOPMENT<br />
1 Norway 62.2 64.9 2.1 77.0 4.1 10.1 5.5 5.3 .. .. .. 100.0<br />
2 Australia 60.7 64.7 2.6 69.5 6.3 13.5 9.8 .. .. .. .. 83.0<br />
2 Switzerland 65.7 68.7 3.2 73.9 4.3 7.0 7.3 9.1 .. .. 98 100.0<br />
4 Germany 57.6 60.3 1.3 70.4 4.6 7.1 6.4 6.3 .. .. 98 100.0<br />
5 Denmark 58.1 62.0 2.3 78.0 6.3 10.8 5.8 5.4 .. .. 126 100.0<br />
5 Singapore 65.0 67.2 .. 70.6 3.3 7.3 18.9 8.7 .. .. 105 0.0<br />
7 Netherlands 59.9 63.8 2.0 75.3 6.1 8.8 5.0 12.8 .. .. 112 100.0<br />
8 Ireland 54.3 60.0 6.1 75.2 9.5 20.9 15.2 12.7 .. .. 182 90.5<br />
9 Iceland 70.8 74.1 4.2 77.1 4.4 8.7 5.8 8.5 .. .. 90 100.0<br />
10 Canada 61.0 65.6 2.1 78.2 6.9 13.2 13.3 .. .. .. 105 97.7<br />
10 United States 58.8 62.1 1.6 81.2 5.3 11.8 16.5 d .. .. .. .. 92.5<br />
12 Hong Kong, China (SAR) 58.3 60.3 .. 79.9 3.3 9.5 6.6 6.9 .. .. 70 72.9<br />
13 New Zealand 63.6 67.6 6.4 73.0 5.9 14.4 11.9 .. .. .. 112 98.0<br />
14 Sweden 59.8 64.5 1.7 79.0 7.4 20.8 7.2 6.7 .. .. .. 100.0<br />
15 Liechtenstein .. .. .. .. .. .. .. .. .. .. .. ..<br />
16 United Kingdom 59.3 62.7 1.1 79.1 5.5 15.1 11.9 12.7 .. .. 14 99.5<br />
17 Japan 57.3 59.3 3.7 69.1 3.3 5.3 3.9 .. .. .. 98 80.3<br />
18 Korea (Republic of) 58.6 60.8 6.1 69.5 3.7 10.4 18.8 e .. .. .. 90 77.6<br />
19 Israel 60.8 64.0 1.1 79.7 5.0 8.1 15.7 .. .. .. 98 73.6<br />
20 Luxembourg 55.7 59.1 1.3 85.7 5.9 18.6 6.3 6.3 .. .. 112 90.0<br />
21 France 49.4 55.2 2.8 75.8 10.6 24.7 10.7 7.2 .. .. 112 100.0<br />
22 Belgium 48.9 53.6 1.1 77.4 8.7 21.8 12.1 10.5 .. .. 105 84.6<br />
23 Finland 52.9 58.5 3.9 73.7 9.6 23.3 10.2 9.8 .. .. 147 100.0<br />
24 Austria 56.8 60.2 4.3 69.7 5.7 10.2 7.7 8.6 .. .. 112 100.0<br />
25 Slovenia 52.1 57.5 7.7 60.2 9.3 16.7 9.4 15.1 .. .. 105 95.1<br />
26 Italy 42.5 48.4 3.5 69.5 12.1 42.1 22.0 18.1 .. .. 150 81.1<br />
27 Spain 45.3 58.4 4.2 76.3 22.4 49.4 17.1 12.5 .. .. 112 68.2<br />
28 Czech Republic 56.4 59.4 2.7 58.9 5.2 13.0 8.1 14.5 .. .. 196 100.0<br />
29 Greece 38.8 51.7 13.0 71.8 24.9 49.2 19.1 29.6 .. .. 119 77.4<br />
30 Brunei Darussalam 62.3 63.5 0.6 80.8 1.9 5.7 .. .. .. .. 91 81.7<br />
30 Estonia 58.2 61.9 3.9 65.5 5.9 11.3 11.7 5.7 .. .. 140 98.0<br />
32 Andorra .. .. .. .. .. .. .. .. .. .. .. ..<br />
33 Cyprus 53.9 63.9 3.9 79.6 15.6 32.3 17.0 14.2 .. .. 126 85.2<br />
33 Malta 49.5 52.3 1.2 77.1 5.4 12.3 11.4 9.4 .. .. 126 60.5<br />
33 Qatar 84.4 84.6 1.4 46.8 0.2 0.8 .. 0.2 .. .. 50 7.9<br />
36 Poland 52.7 56.9 11.2 57.9 7.4 19.9 12.0 17.2 .. .. 182 96.5<br />
37 Lithuania 53.5 59.1 9.0 65.8 9.5 17.6 9.9 9.8 .. .. 126 100.0<br />
38 Chile 58.4 62.4 9.2 67.1 6.4 16.4 11.8 .. 7.0 f 4.9 126 74.5<br />
38 Saudi Arabia 51.6 54.8 4.9 70.9 5.8 31.0 18.4 .. .. .. 70 ..<br />
40 Slovakia 52.8 59.5 3.5 60.9 11.3 25.2 12.8 12.2 .. .. 238 100.0<br />
41 Portugal 51.4 58.5 5.5 69.5 12.1 30.1 12.3 14.5 3.0 f,g .. .. 100.0<br />
42 United Arab Emirates 77.1 80.1 .. .. 3.7 11.1 .. 1.0 .. .. 45 ..<br />
43 Hungary 50.2 54.0 4.6 64.5 7.0 18.2 13.6 5.8 .. .. 168 91.4<br />
44 Latvia 54.4 60.4 7.3 68.6 9.8 14.8 12.0 7.6 .. .. 112 100.0<br />
45 Argentina 56.9 61.0 0.5 74.7 6.7 19.1 18.6 20.5 4.0 5.1 90 90.7<br />
45 Croatia 43.9 52.3 8.7 63.9 16.1 43.8 19.3 10.4 .. .. 208 57.6<br />
47 Bahrain 68.3 69.2 1.1 62.4 1.2 5.4 .. 2.0 5.0 g .. 60 40.1<br />
48 Montenegro 40.0 48.9 5.7 73.0 18.2 37.5 .. .. 13.0 f 1.8 45 52.3<br />
49 Russian Federation 59.8 63.5 6.7 65.8 5.8 15.0 12.0 6.0 .. 3.9 140 100.0<br />
50 Romania 52.0 55.9 25.4 44.5 6.9 23.1 17.0 30.9 1.0 g .. 126 98.0<br />
51 Kuwait 66.7 69.2 1.2 58.6 3.5 17.3 .. 2.2 .. .. 70 27.3<br />
HIGH HUMAN DEVELOPMENT<br />
52 Belarus 57.0 60.8 9.6 57.2 6.1 12.9 .. 2.1 1.0 3.1 126 93.6<br />
52 Oman 64.8 69.1 5.2 57.9 6.3 19.3 .. .. .. .. 50 24.7<br />
54 Barbados 58.2 66.3 2.7 78.4 12.3 30.4 .. .. 2.0 .. 84 68.3<br />
54 Uruguay 60.6 65.3 9.3 69.1 7.3 20.3 20.5 h 22.5 8.0 f,g 5.3 98 76.5<br />
56 Bulgaria 48.9 54.2 6.9 62.8 9.8 22.2 20.2 8.7 .. .. 410 96.9<br />
56 Kazakhstan 67.2 71.2 24.2 56.0 5.6 5.1 .. 28.6 2.0 g 3.4 126 95.9<br />
58 Bahamas 63.5 74.1 3.7 83.0 14.4 28.4 .. .. .. .. 91 84.2<br />
238 | HUMAN DEVELOPMENT REPORT <strong>2016</strong>
HUMAN DEVELOPMENT REPORT <strong>2016</strong><br />
<strong>Human</strong> <strong>Development</strong> for Everyone<br />
Employment<br />
Unemployment<br />
Employment Labour force<br />
to population participation Employment<br />
ratio a rate a in agriculture Employment<br />
in services Total Youth<br />
(% ages 15 and older) (% of total employment)<br />
(% of labour<br />
force) (% ages 15–24)<br />
Youth not in<br />
school or Vulnerable<br />
employment employment<br />
(% of total<br />
employment)<br />
Work that is a risk to<br />
human development<br />
Child<br />
labour<br />
(% ages<br />
5–14)<br />
Working<br />
poor at<br />
PPP$3.10<br />
a day<br />
(% of total<br />
employment)<br />
Employment-related<br />
social security<br />
Mandatory<br />
paid<br />
maternity<br />
leave<br />
(days)<br />
Old-age<br />
pension<br />
recipients<br />
(% of statutory<br />
pension age<br />
population)<br />
HDI rank 2015 2015 2010–2014 b 2010–2014 b 2015 2015 2010–2014 b 2005–2014 b 2009–2015 b 2004–2013 b 2015 2004–2013 b,c<br />
59 Malaysia 61.5 63.3 12.2 60.3 2.9 10.4 1.2 21.1 .. 6.9 60 19.8<br />
60 Palau .. .. .. .. .. .. .. .. .. .. .. 48.0<br />
60 Panama 62.0 65.4 16.7 65.0 5.2 13.7 17.6 29.9 6.0 f 10.4 98 37.3<br />
62 Antigua and Barbuda .. .. .. .. .. .. .. .. .. .. 91 69.7<br />
63 Seychelles .. .. 3.6 78.2 .. .. 20.0 10.4 .. .. 98 100.0<br />
64 Mauritius 55.8 60.5 8.0 63.5 7.9 17.5 .. 17.1 .. 6.1 84 100.0<br />
65 Trinidad and Tobago 60.5 62.9 .. .. 3.8 9.6 52.5 15.6 1.0 g .. 98 98.7<br />
66 Costa Rica 56.3 61.6 12.7 68.2 8.6 21.1 17.8 20.7 4.0 1.7 120 55.8<br />
66 Serbia 41.7 51.5 21.3 52.9 19.0 45.2 19.5 28.6 10.0 f 0.4 135 46.1<br />
68 Cuba 53.9 55.6 18.6 64.2 3.0 6.5 .. .. .. 5.6 .. ..<br />
69 Iran (Islamic Republic of) 39.9 44.5 17.9 48.3 10.5 24.1 34.3 40.5 11.0 f 3.7 270 26.4<br />
70 Georgia 58.9 67.1 .. .. 12.3 29.8 .. 59.8 18.0 g 15.2 183 89.8<br />
71 Turkey 45.1 50.3 19.7 51.9 10.3 16.4 24.8 29.4 6.0 f 4.0 112 88.1<br />
71 Venezuela (Bolivarian Republic of) 59.5 64.7 7.4 71.1 8.0 16.7 19.2 30.3 8.0 g 9.2 182 59.4<br />
73 Sri Lanka 49.3 51.8 30.4 43.4 4.7 20.2 0.5 i 43.1 3.0 f 12.2 84 17.1<br />
74 Saint Kitts and Nevis .. .. .. .. .. .. .. .. .. .. 91 44.7<br />
75 Albania 41.6 50.3 .. .. 17.3 32.7 30.5 58.1 5.0 f 2.0 365 77.0<br />
76 Lebanon 43.7 47.0 .. .. 7.1 21.6 .. 27.8 2.0 .. 70 0.0<br />
77 Mexico 59.5 62.2 13.4 62.4 4.3 8.8 20.0 .. 4.0 9.0 84 25.2<br />
78 Azerbaijan 61.9 65.0 36.8 48.9 4.7 14.3 .. 56.4 7.0 f,g 1.7 126 81.7<br />
79 Brazil 62.3 67.1 14.5 76.6 7.2 16.8 19.6 23.1 8.0 f 5.1 120 86.3<br />
79 Grenada .. .. .. .. .. .. .. .. .. .. 90 34.0<br />
81 Bosnia and Herzegovina 32.2 46.1 .. .. 30.3 66.9 .. 25.3 5.0 g 1.5 365 29.6<br />
82 The former Yugoslav Republic of Macedonia 40.9 55.9 18.0 51.4 26.9 49.4 25.1 22.8 13.0 3.0 270 52.2<br />
83 Algeria 39.1 43.7 10.8 58.4 10.5 28.6 22.8 26.9 5.0 .. 98 63.6<br />
84 Armenia 53.0 63.3 36.3 46.7 16.3 37.2 40.9 42.4 4.0 13.6 140 80.0<br />
84 Ukraine 53.2 59.1 14.8 59.1 9.9 23.1 20.0 18.1 2.0 1.9 126 95.0<br />
86 Jordan 34.8 40.0 1.8 79.6 12.8 33.4 24.6 9.7 2.0 f,g 12.7 70 42.2<br />
87 Peru 71.5 74.1 .. 75.9 3.5 9.3 15.3 h 46.3 34.0 f,g 12.1 90 33.2<br />
87 Thailand 70.6 71.4 41.9 37.5 1.1 4.7 13.8 55.9 8.0 g 1.5 90 81.7<br />
89 Ecuador 61.4 64.2 25.3 54.3 4.3 10.9 3.8 39.0 3.0 f 11.2 84 53.0<br />
90 China 67.6 70.9 2.5 47.0 4.6 12.1 .. .. .. 14.8 128 74.4<br />
91 Fiji 50.2 54.3 .. .. 7.7 18.2 .. 38.8 .. 13.2 84 10.6<br />
92 Mongolia 58.1 62.5 35.0 46.8 7.1 14.7 1.5 51.4 15.0 f 6.8 120 100.0<br />
92 Saint Lucia 55.6 69.6 .. .. 20.1 47.2 .. .. 4.0 .. 91 26.5<br />
94 Jamaica 56.0 64.8 18.2 66.5 13.7 32.7 28.8 37.5 3.0 7.8 56 55.5<br />
95 Colombia 61.7 68.6 16.3 64.1 10.0 20.5 22.0 j 47.9 10.0 f 9.2 98 23.0<br />
96 Dominica .. .. .. .. .. .. .. .. .. .. 84 38.5<br />
97 Suriname 50.2 54.5 3.2 72.9 7.8 18.6 .. 12.9 4.0 .. 0 ..<br />
97 Tunisia 40.6 47.7 14.8 51.5 14.8 34.5 25.4 21.6 2.0 4.6 30 68.8<br />
99 Dominican Republic 55.9 65.3 14.5 41.9 14.4 29.8 21.3 41.7 13.0 f 7.8 84 11.1<br />
99 Saint Vincent and the Grenadines 53.5 66.8 .. .. 20.0 39.6 .. 8.0 .. .. 91 76.6<br />
101 Tonga 60.0 63.2 .. .. 5.2 11.7 .. .. .. .. 0 1.0<br />
102 Libya 42.2 53.2 .. .. 20.6 50.0 .. .. .. .. 98 43.3<br />
103 Belize 61.6 69.8 .. .. 11.8 22.0 27.9 23.5 3.0 f .. 98 64.6<br />
104 Samoa 38.7 41.1 5.4 79.9 5.8 14.1 38.2 30.9 .. .. 28 49.5<br />
105 Maldives 59.9 68.0 14.6 67.0 11.8 27.9 56.4 k 18.8 .. 13.0 60 99.7<br />
105 Uzbekistan 55.6 61.8 .. .. 10.1 19.8 .. .. .. .. 126 98.1<br />
MEDIUM HUMAN DEVELOPMENT<br />
107 Moldova (Republic of) 39.9 42.0 28.8 53.5 5.0 15.6 28.6 32.0 16.0 1.2 126 72.8<br />
108 Botswana 63.0 77.4 26.4 56.1 18.6 29.4 .. 12.9 9.0 f,g 26.3 84 100.0<br />
109 Gabon 38.8 48.8 .. .. 20.5 36.3 .. 31.3 13.0 17.7 98 38.8<br />
110 Paraguay 68.0 71.5 22.8 58.2 4.9 12.3 12.3 i 38.1 28.0 f 6.0 63 22.2<br />
111 Egypt 43.5 49.4 28.0 47.9 12.1 35.5 27.9 26.4 7.0 f 48.2 90 32.7<br />
111 Turkmenistan 55.8 62.0 .. .. 10.0 19.5 .. .. .. .. .. ..<br />
113 Indonesia 63.4 67.4 34.3 44.8 5.8 19.3 24.1 33.0 7.0 38.7 90 8.1<br />
114 Palestine, State of 32.4 43.7 10.5 61.1 25.9 39.8 31.0 25.6 6.0 2.6 70 8.0<br />
115 Viet Nam 76.7 78.3 46.8 32.0 2.1 5.3 9.3 62.6 16.0 f 14.6 180 34.5<br />
116 Philippines 60.4 64.7 30.4 53.6 6.7 15.7 24.8 38.4 11.0 f 32.0 60 28.5<br />
117 El Salvador 58.7 62.8 19.6 60.1 6.4 13.0 5.7 d 37.6 19.0 f 9.4 84 18.1<br />
TABLE<br />
11<br />
TABLE 11 Work and employment | 239
TABLE 11 WORK AND EMPLOYMENT<br />
TABLE<br />
11<br />
Employment<br />
Unemployment<br />
Employment Labour force<br />
to population participation Employment<br />
ratio a rate a in agriculture Employment<br />
in services Total Youth<br />
(% ages 15 and older) (% of total employment)<br />
(% of labour<br />
force) (% ages 15–24)<br />
Youth not in<br />
school or Vulnerable<br />
employment employment<br />
(% of total<br />
employment)<br />
Work that is a risk to<br />
human development<br />
Child<br />
labour<br />
(% ages<br />
5–14)<br />
Working<br />
poor at<br />
PPP$3.10<br />
a day<br />
(% of total<br />
employment)<br />
Employment-related<br />
social security<br />
Mandatory<br />
paid<br />
maternity<br />
leave<br />
(days)<br />
Old-age<br />
pension<br />
recipients<br />
(% of statutory<br />
pension age<br />
population)<br />
HDI rank 2015 2015 2010–2014 b 2010–2014 b 2015 2015 2010–2014 b 2005–2014 b 2009–2015 b 2004–2013 b 2015 2004–2013 b,c<br />
118 Bolivia (Plurinational State of) 70.5 73.1 .. .. 3.6 7.1 .. 54.3 26.0 f,g 12.7 90 100.0<br />
119 South Africa 39.7 53.0 4.6 71.9 25.1 50.0 31.3 9.3 .. 16.6 120 92.6<br />
120 Kyrgyzstan 57.7 62.9 31.7 48.1 8.2 14.6 21.2 41.6 26.0 f 15.4 126 100.0<br />
121 Iraq 35.3 42.4 .. .. 16.9 35.1 .. .. 5.0 29.7 72 56.0<br />
122 Cabo Verde 60.9 68.3 .. .. 10.8 17.5 .. .. 6.0 f 48.7 60 55.7<br />
123 Morocco 44.5 49.2 39.2 39.4 9.6 19.3 .. 50.7 8.0 g 13.1 98 39.8<br />
124 Nicaragua 60.4 64.2 32.2 51.3 6.0 9.7 .. 47.1 15.0 g 20.2 84 23.7<br />
125 Guatemala 59.8 61.5 32.7 50.2 2.7 6.2 29.8 44.5 26.0 f 14.4 84 14.1<br />
125 Namibia 44.2 59.3 31.4 54.2 25.5 49.6 32.0 7.8 .. 31.2 84 98.4<br />
127 Guyana 52.9 59.5 .. .. 11.2 25.1 .. .. 18.0 f .. 91 100.0<br />
127 Micronesia (Federated States of) .. .. .. .. .. .. .. .. .. .. .. ..<br />
129 Tajikistan 61.0 68.5 .. .. 10.9 16.8 .. 47.1 10.0 g 21.6 140 80.2<br />
130 Honduras 63.1 65.6 35.8 45.4 3.9 7.1 41.4 l 53.3 15.0 f 28.2 84 8.4<br />
131 India 51.9 53.7 49.7 28.7 3.5 9.7 27.2 80.8 12.0 g 52.9 84 24.1<br />
132 Bhutan 64.7 66.4 56.3 32.7 2.6 9.2 .. 53.1 3.0 10.9 56 3.2<br />
133 Timor-Leste 39.3 41.3 50.6 39.8 5.0 15.7 .. 69.6 4.0 g 77.7 84 100.0<br />
134 Vanuatu 68.0 71.0 .. .. 4.3 8.8 .. 70.0 15.0 f .. 84 3.5<br />
135 Congo 64.8 69.8 .. .. 7.2 12.2 .. 75.1 23.0 f 46.3 105 22.1<br />
135 Equatorial Guinea 74.3 82.0 .. .. 9.4 15.3 .. .. 28.0 g 20.4 84 ..<br />
137 Kiribati .. .. 22.1 61.8 .. .. .. 53.3 .. .. 84 ..<br />
138 Lao People’s Democratic Republic 76.1 77.4 71.3 20.2 1.6 4.0 .. 83.9 10.0 f 84.1 105 5.6<br />
139 Bangladesh 59.4 62.2 47.5 35.3 4.4 11.6 40.3 57.8 4.0 f 86.1 112 39.5<br />
139 Ghana 72.1 77.0 44.7 40.9 6.3 12.2 .. 76.8 22.0 f 44.1 84 7.6<br />
139 Zambia 67.3 75.3 52.2 38.3 10.7 19.7 28.3 e 79.0 41.0 f,g 78.4 84 7.7<br />
142 Sao Tome and Principe 52.1 60.5 26.1 46.9 14.0 21.8 .. .. 26.0 f .. 90 41.8<br />
143 Cambodia 80.5 80.9 54.1 29.6 0.5 0.8 7.8 64.1 19.0 f 71.8 90 5.0<br />
144 Nepal 80.5 83.0 66.5 22.4 3.1 5.1 9.2 .. 37.0 f 43.9 52 62.5<br />
145 Myanmar 74.3 78.0 .. .. 4.7 12.1 .. .. .. 82.6 98 ..<br />
146 Kenya 60.9 67.1 .. .. 9.2 17.6 .. .. 26.0 g .. 90 7.9<br />
147 Pakistan 51.0 53.9 43.5 34.0 5.4 10.7 .. 63.1 .. 37.1 84 2.3<br />
LOW HUMAN DEVELOPMENT<br />
148 Swaziland 38.6 51.8 .. .. 25.6 53.0 .. .. 7.0 22.9 14 86.0<br />
149 Syrian Arab Republic 36.5 41.7 13.2 55.3 12.3 28.5 .. 32.9 4.0 g 34.8 120 16.7<br />
150 Angola 63.2 68.4 .. .. 7.6 12.0 .. .. 24.0 g 49.9 90 14.5<br />
151 Tanzania (United Republic of) 76.0 78.6 66.9 26.6 3.2 6.3 31.8 74.0 29.0 f 72.6 84 3.2<br />
152 Nigeria 53.1 56.3 .. .. 5.8 8.6 .. .. 25.0 72.3 84 ..<br />
153 Cameroon 72.5 76.0 .. .. 4.6 7.0 10.8 73.6 47.0 f 48.1 98 12.5<br />
154 Papua New Guinea 68.1 70.3 .. .. 3.1 6.7 .. .. .. 66.5 0 0.9<br />
154 Zimbabwe 74.7 82.4 65.8 25.0 9.3 15.4 .. 65.5 .. 82.9 98 6.2<br />
156 Solomon Islands 43.9 67.4 .. .. 34.8 51.5 .. .. .. 52.6 84 13.1<br />
157 Mauritania 32.5 47.2 .. .. 31.1 47.3 .. .. 15.0 17.6 98 9.3 m<br />
158 Madagascar 84.6 86.4 75.3 16.9 2.2 3.6 5.0 86.0 23.0 f 90.0 98 4.6<br />
159 Rwanda 82.9 84.9 75.3 16.2 2.4 3.0 .. 77.7 29.0 82.1 84 4.7<br />
160 Comoros 46.2 57.4 .. .. 19.6 37.7 .. .. 22.0 25.3 98 ..<br />
160 Lesotho 48.1 66.4 .. .. 27.5 37.6 .. 17.4 23.0 g 64.6 84 100.0<br />
162 Senegal 51.7 57.1 46.1 22.4 9.3 13.1 .. 58.0 15.0 63.8 98 23.5<br />
163 Haiti 61.7 66.3 .. .. 6.9 17.4 .. .. 24.0 60.5 42 1.0 n<br />
163 Uganda 81.9 85.0 71.9 20.2 3.6 6.0 5.9 h 78.9 16.0 f 60.6 84 6.6<br />
165 Sudan 41.6 48.1 44.6 40.1 13.6 22.5 .. .. 25.0 f 27.6 56 4.6<br />
166 Togo 74.6 80.9 .. .. 7.7 12.2 9.0 89.1 28.0 f 65.7 98 10.9<br />
167 Benin 70.9 71.7 45.1 44.0 1.1 2.3 20.0 87.7 15.0 65.7 98 9.7<br />
168 Yemen 41.7 49.6 24.7 56.2 15.9 30.1 48.1 29.6 23.0 g 50.5 70 8.5<br />
169 Afghanistan 47.5 52.5 .. .. 9.6 19.9 .. .. 29.0 f 89.8 90 10.7<br />
170 Malawi 75.5 81.0 64.1 28.5 6.7 8.9 16.7 .. 39.0 f 87.6 56 4.1<br />
171 Côte d’Ivoire 60.6 67.0 .. .. 9.5 13.7 .. 79.0 26.0 53.9 98 7.7<br />
172 Djibouti 24.1 52.3 .. .. 53.9 .. .. .. 8.0 g .. 98 12.0 m<br />
173 Gambia 54.0 77.3 31.5 54.6 30.1 44.4 .. 60.5 19.0 .. 180 10.8<br />
174 Ethiopia 78.4 83.0 72.7 19.9 5.5 7.6 1.1 i 88.8 27.0 75.3 90 9.0<br />
175 Mali 60.6 66.2 .. .. 8.5 10.7 13.5 82.9 21.0 80.0 98 5.7<br />
176 Congo (Democratic Republic of the) 68.4 71.1 .. .. 3.8 6.2 .. .. 38.0 f 85.3 98 15.0<br />
240 | HUMAN DEVELOPMENT REPORT <strong>2016</strong>
HUMAN DEVELOPMENT REPORT <strong>2016</strong><br />
<strong>Human</strong> <strong>Development</strong> for Everyone<br />
Employment<br />
Unemployment<br />
Employment Labour force<br />
to population participation Employment<br />
ratio a rate a in agriculture Employment<br />
in services Total Youth<br />
(% ages 15 and older) (% of total employment)<br />
(% of labour<br />
force) (% ages 15–24)<br />
Youth not in<br />
school or Vulnerable<br />
employment employment<br />
(% of total<br />
employment)<br />
Work that is a risk to<br />
human development<br />
Child<br />
labour<br />
(% ages<br />
5–14)<br />
Working<br />
poor at<br />
PPP$3.10<br />
a day<br />
(% of total<br />
employment)<br />
Employment-related<br />
social security<br />
Mandatory<br />
paid<br />
maternity<br />
leave<br />
(days)<br />
Old-age<br />
pension<br />
recipients<br />
(% of statutory<br />
pension age<br />
population)<br />
HDI rank 2015 2015 2010–2014 b 2010–2014 b 2015 2015 2010–2014 b 2005–2014 b 2009–2015 b 2004–2013 b 2015 2004–2013 b,c<br />
177 Liberia 58.4 60.9 46.5 41.2 4.2 4.9 14.5 78.7 21.0 g 89.0 90 ..<br />
178 Guinea-Bissau 67.2 72.7 .. .. 7.6 12.4 .. .. 38.0 79.4 60 6.2<br />
179 Eritrea 76.9 83.9 .. .. 8.4 13.0 .. .. .. 69.0 60 ..<br />
179 Sierra Leone 64.5 66.8 .. .. 3.4 5.3 .. .. 37.0 81.4 84 0.9<br />
181 Mozambique 61.5 79.1 .. .. 22.3 37.8 10.1 .. 22.0 g 90.9 60 17.3<br />
181 South Sudan .. 73.2 .. .. .. .. .. .. .. .. 56 ..<br />
183 Guinea 80.9 82.3 74.8 19.3 1.8 1.2 .. 89.8 28.0 72.5 98 8.8<br />
184 Burundi 82.4 83.7 .. .. 1.5 2.9 .. 93.7 26.0 93.5 84 4.0<br />
185 Burkina Faso 81.1 83.5 .. .. 2.9 4.7 .. 89.6 39.0 80.5 98 3.2<br />
186 Chad 67.6 71.6 .. .. 5.6 8.3 .. .. 26.0 67.0 98 1.6<br />
187 Niger 62.9 64.7 .. .. 2.8 3.9 .. 84.8 31.0 85.1 98 6.1<br />
188 Central African Republic 72.1 78.0 .. .. 7.6 12.3 .. .. 29.0 81.3 98 ..<br />
OTHER COUNTRIES OR TERRITORIES<br />
Korea (Democratic People’s Rep. of) 74.2 79.5 .. .. 6.7 12.8 .. .. .. 81.4 .. ..<br />
Marshall Islands .. .. 11.0 79.6 .. .. .. .. .. .. .. 64.2<br />
Monaco .. .. .. .. .. .. .. .. .. .. .. ..<br />
Nauru .. .. .. .. .. .. .. .. .. .. .. 56.5<br />
San Marino .. .. 0.3 65.4 .. .. .. .. .. .. 150 ..<br />
Somalia 50.2 54.3 .. .. 7.5 11.7 .. .. 49.0 g 76.7 .. ..<br />
Tuvalu .. .. .. .. .. .. .. .. .. .. .. 19.5<br />
<strong>Human</strong> development groups<br />
Very high human development 56.4 60.4 3.8 72.7 6.8 16.3 13.4 .. .. .. 114 90.4<br />
High human development 63.1 66.8 14.0 53.8 5.8 14.4 .. .. .. 11.8 116 70.9<br />
Medium human development 55.5 58.6 43.7 35.6 5.2 13.4 .. 63.0 12.1 47.9 91 25.6<br />
Low human development 64.0 68.6 .. .. 7.0 11.4 .. .. 26.8 71.9 85 9.4<br />
Developing countries 60.0 63.6 35.1 41.4 5.7 13.5 .. .. 15.6 33.3 95 50.9<br />
Regions<br />
Arab States 44.2 49.8 22.8 51.9 11.7 29.0 .. .. 12.1 34.9 73 36.6<br />
East Asia and the Pacific 67.6 70.8 25.1 44.1 4.6 12.6 .. .. .. 20.7 82 65.5<br />
Europe and Central Asia 51.5 57.4 20.3 54.4 10.4 19.3 .. 28.5 6.4 4.3 165 86.1<br />
Latin America and the Caribbean 61.2 65.4 14.8 65.0 6.4 14.3 19.5 31.3 10.2 8.6 89 59.6<br />
South Asia 52.2 54.5 47.3 30.9 4.2 10.7 28.2 74.8 12.1 52.5 99 23.9<br />
Sub-Saharan Africa 65.2 70.4 .. .. 7.8 12.5 .. .. 27.4 70.0 89 20.5<br />
Least developed countries 66.9 71.1 .. .. 6.2 11.4 .. .. 24.5 75.7 85 19.5<br />
Small island developing states 57.9 63.0 .. .. 7.9 18.2 .. .. .. .. .. 29.0<br />
Organisation for Economic<br />
Co‐operation and <strong>Development</strong> 55.6 59.6 4.8 72.3 6.9 14.7 15.0 .. .. .. 122 87.0<br />
World 59.3 62.9 26.2 50.4 5.9 13.8 .. 46.3 T .. 32.5 103 64.4<br />
TABLE<br />
11<br />
NOTES<br />
a Modeled International Labour Organization<br />
estimates.<br />
b Data refer to the most recent year available<br />
during the period specified.<br />
c Because statutory pension ages differ by country,<br />
cross-country comparisons should be made with<br />
caution.<br />
d Refers to population ages 16–24.<br />
e Refers to population ages 15–29.<br />
f Differs from standard definition or refers to only<br />
part of the country.<br />
g Refers to years or periods other than those specified.<br />
h Refers to population ages 14–24.<br />
i Refers to population ages 10–24.<br />
j Refers to population ages 14–28.<br />
k Refers to population ages 18–35.<br />
l Refers to population ages 12–30.<br />
m Refers to 2002.<br />
n Refers to 2001.<br />
T From original data source.<br />
DEFINITIONS<br />
Employment to population ratio: Percentage<br />
of the population ages 15 years and older that is<br />
employed.<br />
Labour force participation rate: Percentage of<br />
a country’s working-age population that engages<br />
actively in the labour market, either by working or<br />
looking for work. It provides an indication of the<br />
relative size of the supply of labour available to<br />
engage in the production of goods and services.<br />
Employment in agriculture: Share of total<br />
employment that is employed in agriculture.<br />
Employment in services: Share of total<br />
employment that is employed in services.<br />
Total unemployment rate: Percentage of the<br />
labour force population ages 15 and older that is<br />
not in paid employment or self-employed but is<br />
available for work and has taken steps to seek paid<br />
employment or self-employment.<br />
Youth unemployment rate: Percentage of<br />
the labour force population ages 15–24 that is<br />
not in paid employment or self-employed but is<br />
available for work and has taken steps to seek paid<br />
employment or self-employment.<br />
Youth not in school or employment: Percentage<br />
of people ages 15–24 who are not in employment or<br />
in education or training.<br />
Vulnerable employment: Percentage of employed<br />
people engaged as unpaid family workers and ownaccount<br />
workers.<br />
Child labour: Percentage of children ages 5–11<br />
who, during the reference week, engaged in at least<br />
one hour of economic activity or at least 28 hours<br />
of household chores, or children ages 12–14 who,<br />
during the reference week, engaged in at least 14<br />
hours of economic activity or at least 28 hours of<br />
household chores.<br />
Working poor at PPP$3.10 a day: Proportion of<br />
employed people who live on less than $3.10 (in<br />
purchasing power parity terms) a day, expressed as<br />
a percentage of the total employed population ages<br />
15 and older.<br />
Mandatory paid maternity leave: Number of days<br />
of paid time off work to which a female employee is<br />
entitled to take care of a newborn child.<br />
Old-age pension recipients: Proportion of people<br />
older than the statutory pensionable age receiving<br />
an old-age pension (contributory, noncontributory<br />
or both), expressed as a percentage of the eligible<br />
population.<br />
MAIN DATA SOURCES<br />
Columns 1–8 and 10: ILO (<strong>2016</strong>a).<br />
Column 9: UNICEF (<strong>2016</strong>).<br />
Column 11: World Bank (<strong>2016</strong>b).<br />
Column 12: ILO (<strong>2016</strong>c).<br />
TABLE 11 Work and employment | 241
TABLE<br />
12<br />
<strong>Human</strong> security<br />
TABLE<br />
12<br />
Birth<br />
registration<br />
Refugees<br />
by country<br />
of origin<br />
Internally<br />
displaced<br />
persons<br />
(% under<br />
age 5) (thousands) (thousands)<br />
Homeless<br />
people due<br />
to natural Orphaned<br />
disaster children<br />
(average<br />
annual<br />
per million<br />
people)<br />
(thousands)<br />
Prison Homicide<br />
population rate<br />
(per 100,000 (per 100,000<br />
people) people)<br />
Suicide rate<br />
Justification of<br />
wife beating<br />
(per 100,000 people) (% ages 15–49)<br />
Violence<br />
against women<br />
ever experienced a<br />
Intimate<br />
partner<br />
Female Male Female Male (%)<br />
Nonintimate<br />
partner<br />
HDI rank 2010–2015 b 2015 c 2015 2005/2015 2014 2004–2015 b 2010–2014 b 2012 2012 2010–2015 b 2010–2015 b 2005–2015 b 2005–2015 b 2013/2015<br />
VERY HIGH HUMAN DEVELOPMENT<br />
1 Norway 100 0.0 .. 0 .. 71 0.6 5.2 13.0 .. .. 27.0 .. ..<br />
2 Australia 100 0.0 .. 57 .. 151 1.0 5.2 16.1 .. .. 16.9 .. ..<br />
2 Switzerland 100 0.0 .. 0 .. 84 0.5 5.1 13.6 .. .. .. .. ..<br />
4 Germany 100 0.2 .. 0 .. 78 0.9 4.1 14.5 .. .. 22.0 7.0 ..<br />
5 Denmark 100 0.0 .. 0 .. 61 1.0 4.1 13.6 .. .. 32.0 11.0 ..<br />
5 Singapore .. 0.1 .. 0 .. 227 0.3 5.3 9.8 .. .. 6.1 .. ..<br />
7 Netherlands 100 0.1 .. 0 .. 69 0.7 4.8 11.7 .. .. 25.0 12.0 ..<br />
8 Ireland 100 0.0 .. 0 .. 80 1.1 5.2 16.9 .. .. 15.0 5.0 ..<br />
9 Iceland 100 .. .. 0 .. 45 0.3 6.7 21.0 .. .. 22.4 .. ..<br />
10 Canada 100 0.1 .. 19 .. 106 1.4 4.8 14.9 .. .. .. .. ..<br />
10 United States 100 4.8 .. 16 .. 698 3.9 5.2 19.4 .. .. .. .. ..<br />
12 Hong Kong, China (SAR) .. 0.0 .. 0 .. 114 0.9 .. .. .. .. .. .. ..<br />
13 New Zealand 100 0.0 .. 15 .. 194 0.9 5.0 14.4 .. .. .. .. ..<br />
14 Sweden 100 0.0 .. 0 .. 55 0.9 6.1 16.2 .. .. 28.0 12.0 ..<br />
15 Liechtenstein 100 .. .. .. .. 21 d 2.7 .. .. .. .. .. .. ..<br />
16 United Kingdom 100 0.1 .. 44 .. 146 e 0.9 2.6 9.8 .. .. 29.0 7.0 ..<br />
17 Japan 100 0.1 .. 29 .. 48 0.3 10.1 26.9 .. .. .. .. ..<br />
18 Korea (Republic of) .. 0.4 .. 8 .. 101 0.7 18.0 41.7 .. .. .. .. 4<br />
19 Israel 100 0.8 .. 0 .. 256 1.7 2.3 9.8 .. .. .. .. ..<br />
20 Luxembourg 100 0.0 .. 0 .. 112 0.7 4.4 13.0 .. .. 22.0 8.0 ..<br />
21 France 100 0.1 .. 1 .. 95 d 1.2 6.0 19.3 .. .. 26.0 9.0 ..<br />
22 Belgium 100 0.1 .. 0 .. 105 1.8 7.7 21.0 .. .. 24.0 8.0 ..<br />
23 Finland 100 0.0 .. 0 .. 57 1.6 7.5 22.2 .. .. 30.0 11.0 ..<br />
24 Austria 100 0.0 .. 0 .. 95 0.5 5.4 18.2 .. .. 13.0 4.0 ..<br />
25 Slovenia 100 0.0 .. 47 .. 73 0.7 4.4 20.8 .. .. 13.0 4.0 ..<br />
26 Italy 100 0.1 .. 116 .. 86 0.8 1.9 7.6 .. .. 19.0 5.0 ..<br />
27 Spain 100 0.1 .. 30 .. 136 0.7 2.2 8.2 .. .. 13.0 3.0 ..<br />
28 Czech Republic 100 1.3 .. 0 .. 195 0.7 3.9 21.5 .. .. 21.0 4.0 ..<br />
29 Greece 100 0.1 .. 33 .. 109 0.1 1.3 6.3 .. .. 19.0 1.0 ..<br />
30 Brunei Darussalam .. .. .. 0 .. 132 0.5 5.2 7.7 .. .. .. .. 13<br />
30 Estonia 100 0.3 .. 0 .. 216 3.1 3.8 24.9 .. .. 20.0 9.0 ..<br />
32 Andorra 100 0.0 .. .. .. 72 0.0 .. .. .. .. .. .. ..<br />
33 Cyprus 100 0.0 272.0 0 .. 94 d 0.1 1.5 7.7 .. .. 15.0 2.0 ..<br />
33 Malta 100 0.0 .. .. .. 135 1.4 0.7 11.1 .. .. 15.0 5.0 ..<br />
33 Qatar .. 0.0 .. .. .. 53 7.2 1.2 5.7 7.0 16.0 .. .. ..<br />
36 Poland 100 1.3 .. 0 .. 191 0.7 3.8 30.5 .. .. 13.0 2.0 ..<br />
37 Lithuania 100 0.1 .. 0 .. 268 5.5 8.4 51.0 .. .. 24.0 5.0 ..<br />
38 Chile 99 f 0.6 .. 4,573 .. 247 3.6 5.8 19.0 .. .. .. .. 22<br />
38 Saudi Arabia .. 0.7 .. 32 .. 161 6.2 0.2 0.6 .. .. .. .. 10<br />
40 Slovakia 100 0.3 .. 0 .. 184 1.1 2.5 18.5 .. .. 23.0 4.0 ..<br />
41 Portugal 100 0.0 .. 1 .. 138 0.9 3.5 13.6 .. .. 19.0 1.0 ..<br />
42 United Arab Emirates 100 f 0.1 .. .. .. 229 0.7 1.7 3.9 .. .. .. .. 22<br />
43 Hungary 100 1.4 .. 0 .. 187 1.5 7.4 32.4 .. .. 21.0 3.0 ..<br />
44 Latvia 100 0.2 .. 0 .. 239 3.9 4.3 30.7 .. .. 32.0 7.0 ..<br />
45 Argentina 100 f 0.2 .. 16 .. 160 7.6 4.1 17.2 2.0 .. .. .. 3<br />
45 Croatia .. 33.5 .. 0 .. 89 0.8 4.5 19.8 .. .. 13.0 3.0 ..<br />
47 Bahrain .. 0.4 .. 0 .. 301 0.5 2.9 11.6 .. .. .. .. ..<br />
48 Montenegro 99 0.7 .. 0 .. 174 3.2 6.4 24.7 3.0 5.0 .. .. ..<br />
49 Russian Federation 100 67.1 27.0 9 .. 445 9.5 6.2 35.1 .. .. .. .. ..<br />
50 Romania .. 1.7 .. 26 .. 143 1.5 2.9 18.4 .. .. 24.0 2.0 ..<br />
51 Kuwait .. 1.1 .. 0 .. 92 1.8 0.8 1.0 .. .. .. .. 20<br />
HIGH HUMAN DEVELOPMENT<br />
52 Belarus 100 f 4.1 .. 0 .. 306 3.6 6.4 32.7 4.0 4.0 .. .. ..<br />
52 Oman .. 0.0 .. 0 .. 36 1.1 0.6 1.2 8.0 .. .. .. 36<br />
54 Barbados 99 0.1 .. 0 .. 322 8.8 0.6 4.1 3.0 .. .. .. 23<br />
54 Uruguay 100 0.1 .. 269 .. 291 7.8 5.2 20.0 2.0 .. .. .. 25<br />
56 Bulgaria 100 1.3 .. 15 .. 125 1.6 5.3 16.6 .. .. 23.0 6.0 ..<br />
56 Kazakhstan 100 2.3 .. 49 .. 234 7.4 9.3 40.6 12.0 17.0 .. .. 19<br />
58 Bahamas .. 0.2 .. 0 .. 363 29.8 1.3 3.6 .. .. .. .. ..<br />
59 Malaysia .. 0.4 .. 94 .. 171 1.9 1.5 4.7 .. .. .. .. 17<br />
242 | HUMAN DEVELOPMENT REPORT <strong>2016</strong><br />
Depth<br />
of food<br />
deficit<br />
(kilocalories<br />
per person<br />
per day)
HUMAN DEVELOPMENT REPORT <strong>2016</strong><br />
<strong>Human</strong> <strong>Development</strong> for Everyone<br />
Birth<br />
registration<br />
Refugees<br />
by country<br />
of origin<br />
Internally<br />
displaced<br />
persons<br />
Homeless<br />
people due<br />
to natural Orphaned<br />
disaster children<br />
Prison Homicide<br />
population rate<br />
Suicide rate<br />
Justification of<br />
wife beating<br />
Violence<br />
against women<br />
ever experienced a<br />
Depth<br />
of food<br />
deficit<br />
(% under<br />
age 5) (thousands) (thousands)<br />
(average<br />
annual<br />
per million<br />
people)<br />
(thousands)<br />
(per 100,000 (per 100,000<br />
people) people)<br />
(per 100,000 people) (% ages 15–49)<br />
Intimate<br />
partner<br />
Female Male Female Male (%)<br />
Nonintimate<br />
partner<br />
(kilocalories<br />
per person<br />
per day)<br />
HDI rank 2010–2015 b 2015 c 2015 2005/2015 2014 2004–2015 b 2010–2014 b 2012 2012 2010–2015 b 2010–2015 b 2005–2015 b 2005–2015 b 2013/2015<br />
60 Palau .. 0.0 .. 0 .. 343 3.1 .. .. .. .. 25.3 15.1 ..<br />
60 Panama 96 0.1 .. 32 .. 392 17.4 1.3 8.1 6.0 .. .. .. 69<br />
62 Antigua and Barbuda .. 0.1 .. 0 .. 373 11.2 .. .. .. .. .. .. ..<br />
63 Seychelles .. 0.0 .. 0 .. 799 2.1 .. .. .. .. .. .. ..<br />
64 Mauritius .. 0.1 .. 0 .. 155 2.7 2.9 13.2 .. .. .. .. 36<br />
65 Trinidad and Tobago 97 g 0.4 .. 0 .. 258 25.9 6.2 20.4 8.0 g .. .. .. 59<br />
66 Costa Rica 100 f 0.4 .. 0 .. 352 10.0 2.2 11.2 4.0 .. .. .. 39<br />
66 Serbia 99 .. .. 15 .. 148 1.3 5.8 19.9 4.0 .. .. .. ..<br />
68 Cuba 100 5.9 .. 1,307 .. 510 4.7 4.5 18.5 4.0 f 7.0 f .. .. 8<br />
69 Iran (Islamic Republic of) 99 f 84.9 .. 25 .. 287 4.8 3.6 6.7 .. .. .. .. 36<br />
70 Georgia 100 6.5 239.0 129 .. 274 d 2.7 1.0 5.7 7.0 g .. 9.0 0.2 60<br />
71 Turkey 99 f 59.6 954.0 43 .. 220 4.3 4.2 11.8 13.0 .. 38.0 .. 1<br />
71 Venezuela (Bolivarian Republic of) 81 f 7.5 .. 12 .. 178 62.0 1.0 4.3 .. .. .. .. 10<br />
73 Sri Lanka 97 g 121.4 44.0 5,380 .. 92 2.9 12.8 46.4 53.0 f,g .. .. .. 200<br />
74 Saint Kitts and Nevis .. 0.0 .. 0 .. 607 33.6 .. .. .. .. .. .. ..<br />
75 Albania 99 g 10.4 .. 7 .. 189 4.0 5.2 6.6 30.0 g 36.0 g 24.6 .. ..<br />
76 Lebanon 100 g 4.4 12.0 0 .. 120 4.3 0.6 1.2 10.0 f,g .. .. .. 33<br />
77 Mexico 93 11.3 287.0 288 .. 212 15.7 1.7 7.1 .. .. 14.1 .. 30<br />
78 Azerbaijan 94 g 9.7 564.0 69 .. 236 2.5 1.0 2.4 28.0 .. 13.5 .. 13<br />
79 Brazil 96 0.9 .. 82 .. 301 24.6 2.5 9.4 .. .. .. .. 11<br />
79 Grenada .. 0.3 .. 0 .. 398 7.5 .. .. .. .. .. .. ..<br />
81 Bosnia and Herzegovina 100 g 18.7 98.0 0 .. 73 e 1.3 4.1 18.0 5.0 6.0 .. .. ..<br />
82<br />
The former Yugoslav Republic of<br />
Macedonia 100 1.8 0.2 0 .. 147 1.6 3.2 7.3 15.0 .. .. .. ..<br />
83 Algeria 100 g 3.5 .. 11 .. 162 1.5 1.5 2.3 59.0 f .. .. .. 21<br />
84 Armenia 100 11.2 8.4 0 .. 130 2.0 0.9 5.0 9.0 20.0 9.5 .. 45<br />
84 Ukraine 100 321.0 1,679.0 6 .. 195 d 4.4 5.3 30.3 3.0 9.0 13.2 1.3 ..<br />
86 Jordan 99 1.8 .. 0 .. 150 2.3 1.9 2.2 70.0 f .. 23.6 .. 13<br />
87 Peru 97 f 3.6 60.0 193 .. 242 6.7 2.1 4.4 .. .. 36.4 .. 54<br />
87 Thailand 99 f 0.2 35.0 25 .. 461 3.9 4.5 19.1 13.0 .. .. .. 57<br />
89 Ecuador 92 1.0 .. 89 .. 162 8.2 5.3 13.2 .. .. 37.5 .. 72<br />
90 China .. 212.9 .. 203 .. 119 d 0.8 8.7 7.1 .. .. .. .. 78<br />
91 Fiji .. 0.9 .. 0 .. 174 3.0 4.1 10.6 .. .. 64.0 9.0 30<br />
92 Mongolia 99 2.2 .. 0 .. 266 7.5 3.7 16.3 10.0 9.0 f .. .. 165<br />
92 Saint Lucia 92 1.0 .. 0 .. 349 21.6 .. .. 7.0 .. .. .. ..<br />
94 Jamaica 100 1.9 .. 39 .. 145 36.1 0.7 1.8 5.0 .. 35.0 .. 62<br />
95 Colombia 97 90.8 6,270.0 26 .. 244 27.9 1.9 9.1 .. .. 37.4 .. 67<br />
96 Dominica .. 0.0 .. 853 .. 300 8.4 .. .. .. .. .. .. ..<br />
97 Suriname 99 0.0 .. 0 .. 183 9.5 11.9 44.5 13.0 .. .. .. 58<br />
97 Tunisia 99 1.6 .. 0 .. 212 3.1 1.4 3.4 30.0 .. .. .. 4<br />
99 Dominican Republic 88 0.4 .. 128 .. 233 17.4 2.1 6.1 2.0 .. 22.4 .. 88<br />
99 Saint Vincent and the Grenadines .. 1.8 .. 499 .. 378 25.6 .. .. .. .. .. .. 46<br />
101 Tonga 93 0.0 .. 0 .. 166 0.1 .. .. 29.0 21.0 39.6 .. ..<br />
102 Libya .. 6.1 500.0 0 .. 99 2.5 1.4 2.2 .. .. .. .. ..<br />
103 Belize 95 0.1 .. 0 .. 449 34.4 0.5 4.9 9.0 .. .. .. 41<br />
104 Samoa 59 0.0 .. 0 .. 250 3.2 .. .. 37.0 30.0 46.1 11.0 22<br />
105 Maldives 93 g 0.0 .. 0 .. 341 0.9 4.9 7.8 31.0 f,g 14.0 f,g 19.5 6.2 39<br />
105 Uzbekistan 100 g 4.2 .. 0 .. 150 3.2 4.1 13.2 70.0 g 61.0 g .. .. 31<br />
MEDIUM HUMAN DEVELOPMENT<br />
107 Moldova (Republic of) 100 2.3 .. 0 .. 215 d 3.2 4.8 24.1 11.0 13.0 45.5 .. ..<br />
108 Botswana 72 g 0.3 .. 0 100 188 14.8 2.0 5.7 .. .. .. .. 183<br />
109 Gabon 90 0.2 .. 47 68 210 9.4 4.5 12.1 50.0 40.0 48.6 5.0 19<br />
110 Paraguay 85 f 0.1 .. 29 .. 158 8.8 3.2 9.1 .. .. .. .. 76<br />
111 Egypt 99 17.9 78.0 1 .. 76 3.2 1.2 2.4 36.0 f .. 26.0 .. 12<br />
111 Turkmenistan 96 g 0.5 .. 0 .. 583 4.3 7.5 32.5 38.0 f,g .. .. .. 24<br />
113 Indonesia 69 f 9.3 6.1 296 .. 64 0.5 4.9 3.7 35.0 18.0 f .. .. 51<br />
114 Palestine, State of 99 98.0 h 221.0 11 .. .. 0.6 .. .. .. .. .. .. ..<br />
115 Viet Nam 96 313.2 .. 863 .. 154 1.5 2.4 8.0 28.0 .. 34.4 .. 89<br />
116 Philippines 90 0.6 62.0 91 .. 121 9.9 1.2 4.8 13.0 .. 14.6 1.6 96<br />
117 El Salvador 99 14.8 289.0 268 .. 492 64.2 5.7 23.5 8.0 .. 26.3 .. 86<br />
118 Bolivia (Plurinational State of) 76 f,g 0.6 .. 47 .. 122 12.4 8.5 16.2 16.0 g .. .. 4.0 109<br />
TABLE<br />
12<br />
TABLE 12 <strong>Human</strong> security | 243
TABLE 12 HUMAN SECURITY<br />
TABLE<br />
12<br />
Birth<br />
registration<br />
Refugees<br />
by country<br />
of origin<br />
Internally<br />
displaced<br />
persons<br />
(% under<br />
age 5) (thousands) (thousands)<br />
Homeless<br />
people due<br />
to natural Orphaned<br />
disaster children<br />
(average<br />
annual<br />
per million<br />
people)<br />
(thousands)<br />
Prison Homicide<br />
population rate<br />
(per 100,000 (per 100,000<br />
people) people)<br />
Suicide rate<br />
Justification of<br />
wife beating<br />
(per 100,000 people) (% ages 15–49)<br />
Violence<br />
against women<br />
ever experienced a<br />
Intimate<br />
partner<br />
Female Male Female Male (%)<br />
Nonintimate<br />
partner<br />
HDI rank 2010–2015 b 2015 c 2015 2005/2015 2014 2004–2015 b 2010–2014 b 2012 2012 2010–2015 b 2010–2015 b 2005–2015 b 2005–2015 b 2013/2015<br />
119 South Africa 85 f 0.4 .. 15 2,800 292 33.0 1.1 5.5 .. .. .. .. 14<br />
120 Kyrgyzstan 98 2.5 .. 140 .. 166 3.7 4.5 14.2 33.0 .. 25.4 0.1 41<br />
121 Iraq 99 261.1 3,290.0 8 .. 123 7.9 2.1 1.2 51.0 .. .. .. 188<br />
122 Cabo Verde 91 0.0 .. 0 .. 286 10.6 1.6 9.1 17.0 f,g 16.0 f,g 12.6 .. 72<br />
123 Morocco 94 f 1.8 .. 0 .. 222 1.0 1.2 9.9 64.0 g .. .. .. 33<br />
124 Nicaragua 85 1.5 .. 91 .. 171 11.5 4.9 15.4 14.0 f,g .. 29.3 .. 126<br />
125 Guatemala 97 g 10.3 251.0 379 .. 121 31.2 4.3 13.7 .. .. 27.6 .. 101<br />
125 Namibia 87 f 1.5 .. 0 100 144 16.9 1.4 4.4 28.0 22.0 .. .. 323<br />
127 Guyana 89 0.5 .. 0 .. 259 20.4 22.1 70.8 10.0 10.0 .. .. 77<br />
127 Micronesia (Federated States of) .. .. .. 0 .. 127 4.8 .. .. .. .. 32.8 8.0 ..<br />
129 Tajikistan 88 0.8 .. 29 .. 121 1.4 2.8 5.7 60.0 .. 20.3 .. 258<br />
130 Honduras 94 6.8 174.0 129 .. 196 74.6 2.8 8.3 12.0 10.0 .. .. 85<br />
131 India 72 9.9 612.0 662 29,600 33 3.2 16.4 25.8 47.0 g 42.0 g 37.2 0.3 110<br />
132 Bhutan 100 17.7 .. 0 .. 145 2.7 11.2 23.1 68.0 .. .. .. ..<br />
133 Timor-Leste 55 0.0 .. 0 .. 50 3.7 5.8 10.2 86.0 81.0 34.6 0.4 190<br />
134 Vanuatu 43 f 0.0 .. 0 .. 87 2.9 .. .. 60.0 60.0 60.0 33.0 41<br />
135 Congo 96 14.8 7.8 437 210 27 10.5 4.6 14.7 54.0 40.0 .. .. 196<br />
135 Equatorial Guinea 54 0.2 .. 0 43 129 3.4 8.6 24.1 53.0 52.0 56.9 .. ..<br />
137 Kiribati 94 g 0.0 .. 75 .. 136 7.5 .. .. 76.0 g 60.0 g 67.6 10.0 23<br />
138 Lao People’s Democratic Republic 75 7.4 .. 1 .. 71 7.3 6.6 11.2 58.0 49.0 15.0 5.0 131<br />
139 Bangladesh 37 12.2 426.0 71 .. 43 2.8 8.7 6.8 33.0 f .. 67.2 .. 120<br />
139 Ghana 71 23.0 .. 19 950 53 1.7 2.2 4.2 28.0 13.0 22.9 4.2 22<br />
139 Zambia 11 0.3 .. 131 950 125 5.8 10.8 20.8 47.0 32.0 49.5 2.9 411<br />
142 Sao Tome and Principe 95 0.0 .. 0 .. 101 3.4 .. .. 19.0 14.0 27.9 .. 38<br />
143 Cambodia 73 12.8 .. 366 .. 105 1.8 6.5 12.6 50.0 f 27.0 f 21.0 4.0 102<br />
144 Nepal 58 8.9 50.0 284 .. 59 2.9 20.0 30.1 43.0 .. 28.2 0.4 49<br />
145 Myanmar 72 198.7 644.0 15 .. 113 2.5 10.3 16.5 .. .. .. .. 108<br />
146 Kenya 67 7.9 309.0 11 2,000 118 5.9 8.4 24.4 42.0 36.0 41.2 3.5 136<br />
147 Pakistan 34 277.3 1,459.0 2,742 .. 43 7.8 9.6 9.1 42.0 f 32.0 f .. .. 171<br />
LOW HUMAN DEVELOPMENT<br />
148 Swaziland 54 0.2 .. 20 87 289 17.4 4.1 8.6 20.0 17.0 .. .. 190<br />
149 Syrian Arab Republic 96 g 4,850.8 6,600.0 0 .. 60 2.2 0.2 0.7 .. .. .. .. ..<br />
150 Angola 36 11.9 .. 436 1,300 106 9.8 7.3 20.7 .. .. .. .. 96<br />
151 Tanzania (United Republic of) 15 f 6.2 .. 70 2,600 69 7.9 18.3 31.6 54.0 38.0 43.6 2.9 237<br />
152 Nigeria 30 f 152.1 2,096.0 8 9,900 31 10.1 2.9 10.3 35.0 25.0 16.2 1.5 40<br />
153 Cameroon 66 10.6 124.0 204 1,200 115 2.7 3.4 10.9 36.0 39.0 51.1 5.0 64<br />
154 Papua New Guinea .. 0.3 6.3 295 300 61 10.4 9.1 15.9 .. .. .. .. ..<br />
154 Zimbabwe 32 21.3 .. 3 810 145 6.7 9.7 27.2 37.0 24.0 42.3 1.2 264<br />
156 Solomon Islands .. 0.1 .. 171 .. 56 .. 7.2 13.9 69.0 g 65.0 g 63.5 .. 67<br />
157 Mauritania 59 34.7 .. 326 .. 44 11.4 1.5 4.5 38.0 .. .. .. 37<br />
158 Madagascar 83 0.3 .. 1,967 .. 83 0.6 6.9 15.2 45.0 46.0 f .. .. 227<br />
159 Rwanda 63 286.4 .. 52 500 434 4.9 7.2 17.1 56.0 25.0 56.4 .. 240<br />
160 Comoros 87 0.6 .. 0 .. 31 7.8 10.3 24.0 39.0 17.0 6.4 1.5 ..<br />
160 Lesotho 45 g 0.0 .. 117 120 92 38.0 3.4 9.2 37.0 g 48.0 g .. .. 76<br />
162 Senegal 73 21.3 24.0 0 .. 62 7.9 2.8 8.6 57.0 27.0 .. .. 66<br />
163 Haiti 80 34.8 .. 867 300 97 10.0 2.4 3.3 17.0 15.0 20.8 2.0 530<br />
163 Uganda 30 6.3 30.0 782 1,900 115 11.8 12.3 26.9 58.0 44.0 50.5 3.7 170<br />
165 Sudan 67 622.5 i 3,182.0 556 .. 50 6.5 11.5 23.0 34.0 .. .. .. 176 j<br />
166 Togo 78 8.8 3.0 190 330 64 9.2 2.8 8.5 29.0 18.0 .. .. 85<br />
167 Benin 85 0.4 .. 1,468 440 77 6.3 3.1 8.8 36.0 17.0 .. .. 52<br />
168 Yemen 31 15.9 2,509.0 15 .. 53 6.7 3.0 4.3 49.0 .. .. .. 180<br />
169 Afghanistan 37 2,663.0 1,174.0 281 .. 74 6.6 5.3 6.2 90.0 .. .. .. 166<br />
170 Malawi 6 f 0.4 .. 514 990 73 1.8 8.9 23.9 13.0 8.0 31.0 1.7 139<br />
171 Côte d’Ivoire 65 71.1 303.0 45 1,200 52 11.4 4.1 10.6 48.0 42.0 25.5 .. 94<br />
172 Djibouti 92 g 1.1 .. 0 32 68 7.0 9.5 20.9 .. .. .. .. 130<br />
173 Gambia 72 8.5 .. 21 87 58 9.4 2.6 7.6 58.0 33.0 .. .. 33<br />
174 Ethiopia 7 g 85.8 450.0 1 3,500 128 8.0 6.7 16.5 68.0 45.0 .. .. 244<br />
175 Mali 81 154.2 50.0 308 810 33 10.2 2.7 7.2 87.0 .. 34.6 .. 23<br />
176 Congo (Democratic Republic of the) 25 541.3 1,500.0 32 4,000 32 12.5 4.8 15.8 75.0 61.0 64.1 2.7 ..<br />
177 Liberia 25 f 10.0 .. 89 190 39 3.2 2.0 6.8 43.0 24.0 38.6 2.6 261<br />
178 Guinea-Bissau 24 1.5 .. 42 120 .. 9.9 2.4 7.2 42.0 29.0 .. .. 152<br />
244 | HUMAN DEVELOPMENT REPORT <strong>2016</strong><br />
Depth<br />
of food<br />
deficit<br />
(kilocalories<br />
per person<br />
per day)
HUMAN DEVELOPMENT REPORT <strong>2016</strong><br />
<strong>Human</strong> <strong>Development</strong> for Everyone<br />
Birth<br />
registration<br />
Refugees<br />
by country<br />
of origin<br />
Internally<br />
displaced<br />
persons<br />
Homeless<br />
people due<br />
to natural Orphaned<br />
disaster children<br />
Prison Homicide<br />
population rate<br />
Suicide rate<br />
Justification of<br />
wife beating<br />
Violence<br />
against women<br />
ever experienced a<br />
Depth<br />
of food<br />
deficit<br />
(% under<br />
age 5) (thousands) (thousands)<br />
(average<br />
annual<br />
per million<br />
people)<br />
(thousands)<br />
(per 100,000 (per 100,000<br />
people) people)<br />
(per 100,000 people) (% ages 15–49)<br />
Intimate<br />
partner<br />
Female Male Female Male (%)<br />
Nonintimate<br />
partner<br />
(kilocalories<br />
per person<br />
per day)<br />
HDI rank 2010–2015 b 2015 c 2015 2005/2015 2014 2004–2015 b 2010–2014 b 2012 2012 2010–2015 b 2010–2015 b 2005–2015 b 2005–2015 b 2013/2015<br />
179 Eritrea .. 379.8 .. 0 140 .. 9.7 8.7 25.8 51.0 45.0 .. .. ..<br />
179 Sierra Leone 77 4.9 .. 36 310 55 1.9 4.5 11.0 63.0 34.0 45.3 .. 162<br />
181 Mozambique 48 0.1 .. 292 1,800 61 3.6 21.1 34.2 23.0 20.0 33.1 .. 188<br />
181 South Sudan 35 778.6 k 1,697.0 0 570 65 13.9 12.8 27.1 79.0 .. .. .. ..<br />
183 Guinea 58 17.0 .. 33 .. 26 8.7 2.4 7.1 92.0 66.0 .. .. 118<br />
184 Burundi 75 292.8 99.0 519 580 93 4.0 12.5 34.1 73.0 44.0 .. .. ..<br />
185 Burkina Faso 77 2.1 .. 367 830 34 0.7 2.8 7.3 44.0 34.0 11.5 .. 167<br />
186 Chad 12 14.9 107.0 93 970 39 9.2 2.3 7.4 62.0 .. .. .. 276<br />
187 Niger 64 1.4 153.0 449 .. 39 4.5 1.9 5.3 60.0 27.0 .. .. 58<br />
188 Central African Republic 61 471.1 452.0 920 300 16 13.2 5.3 14.1 80.0 75.0 29.8 .. 349<br />
OTHER COUNTRIES OR TERRITORIES<br />
Korea (Democratic People’s Rep. of) 100 g 1.1 .. 1,315 .. .. 4.7 .. .. .. .. .. .. 344<br />
Marshall Islands 96 g 0.0 .. 0 .. .. 4.7 .. .. 56.0 g 58.0 g 51.0 13.0 ..<br />
Monaco 100 0.0 .. .. .. 74 d .. .. .. .. .. .. .. ..<br />
Nauru 83 g .. .. .. .. 140 1.3 .. .. .. .. 48.1 47.0 ..<br />
San Marino 100 0.0 .. .. .. .. 0.0 .. .. .. .. .. .. ..<br />
Somalia 3 g 1,123.0 1,223.0 234 630 .. 5.6 6.8 18.1 76.0 f,g .. .. .. ..<br />
Tuvalu 50 g 0.0 .. 0 .. 110 20.3 .. .. 70.0 g 73.0 g 36.8 .. ..<br />
<strong>Human</strong> development groups<br />
Very high human development 100 118.2 l 299.0 l 81 .. 289 2.9 5.6 19.9 .. .. .. .. ..<br />
High human development .. 1,019.2 l 10,750.6 l 203 .. 174 6.0 6.4 8.9 .. .. .. .. 60<br />
Medium human development 70 1,335.9 l 7,878.9 l 609 .. 66 4.8 11.0 17.3 41.3 .. 37.3 .. 104<br />
Low human development 39 11,584.9 l 20,559.3 l 233 3,982 70 8.2 6.6 15.2 51.8 36.1 .. .. 147<br />
Developing countries 65 15,066.6 l 40,683.8 l 399 .. 111 5.8 8.3 13.5 .. .. .. .. 92<br />
Regions<br />
Arab States 84 7,011.7 l 17,615.0 l 72 .. 116 4.0 2.6 5.5 45.8 .. .. .. 67<br />
East Asia and the Pacific .. 760.1 l 753.4 l 241 .. 126 1.5 7.3 7.3 .. .. .. .. 79<br />
Europe and Central Asia 98 456.2 l 3,542.6 l 29 .. 209 3.9 4.8 18.6 21.5 .. 26.2 .. 27<br />
Latin America and the Caribbean 94 197.8 l 7,331.0 l 290 .. 244 21.6 2.8 9.9 .. .. .. .. 41<br />
South Asia 64 3,195.4 l 3,765.0 l 838 .. 48 3.8 14.3 21.6 45.8 .. .. .. 115<br />
Sub-Saharan Africa 41 3,445.3 l 7,404.8 l 189 3,702 88 9.5 6.3 15.5 50.3 35.5 .. .. 131<br />
Least developed countries 40 7,859.6 l 13,773.0 l 249 .. 75 6.4 8.5 15.6 51.9 .. .. .. 165<br />
Small island developing states 82 50.9 l 6.3 l 506 .. 229 12.0 4.3 11.8 13.2 .. .. .. 169<br />
Organisation for Economic<br />
Co‐operation and <strong>Development</strong> 99 83.3 l 1,241.0 l 114 .. 274 3.3 5.3 17.4 .. .. .. .. ..<br />
World 69 15,182.3 l 40,710.8 l 334 .. 143 5.2 7.9 14.7 .. .. .. .. 91<br />
NOTES<br />
a Data collection methods, age ranges, sampled<br />
women (ever-partnered, ever-married or all<br />
women) and definitions of the forms of violence<br />
and of perpetrators vary by survey. Thus data are<br />
not necessarily comparable across countries.<br />
b Data refer to the most recent year available<br />
during the period specified.<br />
c Data refer to people recognized as refugees<br />
under the 1951 UN Convention, the 1967 UN<br />
Protocol and the 1969 Organization of African<br />
Unity Convention. In the absence of government<br />
figures, the Office of the UN High Commissioner<br />
for Refugees (UNHCR) has estimated the refugee<br />
population in many industrial countries based on<br />
10 years of individual asylum-seeker recognition.<br />
d For more detailed country notes, see www.<br />
prisonstudies.org.<br />
e HDRO calculations based on data from ICPS (<strong>2016</strong>).<br />
f Differs from standard definition or refers to only<br />
part of the country.<br />
g Refers to years or periods other than those specified.<br />
h Refers to Palestinian refugees under the UNHCR<br />
mandate only. Another 5,589,488 Palestinian<br />
refugees are under the responsibility of United<br />
Nations Relief and Works Agency for Palestinian<br />
Refugees in the Near East.<br />
i May include citizens of South Sudan.<br />
j Refers to the average for 2009–2011, prior to<br />
South Sudan’s independence.<br />
k An unknown number of refugees and asylumseekers<br />
from South Sudan may be included under<br />
data for Sudan.<br />
l Unweighted sum of national estimates.<br />
DEFINITIONS<br />
Birth registration: Percentage of children under age<br />
5 who were registered at the moment of the survey.<br />
It includes children whose birth certificate was seen<br />
by the interviewer and children whose mother or<br />
caretaker says the birth has been registered.<br />
Refugees by country of origin: Number of people<br />
who have fled their country of origin because of a<br />
well founded fear of persecution due to their race,<br />
religion, nationality, political opinion or membership<br />
in a particular social group and who cannot or do not<br />
want to return to their country of origin.<br />
Internally displaced persons: Number of people<br />
who have been forced to leave their homes or places<br />
of habitual residence — in particular, as a result of<br />
or to avoid the effects of armed conflict, situations<br />
of generalized violence, violations of human rights<br />
or natural or human-made disasters — and who<br />
have not crossed an internationally recognized state<br />
border.<br />
Homeless people due to natural disaster:<br />
Average annual number of people who lack a shelter<br />
for living quarters as a result of natural disasters,<br />
who carry their few possessions with them and who<br />
sleep in the streets, in doorways or on piers, or in<br />
any other space, on a more or less random basis,<br />
expressed per million people.<br />
Orphaned children: Number of children (ages 0–17)<br />
who have lost one or both parents due to any cause.<br />
Prison population: Number of adult and juvenile<br />
prisoners — including pretrial detainees, unless<br />
otherwise noted — expressed per 100,000 people.<br />
Homicide rate: Number of unlawful deaths<br />
purposefully inflicted on a person by another person,<br />
expressed per 100,000 people.<br />
Suicide rate: Number of deaths from purposely<br />
self-inflicted injuries, expressed per 100,000 people<br />
in the reference population.<br />
Justification of wife beating: Percentage of<br />
women and men ages 15–49 who consider a husband<br />
to be justified in hitting or beating his wife for at least<br />
one of the following reasons: if his wife burns the<br />
food, argues with him, goes out without telling him,<br />
neglects the children or refuses sexual relations.<br />
Violence against women ever experienced,<br />
intimate partner: Percentage of the female<br />
population, ages 15 and older, that has ever<br />
experienced physical or sexual violence from an<br />
intimate partner.<br />
Violence against women ever experienced,<br />
nonintimate partner: Percentage of the female<br />
population, ages 15 and older, that has ever<br />
experienced sexual violence from a nonintimate<br />
partner.<br />
Depth of the food deficit: Number of kilocalories<br />
needed to lift the undernourished from their status,<br />
holding all other factors constant.<br />
MAIN DATA SOURCES<br />
Columns 1, 5, 10 and 11: UNICEF (<strong>2016</strong>).<br />
Column 2: UNHCR (<strong>2016</strong>).<br />
Column 3: IDMC (<strong>2016</strong>).<br />
Column 4: CRED EM-DAT (<strong>2016</strong>) and UNDESA<br />
(2015a).<br />
Column 6: ICPS (<strong>2016</strong>).<br />
Column 7: UNODC (<strong>2016</strong>).<br />
Columns 8 and 9: WHO (<strong>2016</strong>).<br />
Columns 12 and 13: UN Women (<strong>2016</strong>).<br />
Column 14: FAO (<strong>2016</strong>a).<br />
TABLE<br />
12<br />
TABLE 12 <strong>Human</strong> security | 245
TABLE<br />
13<br />
International integration<br />
Trade Financial flows <strong>Human</strong> mobility Communication<br />
TABLE<br />
13<br />
Exports and<br />
imports<br />
Foreign<br />
direct<br />
investment,<br />
net inflows<br />
Private<br />
capital flows<br />
Net official<br />
development<br />
assistance Remittances,<br />
received a inflows<br />
(% of GDP) (% of GDP) (% of GDP) (% of GNI) (% of GDP)<br />
Net<br />
migration<br />
rate<br />
(per 1,000<br />
people)<br />
Stock of<br />
immigrants<br />
(% of<br />
population)<br />
International<br />
student<br />
mobility<br />
(% of total<br />
tertiary<br />
enrolment)<br />
International<br />
inbound<br />
tourists<br />
(thousands)<br />
Internet<br />
users<br />
(% of<br />
population)<br />
Mobile phone<br />
subscriptions<br />
HDI rank 2015 b 2015 b 2015 b 2014 c 2015 b 2010/2015 d 2015 2013 e 2014 c 2015 2015 2010–2015<br />
VERY HIGH HUMAN DEVELOPMENT<br />
1 Norway 68.5 –1.5 14.6 .. 0.16 9.3 f 14.2 f –3.4 4,855 96.8 113.6 –0.8<br />
2 Australia 41.0 2.8 –7.2 .. 0.16 8.9 g 28.2 g 17.1 6,868 84.6 132.8 32.2<br />
2 Switzerland 114.6 18.0 8.5 .. 0.34 9.5 29.4 12.6 9,158 88.0 142.0 15.3<br />
4 Germany 86.0 1.4 8.4 .. 0.46 3.1 14.9 2.8 32,999 87.6 116.7 9.6<br />
5 Denmark 100.2 0.6 –2.1 .. 0.42 3.5 10.1 8.3 10,267 96.3 128.3 11.0<br />
5 Singapore 326.1 22.3 8.5 .. .. 14.9 45.4 10.3 11,864 82.1 146.1 0.5<br />
7 Netherlands 154.3 9.0 4.5 .. 0.18 1.3 11.7 5.4 13,925 93.1 123.5 7.0<br />
8 Ireland 222.0 85.5 –64.8 .. 0.25 –6.0 15.9 –3.9 8,813 80.1 103.7 –1.5<br />
9 Iceland 100.4 2.3 20.5 .. 1.15 –0.2 11.4 –8.2 998 98.2 114.0 6.3<br />
10 Canada 65.4 3.6 –0.1 .. 0.09 6.7 21.8 .. 16,537 88.5 81.9 8.3<br />
10 United States 28.1 2.1 –0.7 .. 0.04 3.2 14.5 3.6 75,011 74.6 117.6 28.8<br />
12 Hong Kong, China (SAR) 400.0 58.4 6.9 .. 0.12 4.2 39.0 –1.7 27,770 84.9 228.8 16.9<br />
13 New Zealand 55.2 –0.3 –0.3 .. 0.24 0.3 23.0 14.0 2,772 88.2 121.8 13.0<br />
14 Sweden 86.1 3.2 –0.1 .. 0.66 5.7 16.8 1.8 5,660 90.6 130.4 11.3<br />
15 Liechtenstein .. .. .. .. .. .. 62.6 –16.8 54 96.6 108.8 10.7<br />
16 United Kingdom 56.8 1.8 –18.2 .. 0.18 2.8 13.2 16.3 32,613 92.0 125.8 1.7<br />
17 Japan 36.8 0.0 6.4 .. 0.09 0.6 1.6 3.0 13,413 93.3 125.1 29.2<br />
18 Korea (Republic of) 84.8 0.4 5.2 .. 0.47 1.2 2.6 –1.7 14,202 89.9 118.5 13.1<br />
19 Israel 59.4 3.9 1.7 .. 0.29 0.5 24.9 –2.6 2,927 78.9 133.5 8.7<br />
20 Luxembourg 391.5 42.6 –98.4 .. 2.79 18.1 44.0 –85.9 1,038 97.3 148.5 3.8<br />
21 France 61.4 1.8 1.4 .. 0.96 1.0 12.1 6.6 83,767 84.7 102.6 12.3<br />
22 Belgium 167.1 –4.6 –2.7 .. 2.19 4.9 12.3 6.6 7,887 85.1 115.7 4.1<br />
23 Finland 74.3 8.1 –7.9 .. 0.35 4.0 h 5.7 h 4.4 4,226 92.7 135.5 –13.3<br />
24 Austria 102.4 1.5 6.7 .. 0.75 3.5 17.5 13.1 25,291 83.9 157.4 8.0<br />
25 Slovenia 146.3 3.9 4.3 .. 1.70 0.4 11.4 –0.1 2,411 73.1 113.2 9.6<br />
26 Italy 57.3 0.4 6.3 .. 0.52 1.8 9.7 1.6 48,576 65.6 151.3 –2.2<br />
27 Spain 63.8 1.9 3.8 .. 0.22 –2.6 i 12.7 i 1.4 64,995 78.7 107.9 –3.0<br />
28 Czech Republic 162.5 1.4 –3.1 .. 1.48 0.6 3.8 6.5 10,617 81.3 129.2 5.4<br />
29 Greece 60.4 –0.1 4.9 .. 0.22 –2.5 11.3 –0.8 22,033 66.8 114.0 3.0<br />
30 Brunei Darussalam 106.6 1.1 6.8 .. .. 1.0 24.3 –38.3 201 71.2 108.1 –0.5<br />
30 Estonia 155.4 –0.8 3.0 .. 1.96 –1.8 15.4 –3.5 2,918 88.4 148.7 16.8<br />
32 Andorra .. .. .. .. .. .. 59.7 –182.3 2,363 96.9 88.1 4.8<br />
33 Cyprus 108.1 27.1 13.9 .. 1.29 6.2 j 16.8 j –61.0 2,441 71.7 95.4 1.8<br />
33 Malta 182.5 5.7 –45.9 .. 2.09 3.0 9.9 –6.3 1,690 76.2 129.3 20.5<br />
33 Qatar 90.9 0.6 11.7 .. 0.26 36.3 75.5 16.6 2,826 92.9 153.6 22.9<br />
36 Poland 95.9 1.5 –0.3 .. 1.43 –0.4 1.6 0.2 16,000 68.0 148.7 21.0<br />
37 Lithuania 154.7 1.5 –2.6 .. 3.33 –11.3 4.7 –5.0 2,063 71.4 139.5 –12.5<br />
38 Chile 60.4 8.5 –3.0 0.1 0.05 2.3 2.6 –0.5 3,674 64.3 129.5 11.9<br />
38 Saudi Arabia 72.5 1.3 1.1 .. 0.05 5.7 32.3 –0.8 18,259 69.6 176.6 –6.7<br />
40 Slovakia 185.2 2.5 0.1 .. 2.47 0.0 3.3 –10.9 6,235 85.0 122.3 12.2<br />
41 Portugal 79.9 –0.7 –0.3 .. 0.18 –2.7 8.1 1.4 9,092 68.6 110.4 –4.2<br />
42 United Arab Emirates 175.9 3.0 .. .. .. 9.3 88.4 38.2 .. 91.2 187.3 44.7<br />
43 Hungary 171.2 –0.8 4.9 .. 3.33 0.6 4.6 3.4 12,140 72.8 118.9 –0.9<br />
44 Latvia 118.9 2.7 6.2 .. 5.24 –7.2 13.4 –2.9 1,843 79.2 127.0 15.1<br />
45 Argentina 22.9 2.1 –1.8 0.0 0.08 0.1 4.8 .. 5,931 69.4 143.9 1.8<br />
45 Croatia 96.0 0.3 –0.5 0.2 4.32 –0.9 13.6 –5.2 11,623 69.8 103.8 –8.7<br />
47 Bahrain 115.3 –4.5 88.7 .. .. 4.5 51.1 –4.7 10,452 93.5 185.3 48.0<br />
48 Montenegro 104.4 17.5 –20.5 2.2 9.55 –0.8 13.2 .. 1,350 64.6 162.2 –14.1<br />
49 Russian Federation 50.7 0.5 3.2 .. 0.52 1.6 8.1 1.2 32,421 73.4 160.0 –3.4<br />
50 Romania 82.7 2.2 –1.2 .. 1.65 –4.4 1.2 –1.4 8,442 55.8 107.1 –3.8<br />
51 Kuwait 99.1 0.3 33.5 .. 0.03 29.8 73.6 .. 307 82.1 231.8 74.2<br />
HIGH HUMAN DEVELOPMENT<br />
52 Belarus 119.2 2.9 –0.9 0.2 1.27 2.5 11.4 –4.0 137 62.2 123.6 13.6<br />
52 Oman 115.4 1.2 1.9 0.0 0.06 65.2 41.1 –11.8 1,519 74.2 159.9 –2.7<br />
54 Barbados 81.2 5.7 0.9 0.4 2.43 1.5 12.1 3.9 521 76.1 116.5 –6.7<br />
54 Uruguay 44.9 3.3 –2.5 0.2 0.22 –1.8 2.1 .. 2,682 64.6 160.2 21.8<br />
56 Bulgaria 131.5 3.6 –5.5 .. 2.95 –1.4 1.4 –4.6 7,311 56.7 129.3 –6.4<br />
56 Kazakhstan 53.3 2.2 –2.8 0.0 0.10 1.9 20.1 –5.1 4,560 72.9 187.2 53.6<br />
58 Bahamas 93.4 0.9 –0.7 .. .. 5.2 15.3 .. 1,427 78.0 80.3 –32.4<br />
(per 100<br />
people)<br />
(% change)<br />
246 | HUMAN DEVELOPMENT REPORT <strong>2016</strong>
HUMAN DEVELOPMENT REPORT <strong>2016</strong><br />
<strong>Human</strong> <strong>Development</strong> for Everyone<br />
Trade Financial flows <strong>Human</strong> mobility Communication<br />
Exports and<br />
imports<br />
Foreign<br />
direct<br />
investment,<br />
net inflows<br />
Private<br />
capital flows<br />
Net official<br />
development<br />
assistance Remittances,<br />
received a inflows<br />
(% of GDP) (% of GDP) (% of GDP) (% of GNI) (% of GDP)<br />
Net<br />
migration<br />
rate<br />
(per 1,000<br />
people)<br />
Stock of<br />
immigrants<br />
(% of<br />
population)<br />
International<br />
student<br />
mobility<br />
(% of total<br />
tertiary<br />
enrolment)<br />
International<br />
inbound<br />
tourists<br />
(thousands)<br />
Internet<br />
users<br />
(% of<br />
population)<br />
Mobile phone<br />
subscriptions<br />
HDI rank 2015 b 2015 b 2015 b 2014 c 2015 b 2010/2015 d 2015 2013 e 2014 c 2015 2015 2010–2015<br />
59 Malaysia 134.4 3.7 2.2 0.0 0.55 3.1 k 8.3 k –0.2 27,437 71.1 143.9 20.2<br />
60 Palau 134.5 –3.1 –16.3 9.8 0.79 .. 26.6 .. 141 .. 111.5 57.3<br />
60 Panama 115.0 11.0 –6.8 –0.4 1.07 1.5 4.7 .. 1,745 51.2 174.2 –3.6<br />
62 Antigua and Barbuda 97.8 11.9 –10.8 0.2 1.68 –0.1 30.6 –19.0 249 65.2 137.2 –28.7<br />
63 Seychelles 181.3 7.4 –15.9 0.7 1.14 –3.3 13.3 –198.3 233 58.1 158.1 22.6<br />
64 Mauritius 109.4 1.8 –0.6 0.4 0.01 0.0 l 2.2 l –11.6 1,039 50.1 140.6 45.3<br />
65 Trinidad and Tobago 59.9 5.8 .. 0.0 0.45 –0.7 3.7 .. 412 69.2 157.7 10.5<br />
66 Costa Rica 72.3 5.9 –5.9 0.1 1.08 0.8 8.8 .. 2,527 59.8 150.7 124.9<br />
66 Serbia 105.1 6.4 –4.6 0.9 9.23 –2.2 m 9.1 m –1.2 1,029 65.3 120.5 –3.8<br />
68 Cuba 44.3 .. .. 0.1 .. –1.4 0.1 4.1 2,970 31.1 29.7 233.5<br />
69 Iran (Islamic Republic of) 43.1 0.5 .. 0.0 0.31 –0.8 3.4 –1.0 4,967 44.1 93.4 28.6<br />
70 Georgia 110.0 9.6 –7.5 3.4 10.45 –14.4 n 4.2 n –5.8 5,516 45.2 129.0 42.3<br />
71 Turkey 58.8 2.4 0.5 0.4 0.19 5.3 3.8 0.2 39,811 53.7 96.0 12.1<br />
71 Venezuela (Bolivarian Republic of) 54.3 0.6 0.1 0.0 0.03 –0.5 4.5 –0.5 857 61.9 93.0 –3.1<br />
73 Sri Lanka 48.5 0.8 –1.6 0.6 8.50 –4.7 0.2 –5.1 1,527 30.0 112.8 34.9<br />
74 Saint Kitts and Nevis 79.0 8.5 –13.1 3.8 5.61 .. 13.4 –57.9 113 75.7 131.8 –13.7<br />
75 Albania 71.4 8.6 –11.5 2.1 9.14 –6.3 2.0 –12.1 3,341 63.3 106.4 24.5<br />
76 Lebanon 121.9 5.0 –5.3 1.8 15.88 49.1 34.1 6.9 1,355 74.0 87.1 32.0<br />
77 Mexico 72.8 2.6 –3.5 0.1 2.29 –0.9 0.9 –0.6 29,346 57.4 85.3 10.0<br />
78 Azerbaijan 72.6 7.6 –3.6 0.3 2.39 –0.3 o 2.7 o –6.6 2,160 77.0 111.3 11.2<br />
79 Brazil 27.4 4.2 –4.7 0.0 0.16 0.0 0.3 –0.2 6,430 59.1 126.6 25.5<br />
79 Grenada 68.7 6.2 –9.1 4.5 3.03 –8.1 6.6 54.1 134 53.8 112.3 –3.6<br />
81 Bosnia and Herzegovina 90.8 1.7 –1.1 3.4 11.08 –0.1 0.9 –3.2 536 65.1 90.2 11.5<br />
82 The former Yugoslav Republic of Macedonia 113.3 1.9 –2.5 1.9 3.04 –0.5 6.3 –5.2 425 70.4 105.4 2.9<br />
83 Algeria 62.5 –0.2 0.3 0.1 0.16 –0.8 0.6 –1.1 2,301 38.2 113.0 27.8<br />
84 Armenia 71.0 1.7 –4.0 2.2 14.12 –0.7 6.3 –2.6 1,204 58.2 115.1 –11.7<br />
84 Ukraine 107.5 3.4 –3.7 1.1 6.45 0.9 p 10.8 0.5 12,712 49.3 144.0 23.0<br />
86 Jordan 97.9 3.4 –6.8 7.6 14.26 6.5 41.0 3.7 3,990 53.4 179.4 74.9<br />
87 Peru 44.6 3.6 –5.1 0.2 1.42 –1.6 0.3 .. 3,215 40.9 109.9 10.4<br />
87 Thailand 131.9 1.8 5.4 0.1 1.32 0.3 5.8 –0.2 24,810 39.3 125.8 16.5<br />
89 Ecuador 45.1 1.1 –2.5 0.2 2.37 –0.5 2.4 –1.3 1,557 48.9 79.4 –19.4<br />
90 China 41.2 2.3 0.0 0.0 0.41 –0.3 0.1 –1.8 55,622 50.3 93.2 47.5<br />
91 Fiji 137.0 7.6 –5.7 2.1 5.07 –6.6 1.5 .. 693 46.3 108.2 33.4<br />
92 Mongolia 87.0 1.7 –3.8 2.8 2.26 –1.1 0.6 –3.9 393 21.4 105.0 13.4<br />
92 Saint Lucia 95.3 6.6 –12.4 1.3 2.10 0.0 6.9 –31.5 338 52.4 101.5 –9.1<br />
94 Jamaica 77.1 5.7 –15.1 0.7 16.86 –7.0 0.8 .. 2,080 43.2 111.5 –3.9<br />
95 Colombia 39.0 4.1 –5.9 0.3 1.60 –0.6 0.3 .. 2,565 55.9 115.7 20.9<br />
96 Dominica 80.7 6.7 –0.3 3.1 4.38 .. 9.2 .. 81 67.6 106.3 –28.3<br />
97 Suriname 91.1 4.0 –5.5 0.2 0.14 –1.9 8.6 .. 252 42.8 180.7 82.0<br />
97 Tunisia 102.1 2.3 –2.5 2.0 5.46 –0.6 0.5 –3.2 6,069 48.5 129.9 24.3<br />
99 Dominican Republic 53.6 3.3 –8.3 0.3 7.74 –3.0 3.9 2.7 5,141 51.9 82.6 –7.0<br />
99 Saint Vincent and the Grenadines 78.1 16.1 –18.8 1.3 4.20 –9.1 4.2 .. 71 51.8 103.7 –14.0<br />
101 Tonga 71.3 12.9 .. 18.2 27.08 –15.4 5.4 .. 50 45.0 65.6 25.8<br />
102 Libya 137.0 2.5 8.8 0.5 .. –16.0 12.3 .. .. 19.0 157.0 –13.0<br />
103 Belize 125.6 3.4 –3.3 2.3 4.81 4.5 15.0 .. 321 41.6 48.9 –22.3<br />
104 Samoa 77.7 2.1 –1.8 12.0 20.27 –13.4 2.6 .. 120 25.4 58.5 21.0<br />
105 Maldives 200.7 10.3 –10.1 0.9 0.12 0.0 25.9 .. 1,205 54.5 206.7 36.2<br />
105 Uzbekistan 42.8 1.6 .. 0.5 4.65 –1.4 3.9 –8.3 1,969 42.8 73.3 –2.8<br />
MEDIUM HUMAN DEVELOPMENT<br />
107 Moldova (Republic of) 117.2 4.1 –4.1 5.9 23.41 –0.5 q 3.5 q –12.3 11 49.8 108.0 51.3<br />
108 Botswana 99.2 2.7 4.0 0.6 0.21 1.9 7.1 –5.4 1,544 27.5 169.0 40.8<br />
109 Gabon 74.0 4.4 .. 0.6 .. 0.6 15.6 .. .. 23.5 168.9 63.3<br />
110 Paraguay 82.1 1.1 –1.9 0.2 2.00 –2.7 2.4 .. 649 44.4 105.4 15.0<br />
111 Egypt 34.9 2.1 –0.7 1.2 5.96 –0.5 0.5 1.0 9,628 35.9 111.0 22.6<br />
111 Turkmenistan 117.7 11.4 .. 0.1 0.04 –1.0 3.7 .. .. 15.0 145.9 130.1<br />
113 Indonesia 41.9 1.8 –4.9 0.0 1.12 –0.6 0.1 –0.5 9,435 22.0 132.3 50.8<br />
114 Palestine, State of 77.5 0.9 –0.8 17.5 17.40 –2.0 r 5.5 s –9.8 556 57.4 77.6 19.6<br />
115 Viet Nam 178.8 6.1 –5.5 2.4 6.82 –0.4 0.1 –2.2 7,874 52.7 130.6 4.3<br />
116 Philippines 60.8 2.0 1.6 0.2 10.27 –1.4 0.2 –0.2 4,833 40.7 118.1 32.7<br />
117 El Salvador 68.0 2.0 –1.7 0.4 16.58 –7.9 0.7 –1.3 1,345 26.9 145.3 17.3<br />
(per 100<br />
people)<br />
(% change)<br />
TABLE<br />
13<br />
TABLE 13 International integration | 247
TABLE 13 INTERNATIONAL INTEGRATION<br />
Trade Financial flows <strong>Human</strong> mobility Communication<br />
TABLE<br />
13<br />
Exports and<br />
imports<br />
Foreign<br />
direct<br />
investment,<br />
net inflows<br />
Private<br />
capital flows<br />
Net official<br />
development<br />
assistance Remittances,<br />
received a inflows<br />
(% of GDP) (% of GDP) (% of GDP) (% of GNI) (% of GDP)<br />
Net<br />
migration<br />
rate<br />
(per 1,000<br />
people)<br />
Stock of<br />
immigrants<br />
(% of<br />
population)<br />
International<br />
student<br />
mobility<br />
(% of total<br />
tertiary<br />
enrolment)<br />
International<br />
inbound<br />
tourists<br />
(thousands)<br />
Internet<br />
users<br />
(% of<br />
population)<br />
Mobile phone<br />
subscriptions<br />
HDI rank 2015 b 2015 b 2015 b 2014 c 2015 b 2010/2015 d 2015 2013 e 2014 c 2015 2015 2010–2015<br />
118 Bolivia (Plurinational State of) 85.3 1.5 1.5 2.1 3.62 –1.2 1.3 .. 871 45.1 92.2 30.4<br />
119 South Africa 62.8 0.5 –0.4 0.3 0.26 2.3 5.8 3.6 9,549 51.9 159.3 62.7<br />
120 Kyrgyzstan 125.1 11.6 –10.8 8.6 25.68 –4.0 3.4 1.9 2,849 30.2 132.8 34.3<br />
121 Iraq 50.4 2.1 1.6 0.6 0.16 3.3 1.0 .. 892 17.2 93.8 24.9<br />
122 Cabo Verde 91.8 4.6 –4.3 12.9 12.32 –4.4 2.9 –34.5 494 43.0 127.2 66.7<br />
123 Morocco 80.9 3.1 –3.8 2.1 7.04 –1.9 0.3 –7.7 10,283 57.1 126.9 25.5<br />
124 Nicaragua 93.0 6.6 –6.1 3.7 9.43 –4.6 0.7 .. 1,330 19.7 116.1 70.6<br />
125 Guatemala 51.3 1.8 –1.7 0.5 10.33 –1.5 0.5 .. 1,455 27.1 111.5 –11.5<br />
125 Namibia 111.5 9.2 –18.3 1.8 0.08 –0.1 3.8 –32.7 1,176 22.3 102.1 14.1<br />
127 Guyana 120.5 3.7 –1.9 5.2 9.27 –7.2 2.0 –16.9 206 38.2 67.2 –5.8<br />
127 Micronesia (Federated States of) .. 6.4 –4.6 33.9 7.34 –15.7 2.6 .. 35 31.5 .. –100.0<br />
129 Tajikistan 87.5 5.0 –5.0 3.1 28.76 –2.9 3.2 –4.2 213 19.0 98.6 26.6<br />
130 Honduras 109.1 6.5 –5.5 3.3 18.19 –2.1 0.3 –0.9 868 20.4 95.5 –23.4<br />
131 India 48.8 2.1 –3.0 0.1 3.32 –0.4 0.4 –0.6 7,679 26.0 78.8 26.4<br />
132 Bhutan 116.0 1.7 .. 7.1 1.00 2.7 6.6 –29.9 134 39.8 87.1 58.4<br />
133 Timor-Leste 110.9 3.0 –12.8 7.7 4.36 –8.9 0.9 .. 60 13.4 117.4 167.9<br />
134 Vanuatu 97.4 1.6 –2.8 12.1 3.45 0.5 1.2 .. 109 22.4 66.2 –7.9<br />
135 Congo 165.6 17.4 .. 0.9 .. –2.8 8.5 –20.9 373 7.6 111.7 23.5<br />
135 Equatorial Guinea 178.3 3.4 .. 0.0 .. 5.1 1.3 .. .. 21.3 66.7 16.3<br />
137 Kiribati 104.3 1.2 6.1 24.3 11.01 –4.0 2.8 .. 6 13.0 38.8 258.3<br />
138 Lao People’s Democratic Republic 79.0 8.8 –13.1 4.2 0.75 –3.6 0.3 –3.4 3,164 18.2 53.1 –15.2<br />
139 Bangladesh 42.1 1.7 –1.9 1.3 7.89 –2.8 0.9 –1.1 125 14.4 83.4 85.5<br />
139 Ghana 98.8 8.4 –10.2 3.1 13.16 –0.4 1.5 0.5 1,093 23.5 129.7 80.5<br />
139 Zambia 67.9 7.8 –17.4 3.8 0.27 –0.5 0.8 .. 947 21.0 74.5 80.7<br />
142 Sao Tome and Principe .. 8.0 –7.6 11.5 7.95 –6.2 1.3 .. 12 25.8 65.1 12.9<br />
143 Cambodia 141.7 9.4 –9.3 5.1 2.20 –2.0 0.5 –2.7 4,503 19.0 133.0 134.4<br />
144 Nepal 53.2 0.1 .. 4.4 32.23 –2.7 1.8 –7.6 790 17.6 96.7 182.5<br />
145 Myanmar .. 4.8 .. 2.2 4.99 –1.8 0.1 –1.0 3,081 21.8 76.7 6,603.2<br />
146 Kenya 44.8 2.3 –7.1 4.4 2.46 –0.2 2.4 .. 1,261 45.6 80.7 32.2<br />
147 Pakistan 28.1 0.4 –0.7 1.4 7.15 –1.2 1.9 .. 966 18.0 66.9 16.8<br />
LOW HUMAN DEVELOPMENT<br />
148 Swaziland 101.2 –3.0 –0.6 2.0 0.60 –1.0 2.5 –32.8 968 30.4 73.2 20.3<br />
149 Syrian Arab Republic .. .. .. .. .. –41.1 4.7 .. 5,070 30.0 62.4 15.0<br />
150 Angola 75.1 8.5 2.3 0.2 0.01 0.9 0.4 .. 595 12.4 60.8 26.5<br />
151 Tanzania (United Republic of) 49.5 4.4 –4.4 5.6 0.87 –0.8 t 0.5 t .. 1,113 5.4 75.9 62.6<br />
152 Nigeria 30.9 0.6 –1.0 0.5 4.29 –0.4 0.7 .. 600 47.4 82.2 50.4<br />
153 Cameroon 42.8 2.1 –2.2 2.7 0.84 –0.5 1.6 –8.0 912 20.7 71.8 71.6<br />
154 Papua New Guinea .. –0.2 –2.0 3.5 0.06 0.0 0.3 .. 182 7.9 46.6 67.6<br />
154 Zimbabwe 75.0 3.0 .. 5.8 .. –3.0 2.6 –16.7 1,905 16.4 84.8 44.0<br />
156 Solomon Islands 98.2 1.9 –1.4 18.1 1.60 –4.3 0.4 .. 20 10.0 72.7 231.2<br />
157 Mauritania 103.7 9.2 .. 5.0 .. –1.0 3.4 .. .. 15.2 89.3 16.1<br />
158 Madagascar 69.7 5.2 –5.5 5.4 4.28 0.0 0.1 –2.6 222 4.2 46.0 25.8<br />
159 Rwanda 45.3 4.0 –4.0 13.3 1.99 –1.4 3.8 –5.7 926 18.0 70.5 115.2<br />
160 Comoros 79.9 0.8 –1.7 11.9 20.19 –2.7 1.6 –70.5 19 7.5 54.8 126.5<br />
160 Lesotho 141.6 4.3 –5.1 4.0 17.43 –1.9 0.3 –11.7 1,079 16.1 105.5 114.7<br />
162 Senegal 73.6 2.5 –8.5 7.2 11.71 –1.4 1.7 .. 836 21.7 99.9 55.1<br />
163 Haiti 69.5 1.2 .. 12.3 24.73 –2.9 0.4 .. 465 12.2 69.9 72.9<br />
163 Uganda 46.9 4.0 –3.1 6.2 3.98 –0.8 1.9 7.2 1,266 19.2 50.4 33.5<br />
165 Sudan 19.0 2.1 –2.1 1.2 0.18 –4.2 1.3 .. 684 26.6 70.5 69.8<br />
166 Togo 106.6 1.3 12.2 5.2 9.93 –0.3 3.8 –9.4 282 7.1 64.9 57.4<br />
167 Benin 62.8 2.7 –3.6 6.3 3.59 –0.2 2.3 4.3 242 6.8 85.6 15.1<br />
168 Yemen .. –0.4 1.3 3.0 9.30 –0.4 1.3 –0.8 990 25.1 68.0 39.6<br />
169 Afghanistan 53.2 0.9 –0.4 23.3 1.57 3.1 1.2 –5.8 .. 8.3 61.6 71.2<br />
170 Malawi 61.9 2.2 –11.0 15.8 0.59 –0.4 1.3 –20.1 795 9.3 35.3 70.2<br />
171 Côte d’Ivoire 87.8 1.4 –1.9 2.8 1.21 0.5 9.6 0.2 471 21.0 119.3 45.1<br />
172 Djibouti .. 9.6 .. .. 2.24 –3.7 12.7 –39.3 63 11.9 34.7 74.6<br />
173 Gambia 70.1 3.3 .. 12.1 21.24 –1.5 9.7 .. 156 17.1 131.3 49.2<br />
174 Ethiopia 37.2 3.5 .. 6.5 1.01 –0.1 1.1 .. 770 11.6 42.8 443.4<br />
175 Mali 50.7 1.2 –1.5 8.8 6.83 –3.7 2.1 –5.3 168 10.3 139.6 162.4<br />
176 Congo (Democratic Republic of the) 64.5 –1.4 –3.0 8.1 0.01 –0.3 0.7 –0.1 191 3.8 53.0 178.8<br />
(per 100<br />
people)<br />
(% change)<br />
248 | HUMAN DEVELOPMENT REPORT <strong>2016</strong>
HUMAN DEVELOPMENT REPORT <strong>2016</strong><br />
<strong>Human</strong> <strong>Development</strong> for Everyone<br />
Trade Financial flows <strong>Human</strong> mobility Communication<br />
Exports and<br />
imports<br />
Foreign<br />
direct<br />
investment,<br />
net inflows<br />
Private<br />
capital flows<br />
Net official<br />
development<br />
assistance Remittances,<br />
received a inflows<br />
(% of GDP) (% of GDP) (% of GDP) (% of GNI) (% of GDP)<br />
Net<br />
migration<br />
rate<br />
(per 1,000<br />
people)<br />
Stock of<br />
immigrants<br />
(% of<br />
population)<br />
International<br />
student<br />
mobility<br />
(% of total<br />
tertiary<br />
enrolment)<br />
International<br />
inbound<br />
tourists<br />
(thousands)<br />
Internet<br />
users<br />
(% of<br />
population)<br />
Mobile phone<br />
subscriptions<br />
HDI rank 2015 b 2015 b 2015 b 2014 c 2015 b 2010/2015 d 2015 2013 e 2014 c 2015 2015 2010–2015<br />
177 Liberia 112.4 35.1 .. 44.3 31.21 –0.9 2.5 .. .. 5.9 81.1 104.3<br />
178 Guinea-Bissau 36.8 1.7 –0.3 9.8 6.04 –1.2 1.2 .. .. 3.5 69.3 62.3<br />
179 Eritrea 37.5 1.5 .. 5.1 .. –6.5 0.3 .. 107 1.1 7.0 118.5<br />
179 Sierra Leone 59.2 11.6 –9.1 18.9 1.48 –0.7 1.4 .. 44 2.5 89.5 157.5<br />
181 Mozambique 91.6 25.3 –24.8 12.6 1.33 –0.2 0.8 –1.1 1,661 9.0 74.2 146.3<br />
181 South Sudan 67.4 –3.1 .. 16.6 0.01 15.4 6.7 .. .. 17.9 23.9 65.1<br />
183 Guinea 78.1 1.3 –2.0 9.1 1.39 –0.2 1.8 –5.1 33 4.7 87.2 137.0<br />
184 Burundi 40.0 0.2 .. 16.2 1.58 0.8 2.6 –3.5 142 4.9 46.2 154.3<br />
185 Burkina Faso 68.7 1.5 –1.9 9.2 3.57 –1.5 3.9 –2.0 191 11.4 80.6 119.6<br />
186 Chad 67.2 5.5 .. 2.9 .. 1.5 3.7 –11.9 122 2.7 40.2 63.8<br />
187 Niger 56.6 7.3 –8.4 11.3 2.04 –0.3 1.0 –5.1 135 2.2 46.5 101.4<br />
188 Central African Republic 39.5 0.2 .. 35.9 .. 0.4 1.7 6.2 71 4.6 20.4 –9.2<br />
OTHER COUNTRIES OR TERRITORIES<br />
Korea (Democratic People’s Rep. of) .. .. .. .. .. 0.0 0.2 .. .. .. 12.9 630.6<br />
Marshall Islands .. 4.8 –8.1 24.2 13.97 .. 6.2 –18.0 5 19.3 29.2 ..<br />
Monaco .. .. .. .. .. .. 55.8 .. 329 93.4 88.8 39.7<br />
Nauru .. .. .. .. .. .. 31.1 .. .. .. .. –100.0<br />
San Marino .. .. .. .. .. .. 14.8 .. 75 .. 115.2 16.2<br />
Somalia 75.8 8.7 .. 21.1 .. –7.9 0.2 .. .. 1.8 52.5 680.0<br />
Tuvalu .. 1.7 2.0 63.3 10.72 .. 1.4 .. 1 42.7 40.3 147.8<br />
<strong>Human</strong> development groups<br />
Very high human development 59.7 2.9 0.4 .. 0.29 2.3 12.5 3.4 713,818 79.4 128.5 11.3<br />
High human development 49.5 2.6 –0.9 0.1 0.82 0.1 1.6 –1.3 279,216 51.4 101.2 19.4<br />
Medium human development 55.7 2.3 –2.7 0.7 4.27 –0.7 0.8 –0.8 90,399 27.2 92.7 170.7<br />
Low human development 45.5 2.5 –1.7 3.5 3.20 –1.1 1.6 –3.2 23,496 19.0 67.4 87.8<br />
Developing countries 52.9 2.5 –0.9 0.4 1.57 –0.4 1.6 –1.1 431,046 36.2 92.9 78.5<br />
Regions<br />
Arab States 86.4 1.7 4.2 1.6 2.42 –0.2 8.9 –0.3 75,244 40.0 111.0 46.1<br />
East Asia and the Pacific 48.9 2.4 –0.2 0.1 0.83 –0.4 0.4 –1.5 142,574 44.9 101.5 335.8<br />
Europe and Central Asia 69.0 3.2 –1.2 0.6 2.09 1.3 6.7 –1.3 77,823 52.3 114.9 26.5<br />
Latin America and the Caribbean 46.2 3.5 –3.7 0.1 1.33 –0.6 1.3 –0.2 81,828 54.4 110.6 14.1<br />
South Asia 46.0 1.7 –2.6 0.5 3.85 –0.7 0.8 –0.8 17,393 24.5 79.0 58.1<br />
Sub-Saharan Africa 55.6 2.6 –2.3 2.5 2.63 –0.1 1.9 –1.3 33,743 22.2 76.4 71.4<br />
Least developed countries 56.5 3.9 –3.0 4.7 4.57 –1.0 1.3 –2.2 26,440 12.6 68.3 254.2<br />
Small island developing states 65.4 3.7 .. 1.6 6.43 –2.5 1.9 0.5 18,684 29.7 71.0 38.4<br />
Organisation for Economic<br />
Co‐operation and <strong>Development</strong> 55.1 2.6 –0.1 .. 0.32 2.1 10.0 3.3 641,075 77.2 115.9 9.0<br />
World 56.7 2.8 –0.2 0.4 0.76 0.0 3.3 0.3 1,107,339 43.7 98.5 59.1<br />
(per 100<br />
people)<br />
(% change)<br />
NOTES<br />
a A negative value refers to net official<br />
development assistance disbursed by donor<br />
countries.<br />
b Data refer to 2015 or the most recent year available.<br />
c Data refer to 2014 or the most recent year available.<br />
d Data are average annual estimates for 2010–2015.<br />
e Data refer to 2013 or the most recent year available.<br />
f Includes Svalbard and Jan Mayen Islands.<br />
g Includes Christmas Island, Cocos (Keeling) Islands<br />
and Norfolk Island.<br />
h Includes Åland Islands.<br />
i Includes Canary Islands, Ceuta and Melilla.<br />
j Includes Northern Cyprus.<br />
k Includes Sabah and Sarawak.<br />
l Includes Agalega, Rodrigues and Saint Brandon.<br />
m Includes Kosovo.<br />
n Includes Abkhazia and South Ossetia.<br />
o Includes Nagorno-Karabakh.<br />
p Includes Crimea.<br />
q Includes Transnistria.<br />
r Includes East Jerusalem.<br />
s Includes East Jerusalem. Refugees are not part<br />
of the foreign-born migrant stock in the State of<br />
Palestine.<br />
t Includes Zanzibar.<br />
DEFINITIONS<br />
Exports and imports: Sum of exports and imports<br />
of goods and services, expressed as a percentage of<br />
gross domestic product (GDP). It is a basic indicator of<br />
openness to foreign trade and economic integration<br />
and indicates the dependence of domestic producers<br />
on foreign demand (exports) and of domestic<br />
consumers and producers on foreign supply (imports),<br />
relative to the country’s economic size (GDP).<br />
Foreign direct investment, net inflows: Sum of<br />
equity capital, reinvestment of earnings, other longterm<br />
capital and short-term capital, expressed as a<br />
percentage of GDP.<br />
Private capital flows: Net foreign direct<br />
investment and portfolio investment, expressed as a<br />
percentage of GDP.<br />
Net official development assistance received:<br />
Disbursements of loans made on concessional<br />
terms (net of repayments of principal) and grants by<br />
official agencies to promote economic development<br />
and welfare in countries and territories on the<br />
<strong>Development</strong> Assistance Committee list of aid<br />
recipients, expressed as a percentage of the<br />
recipient country’s gross national income (GNI).<br />
Remittances, inflows: Earnings and material<br />
resources transferred by international migrants or<br />
refugees to recipients in their country of origin or<br />
countries in which the migrant formerly resided.<br />
Net migration rate: Ratio of the difference<br />
between the number of in-migrants and out-migrants<br />
from a country to the average population, expressed<br />
per 1,000 people.<br />
Stock of immigrants: Ratio of the stock of<br />
immigrants into a country, expressed as a percentage<br />
of the country’s population. The definition of immigrant<br />
varies across countries but generally includes the stock<br />
of foreign-born people, the stock of foreign people<br />
(according to citizenship) or a combination of the two.<br />
International student mobility: Total number of<br />
tertiary students from abroad (inbound students)<br />
studying in a given country minus the number<br />
of students at the same level of education from<br />
that country studying abroad (outbound students),<br />
expressed as a percentage of total tertiary<br />
enrolment in the country.<br />
International inbound tourists: Arrivals of<br />
nonresident visitors (overnight visitors, tourists,<br />
same-day visitors and excursionists) at national<br />
borders.<br />
Internet users: People with access to the<br />
worldwide network.<br />
Mobile phone subscriptions: Number of<br />
subscriptions for the mobile phone service,<br />
expressed per 100 people.<br />
MAIN DATA SOURCES<br />
Columns 1, 2, 4, 5 and 9: World Bank (<strong>2016</strong>a).<br />
Column 3: HDRO calculations based on data from<br />
World Bank (<strong>2016</strong>a).<br />
Columns 6 and 7: UNDESA (2015b).<br />
Column 8: UNESCO Institute for Statistics (<strong>2016</strong>).<br />
Columns 10 and 11: ITU (<strong>2016</strong>).<br />
Column 12: HDRO calculations based on data from<br />
ITU (<strong>2016</strong>).<br />
TABLE<br />
13<br />
TABLE 13 International integration | 249
TABLE<br />
14<br />
Supplementary indicators: perceptions of well-being<br />
Perceptions of individual well-being Perceptions about community Perceptions about government<br />
Education<br />
quality<br />
(%<br />
satisfied)<br />
Health<br />
care<br />
quality<br />
(%<br />
satisfied)<br />
Standard<br />
of living<br />
(%<br />
satisfied)<br />
Ideal<br />
job<br />
(%<br />
answering<br />
yes)<br />
Feeling<br />
safe<br />
(%<br />
answering<br />
yes)<br />
Freedom of<br />
choice<br />
Overall life<br />
satisfaction,<br />
index<br />
(% satisfied) (0, least<br />
Female Male<br />
satisfied,<br />
to 10, most<br />
satisfied)<br />
Local<br />
labour<br />
market<br />
(%<br />
answering<br />
good)<br />
Volunteered<br />
Confidence Actions to<br />
in judicial preserve the<br />
Trust in<br />
national<br />
time Community system environment government<br />
(%<br />
answering<br />
yes)<br />
(%<br />
answering<br />
yes)<br />
(%<br />
answering<br />
yes)<br />
(% satisfied)<br />
(%<br />
answering<br />
yes)<br />
TABLE<br />
14<br />
HDI rank 2014–2015 a 2014–2015 a 2014–2015 a 2014–2015 a 2014–2015 a 2014–2015 a 2014–2015 a 2014–2015 a 2014–2015 a 2014–2015 a 2014–2015 a 2014–2015 a 2014–2015 a 2014–2015 a<br />
VERY HIGH HUMAN DEVELOPMENT<br />
1 Norway 84 85 93 85 90 95 92 7.6 42 31 94 82 56 59<br />
2 Australia 73 87 86 70 63 92 91 7.3 26 40 91 55 59 48<br />
2 Switzerland 83 93 94 84 87 93 92 7.6 47 31 95 82 84 79<br />
4 Germany 62 89 90 80 75 87 90 7.0 61 27 94 71 64 63<br />
5 Denmark 75 88 91 79 85 94 94 7.5 45 23 93 84 71 58<br />
5 Singapore 83 88 84 71 92 89 83 6.6 45 23 94 86 87 91<br />
7 Netherlands 82 86 87 60 81 91 89 7.3 28 33 90 64 73 58<br />
8 Ireland 85 67 78 68 77 89 90 6.8 45 40 91 66 72 57<br />
9 Iceland 83 b 73 b 81 b 66 78 b 92 b 90 b 7.5 b 42 b 29 b 86 b 63 b 64 b 46 b<br />
10 Canada 73 77 79 71 80 94 94 7.3 50 44 88 67 59 52<br />
10 United States 68 77 74 65 73 87 86 7.2 51 44 81 59 60 35<br />
12 Hong Kong, China (SAR) 51 62 75 60 91 84 83 5.5 46 15 88 76 51 46<br />
13 New Zealand 78 85 90 66 64 92 94 7.4 39 44 92 66 67 62<br />
14 Sweden 63 81 87 79 77 94 92 7.3 39 15 94 70 69 50<br />
15 Liechtenstein .. .. .. .. .. .. .. .. .. .. .. .. .. ..<br />
16 United Kingdom 70 77 84 71 78 88 78 6.5 46 33 86 62 67 46<br />
17 Japan 60 71 61 69 68 79 75 5.9 30 26 82 64 51 38<br />
18 Korea (Republic of) 49 62 63 51 61 55 61 5.8 19 21 73 19 34 28<br />
19 Israel 67 72 67 57 77 68 69 7.4 36 21 81 60 45 44<br />
20 Luxembourg 79 87 89 58 71 91 96 6.7 25 31 93 76 78 69<br />
21 France 71 77 78 74 71 81 83 6.4 13 29 86 51 63 33<br />
22 Belgium 80 89 85 73 70 89 85 6.9 26 28 85 53 62 46<br />
23 Finland 81 71 80 71 86 94 91 7.4 16 31 90 72 63 56<br />
24 Austria 78 88 88 84 81 90 89 7.1 32 26 92 66 72 45<br />
25 Slovenia 73 80 67 65 84 89 88 5.7 15 34 87 24 71 20<br />
26 Italy 55 49 68 66 59 56 58 5.8 3 15 62 29 25 26<br />
27 Spain 57 66 75 62 82 71 75 6.4 17 17 80 36 46 28<br />
28 Czech Republic 74 74 75 70 70 80 77 6.6 39 14 89 45 67 44<br />
29 Greece 52 36 49 59 63 50 54 5.6 8 8 78 52 36 44<br />
30 Brunei Darussalam .. .. .. .. .. .. .. .. .. .. .. .. .. ..<br />
30 Estonia 58 48 49 50 67 75 81 5.6 25 13 88 56 65 34<br />
32 Andorra .. .. .. .. .. .. .. .. .. .. .. .. .. ..<br />
33 Cyprus 57 52 66 67 70 58 64 5.4 17 25 85 27 40 20<br />
33 Malta 80 83 83 80 77 92 89 6.6 55 28 87 51 64 73<br />
33 Qatar 72 c 90 d 86 73 92 c 89 c 91 c 6.4 66 c 19 c 92 c .. 91 c ..<br />
36 Poland 67 47 68 44 66 73 73 6.0 25 9 86 42 51 21<br />
37 Lithuania 59 53 34 50 53 57 59 5.7 16 11 85 38 55 37<br />
38 Chile 41 34 81 74 55 69 74 6.8 41 16 84 23 40 40<br />
38 Saudi Arabia 70 74 81 61 .. 79 84 6.3 64 15 85 .. 71 ..<br />
40 Slovakia 66 52 59 61 62 54 47 6.2 12 11 81 26 38 28<br />
41 Portugal 70 57 54 71 69 78 80 5.1 21 17 87 35 55 22<br />
42 United Arab Emirates 70 84 81 70 90 e 94 91 6.6 59 22 89 .. 93 ..<br />
43 Hungary 55 53 56 71 53 52 50 5.3 23 9 80 42 46 28<br />
44 Latvia 62 52 47 41 62 63 59 5.9 20 11 86 37 54 30<br />
45 Argentina 62 57 79 69 43 86 87 6.7 32 20 77 33 50 38<br />
45 Croatia 63 56 51 42 69 64 68 5.2 20 10 73 46 46 36<br />
47 Bahrain 70 82 75 69 60 d 85 86 5.8 41 15 d 88 .. 69 ..<br />
48 Montenegro 65 47 41 50 77 60 56 5.1 16 8 64 44 37 40<br />
49 Russian Federation 51 34 49 48 53 63 60 6.0 18 12 78 36 27 65<br />
50 Romania 64 65 49 41 55 74 80 5.8 22 7 80 40 28 25<br />
51 Kuwait 53 75 81 69 .. 82 78 6.2 47 15 84 .. 66 ..<br />
HIGH HUMAN DEVELOPMENT<br />
52 Belarus 55 40 47 46 58 58 55 5.7 11 22 78 46 51 52<br />
52 Oman 70 d 78 d 87 d .. .. 92 d 90 d 6.9 d 69 d 22 d 90 d .. .. ..<br />
54 Barbados .. .. .. .. .. .. .. .. .. .. .. .. .. ..<br />
54 Uruguay 55 69 77 63 46 90 88 6.6 17 21 77 50 63 55<br />
56 Bulgaria 42 38 37 51 54 53 53 4.4 13 4 77 19 22 14<br />
56 Kazakhstan 65 48 69 48 63 68 74 5.9 38 14 77 57 45 82<br />
58 Bahamas .. .. .. .. .. .. .. .. .. .. .. .. .. ..<br />
250 | HUMAN DEVELOPMENT REPORT <strong>2016</strong>
HUMAN DEVELOPMENT REPORT <strong>2016</strong><br />
<strong>Human</strong> <strong>Development</strong> for Everyone<br />
Perceptions of individual well-being Perceptions about community Perceptions about government<br />
Education<br />
quality<br />
(%<br />
satisfied)<br />
Health<br />
care<br />
quality<br />
(%<br />
satisfied)<br />
Standard<br />
of living<br />
(%<br />
satisfied)<br />
Ideal<br />
job<br />
(%<br />
answering<br />
yes)<br />
Feeling<br />
safe<br />
(%<br />
answering<br />
yes)<br />
Freedom of<br />
choice<br />
Overall life<br />
satisfaction,<br />
index<br />
(% satisfied) (0, least<br />
Female Male<br />
satisfied,<br />
to 10, most<br />
satisfied)<br />
Local<br />
labour<br />
market<br />
(%<br />
answering<br />
good)<br />
Volunteered<br />
Confidence Actions to<br />
in judicial preserve the<br />
Trust in<br />
national<br />
time Community system environment government<br />
(%<br />
answering<br />
yes)<br />
(%<br />
answering<br />
yes)<br />
(%<br />
answering<br />
yes)<br />
(% satisfied)<br />
(%<br />
answering<br />
yes)<br />
HDI rank 2014–2015 a 2014–2015 a 2014–2015 a 2014–2015 a 2014–2015 a 2014–2015 a 2014–2015 a 2014–2015 a 2014–2015 a 2014–2015 a 2014–2015 a 2014–2015 a 2014–2015 a 2014–2015 a<br />
59 Malaysia 75 78 75 76 44 62 71 6.3 54 33 78 55 62 44<br />
60 Palau .. .. .. .. .. .. .. .. .. .. .. .. .. ..<br />
60 Panama 66 53 75 76 50 80 84 6.6 47 32 80 38 46 38<br />
62 Antigua and Barbuda .. .. .. .. .. .. .. .. .. .. .. .. .. ..<br />
63 Seychelles .. .. .. .. .. .. .. .. .. .. .. .. .. ..<br />
64 Mauritius 81 78 71 74 64 81 80 5.6 31 34 90 61 75 56<br />
65 Trinidad and Tobago 64 b 54 b 54 b 56 57 b 82 b 83 b 6.2 b 43 b 37 b 75 b 33 b 34 b 38 b<br />
66 Costa Rica 80 65 81 80 48 90 89 6.9 20 23 78 40 55 26<br />
66 Serbia 58 49 37 45 68 48 51 5.3 7 5 67 36 28 39<br />
68 Cuba .. .. .. .. .. .. .. .. .. .. .. .. .. ..<br />
69 Iran (Islamic Republic of) 56 44 62 72 .. .. .. 4.7 18 21 69 .. 58 75<br />
70 Georgia 66 59 24 33 73 56 61 4.1 5 18 74 37 30 25<br />
71 Turkey 51 71 65 61 60 60 67 5.5 31 5 b 75 43 44 49<br />
71 Venezuela (Bolivarian Republic of) 61 40 54 78 22 56 57 6.1 22 11 73 22 27 20<br />
73 Sri Lanka 79 81 73 73 74 87 88 4.6 59 49 90 77 75 74<br />
74 Saint Kitts and Nevis .. .. .. .. .. .. .. .. .. .. .. .. .. ..<br />
75 Albania 60 54 43 32 61 66 72 4.6 18 11 63 28 36 51<br />
76 Lebanon 72 54 55 64 60 57 60 5.2 20 10 76 29 24 19<br />
77 Mexico 55 43 65 72 40 72 69 6.2 41 13 72 29 44 26<br />
78 Azerbaijan 54 38 53 45 76 72 65 5.1 32 17 76 42 54 79<br />
79 Brazil 46 33 75 76 36 70 71 7.0 44 13 66 41 41 36<br />
79 Grenada .. .. .. .. .. .. .. .. .. .. .. .. .. ..<br />
81 Bosnia and Herzegovina 59 53 49 47 72 57 60 5.1 11 4 67 33 24 19<br />
82 The former Yugoslav Republic of Macedonia 53 57 47 56 65 60 63 5.0 22 7 68 30 42 37<br />
83 Algeria 70 47 72 51 53 c 57 c 56 c 6.4 43 8 c 83 c .. 48 c ..<br />
84 Armenia 52 39 27 30 84 53 47 4.3 12 6 56 27 30 17<br />
84 Ukraine 50 22 17 39 44 34 43 4.0 9 16 76 4 13 8<br />
86 Jordan 54 72 67 62 80 77 74 5.4 32 11 73 .. 62 ..<br />
87 Peru 54 37 68 67 40 76 81 5.6 42 26 69 15 54 18<br />
87 Thailand 90 89 83 80 69 88 85 6.2 57 17 92 64 86 66<br />
89 Ecuador 74 59 78 77 52 79 79 6.0 32 16 82 42 70 52<br />
90 China 64 b 65 b 74 51 75 b 76 b 77 b 5.3 38 b 4 78 b .. 63 b ..<br />
91 Fiji .. .. .. .. .. .. .. .. .. .. .. .. .. ..<br />
92 Mongolia 54 42 58 74 52 60 68 5.0 9 39 77 33 30 23<br />
92 Saint Lucia .. .. .. .. .. .. .. .. .. .. .. .. .. ..<br />
94 Jamaica 65 53 42 50 65 82 79 5.3 22 38 59 29 35 28<br />
95 Colombia 62 43 70 69 47 80 77 6.4 36 19 77 22 45 27<br />
96 Dominica .. .. .. .. .. .. .. .. .. .. .. .. .. ..<br />
97 Suriname 82 c 78 c 64 c 70 60 c 85 c 88 c 6.3 c 34 c 22 c 90 c 71 c 65 c 72 c<br />
97 Tunisia 30 38 61 55 62 65 71 5.1 19 11 67 56 30 48<br />
99 Dominican Republic 84 57 70 56 38 89 91 5.4 31 35 74 31 61 56<br />
99 Saint Vincent and the Grenadines .. .. .. .. .. .. .. .. .. .. .. .. .. ..<br />
101 Tonga .. .. .. .. .. .. .. .. .. .. .. .. .. ..<br />
102 Libya 33 c .. .. 62 .. 67 c 70 c 5.8 c 49 c 37 c 72 c .. 37 c ..<br />
103 Belize 62 50 66 .. 50 88 84 6.0 40 26 74 37 62 38<br />
104 Samoa .. .. .. .. .. .. .. .. .. .. .. .. .. ..<br />
105 Maldives .. .. .. .. .. .. .. .. .. .. .. .. .. ..<br />
105 Uzbekistan 90 92 78 66 83 97 98 6.0 75 27 96 .. 92 ..<br />
MEDIUM HUMAN DEVELOPMENT<br />
107 Moldova (Republic of) 55 40 44 32 45 55 53 6.0 9 17 71 22 24 17<br />
108 Botswana 63 62 26 48 40 86 84 3.8 28 21 58 83 79 82<br />
109 Gabon 34 25 39 46 35 65 68 4.7 37 12 47 49 49 37<br />
110 Paraguay 64 43 75 79 42 81 76 5.6 28 19 90 16 31 18<br />
111 Egypt 52 43 78 58 84 65 65 4.8 33 4 76 76 44 77<br />
111 Turkmenistan 77 d 64 d 81 76 73 55 47 5.8 77 60 88 .. 80 ..<br />
113 Indonesia 81 76 68 76 79 74 74 5.0 49 50 85 53 56 65<br />
114 Palestine, State of 73 60 54 56 64 52 58 4.7 13 9 75 45 37 45<br />
115 Viet Nam 83 69 78 65 61 80 b 82 b 5.1 42 19 83 66 b 60 81 b<br />
116 Philippines 81 84 78 87 62 91 92 5.5 71 42 87 58 86 67<br />
117 El Salvador 70 59 72 78 36 71 74 6.0 27 28 76 31 40 31<br />
TABLE<br />
14<br />
TABLE 14 Supplementary indicators: perceptions of well-being | 251
TABLE 14 SUPPLEMENTARY INDICATORS: PERCEPTIONS OF WELL-BEING<br />
Perceptions of individual well-being Perceptions about community Perceptions about government<br />
Education<br />
quality<br />
(%<br />
satisfied)<br />
Health<br />
care<br />
quality<br />
(%<br />
satisfied)<br />
Standard<br />
of living<br />
(%<br />
satisfied)<br />
Ideal<br />
job<br />
(%<br />
answering<br />
yes)<br />
Feeling<br />
safe<br />
(%<br />
answering<br />
yes)<br />
Freedom of<br />
choice<br />
Overall life<br />
satisfaction,<br />
index<br />
(% satisfied) (0, least<br />
Female Male<br />
satisfied,<br />
to 10, most<br />
satisfied)<br />
Local<br />
labour<br />
market<br />
(%<br />
answering<br />
good)<br />
Volunteered<br />
Confidence Actions to<br />
in judicial preserve the<br />
Trust in<br />
national<br />
time Community system environment government<br />
(%<br />
answering<br />
yes)<br />
(%<br />
answering<br />
yes)<br />
(%<br />
answering<br />
yes)<br />
(% satisfied)<br />
(%<br />
answering<br />
yes)<br />
TABLE<br />
14<br />
HDI rank 2014–2015 a 2014–2015 a 2014–2015 a 2014–2015 a 2014–2015 a 2014–2015 a 2014–2015 a 2014–2015 a 2014–2015 a 2014–2015 a 2014–2015 a 2014–2015 a 2014–2015 a 2014–2015 a<br />
118 Bolivia (Plurinational State of) 66 39 74 76 44 87 87 5.8 50 21 82 23 63 49<br />
119 South Africa 74 59 42 51 40 83 88 4.9 36 28 53 69 53 58<br />
120 Kyrgyzstan 62 65 78 55 51 78 80 4.9 47 29 88 40 52 58<br />
121 Iraq 42 44 66 64 61 60 58 4.5 26 17 63 40 40 44<br />
122 Cabo Verde .. .. .. .. .. .. .. .. .. .. .. .. .. ..<br />
123 Morocco 34 27 76 40 66 58 65 5.2 18 5 75 28 45 38 b<br />
124 Nicaragua 84 55 72 76 56 80 81 5.9 44 23 84 46 65 60<br />
125 Guatemala 70 49 70 77 51 85 84 6.5 32 36 84 41 56 27<br />
125 Namibia 71 58 43 .. 44 85 85 4.6 46 21 67 68 64 78<br />
127 Guyana .. .. .. .. .. .. .. .. .. .. .. .. .. ..<br />
127 Micronesia (Federated States of) .. .. .. .. .. .. .. .. .. .. .. .. .. ..<br />
129 Tajikistan 76 65 81 67 84 79 80 5.1 47 19 93 .. 62 ..<br />
130 Honduras 67 47 69 78 48 49 57 4.8 25 41 86 30 53 30<br />
131 India 76 62 63 80 69 72 78 4.3 39 21 78 74 56 69<br />
132 Bhutan 93 86 89 88 63 83 79 5.1 51 39 93 97 99 95<br />
133 Timor-Leste .. .. .. .. .. .. .. .. .. .. .. .. .. ..<br />
134 Vanuatu .. .. .. .. .. .. .. .. .. .. .. .. .. ..<br />
135 Congo 51 33 45 55 52 85 82 4.7 43 15 62 56 52 50<br />
135 Equatorial Guinea .. .. .. .. .. .. .. .. .. .. .. .. .. ..<br />
137 Kiribati .. .. .. .. .. .. .. .. .. .. .. .. .. ..<br />
138 Lao People’s Democratic Republic 73 c 66 c 73 c 80 75 c 87 d 87 d 4.9 c 66 c 20 c 94 d .. 90 d ..<br />
139 Bangladesh 85 61 80 85 80 74 75 4.6 42 14 90 76 59 76<br />
139 Ghana 61 48 34 59 78 82 83 4.0 22 26 52 62 39 44<br />
139 Zambia 62 45 30 53 36 79 82 4.3 39 29 47 59 44 61<br />
142 Sao Tome and Principe .. .. .. .. .. .. .. .. .. .. .. .. .. ..<br />
143 Cambodia 88 81 80 80 45 96 95 4.2 73 15 89 .. 92 ..<br />
144 Nepal 72 56 65 87 60 77 69 4.8 50 36 86 58 61 47<br />
145 Myanmar 73 65 64 52 79 82 77 4.2 53 55 91 .. 64 ..<br />
146 Kenya 69 56 47 63 54 76 82 4.4 47 41 64 66 65 75<br />
147 Pakistan 65 41 63 74 58 59 58 4.8 26 11 84 59 44 46<br />
LOW HUMAN DEVELOPMENT<br />
148 Swaziland 77 d 58 d 45 d 56 42 d 62 d 60 d 4.9 d 25 d 27 d 62 d 56 d 56 d 35 d<br />
149 Syrian Arab Republic 24 38 20 28 32 32 45 3.5 17 20 36 .. 38 ..<br />
150 Angola 46 29 35 60 46 30 37 3.8 43 17 50 44 37 57<br />
151 Tanzania (United Republic of) 42 27 27 60 64 72 79 3.7 47 15 64 64 47 68<br />
152 Nigeria 55 48 36 48 61 71 65 4.9 39 25 62 56 33 41<br />
153 Cameroon 58 44 53 56 50 77 78 5.0 46 24 65 52 56 61<br />
154 Papua New Guinea .. .. .. .. .. .. .. .. .. .. .. .. .. ..<br />
154 Zimbabwe 71 59 39 52 57 67 64 3.7 17 17 61 67 49 59<br />
156 Solomon Islands .. .. .. .. .. .. .. .. .. .. .. .. .. ..<br />
157 Mauritania 37 26 63 52 45 50 36 3.9 42 22 69 30 31 29<br />
158 Madagascar 51 34 25 56 46 52 57 3.6 41 22 75 48 36 48<br />
159 Rwanda 77 70 35 63 82 90 91 3.5 38 14 61 .. 93 ..<br />
160 Comoros 49 c 24 c 38 c 64 72 c 50 c 57 c 4.0 c 30 c 18 c 75 c 34 c 39 c 46 c<br />
160 Lesotho 40 d 21 d 27 d 41 38 d 61 d 62 d 4.9 d 21 d 16 d 52 d 64 d 23 d 40 d<br />
162 Senegal 36 32 30 43 52 69 75 4.6 34 13 59 77 34 62<br />
163 Haiti 37 20 23 31 49 38 40 3.6 20 26 42 20 29 30<br />
163 Uganda 47 38 35 53 46 83 81 3.8 31 24 52 36 52 58<br />
165 Sudan 28 22 52 51 71 25 29 4.1 18 23 50 65 d 11 ..<br />
166 Togo 35 22 28 43 56 74 72 3.8 38 19 46 50 46 50<br />
167 Benin 38 34 32 51 45 73 70 3.6 41 18 52 55 46 51<br />
168 Yemen 44 21 51 47 57 60 63 4.0 14 3 78 29 27 34<br />
169 Afghanistan 52 32 32 87 34 45 51 3.1 19 9 78 27 41 41<br />
170 Malawi 56 47 39 48 39 81 79 3.9 44 32 69 54 63 57<br />
171 Côte d’Ivoire 55 38 31 50 58 81 76 4.4 52 7 59 58 56 64<br />
172 Djibouti 67 d 49 d 63 d 59 72 d 76 d 70 d 4.4 d 55 d 8 d 75 d 57 d 58 d 68 d<br />
173 Gambia .. .. .. .. .. .. .. .. .. .. .. .. .. ..<br />
174 Ethiopia 80 59 61 65 67 76 79 4.6 52 18 71 72 76 83<br />
175 Mali 34 30 35 62 64 62 68 4.0 58 5 62 45 32 62<br />
176 Congo (Democratic Republic of the) 40 29 26 49 43 49 59 3.9 26 12 43 37 33 27<br />
252 | HUMAN DEVELOPMENT REPORT <strong>2016</strong>
HUMAN DEVELOPMENT REPORT <strong>2016</strong><br />
<strong>Human</strong> <strong>Development</strong> for Everyone<br />
Perceptions of individual well-being Perceptions about community Perceptions about government<br />
Education<br />
quality<br />
(%<br />
satisfied)<br />
Health<br />
care<br />
quality<br />
(%<br />
satisfied)<br />
Standard<br />
of living<br />
(%<br />
satisfied)<br />
Ideal<br />
job<br />
(%<br />
answering<br />
yes)<br />
Feeling<br />
safe<br />
(%<br />
answering<br />
yes)<br />
Freedom of<br />
choice<br />
Overall life<br />
satisfaction,<br />
index<br />
(% satisfied) (0, least<br />
Female Male<br />
satisfied,<br />
to 10, most<br />
satisfied)<br />
Local<br />
labour<br />
market<br />
(%<br />
answering<br />
good)<br />
Volunteered<br />
Confidence Actions to<br />
in judicial preserve the<br />
Trust in<br />
national<br />
time Community system environment government<br />
(%<br />
answering<br />
yes)<br />
(%<br />
answering<br />
yes)<br />
(%<br />
answering<br />
yes)<br />
(% satisfied)<br />
(%<br />
answering<br />
yes)<br />
HDI rank 2014–2015 a 2014–2015 a 2014–2015 a 2014–2015 a 2014–2015 a 2014–2015 a 2014–2015 a 2014–2015 a 2014–2015 a 2014–2015 a 2014–2015 a 2014–2015 a 2014–2015 a 2014–2015 a<br />
177 Liberia 36 40 29 31 48 58 65 2.7 39 34 48 47 21 47<br />
178 Guinea-Bissau .. .. .. .. .. .. .. .. .. .. .. .. .. ..<br />
179 Eritrea .. .. .. .. .. .. .. .. .. .. .. .. .. ..<br />
179 Sierra Leone 40 37 46 49 55 59 60 4.9 33 28 69 54 38 65<br />
181 Mozambique 65 d 47 d 38 d 59 42 d 63 d 64 d 5.0 d 45 d 17 d 83 d 62 d 55 d 63 d<br />
181 South Sudan 33 21 25 .. 44 51 55 3.8 23 24 48 43 30 45<br />
183 Guinea 37 29 38 53 50 62 63 3.5 45 20 64 47 36 61<br />
184 Burundi 54 37 26 60 43 47 39 2.9 10 10 47 .. 41 ..<br />
185 Burkina Faso 54 33 31 50 57 61 68 4.4 49 19 60 59 49 67<br />
186 Chad 49 26 43 70 51 57 55 3.5 38 9 62 30 53 37<br />
187 Niger 54 33 55 62 83 71 72 3.7 52 14 63 72 54 58<br />
188 Central African Republic 39 d 23 d 34 d 62 60 d 75 d 80 d 3.7 d 36 d 15 d 76 d 67 d 69 d 78 d<br />
OTHER COUNTRIES OR TERRITORIES<br />
Korea (Democratic People’s Rep. of) .. .. .. .. .. .. .. .. .. .. .. .. .. ..<br />
Marshall Islands .. .. .. .. .. .. .. .. .. .. .. .. .. ..<br />
Monaco .. .. .. .. .. .. .. .. .. .. .. .. .. ..<br />
Nauru .. .. .. .. .. .. .. .. .. .. .. .. .. ..<br />
San Marino .. .. .. .. .. .. .. .. .. .. .. .. .. ..<br />
Somalia 70 47 68 .. 85 96 96 5.4 39 21 93 58 92 78<br />
Tuvalu .. .. .. .. .. .. .. .. .. .. .. .. .. ..<br />
<strong>Human</strong> development groups<br />
Very high human development 64 68 71 64 68 79 78 6.5 35 27 82 52 53 42<br />
High human development 62 59 71 62 65 73 75 5.6 38 9 77 .. 57 ..<br />
Medium human development 74 61 66 76 68 73 76 4.6 40 24 79 67 56 66<br />
Low human development 51 39 38 57 55 63 65 4.2 37 18 61 53 44 53<br />
Developing countries 66 57 64 70 65 72 74 5.0 39 17 76 58 55 58<br />
Regions<br />
Arab States 49 44 67 52 68 60 63 5.1 32 12 72 55 44 ..<br />
East Asia and the Pacific .. .. .. .. .. .. .. .. .. .. .. .. .. ..<br />
Europe and Central Asia 60 57 55 50 62 61 66 5.2 32 14 78 34 45 42<br />
Latin America and the Caribbean 55 41 70 73 40 73 73 6.4 38 17 72 32 45 32<br />
South Asia 74 59 64 79 68 71 75 4.4 37 20 80 71 55 67<br />
Sub-Saharan Africa 56 43 38 58 55 69 71 4.3 40 21 60 57 48 56<br />
Least developed countries 59 44 49 68 61 66 68 4.2 40 19 70 57 51 60<br />
Small island developing states .. .. .. .. .. .. .. .. .. .. .. .. .. ..<br />
Organisation for Economic<br />
Co‐operation and <strong>Development</strong> 63 69 73 67 68 78 78 6.5 37 27 81 51 54 38<br />
World 65 59 65 68 66 73 75 5.2 38 19 77 57 54 54<br />
NOTES<br />
a Data refer to the most recent year available<br />
during the period specified.<br />
b Refers to 2013.<br />
c Refers to 2012.<br />
d Refers to 2011.<br />
e Refers to 2010.<br />
DEFINITIONS<br />
Satisfaction with education quality: Percentage<br />
of respondents answering “satisfied” to the Gallup<br />
World Poll question, “Are you satisfied or dissatisfied<br />
with the education system or the schools?”<br />
Satisfaction with health care quality: Percentage<br />
of respondents answering “satisfied” to the Gallup<br />
World Poll question, “Are you satisfied or dissatisfied<br />
with the availability of quality healthcare?”<br />
Satisfaction with standard of living: Percentage<br />
of respondents answering “satisfied” to the<br />
Gallup World Poll question, “Are you satisfied or<br />
dissatisfied with your standard of living, all the<br />
things you can buy and do?”<br />
Ideal job: Percentage of employed respondents<br />
answering “yes” to the Gallup World Poll question,<br />
“Would you say that your job is the ideal job for<br />
you, or not?”<br />
Feeling safe: Percentage of respondents answering<br />
“yes” to the Gallup World Poll question, “Do you<br />
feel safe walking alone at night in the city or area<br />
where you live?”<br />
Satisfaction with freedom of choice: Percentage<br />
of respondents answering “satisfied” to the Gallup<br />
World Poll question, “In this country, are you<br />
satisfied or dissatisfied with your freedom to choose<br />
what you do with your life?”<br />
Overall life satisfaction, index: Average response<br />
to the Gallup World Poll question, “Please imagine a<br />
ladder, with steps numbered from zero at the bottom<br />
to ten at the top. Suppose we say that the top of<br />
the ladder represents the best possible life for you,<br />
and the bottom of the ladder represents the worst<br />
possible life for you. On which step of the ladder<br />
would you say you personally feel you stand at this<br />
time, assuming that the higher the step the better<br />
you feel about your life, and the lower the step the<br />
worse you feel about it? Which step comes closest<br />
to the way you feel?”<br />
Perception of local labour market: Percentage of<br />
respondents answering “good” to the Gallup World<br />
Poll question, “Thinking about the job situation in the<br />
city or area where you live today, would you say that<br />
it is now a good time or a bad time to find a job?”<br />
Volunteered time: Percentage of respondents<br />
answering “yes” to the Gallup World Poll question,<br />
“In the past month have you volunteered your time<br />
to an organization?”<br />
Satisfaction with community: Percentage of<br />
respondents answering “yes” to the Gallup World<br />
Poll question, “Are you satisfied or dissatisfied with<br />
the city or area where you live?”<br />
Confidence in judicial system: Percentage<br />
of respondents answering “yes” to the Gallup<br />
World Poll question, “In this country, do you have<br />
confidence in the judicial system and courts?”<br />
Satisfaction with actions to preserve the<br />
environment: Percentage of respondents answering<br />
“satisfied” to Gallup World Poll question, “In this<br />
country, are you satisfied or dissatisfied with the<br />
efforts to preserve the environment?”<br />
Trust in national government: Percentage<br />
of respondents answering “yes” to the Gallup<br />
World Poll question, “In this country, do you have<br />
confidence in the national government?”<br />
MAIN DATA SOURCES<br />
Columns 1–14: Gallup (<strong>2016</strong>).<br />
TABLE<br />
14<br />
TABLE 14 Supplementary indicators: perceptions of well-being | 253
TABLE<br />
15<br />
Status of fundamental human rights treaties<br />
TABLE<br />
15<br />
Country<br />
ICERD:<br />
International<br />
Convention on<br />
the Elimination<br />
of All Forms<br />
of Racial<br />
Discrimination,<br />
1965<br />
Entry into force:<br />
4 January<br />
1969<br />
Year of<br />
ratification<br />
ICCPR:<br />
International<br />
Covenant<br />
on Civil and<br />
Political<br />
Rights, 1966<br />
Entry into force:<br />
23 March<br />
1969<br />
Year of<br />
ratification<br />
ICESCR:<br />
International<br />
Covenant on<br />
Economic,<br />
Social and<br />
Cultural<br />
Rights, 1966<br />
Entry into force:<br />
3 January<br />
1976<br />
Year of<br />
ratification<br />
CEDAW:<br />
Convention on<br />
the Elimination<br />
of All Forms of<br />
Discrimination<br />
against<br />
Women, 1979<br />
Entry into force:<br />
3 September<br />
1981<br />
Year of<br />
ratification<br />
CAT:<br />
Convention<br />
against Torture<br />
and Other<br />
Cruel, Inhuman<br />
or Degrading<br />
Treatment or<br />
Punishment,<br />
1984<br />
Entry into force:<br />
26 June<br />
1987<br />
Year of<br />
ratification<br />
CRC:<br />
Convention on<br />
the Rights of<br />
the Child, 1989<br />
Entry into force:<br />
2 September<br />
1990<br />
Year of<br />
ratification<br />
ICMW:<br />
International<br />
Convention on<br />
the Protection<br />
of the Rights<br />
of All Migrant<br />
Workers and<br />
Members of<br />
Their Families,<br />
1990<br />
Entry into force:<br />
1 July<br />
2003<br />
Year of<br />
ratification<br />
CRC-AC:<br />
Optional<br />
Protocol to the<br />
Convention on<br />
the Rights of<br />
the Child on the<br />
involvement<br />
of children<br />
in armed<br />
conflict, 2000<br />
Entry into force:<br />
12 February<br />
2002<br />
Year of<br />
ratification<br />
CRC-SC:<br />
Optional<br />
Protocol to the<br />
Convention<br />
on the Rights<br />
of the Child<br />
on the sale of<br />
children, child<br />
prostitution<br />
and child,<br />
pornography,<br />
2000<br />
Entry into force:<br />
18 January<br />
2002<br />
Year of<br />
ratification<br />
ICPED:<br />
International<br />
Convention for<br />
the Protection<br />
of All Persons<br />
from Enforced<br />
Disappearance,<br />
2006<br />
Entry into force:<br />
23 December<br />
2010<br />
Year of<br />
ratification<br />
CRPD:<br />
Convention on<br />
the Rights of<br />
Persons with<br />
Disabilities,<br />
2006<br />
Afghanistan 1983 1983 1983 2003 1987 1994 2003 2002 2012<br />
Albania 1994 1991 1991 1994 1994 1992 2007 2008 2008 2007 2013<br />
Algeria 1972 1989 1989 1996 1989 1993 2005 2009 2006 2009<br />
Andorra 2006 2006 1997 2006 1996 2001 2001 2014<br />
Angola 1992 1992 1986 1990 2007 2005 2014<br />
Antigua and Barbuda 1988 1989 1993 1993 2002<br />
Argentina 1968 1986 1986 1985 1986 1990 2007 2002 2003 2007 2008<br />
Armenia 1993 1993 1993 1993 1993 1993 2005 2005 2011 2010<br />
Australia 1975 1980 1975 1983 1989 1990 2006 2007 2008<br />
Austria 1972 1978 1978 1982 1987 1992 2002 2004 2012 2008<br />
Azerbaijan 1996 1992 1992 1995 1996 1992 1999 2002 2002 2009<br />
Bahamas 1975 2008 2008 1993 1991 2015 2015 2015<br />
Bahrain 1990 2006 2007 2002 1998 1992 2004 2004 2011<br />
Bangladesh 1979 2000 1998 1984 1998 1990 2011 2000 2000 2007<br />
Barbados 1972 1973 1973 1980 1990 2013<br />
Belarus 1969 1973 1973 1981 1987 1990 2006 2002<br />
Belgium 1975 1983 1983 1985 1999 1991 2002 2006 2011 2009<br />
Belize 2001 1996 2015 1990 1986 1990 2001 2003 2003 2015 2011<br />
Benin 2001 1992 1992 1992 1992 1990 2005 2005 2012<br />
Bhutan 1981 1990 2009 2009<br />
Bolivia (Plurinational State of) 1970 1982 1982 1990 1999 1990 2000 2004 2003 2008 2009<br />
Bosnia and Herzegovina 1993 1993 1993 1993 1993 1993 1996 2003 2002 2012 2010<br />
Botswana 1974 2000 1996 2000 1995 2004 2003<br />
Brazil 1968 1992 1992 1984 1989 1990 2004 2004 2010 2008<br />
Brunei Darussalam 2006 1995 2006<br />
Bulgaria 1966 1970 1970 1982 1986 1991 2002 2002 2012<br />
Burkina Faso 1974 1999 1999 1987 1999 1990 2003 2007 2006 2009 2009<br />
Burundi 1977 1990 1990 1992 1993 1990 2008 2007 2014<br />
Cabo Verde 1979 1993 1993 1980 1992 1992 1997 2002 2002 2011<br />
Cambodia 1983 1992 1992 1992 1992 1992 2004 2002 2013 2012<br />
Cameroon 1971 1984 1984 1994 1986 1993 2013<br />
Canada 1970 1976 1976 1981 1987 1991 2000 2005 2010<br />
Central African Republic 1971 1981 1981 1991 1992 2012<br />
Chad 1977 1995 1995 1995 1995 1990 2002 2002<br />
Chile 1971 1972 1972 1989 1988 1990 2005 2003 2003 2009 2008<br />
China 1981 2001 1980 1988 1992 2008 2002 2008<br />
Colombia 1981 1969 1969 1982 1987 1991 1995 2005 2003 2012 2011<br />
Comoros 2004 1994 1993 2007<br />
Congo 1988 1983 1983 1982 2003 1993 2010 2009 2014<br />
Congo (Democratic Republic of the) 1976 1976 1976 1986 1996 1990 2001 2001 2015<br />
Costa Rica 1967 1968 1968 1986 1993 1990 2003 2002 2012 2008<br />
Côte d’Ivoire 1973 1992 1992 1995 1995 1991 2012 2011 2014<br />
Croatia 1992 1992 1992 1992 1992 1992 2002 2002 2007<br />
Cuba 1972 1980 1995 1991 2007 2001 2009 2007<br />
Cyprus 1967 1969 1969 1985 1991 1991 2010 2006 2011<br />
Czech Republic 1993 1993 1993 1993 1993 1993 2001 2013 2009<br />
Denmark 1971 1972 1972 1983 1987 1991 2002 2003 2009<br />
Djibouti 2011 2002 2002 1998 2002 1990 2011 2011 2012<br />
Dominica 1993 1993 1980 1991 2002 2002 2012<br />
Dominican Republic 1983 1978 1978 1982 2012 1991 2014 2006 2009<br />
Ecuador 1966 1969 1969 1981 1988 1990 2002 2004 2004 2009 2008<br />
Egypt 1967 1982 1982 1981 1986 1990 1993 2007 2002 2008<br />
El Salvador 1979 1979 1979 1981 1996 1990 2003 2002 2004 2007<br />
Equatorial Guinea 2002 1987 1987 1984 2002 1992 2003<br />
Eritrea 2001 2002 2001 1995 2014 1994 2005 2005<br />
Estonia 1991 1991 1991 1991 1991 1991 2014 2004 2012<br />
Entry into force:<br />
3 May<br />
2008<br />
Year of<br />
ratification<br />
254 | HUMAN DEVELOPMENT REPORT <strong>2016</strong>
HUMAN DEVELOPMENT REPORT <strong>2016</strong><br />
<strong>Human</strong> <strong>Development</strong> for Everyone<br />
Country<br />
ICERD:<br />
International<br />
Convention on<br />
the Elimination<br />
of All Forms<br />
of Racial<br />
Discrimination,<br />
1965<br />
Entry into force:<br />
4 January<br />
1969<br />
Year of<br />
ratification<br />
ICCPR:<br />
International<br />
Covenant<br />
on Civil and<br />
Political<br />
Rights, 1966<br />
Entry into force:<br />
23 March<br />
1969<br />
Year of<br />
ratification<br />
ICESCR:<br />
International<br />
Covenant on<br />
Economic,<br />
Social and<br />
Cultural<br />
Rights, 1966<br />
Entry into force:<br />
3 January<br />
1976<br />
Year of<br />
ratification<br />
CEDAW:<br />
Convention on<br />
the Elimination<br />
of All Forms of<br />
Discrimination<br />
against<br />
Women, 1979<br />
Entry into force:<br />
3 September<br />
1981<br />
Year of<br />
ratification<br />
CAT:<br />
Convention<br />
against Torture<br />
and Other<br />
Cruel, Inhuman<br />
or Degrading<br />
Treatment or<br />
Punishment,<br />
1984<br />
Entry into force:<br />
26 June<br />
1987<br />
Year of<br />
ratification<br />
CRC:<br />
Convention on<br />
the Rights of<br />
the Child, 1989<br />
Entry into force:<br />
2 September<br />
1990<br />
Year of<br />
ratification<br />
ICMW:<br />
International<br />
Convention on<br />
the Protection<br />
of the Rights<br />
of All Migrant<br />
Workers and<br />
Members of<br />
Their Families,<br />
1990<br />
Entry into force:<br />
1 July<br />
2003<br />
Year of<br />
ratification<br />
CRC-AC:<br />
Optional<br />
Protocol to the<br />
Convention on<br />
the Rights of<br />
the Child on the<br />
involvement<br />
of children<br />
in armed<br />
conflict, 2000<br />
Entry into force:<br />
12 February<br />
2002<br />
Year of<br />
ratification<br />
CRC-SC:<br />
Optional<br />
Protocol to the<br />
Convention<br />
on the Rights<br />
of the Child<br />
on the sale of<br />
children, child<br />
prostitution<br />
and child,<br />
pornography,<br />
2000<br />
Entry into force:<br />
18 January<br />
2002<br />
Year of<br />
ratification<br />
ICPED:<br />
International<br />
Convention for<br />
the Protection<br />
of All Persons<br />
from Enforced<br />
Disappearance,<br />
2006<br />
Entry into force:<br />
23 December<br />
2010<br />
Year of<br />
ratification<br />
CRPD:<br />
Convention on<br />
the Rights of<br />
Persons with<br />
Disabilities,<br />
2006<br />
Ethiopia 1976 1993 1993 1981 1994 1991 2014 2014 2010<br />
Fiji 1973 1995 1993<br />
Finland 1970 1975 1975 1986 1989 1991 2002 2012<br />
France 1971 1980 1980 1983 1986 1990 2003 2003 2008 2010<br />
Gabon 1980 1983 1983 1983 2000 1994 2010 2007 2011 2007<br />
Gambia 1978 1979 1978 1993 1990 2010 2015<br />
Georgia 1999 1994 1994 1994 1994 1994 2010 2005 2014<br />
Germany 1969 1973 1973 1985 1990 1992 2004 2009 2009 2009<br />
Ghana 1966 2000 2000 1986 2000 1990 2000 2014 2012<br />
Greece 1970 1997 1985 1983 1988 1993 2003 2008 2015 2012<br />
Grenada 2013 1991 1991 1990 1990 2012 2012 2014<br />
Guatemala 1983 1992 1988 1982 1990 1990 2003 2002 2002 2009<br />
Guinea 1977 1978 1978 1982 1989 1990 2000 2011 2008<br />
Guinea-Bissau 2010 2010 1992 1985 2013 1990 2014 2010 2014<br />
Guyana 1977 1977 1977 1980 1988 1991 2010 2010 2010 2014<br />
Haiti 1972 1991 2013 1981 1995 2014 2009<br />
Holy See 1969 2002 1990 2001 2001<br />
Honduras 2002 1997 1981 1983 1996 1990 2005 2002 2002 2008 2008<br />
Hungary 1967 1974 1974 1980 1987 1991 2010 2010 2007<br />
Iceland 1967 1979 1979 1985 1996 1992 2001 2001<br />
India 1968 1979 1979 1993 1992 2005 2005 2007<br />
Indonesia 1999 2006 2006 1984 1998 1990 2012 2012 2012 2011<br />
Iran (Islamic Republic of) 1968 1975 1975 1994 2007 2009<br />
Iraq 1970 1971 1971 1986 2011 1994 2008 2008 2010 2013<br />
Ireland 2000 1989 1989 1985 2002 1992 2002<br />
Israel 1979 1991 1991 1991 1991 1991 2005 2008 2012<br />
Italy 1976 1978 1978 1985 1989 1991 2002 2002 2015 2009<br />
Jamaica 1971 1975 1975 1984 1991 2008 2002 2011 2007<br />
Japan 1995 1979 1979 1985 1999 1994 2004 2005 2009 2014<br />
Jordan 1974 1975 1975 1992 1991 1991 2007 2006 2008<br />
Kazakhstan 1998 2006 2006 1998 1998 1994 2003 2001 2009 2015<br />
Kenya 2001 1972 1972 1984 1997 1990 2002 2008<br />
Kiribati 2004 1995 2015 2015 2013<br />
Korea (Democratic People’s Rep. of) 1981 1981 2001 1990 2014<br />
Korea (Republic of) 1978 1990 1990 1984 1995 1991 2004 2004 2008<br />
Kuwait 1968 1996 1996 1994 1996 1991 2004 2004 2013<br />
Kyrgyzstan 1997 1994 1994 1997 1997 1994 2003 2003 2003<br />
Lao People’s Democratic Republic 1974 2009 2007 1981 2012 1991 2006 2006 2009<br />
Latvia 1992 1992 1992 1992 1992 1992 2005 2006 2010<br />
Lebanon 1971 1972 1972 1997 2000 1991 2004<br />
Lesotho 1971 1992 1992 1995 2001 1992 2005 2003 2003 2013 2008<br />
Liberia 1976 2004 2004 1984 2004 1993 2012<br />
Libya 1968 1970 1970 1989 1989 1993 2004 2004 2004<br />
Liechtenstein 2000 1998 1998 1995 1990 1995 2005 2013<br />
Lithuania 1998 1991 1991 1994 1996 1992 2003 2004 2013 2010<br />
Luxembourg 1978 1983 1983 1989 1987 1994 2004 2011 2011<br />
Madagascar 1969 1971 1971 1989 2005 1991 2015 2004 2004 2015<br />
Malawi 1996 1993 1993 1987 1996 1991 2010 2009 2009<br />
Malaysia 1995 1995 2012 2012 2010<br />
Maldives 1984 2006 2006 1993 2004 1991 2004 2002 2010<br />
Mali 1974 1974 1974 1985 1999 1990 2003 2002 2002 2009 2008<br />
Malta 1971 1990 1990 1991 1990 1990 2002 2010 2015 2012<br />
Marshall Islands 2006 1993 2015<br />
Mauritania 1988 2004 2004 2001 2004 1991 2007 2007 2012 2012<br />
Mauritius 1972 1973 1973 1984 1992 1990 2009 2011 2010<br />
Mexico 1975 1981 1981 1981 1986 1990 1999 2002 2002 2008 2007<br />
Entry into force:<br />
3 May<br />
2008<br />
Year of<br />
ratification<br />
TABLE<br />
15<br />
TABLE 15 Status of fundamental human rights treaties | 255
TABLE 15 STATUS OF FUNDAMENTAL HUMAN RIGHTS TREATIES<br />
TABLE<br />
15<br />
Country<br />
ICERD:<br />
International<br />
Convention on<br />
the Elimination<br />
of All Forms<br />
of Racial<br />
Discrimination,<br />
1965<br />
Entry into force:<br />
4 January<br />
1969<br />
Year of<br />
ratification<br />
ICCPR:<br />
International<br />
Covenant<br />
on Civil and<br />
Political<br />
Rights, 1966<br />
Entry into force:<br />
23 March<br />
1969<br />
Year of<br />
ratification<br />
ICESCR:<br />
International<br />
Covenant on<br />
Economic,<br />
Social and<br />
Cultural<br />
Rights, 1966<br />
Entry into force:<br />
3 January<br />
1976<br />
Year of<br />
ratification<br />
CEDAW:<br />
Convention on<br />
the Elimination<br />
of All Forms of<br />
Discrimination<br />
against<br />
Women, 1979<br />
Entry into force:<br />
3 September<br />
1981<br />
Year of<br />
ratification<br />
CAT:<br />
Convention<br />
against Torture<br />
and Other<br />
Cruel, Inhuman<br />
or Degrading<br />
Treatment or<br />
Punishment,<br />
1984<br />
Entry into force:<br />
26 June<br />
1987<br />
Year of<br />
ratification<br />
CRC:<br />
Convention on<br />
the Rights of<br />
the Child, 1989<br />
Entry into force:<br />
2 September<br />
1990<br />
Year of<br />
ratification<br />
ICMW:<br />
International<br />
Convention on<br />
the Protection<br />
of the Rights<br />
of All Migrant<br />
Workers and<br />
Members of<br />
Their Families,<br />
1990<br />
Entry into force:<br />
1 July<br />
2003<br />
Year of<br />
ratification<br />
CRC-AC:<br />
Optional<br />
Protocol to the<br />
Convention on<br />
the Rights of<br />
the Child on the<br />
involvement<br />
of children<br />
in armed<br />
conflict, 2000<br />
Entry into force:<br />
12 February<br />
2002<br />
Year of<br />
ratification<br />
CRC-SC:<br />
Optional<br />
Protocol to the<br />
Convention<br />
on the Rights<br />
of the Child<br />
on the sale of<br />
children, child<br />
prostitution<br />
and child,<br />
pornography,<br />
2000<br />
Entry into force:<br />
18 January<br />
2002<br />
Year of<br />
ratification<br />
ICPED:<br />
International<br />
Convention for<br />
the Protection<br />
of All Persons<br />
from Enforced<br />
Disappearance,<br />
2006<br />
Entry into force:<br />
23 December<br />
2010<br />
Year of<br />
ratification<br />
CRPD:<br />
Convention on<br />
the Rights of<br />
Persons with<br />
Disabilities,<br />
2006<br />
Micronesia (Federated States of) 2004 1993 2015 2012<br />
Moldova (Republic of) 1993 1993 1993 1994 1995 1993 2004 2007 2010<br />
Monaco 1995 1997 1997 2005 1991 1993 2001 2008<br />
Mongolia 1969 1974 1974 1981 2002 1990 2004 2003 2015 2009<br />
Montenegro 2006 2006 2006 2006 2006 2006 2007 2006 2011 2009<br />
Morocco 1970 1979 1979 1993 1993 1993 1993 2002 2001 2013 2009<br />
Mozambique 1983 1993 1997 1999 1994 2013 2004 2003 2012<br />
Myanmar 1997 1991 2012 2011<br />
Namibia 1982 1994 1994 1992 1994 1990 2002 2002 2007<br />
Nauru 2011 2012 1994 2012<br />
Nepal 1971 1991 1991 1991 1991 1990 2007 2006 2010<br />
Netherlands 1971 1978 1978 1991 1988 1995 2009 2005 2011<br />
New Zealand 1972 1978 1978 1985 1989 1993 2001 2011 2008<br />
Nicaragua 1978 1980 1980 1981 2005 1990 2005 2005 2004 2007<br />
Niger 1967 1986 1986 1999 1998 1990 2009 2012 2004 2015 2008<br />
Nigeria 1967 1993 1993 1985 2001 1991 2009 2012 2010 2009 2010<br />
Norway 1970 1972 1972 1981 1986 1991 2003 2001 2013<br />
Oman 2003 2006 1996 2004 2004 2009<br />
Pakistan 1966 2010 2008 1996 2010 1990 2011 2011<br />
Palau 1995 2013<br />
Palestine, State of 2014 2014 2014 2014 2014 2014 2014 2014<br />
Panama 1967 1977 1977 1981 1987 1990 2001 2001 2011 2007<br />
Papua New Guinea 1982 2008 2008 1995 1993 2013<br />
Paraguay 2003 1992 1992 1987 1990 1990 2008 2002 2003 2010 2008<br />
Peru 1971 1978 1978 1982 1988 1990 2005 2002 2002 2012 2008<br />
Philippines 1967 1986 1974 1981 1986 1990 1995 2003 2002 2008<br />
Poland 1968 1977 1977 1980 1989 1991 2005 2005 2012<br />
Portugal 1982 1978 1978 1980 1989 1990 2003 2003 2014 2009<br />
Qatar 1976 2009 2000 1995 2002 2001 2008<br />
Romania 1970 1974 1974 1982 1990 1990 2001 2001 2011<br />
Russian Federation 1969 1973 1973 1981 1987 1990 2008 2013 2012<br />
Rwanda 1975 1975 1975 1981 2008 1991 2008 2002 2002 2008<br />
Saint Kitts and Nevis 2006 1985 1990<br />
Saint Lucia 1990 1982 1993 2014 2013<br />
Saint Vincent and the Grenadines 1981 1981 1981 1981 2001 1993 2005 2011 2005 2010<br />
Samoa 2008 1992 1994 2012<br />
San Marino 2002 1985 1985 2003 2006 1991 2011 2011 2008<br />
Sao Tome and Principe 2003 1991 2015<br />
Saudi Arabia 1997 2000 1997 1996 2011 2010 2008<br />
Senegal 1972 1978 1978 1985 1986 1990 1999 2004 2003 2008 2010<br />
Serbia 2001 2001 2001 2001 2001 2001 2003 2002 2011 2009<br />
Seychelles 1978 1992 1992 1992 1992 1990 1994 2010 2012 2009<br />
Sierra Leone 1967 1996 1996 1988 2001 1990 2002 2001 2010<br />
Singapore 1995 1995 2008 2013<br />
Slovakia 1993 1993 1993 1993 1993 1993 2006 2004 2014 2010<br />
Slovenia 1992 1992 1992 1992 1993 1992 2004 2004 2008<br />
Solomon Islands 1982 1982 2002 1995<br />
Somalia 1975 1990 1990 1990 2015<br />
South Africa 1998 1998 2015 1995 1998 1995 2009 2003 2007<br />
South Sudan 2015 2015 2015<br />
Spain 1968 1977 1977 1984 1987 1990 2002 2001 2009 2007<br />
Sri Lanka 1982 1980 1980 1981 1994 1991 1996 2000 2006<br />
Sudan 1977 1986 1986 1990 2005 2004 2009<br />
Suriname 1984 1976 1976 1993 1993 2012<br />
Swaziland 1969 2004 2004 2004 2004 1995 2012 2012 2012<br />
Sweden 1971 1971 1971 1980 1986 1990 2003 2007 2008<br />
Entry into force:<br />
3 May<br />
2008<br />
Year of<br />
ratification<br />
256 | HUMAN DEVELOPMENT REPORT <strong>2016</strong>
HUMAN DEVELOPMENT REPORT <strong>2016</strong><br />
<strong>Human</strong> <strong>Development</strong> for Everyone<br />
Country<br />
ICERD:<br />
International<br />
Convention on<br />
the Elimination<br />
of All Forms<br />
of Racial<br />
Discrimination,<br />
1965<br />
Entry into force:<br />
4 January<br />
1969<br />
Year of<br />
ratification<br />
ICCPR:<br />
International<br />
Covenant<br />
on Civil and<br />
Political<br />
Rights, 1966<br />
Entry into force:<br />
23 March<br />
1969<br />
Year of<br />
ratification<br />
ICESCR:<br />
International<br />
Covenant on<br />
Economic,<br />
Social and<br />
Cultural<br />
Rights, 1966<br />
Entry into force:<br />
3 January<br />
1976<br />
Year of<br />
ratification<br />
CEDAW:<br />
Convention on<br />
the Elimination<br />
of All Forms of<br />
Discrimination<br />
against<br />
Women, 1979<br />
Entry into force:<br />
3 September<br />
1981<br />
Year of<br />
ratification<br />
CAT:<br />
Convention<br />
against Torture<br />
and Other<br />
Cruel, Inhuman<br />
or Degrading<br />
Treatment or<br />
Punishment,<br />
1984<br />
Entry into force:<br />
26 June<br />
1987<br />
Year of<br />
ratification<br />
CRC:<br />
Convention on<br />
the Rights of<br />
the Child, 1989<br />
Entry into force:<br />
2 September<br />
1990<br />
Year of<br />
ratification<br />
ICMW:<br />
International<br />
Convention on<br />
the Protection<br />
of the Rights<br />
of All Migrant<br />
Workers and<br />
Members of<br />
Their Families,<br />
1990<br />
Entry into force:<br />
1 July<br />
2003<br />
Year of<br />
ratification<br />
CRC-AC:<br />
Optional<br />
Protocol to the<br />
Convention on<br />
the Rights of<br />
the Child on the<br />
involvement<br />
of children<br />
in armed<br />
conflict, 2000<br />
Entry into force:<br />
12 February<br />
2002<br />
Year of<br />
ratification<br />
CRC-SC:<br />
Optional<br />
Protocol to the<br />
Convention<br />
on the Rights<br />
of the Child<br />
on the sale of<br />
children, child<br />
prostitution<br />
and child,<br />
pornography,<br />
2000<br />
Entry into force:<br />
18 January<br />
2002<br />
Year of<br />
ratification<br />
ICPED:<br />
International<br />
Convention for<br />
the Protection<br />
of All Persons<br />
from Enforced<br />
Disappearance,<br />
2006<br />
Entry into force:<br />
23 December<br />
2010<br />
Year of<br />
ratification<br />
Switzerland 1994 1992 1992 1997 1986 1997 2002 2006 2014<br />
Syrian Arab Republic 1969 1969 1969 2003 2004 1993 2005 2003 2003 2009<br />
Tajikistan 1995 1999 1999 1993 1995 1993 2002 2002 2002<br />
Tanzania (United Republic of) 1972 1976 1976 1985 1991 2004 2003 2009<br />
Thailand 2003 1996 1999 1985 2007 1992 2006 2006 2008<br />
The former Yugoslav Republic of Macedonia 1994 1994 1994 1994 1994 1993 2004 2003 2011<br />
Timor-Leste 2003 2003 2003 2003 2003 2003 2004 2004 2003<br />
Togo 1972 1984 1984 1983 1987 1990 2005 2004 2014 2011<br />
Tonga 1972 1995<br />
Trinidad and Tobago 1973 1978 1978 1990 1991 2015<br />
Tunisia 1967 1969 1969 1985 1988 1992 2003 2002 2011 2008<br />
Turkey 2002 2003 2003 1985 1988 1995 2004 2004 2002 2009<br />
Turkmenistan 1994 1997 1997 1997 1999 1993 2005 2005 2008<br />
Tuvalu 1999 1995 2013<br />
Uganda 1980 1995 1987 1985 1986 1990 1995 2002 2001 2008<br />
Ukraine 1969 1973 1973 1981 1987 1991 2005 2003 2015 2010<br />
United Arab Emirates 1974 2004 2012 1997 2010<br />
United Kingdom 1969 1976 1976 1986 1988 1991 2003 2009 2009<br />
United States 1994 1992 1994 2002 2002<br />
Uruguay 1968 1970 1970 1981 1986 1990 2001 2003 2003 2009 2009<br />
Uzbekistan 1995 1995 1995 1995 1995 1994 2008 2008<br />
Vanuatu 2008 1995 2011 1993 2007 2007 2008<br />
Venezuela (Bolivarian Republic of) 1967 1978 1978 1983 1991 1990 2003 2002 2013<br />
Viet Nam 1982 1982 1982 1982 2015 1990 2001 2001 2015<br />
Yemen 1972 1987 1987 1984 1991 1991 2007 2004 2009<br />
Zambia 1972 1984 1984 1985 1998 1991 2011 2010<br />
Zimbabwe 1991 1991 1991 1991 1990 2013 2012 2013<br />
CRPD:<br />
Convention on<br />
the Rights of<br />
Persons with<br />
Disabilities,<br />
2006<br />
Entry into force:<br />
3 May<br />
2008<br />
Year of<br />
ratification<br />
DEFINITIONS<br />
ICERD: International Convention on the<br />
Elimination of All Forms of Racial Discrimination,<br />
1965: Prohibits all forms of racial discrimination—<br />
defined as any distinction, exclusion, restriction or<br />
preference based on race, colour, descent, or national<br />
or ethnic origin which has the purpose or effect of<br />
nullifying or impairing the equal recognition, enjoyment<br />
or exercise of human rights and fundamental freedoms<br />
and sets out the obligations of the state to combat<br />
this phenomenon. The Convention also requires a<br />
state to take appropriate measures against racial<br />
discrimination, including the propagation of racist<br />
ideas advocated by groups and organizations.<br />
ICCPR: International Covenant on Civil and<br />
Political Rights, 1966: Says that all individuals<br />
possess civil and political rights, starting with the<br />
right to self-determination and including the right to<br />
life, the right to liberty and freedom of movement, the<br />
freedom of religion, of speech and of assembly, the<br />
right to equality between men and women, the right<br />
to equality before the law and the right to effective<br />
legal recourse. Some of these rights, such as the right<br />
not to be arbitrarily deprived of one’s life, freedom<br />
from torture and other forms of cruel, inhuman and<br />
degrading treatment, may not be suspended or<br />
derogated even in a state of emergency. The ICCPR,<br />
its optional protocols, the ICESCR and the Universal<br />
Declaration of <strong>Human</strong> Rights together form the<br />
International Bill of <strong>Human</strong> Rights.<br />
ICESCR: International Covenant on Economic,<br />
Social and Cultural Rights, 1966: Establishes<br />
economic, social and cultural rights, including the<br />
right to work in just and favourable conditions, to<br />
social protection, to an adequate standard of living,<br />
to the highest attainable standards of physical and<br />
mental health, to education, to participate in cultural<br />
life, and to enjoy the benefits of scientific progress.<br />
The ICESCR is part of the International Bill of <strong>Human</strong><br />
Rights.<br />
CEDAW: Convention on the Elimination of All<br />
Forms of Discrimination against Women, 1979:<br />
Is the first global and comprehensive legally binding<br />
international treaty aimed at the elimination of all forms<br />
of sex-based discrimination against women. It requires<br />
states to incorporate the principle of gender equality<br />
in their national constitutions or other appropriate<br />
legislation and to ensure the practical realisation of<br />
that principle. Discrimination against women is defined<br />
as any distinction, exclusion or restriction made on<br />
the basis of sex which has the effect or purpose of<br />
impairing or nullifying the recognition, enjoyment or<br />
exercise by women, irrespective of their marital status,<br />
on a basis of equality of men and women, of human<br />
rights and fundamental freedoms in the political,<br />
economic, social, cultural, civil or any other field.<br />
CAT: Convention against Torture and Other<br />
Cruel, Inhuman or Degrading Treatment or<br />
Punishment, 1984: Defines and outlaws torture and<br />
other forms of ill-treatment under all circumstances,<br />
requires states to criminalize it under domestic<br />
law, to prevent its occurrence, to properly educate<br />
their law enforcement and other personnel about<br />
the prohibition of torture, to impartially investigate<br />
allegations of torture and to offer fair and adequate<br />
compensation to any victim. The Convention clearly<br />
states that no circumstances of any kind, including<br />
orders from a superior, a state of war or a state of<br />
emergency, can justify an act of torture – the ban is<br />
absolute. States commit to not extradite, deport or<br />
refoule a person if they are at risk of being tortured<br />
in the territory to which they would return, and to<br />
the universal obligation to prosecute or extradite any<br />
individual accused of having committed torture.<br />
CRC: Convention on the Rights of the Child,<br />
1989: Defines a child as a person under the age of<br />
18, unless national law sets a lower age of majority,<br />
and sets standards for health, education, legal, civil,<br />
and social services for children in accordance with<br />
four general principles: non-discrimination between<br />
children; the best interest of the child; the right<br />
to life, survival and development of the child; and<br />
respect for the views of the child.<br />
ICMW: International Convention on the<br />
Protection of the Rights of All Migrant Workers<br />
and Members of Their Families, 1990: Establishes<br />
minimum standards that states should apply to migrant<br />
workers and members of their families, regardless of<br />
their migratory status. Such standards apply to the<br />
entire migration process, from preparation for migration,<br />
departure and transit to the total period of stay and<br />
remunerated activity in the state of employment and the<br />
return to the state of origin or of habitual residence.<br />
CRC-AC: Optional Protocol to the Convention<br />
on the Rights of the Child on the involvement<br />
of children in armed conflict, 2000: Requires<br />
states to take all feasible measures to ensure that<br />
members of their armed forces under the age of<br />
18 do not take a direct part in hostilities, to ban<br />
compulsory recruitment below the age of 18, to<br />
ensure any voluntary member of the armed forces<br />
under the age of 18 does not take direct part in<br />
hostilities and to take legal measures to prohibit<br />
independent armed groups from recruiting and using<br />
children under the age of 18 in conflicts.<br />
CRC-SC: Optional Protocol to the Convention on<br />
the Rights of the Child on the sale of children,<br />
child prostitution and child pornography,<br />
2000: Prohibits the sale of children for sexual and<br />
non-sexual purposes, child prostitution and child<br />
pornography and provides states with detailed<br />
requirements to end the exploitation and abuse of<br />
children. It requires ratifying states to provide legal<br />
and other support to child victims and to criminalise<br />
and punish the activities related to these offences<br />
not only for those offering or delivering children for<br />
any of the purposes, but also for anyone accepting<br />
the child for these activities.<br />
ICPED: International Convention for the<br />
Protection of All Persons from Enforced<br />
Disappearance, 2006: Prohibits enforced<br />
disappearance, defined as the abduction or deprivation<br />
of liberty of a person by state authorities, followed<br />
by the denial of those authorities to disclose the<br />
whereabouts or fate of the person, and establishes<br />
minimum legal standards on its prevention, combating<br />
impunity, effective law enforcement and upholding the<br />
rights of victims. The convention also enshrines the<br />
right of victims to the truth and to reparations.<br />
CRPD: Convention on the Rights of Persons<br />
with Disabilities, 2006: Guarantees the full and<br />
equal enjoyment of all human rights and fundamental<br />
freedoms to persons with disabilities and promotes<br />
respect for their inherent dignity. It considers disability<br />
as the result of an interaction between an individual’s<br />
condition and an inaccessible society. The barriers<br />
that can make society inaccessible are manifold<br />
and the Convention identifies these barriers as<br />
discriminatory and requires their removal. In adopting<br />
a rights-based approach to disability, the Convention<br />
moves away from viewing disability as a sickness<br />
inherent in the individual requiring either a medical<br />
intervention (medical approach) to fix the person, or<br />
a charitable intervention (charity approach) based on<br />
voluntary assistance rather than individual right.<br />
MAIN DATA SOURCE<br />
Columns 1–11: UNOHCHR (<strong>2016</strong>).<br />
TABLE<br />
15<br />
TABLE 15 Status of fundamental human rights treaties | 257
<strong>Human</strong> development<br />
dashboards
DASHBOARD<br />
1<br />
Life-course gender gap<br />
Country groupings (terciles)<br />
Top third Middle third Bottom third<br />
Three-colour coding is used to visualize partial grouping of countries by indicator. For each indicator<br />
countries are divided into three groups of approximately equal size (terciles): the top third, the<br />
middle third and the bottom third. See Notes after the table.<br />
Childhood and youth Adulthood Older age<br />
Sex ratio Adolescent<br />
at birth a birth rate<br />
(male to<br />
female<br />
births)<br />
(births<br />
per 1,000<br />
women<br />
ages 15–19)<br />
Gross enrolment ratio, female<br />
Preprimary<br />
Primary Secondary<br />
(% of<br />
preschoolage<br />
female<br />
population)<br />
(% of<br />
primary<br />
school–age<br />
female<br />
population)<br />
(% of<br />
secondary<br />
school–age<br />
female<br />
population)<br />
Youth<br />
unemployment<br />
rate<br />
(female to<br />
male ratio)<br />
HDI rank<br />
2015 b 2015 b 2015 c 2015 c 2015 c 2015 2015 2005–2015 d 2015 2015 c 2014 e 2015 2015 b 2006–2013 d<br />
VERY HIGH HUMAN DEVELOPMENT<br />
1 Norway 1.06 5.9 98 100 111 0.87 5 1.02 0.84 48.7 31.5 39.6 34.5 1.00<br />
2 Australia 1.06 14.1 108 106 134 0.94 6 1.00 0.99 47.4 36.7 30.5 35.7 1.13<br />
2 Switzerland 1.05 2.9 104 103 98 0.96 5 0.99 1.06 47.6 33.0 28.9 35.9 1.00<br />
4 Germany 1.06 6.7 110 103 100 0.92 6 0.99 0.83 48.3 30.3 36.9 34.3 1.00<br />
5 Denmark 1.06 4.0 97 101 132 0.95 6 0.90 1.04 49.1 27.8 37.4 33.1 1.00<br />
5 Singapore 1.07 3.8 .. .. .. 1.32 10 0.92 1.13 48.2 33.9 23.9 36.7 ..<br />
7 Netherlands 1.05 4.0 95 104 130 1.07 7 0.95 0.91 48.3 29.6 36.4 34.4 1.00<br />
8 Ireland 1.07 10.4 110 103 127 0.90 8 1.06 0.76 51.0 33.3 19.9 34.0 0.66<br />
9 Iceland 1.04 6.1 97 99 111 0.82 3 1.03 1.10 51.5 40.0 41.3 34.8 1.00<br />
10 Canada 1.06 9.8 73 101 110 0.88 7 1.00 0.84 49.5 35.8 28.3 35.2 ..<br />
10 United States 1.05 22.6 72 99 98 0.92 14 1.00 0.96 47.7 43.4 19.5 33.4 0.96<br />
12 Hong Kong, China (SAR) 1.07 3.2 108 110 99 0.89 .. 1.08 0.83 46.7 31.8 .. 37.5 ..<br />
13 New Zealand 1.05 23.6 93 98 121 1.02 11 1.00 1.27 50.0 40.0 31.4 34.9 0.97<br />
14 Sweden 1.06 5.7 95 124 142 0.94 4 0.99 0.97 50.0 34.6 43.6 34.8 1.00<br />
15 Liechtenstein .. .. 102 102 103 .. .. .. .. .. .. 20.0 .. ..<br />
16 United Kingdom 1.05 14.6 88 108 130 0.90 9 0.96 0.93 49.4 34.3 26.7 33.9 0.99<br />
17 Japan 1.06 4.1 .. 101 102 0.99 5 1.03 0.89 43.9 .. 11.6 37.7 ..<br />
18 Korea (Republic of) 1.07 1.6 92 99 97 0.92 11 0.94 0.94 43.5 9.6 16.3 35.9 ..<br />
19 Israel 1.05 9.7 111 104 103 1.05 5 0.97 1.01 49.4 32.1 26.7 35.0 ..<br />
20 Luxembourg 1.05 5.9 94 97 104 0.85 10 1.01 1.29 45.9 24.2 28.3 34.6 0.56<br />
21 France 1.05 8.9 109 105 111 0.98 8 0.93 0.93 50.5 39.4 25.7 36.2 1.00<br />
22 Belgium 1.05 8.2 118 105 175 0.96 7 0.95 0.85 48.8 29.9 42.4 34.4 0.68<br />
23 Finland 1.05 6.5 79 101 152 0.87 3 1.00 0.86 51.8 32.0 41.5 34.7 1.00<br />
24 Austria 1.06 7.1 101 102 97 0.96 4 0.99 0.89 48.6 27.2 30.3 34.7 1.21<br />
25 Slovenia 1.05 3.8 92 99 111 0.90 9 0.98 1.25 47.3 38.5 27.7 34.3 0.86<br />
26 Italy 1.06 6.0 99 101 101 1.07 4 0.95 1.12 45.6 25.0 30.1 36.2 0.69<br />
27 Spain 1.06 8.4 98 105 130 0.99 5 0.92 1.15 48.6 29.8 38.0 36.1 0.48<br />
28 Czech Republic 1.06 9.9 104 99 105 1.09 4 1.00 1.41 46.7 25.8 19.6 32.4 1.00<br />
29 Greece 1.06 7.5 76 98 106 1.11 3 0.89 1.36 46.2 23.0 19.7 34.8 0.55<br />
30 Brunei Darussalam 1.06 21.0 74 108 99 1.09 23 0.97 1.13 .. 33.7 .. 31.8 ..<br />
30 Estonia 1.06 13.1 87 100 108 0.95 9 1.00 0.97 50.9 36.2 23.8 32.7 0.99<br />
32 Andorra .. .. .. .. .. .. .. 0.98 .. 49.3 .. 39.3 .. ..<br />
33 Cyprus 1.07 5.0 77 100 99 0.91 7 0.93 0.89 51.3 13.6 12.5 33.1 0.57<br />
33 Malta 1.06 16.6 119 95 81 0.85 9 0.90 0.98 42.0 23.4 12.9 33.1 0.33<br />
33 Qatar 1.05 10.7 58 99 103 2.13 13 1.05 13.26 13.4 12.2 0.0 31.1 ..<br />
36 Poland 1.06 13.4 77 101 107 1.02 3 0.93 1.06 47.3 38.4 24.8 32.6 0.95<br />
37 Lithuania 1.05 11.0 88 103 105 1.02 10 0.95 0.77 .. 38.5 23.4 30.9 1.00<br />
38 Chile 1.04 47.8 126 99 101 1.19 22 0.99 1.29 40.1 .. 15.8 36.0 0.96<br />
38 Saudi Arabia 1.03 8.8 18 108 94 1.36 12 0.88 6.89 15.0 6.8 19.9 28.5 ..<br />
40 Slovakia 1.05 20.2 91 100 92 0.98 6 1.00 1.26 47.6 31.0 18.7 31.3 1.00<br />
41 Portugal 1.06 9.9 90 106 115 1.12 10 0.97 1.12 51.8 32.7 34.8 34.8 1.00<br />
42 United Arab Emirates 1.05 29.7 92 107 .. 1.21 6 1.20 3.13 .. 9.9 22.5 29.6 ..<br />
43 Hungary 1.06 18.0 83 101 107 0.95 17 0.98 1.10 48.1 40.4 10.1 30.4 0.90<br />
44 Latvia 1.05 13.6 90 100 114 1.01 18 1.00 0.79 53.3 45.0 18.0 30.8 1.00<br />
45 Argentina 1.04 63.8 72 110 110 1.13 52 1.03 1.46 44.8 23.1 37.1 f 32.6 1.07<br />
45 Croatia 1.06 9.5 61 99 101 0.99 8 0.96 1.01 48.8 24.8 15.2 31.8 0.52<br />
47 Bahrain 1.04 13.5 55 .. .. 2.01 15 1.11 8.28 .. .. 15.0 29.0 ..<br />
48 Montenegro 1.07 12.2 54 93 90 1.00 7 0.90 1.11 47.8 30.3 17.3 29.9 ..<br />
49 Russian Federation 1.06 23.4 83 99 100 1.05 25 1.00 0.88 50.1 38.4 14.5 29.0 1.00<br />
Maternal<br />
mortality<br />
ratio<br />
Population<br />
with at<br />
least some<br />
secondary<br />
education<br />
(deaths<br />
per<br />
100,000 (female to<br />
live births) male ratio)<br />
Total<br />
unemployment<br />
rate<br />
(female to<br />
male ratio)<br />
Share<br />
of paid<br />
employment<br />
in nonagriculture,<br />
female<br />
(% of<br />
total paid<br />
employment<br />
in nonagriculture)<br />
Female<br />
legislators,<br />
senior<br />
officials<br />
and<br />
managers<br />
(% of total)<br />
Share of<br />
seats in<br />
parliament<br />
(% held by<br />
women)<br />
Life<br />
expectancy<br />
at age 50,<br />
female<br />
(years)<br />
Old-age<br />
pension<br />
recipients<br />
(female to<br />
male ratio)<br />
DASH<br />
BOARD<br />
1<br />
DASHBOARD 1 Life-course gender gap | 259
DASHBOARD 1 LIFE-COURSE GENDER GAP<br />
Childhood and youth Adulthood Older age<br />
DASH<br />
BOARD<br />
1<br />
Sex ratio Adolescent<br />
at birth a birth rate<br />
(male to<br />
female<br />
births)<br />
(births<br />
per 1,000<br />
women<br />
ages 15–19)<br />
Gross enrolment ratio, female<br />
Preprimary<br />
Primary Secondary<br />
(% of<br />
preschoolage<br />
female<br />
population)<br />
(% of<br />
primary<br />
school–age<br />
female<br />
population)<br />
(% of<br />
secondary<br />
school–age<br />
female<br />
population)<br />
Youth<br />
unemployment<br />
rate<br />
(female to<br />
male ratio)<br />
HDI rank<br />
2015 b 2015 b 2015 c 2015 c 2015 c 2015 2015 2005–2015 d 2015 2015 c 2014 e 2015 2015 b 2006–2013 d<br />
50 Romania 1.06 34.6 91 95 94 1.02 31 0.93 0.74 44.6 31.2 12.0 30.3 0.88<br />
51 Kuwait 1.04 9.8 80 103 99 0.91 4 0.98 0.77 .. 13.9 1.5 27.3 ..<br />
HIGH HUMAN DEVELOPMENT<br />
52 Belarus 1.06 18.2 103 99 106 1.03 4 0.94 0.58 .. 46.3 29.2 29.3 ..<br />
52 Oman 1.05 8.1 55 115 98 1.22 17 1.05 2.78 17.6 .. 8.2 30.8 ..<br />
54 Barbados 1.04 40.7 86 94 111 1.09 27 1.03 1.06 .. 48.2 19.6 30.0 ..<br />
54 Uruguay 1.05 56.1 70 108 100 1.10 15 1.07 1.52 48.7 43.9 19.2 33.2 1.04<br />
56 Bulgaria 1.06 37.7 83 99 99 1.03 11 0.97 0.82 49.7 36.9 20.4 29.9 0.96<br />
56 Kazakhstan 1.06 27.9 64 111 111 1.16 12 1.00 1.34 50.6 38.4 20.1 27.5 ..<br />
58 Bahamas 1.06 29.6 .. 109 95 1.16 80 1.00 1.08 .. 51.6 16.7 32.2 ..<br />
59 Malaysia 1.06 13.6 .. .. .. 1.09 40 0.95 1.17 39.3 25.0 13.2 28.8 ..<br />
60 Palau .. .. 77 112 117 .. .. .. .. .. .. 10.3 .. ..<br />
60 Panama 1.05 74.5 72 104 78 1.14 94 1.06 1.56 44.6 46.0 18.3 34.1 0.59<br />
62 Antigua and Barbuda 1.03 44.8 72 93 103 .. .. .. .. .. .. 25.7 31.1 ..<br />
63 Seychelles 1.06 57.4 93 105 75 .. .. .. .. 55.1 .. 43.8 30.5 1.00<br />
64 Mauritius 1.04 28.5 104 104 99 1.21 53 0.92 2.30 41.2 23.1 11.6 30.6 1.00<br />
65 Trinidad and Tobago 1.04 31.5 .. 104 .. 1.26 63 1.03 1.41 .. 43.5 31.5 28.5 ..<br />
66 Costa Rica 1.05 56.5 53 110 124 1.15 25 1.01 1.44 43.0 35.2 33.3 33.9 0.75<br />
66 Serbia 1.05 19.0 59 101 95 1.04 17 0.90 1.12 47.0 32.7 34.0 29.5 0.93<br />
68 Cuba 1.06 45.6 99 96 101 1.03 39 0.97 1.28 44.8 .. 48.9 33.3 ..<br />
69 Iran (Islamic Republic of) 1.05 26.7 42 112 88 1.17 25 0.95 2.04 16.0 13.3 3.1 28.8 ..<br />
70 Georgia 1.10 39.7 .. 118 100 1.04 36 0.99 0.76 47.3 34.0 11.3 30.6 ..<br />
71 Turkey 1.05 27.6 27 107 99 1.13 16 0.67 1.33 27.5 10.0 14.9 31.7 ..<br />
71 Venezuela (Bolivarian Republic of) 1.05 79.4 73 100 95 1.16 95 1.12 1.20 43.7 .. 17.0 31.1 0.72<br />
73 Sri Lanka 1.04 14.8 95 100 102 1.32 30 1.00 2.37 27.1 28.4 4.9 30.5 ..<br />
74 Saint Kitts and Nevis .. .. 92 84 93 .. .. .. .. .. .. 13.3 .. 0.77<br />
75 Albania 1.08 21.7 87 111 93 0.93 29 1.00 0.84 44.7 22.5 20.7 32.5 0.61<br />
76 Lebanon 1.05 12.4 82 93 68 1.07 15 0.96 1.94 .. 8.4 3.1 32.9 ..<br />
77 Mexico 1.05 62.8 70 103 93 1.07 38 0.95 1.06 40.1 30.7 40.6 32.3 0.50<br />
78 Azerbaijan 1.14 59.8 24 105 102 1.11 25 0.96 1.39 42.7 7.1 16.9 28.5 0.96<br />
79 Brazil 1.05 67.0 86 107 106 1.26 44 1.07 1.65 47.7 37.5 10.8 31.4 0.92<br />
79 Grenada 1.05 30.5 88 102 101 .. 27 .. .. .. .. 25.0 28.5 ..<br />
81 Bosnia and Herzegovina 1.06 8.6 14 100 90 1.01 11 0.79 1.12 36.2 .. 19.3 30.6 ..<br />
82 The former Yugoslav Republic of Macedonia 1.05 17.6 29 85 81 0.96 8 0.72 0.93 43.0 27.9 33.3 29.2 ..<br />
83 Algeria 1.05 10.6 79 115 102 1.15 140 0.96 1.95 19.2 10.6 25.7 31.1 ..<br />
84 Armenia 1.13 23.0 60 .. .. 1.15 25 1.00 1.26 47.5 21.5 10.7 30.8 ..<br />
84 Ukraine 1.06 24.1 103 105 98 0.95 24 0.98 0.71 50.8 37.8 12.1 28.7 ..<br />
86 Jordan 1.05 23.2 31 88 86 1.19 58 0.95 2.13 .. .. 11.6 28.8 0.14<br />
87 Peru 1.05 49.1 88 101 96 1.04 68 0.84 1.25 37.1 29.7 22.3 31.2 0.63<br />
87 Thailand 1.06 44.6 73 104 89 1.12 20 0.89 0.91 45.6 25.1 6.1 31.1 1.09<br />
89 Ecuador 1.05 75.9 62 113 106 1.31 64 0.98 1.61 38.5 39.7 41.6 32.6 0.92<br />
90 China 1.16 7.3 82 104 95 0.94 27 0.88 0.79 37.7 16.8 23.6 29.5 ..<br />
91 Fiji 1.06 44.8 .. 106 93 1.23 30 1.11 1.78 .. 23.8 16.0 26.8 ..<br />
92 Mongolia 1.03 15.7 86 101 92 1.06 44 1.04 1.04 50.2 47.4 14.5 27.9 1.00<br />
92 Saint Lucia 1.03 53.9 67 .. 86 1.39 48 1.15 1.77 .. 46.1 20.7 31.3 0.81<br />
94 Jamaica 1.05 59.7 108 .. 72 1.28 89 1.13 1.80 .. .. 16.7 32.1 ..<br />
95 Colombia 1.05 50.2 55 112 103 1.28 64 0.84 1.72 46.5 53.1 20.9 31.1 0.65<br />
96 Dominica .. .. 82 118 100 .. .. .. .. .. .. 21.9 .. ..<br />
97 Suriname 1.07 46.1 96 118 89 1.61 155 1.02 2.79 .. 35.8 25.5 28.5 ..<br />
97 Tunisia 1.05 6.8 43 111 94 1.02 62 0.75 1.52 .. .. 31.3 30.1 ..<br />
99 Dominican Republic 1.05 97.9 45 96 82 1.43 92 1.03 2.46 48.6 37.0 19.1 31.4 0.38<br />
99 Saint Vincent and the Grenadines 1.03 51.0 70 103 103 1.13 45 .. 0.94 .. .. 13.0 29.1 ..<br />
101 Tonga 1.05 15.2 38 107 94 1.20 124 1.00 2.07 .. .. 0.0 29.3 ..<br />
102 Libya 1.06 6.2 .. .. .. 1.20 9 1.48 1.73 .. .. 16.0 28.3 ..<br />
103 Belize 1.03 65.9 51 109 82 1.55 28 1.01 2.61 43.4 41.3 13.3 26.7 ..<br />
104 Samoa 1.08 25.0 39 106 92 1.14 51 1.11 1.30 37.6 36.3 6.1 29.9 ..<br />
Maternal<br />
mortality<br />
ratio<br />
Population<br />
with at<br />
least some<br />
secondary<br />
education<br />
(deaths<br />
per<br />
100,000 (female to<br />
live births) male ratio)<br />
Total<br />
unemployment<br />
rate<br />
(female to<br />
male ratio)<br />
Share<br />
of paid<br />
employment<br />
in nonagriculture,<br />
female<br />
(% of<br />
total paid<br />
employment<br />
in nonagriculture)<br />
Female<br />
legislators,<br />
senior<br />
officials<br />
and<br />
managers<br />
(% of total)<br />
Share of<br />
seats in<br />
parliament<br />
(% held by<br />
women)<br />
Life<br />
expectancy<br />
at age 50,<br />
female<br />
(years)<br />
Old-age<br />
pension<br />
recipients<br />
(female to<br />
male ratio)<br />
260 | HUMAN DEVELOPMENT REPORT <strong>2016</strong>
HUMAN DEVELOPMENT REPORT <strong>2016</strong><br />
<strong>Human</strong> <strong>Development</strong> for Everyone<br />
Childhood and youth Adulthood Older age<br />
Sex ratio Adolescent<br />
at birth a birth rate<br />
(male to<br />
female<br />
births)<br />
(births<br />
per 1,000<br />
women<br />
ages 15–19)<br />
Gross enrolment ratio, female<br />
Preprimary<br />
Primary Secondary<br />
(% of<br />
preschoolage<br />
female<br />
population)<br />
(% of<br />
primary<br />
school–age<br />
female<br />
population)<br />
(% of<br />
secondary<br />
school–age<br />
female<br />
population)<br />
Youth<br />
unemployment<br />
rate<br />
(female to<br />
male ratio)<br />
HDI rank<br />
2015 b 2015 b 2015 c 2015 c 2015 c 2015 2015 2005–2015 d 2015 2015 c 2014 e 2015 2015 b 2006–2013 d<br />
105 Maldives 1.09 6.7 .. .. .. 0.93 68 1.11 1.43 40.4 14.3 5.9 29.0 ..<br />
105 Uzbekistan 1.06 17.7 25 96 95 1.05 36 1.00 1.00 .. .. 16.4 28.0 ..<br />
MEDIUM HUMAN DEVELOPMENT<br />
107 Moldova (Republic of) 1.06 22.6 83 93 88 0.83 23 0.98 0.67 56.1 44.1 21.8 27.9 1.21<br />
108 Botswana 1.03 32.3 18 107 86 1.16 129 0.98 1.34 .. 38.6 9.5 25.7 1.00<br />
109 Gabon 1.03 99.9 38 140 .. 1.16 291 1.36 2.00 .. .. 16.0 26.9 ..<br />
110 Paraguay 1.05 57.4 38 104 79 1.27 132 0.98 1.62 42.8 33.8 16.8 30.4 0.80<br />
111 Egypt 1.06 51.9 30 104 86 1.30 33 0.80 3.03 18.2 7.1 2.2 g 26.7 0.13<br />
111 Turkmenistan 1.05 16.4 62 89 84 1.04 42 .. 0.99 .. .. 25.8 26.8 ..<br />
113 Indonesia 1.05 49.6 59 104 82 1.06 126 0.83 1.22 35.8 23.2 17.1 26.0 ..<br />
114 Palestine, State of 1.05 58.6 51 95 86 1.07 45 0.92 1.22 16.9 9.9 .. 28.3 ..<br />
115 Viet Nam 1.11 38.6 80 109 .. 1.10 54 0.83 1.07 43.1 .. 24.3 33.6 ..<br />
116 Philippines 1.06 61.7 .. 117 93 1.07 114 1.04 0.92 41.3 54.8 27.1 26.4 ..<br />
117 El Salvador 1.05 65.2 73 110 81 0.98 54 0.88 0.58 37.0 37.1 32.1 31.1 0.33<br />
118 Bolivia (Plurinational State of) 1.05 70.8 63 .. 84 1.20 206 0.84 1.55 .. 35.1 51.8 30.0 1.00<br />
119 South Africa 1.03 45.5 76 97 104 1.07 138 0.97 1.18 45.7 31.3 41.2 h 24.5 ..<br />
120 Kyrgyzstan 1.06 39.6 25 107 91 1.14 76 1.00 1.30 42.3 35.2 19.2 28.0 1.00<br />
121 Iraq 1.07 84.0 .. .. .. 1.14 50 0.65 1.81 15.4 .. 26.5 26.9 ..<br />
122 Cabo Verde 1.03 73.4 70 110 99 1.33 42 .. 1.36 .. .. 20.8 i 28.3 0.88<br />
123 Morocco 1.06 31.7 53 113 64 0.98 121 0.77 1.05 21.5 12.8 15.7 28.4 ..<br />
124 Nicaragua 1.05 88.8 59 123 79 1.14 150 1.04 1.04 .. 41.0 41.3 31.8 0.38<br />
125 Guatemala 1.05 80.7 66 102 62 1.20 88 1.03 1.26 38.6 .. 13.9 30.7 0.57<br />
125 Namibia 1.03 76.8 22 110 .. 1.11 265 0.98 1.22 .. 42.8 37.7 26.1 ..<br />
127 Guyana 1.05 88.0 93 84 89 1.22 229 1.28 1.70 .. .. 30.4 24.4 1.00<br />
127 Micronesia (Federated States of) 1.07 15.0 .. 97 .. .. 100 .. .. .. .. 0.0 26.1 ..<br />
129 Tajikistan 1.05 38.1 10 98 83 0.90 32 1.11 0.85 .. .. 14.7 29.1 0.75<br />
130 Honduras 1.05 65.0 48 108 74 1.30 129 1.07 1.48 41.7 .. 25.8 31.8 0.42<br />
131 India 1.11 24.5 9 117 69 1.01 174 0.58 1.14 .. 13.8 12.2 26.6 ..<br />
132 Bhutan 1.04 21.4 18 103 87 1.08 148 0.43 1.60 26.3 17.0 8.3 27.3 ..<br />
133 Timor-Leste 1.05 46.6 17 136 76 1.28 215 .. 1.61 .. 10.3 38.5 26.0 1.00<br />
134 Vanuatu 1.07 43.1 97 122 59 1.06 78 .. 1.31 .. 28.5 0.0 27.7 ..<br />
135 Congo 1.03 117.7 14 115 51 1.08 442 0.90 1.20 .. .. 11.5 26.4 0.11<br />
135 Equatorial Guinea 1.03 108.7 68 84 .. 1.10 342 .. 1.11 .. .. 19.7 25.1 ..<br />
137 Kiribati 1.07 17.2 .. 115 .. .. 90 .. .. .. 36.5 8.7 25.9 ..<br />
138 Lao People’s Democratic Republic 1.05 64.1 31 113 55 0.78 197 0.71 0.75 .. .. 25.0 25.3 ..<br />
139 Bangladesh 1.05 83.0 32 115 61 1.03 176 0.95 1.15 .. 5.4 20.0 27.6 ..<br />
139 Ghana 1.05 66.8 122 110 69 1.12 319 0.76 1.14 .. .. 10.9 23.9 ..<br />
139 Zambia 1.03 90.4 .. 104 .. 0.96 224 1.07 1.02 .. .. 12.7 26.1 ..<br />
142 Sao Tome and Principe 1.03 84.3 54 111 89 1.13 156 0.69 1.35 .. 24.4 18.2 27.0 ..<br />
143 Cambodia 1.05 51.6 18 113 .. 0.79 161 0.50 0.63 38.7 21.0 19.0 26.0 ..<br />
144 Nepal 1.07 71.9 84 141 70 0.81 258 0.58 0.81 .. 18.3 29.5 26.3 ..<br />
145 Myanmar 1.03 16.5 24 98 52 1.10 178 1.36 1.17 .. .. 13.0 25.5 ..<br />
146 Kenya 1.03 90.9 73 112 65 1.03 510 0.82 1.35 35.7 .. 20.8 26.3 ..<br />
147 Pakistan 1.09 38.7 66 86 37 1.12 178 0.57 2.16 11.1 3.0 20.0 26.2 ..<br />
LOW HUMAN DEVELOPMENT<br />
148 Swaziland 1.03 70.4 26 108 62 1.02 389 0.90 1.16 .. .. 14.7 24.1 ..<br />
149 Syrian Arab Republic 1.05 39.4 6 79 51 1.25 68 0.80 3.27 16.3 9.2 12.4 29.7 ..<br />
150 Angola 1.03 164.3 94 100 23 1.08 477 .. 1.21 .. .. 36.8 23.5 ..<br />
151 Tanzania (United Republic of) 1.03 118.6 33 87 31 1.22 398 0.66 1.88 36.4 16.5 36.0 26.9 ..<br />
152 Nigeria 1.06 110.6 13 81 41 1.27 814 .. 1.25 .. .. 5.8 21.2 ..<br />
153 Cameroon 1.03 104.6 35 107 52 1.20 596 0.83 1.42 .. .. 27.1 24.1 0.29<br />
154 Papua New Guinea 1.08 54.8 .. 109 35 1.08 215 0.60 1.30 .. .. 2.7 23.7 ..<br />
154 Zimbabwe 1.02 109.7 43 99 47 1.12 443 0.80 1.37 36.6 .. 35.1 24.7 ..<br />
156 Solomon Islands 1.07 48.4 98 112 47 1.00 114 .. 1.03 .. .. 2.0 25.9 ..<br />
157 Mauritania 1.05 78.6 4 101 29 1.19 602 0.47 1.22 .. .. 22.2 25.2 ..<br />
158 Madagascar 1.03 116.2 14 147 38 1.13 353 .. 1.67 37.3 25.1 20.5 25.4 ..<br />
Maternal<br />
mortality<br />
ratio<br />
Population<br />
with at<br />
least some<br />
secondary<br />
education<br />
(deaths<br />
per<br />
100,000 (female to<br />
live births) male ratio)<br />
Total<br />
unemployment<br />
rate<br />
(female to<br />
male ratio)<br />
Share<br />
of paid<br />
employment<br />
in nonagriculture,<br />
female<br />
(% of<br />
total paid<br />
employment<br />
in nonagriculture)<br />
Female<br />
legislators,<br />
senior<br />
officials<br />
and<br />
managers<br />
(% of total)<br />
Share of<br />
seats in<br />
parliament<br />
(% held by<br />
women)<br />
Life<br />
expectancy<br />
at age 50,<br />
female<br />
(years)<br />
Old-age<br />
pension<br />
recipients<br />
(female to<br />
male ratio)<br />
DASH<br />
BOARD<br />
1<br />
DASHBOARD 1 Life-course gender gap | 261
DASHBOARD 1 LIFE-COURSE GENDER GAP<br />
Childhood and youth Adulthood Older age<br />
DASH<br />
BOARD<br />
1<br />
Sex ratio Adolescent<br />
at birth a birth rate<br />
(male to<br />
female<br />
births)<br />
(births<br />
per 1,000<br />
women<br />
ages 15–19)<br />
Gross enrolment ratio, female<br />
Preprimary<br />
Primary Secondary<br />
(% of<br />
preschoolage<br />
female<br />
population)<br />
(% of<br />
primary<br />
school–age<br />
female<br />
population)<br />
(% of<br />
secondary<br />
school–age<br />
female<br />
population)<br />
Youth<br />
unemployment<br />
rate<br />
(female to<br />
male ratio)<br />
HDI rank<br />
2015 b 2015 b 2015 c 2015 c 2015 c 2015 2015 2005–2015 d 2015 2015 c 2014 e 2015 2015 b 2006–2013 d<br />
159 Rwanda 1.02 26.3 15 135 41 1.07 290 0.64 1.06 .. .. 57.5 26.5 ..<br />
160 Comoros 1.05 68.3 24 102 60 1.02 335 .. 1.34 .. .. 3.0 24.8 ..<br />
160 Lesotho 1.03 92.7 32 106 60 1.20 487 1.05 1.31 .. 36.1 24.8 21.6 1.00<br />
162 Senegal 1.04 78.6 16 84 38 1.35 315 0.53 1.73 .. .. 42.7 25.7 ..<br />
163 Haiti 1.05 39.3 .. .. .. 1.18 359 0.66 1.33 .. .. 3.5 26.5 ..<br />
163 Uganda 1.03 111.9 11 111 26 1.04 343 0.81 1.31 29.8 .. 35.0 25.5 ..<br />
165 Sudan 1.04 74.0 35 67 41 1.20 311 0.73 1.70 .. .. 31.0 26.2 ..<br />
166 Togo 1.02 92.0 15 121 .. 1.10 368 0.64 1.21 .. .. 17.6 23.1 ..<br />
167 Benin 1.04 83.2 21 120 44 1.56 405 0.51 1.33 26.0 .. 7.2 24.0 ..<br />
168 Yemen 1.05 61.5 1 89 40 1.17 385 0.47 2.07 .. 5.2 0.5 24.9 ..<br />
169 Afghanistan 1.06 74.0 .. 92 40 1.01 396 0.25 1.50 .. .. 27.4 24.0 ..<br />
170 Malawi 1.03 136.2 .. 148 38 0.95 634 0.62 1.11 .. .. 16.7 28.3 ..<br />
171 Côte d’Ivoire 1.03 135.5 7 84 33 1.24 645 0.51 1.27 .. .. 9.2 21.2 ..<br />
172 Djibouti 1.04 21.5 4 62 42 .. 229 .. .. .. .. 12.7 25.8 ..<br />
173 Gambia 1.03 113.0 35 88 56 1.15 706 0.65 1.77 .. .. 9.4 23.7 ..<br />
174 Ethiopia 1.04 58.4 24 96 35 1.61 353 0.52 2.71 38.8 22.1 37.3 26.3 ..<br />
175 Mali 1.05 174.6 4 73 37 1.35 587 0.45 1.86 .. .. 8.8 23.0 0.44<br />
176 Congo (Democratic Republic of the) 1.03 122.6 4 102 33 1.23 693 0.41 1.46 .. .. 8.2 24.8 ..<br />
177 Liberia 1.05 108.8 .. 92 33 1.22 725 0.44 0.98 .. .. 10.7 23.7 ..<br />
178 Guinea-Bissau 1.03 89.5 7 110 .. 1.08 549 .. 1.20 .. .. 13.7 23.2 ..<br />
179 Eritrea 1.05 54.3 15 47 32 1.09 501 .. 1.21 .. .. 22.0 24.3 ..<br />
179 Sierra Leone 1.02 118.2 10 130 40 0.70 1,360 0.57 0.47 .. .. 12.4 19.6 ..<br />
181 Mozambique 1.03 139.7 .. 100 24 0.98 489 0.34 1.18 33.5 .. 39.6 25.1 0.80<br />
181 South Sudan 1.04 65.9 6 67 .. .. 789 .. .. .. .. 24.3 24.1 ..<br />
183 Guinea 1.02 140.6 15 84 31 0.69 679 .. 0.34 18.3 .. 21.9 23.0 ..<br />
184 Burundi 1.03 28.3 7 128 35 1.07 712 0.74 1.50 .. .. 37.8 24.6 0.29<br />
185 Burkina Faso 1.05 108.5 4 85 28 0.83 371 0.52 0.57 .. 31.0 9.4 23.2 0.07<br />
186 Chad 1.03 133.5 1 88 14 1.21 856 0.17 1.48 .. .. 14.9 23.5 ..<br />
187 Niger 1.05 202.4 7 65 16 0.80 553 0.43 0.71 .. .. 13.3 24.5 ..<br />
188 Central African Republic 1.03 91.9 6 80 12 1.06 882 0.41 1.13 .. .. 12.5 g 23.7 ..<br />
OTHER COUNTRIES OR TERRITORIES<br />
Korea (Democratic People’s Rep. of) 1.05 0.5 .. .. .. 1.01 82 .. 1.02 .. .. 16.3 27.9 ..<br />
Marshall Islands .. .. 49 105 .. .. .. 0.99 .. .. .. 9.1 .. ..<br />
Monaco .. .. .. .. .. .. .. .. .. .. .. 20.8 .. ..<br />
Nauru .. .. 96 100 83 .. .. .. .. .. .. 5.3 .. ..<br />
San Marino .. .. 108 93 96 .. .. .. .. 43.4 17.8 16.7 .. ..<br />
Somalia 1.03 103.9 .. .. .. 1.06 732 .. 1.21 .. .. 13.8 24.0 ..<br />
Tuvalu .. .. 93 102 90 .. .. .. .. .. .. 6.7 .. ..<br />
<strong>Human</strong> development groups<br />
Very high human development 1.05 17.0 83 102 106 1.01 14 0.99 1.06 46.9 35.3 25.8 34.0 0.93<br />
High human development 1.11 27.4 74 105 97 1.05 36 0.90 1.10 38.9 32.3 21.6 30.0 ..<br />
Medium human development 1.08 40.8 33 111 68 1.06 164 0.70 1.35 .. 16.4 19.9 26.9 ..<br />
Low human development 1.04 101.8 18 94 36 1.16 553 0.57 1.54 .. .. 22.0 24.4 ..<br />
Developing countries 1.08 48.8 41 105 71 1.07 231 0.82 1.28 .. 23.0 21.0 28.4 ..<br />
Regions<br />
Arab States 1.05 47.7 36 96 73 1.20 142 0.80 2.31 .. 8.6 15.5 28.0 ..<br />
East Asia and the Pacific 1.12 23.1 73 105 90 0.99 63 0.88 0.87 .. 23.8 19.6 29.2 ..<br />
Europe and Central Asia 1.06 26.6 44 104 97 1.04 24 0.91 1.03 40.6 28.7 19.0 29.6 ..<br />
Latin America and the Caribbean 1.05 64.3 75 105 99 1.20 67 0.99 1.48 42.9 36.5 28.1 31.8 0.88<br />
South Asia 1.10 33.7 23 112 65 1.04 175 0.63 1.37 .. 12.5 17.4 26.8 ..<br />
Sub-Saharan Africa 1.04 103.0 26 97 40 1.12 551 0.74 1.34 .. .. 23.3 24.3 ..<br />
Least developed countries 1.04 91.4 23 100 41 1.10 432 0.74 1.42 .. .. 22.3 25.8 ..<br />
Small island developing states 1.06 59.0 .. 104 74 1.24 204 0.95 1.73 .. .. 23.4 30.1 ..<br />
Organisation for Economic<br />
Co‐operation and <strong>Development</strong> 1.05 22.4 79 102 104 0.99 15 0.97 1.04 45.7 34.0 27.7 34.6 0.91<br />
World 1.07 44.7 46 104 75 1.06 210 0.87 1.21 40.4 28.0 22.5 30.1 ..<br />
Maternal<br />
mortality<br />
ratio<br />
Population<br />
with at<br />
least some<br />
secondary<br />
education<br />
(deaths<br />
per<br />
100,000 (female to<br />
live births) male ratio)<br />
Total<br />
unemployment<br />
rate<br />
(female to<br />
male ratio)<br />
Share<br />
of paid<br />
employment<br />
in nonagriculture,<br />
female<br />
(% of<br />
total paid<br />
employment<br />
in nonagriculture)<br />
Female<br />
legislators,<br />
senior<br />
officials<br />
and<br />
managers<br />
(% of total)<br />
Share of<br />
seats in<br />
parliament<br />
(% held by<br />
women)<br />
Life<br />
expectancy<br />
at age 50,<br />
female<br />
(years)<br />
Old-age<br />
pension<br />
recipients<br />
(female to<br />
male ratio)<br />
262 | HUMAN DEVELOPMENT REPORT <strong>2016</strong>
HUMAN DEVELOPMENT REPORT <strong>2016</strong><br />
<strong>Human</strong> <strong>Development</strong> for Everyone<br />
NOTES<br />
Three-colour coding is used to visualize partial<br />
grouping of countries by indicator. For each<br />
indicator countries are divided into three groups of<br />
approximately equal size (terciles): the top third, the<br />
middle third and the bottom third. Sex ratio at birth is<br />
an exception — countries are divided into two groups:<br />
the natural group (countries with a value between<br />
1.04–1.07, inclusive), which uses darker shading, and<br />
the gender-biased group (all other countries), which<br />
uses lighter shading. SeeTechnical note 6 at http://hdr.<br />
undp.org/sites/default/files/hdr<strong>2016</strong>_technical_notes.<br />
pdf for details about partial grouping in this table.<br />
a The natural sex ratio at birth is commonly<br />
assumed and empirically confirmed to be 1.05<br />
male births to 1 female birth.<br />
b Data are the average of period estimates for<br />
2010–2015 and projections for 2015–2020.<br />
c Data refer to 2015 or the most recent year<br />
available.<br />
d Data refer to the most recent year available<br />
during the period specified.<br />
e Data refer to 2014 or the most recent year<br />
available.<br />
f Refers to 2014.<br />
g Refers to 2012.<br />
h Excludes the 36 special rotating delegates<br />
appointed on an ad hoc basis.<br />
i Refers to 2013.<br />
DEFINITIONS<br />
Sex ratio at birth: Number of male births per<br />
female birth.<br />
Adolescent birth rate: Number of births to women<br />
ages 15–19 per 1,000 women ages 15–19.<br />
Gross enrolment ratio, female: Total enrolment<br />
of girls in a given level of education (pre-primary,<br />
primary or secondary), regardless of age, expressed<br />
as a percentage of the official school-age female<br />
population for the same level of education.<br />
Youth unemployment rate, female to male<br />
ratio: Ratio of the percentage of the female labour<br />
force population ages 15–24 that is not in paid<br />
employment or self-employed but is available for<br />
work and is actively seeking paid employment or<br />
self-employment to the percentage of the male<br />
labour force population ages 15–24 that is not in<br />
paid employment or self-employed but is available<br />
for work and is actively seeking paid employment or<br />
self-employment.<br />
Maternal mortality ratio: Number of deaths due to<br />
pregnancy-related causes per 100,000 live births.<br />
Population with at least some secondary<br />
education, female to male ratio: Ratio of the<br />
percentage of the female population ages 25<br />
and older that has reached (but not necessarily<br />
completed) a secondary level of education to<br />
percentage of the male population ages 25 and older<br />
with the same level of education achievement.<br />
Total unemployment rate, female to male ratio:<br />
Ratio of the percentage of the female labour force<br />
population ages 15 and older that is not in paid<br />
employment or self-employed but is available for<br />
work and is actively seeking paid employment or<br />
self-employment to the percentage of the male<br />
labour force population ages 15 and older that is not<br />
in paid employment or self-employed but is available<br />
for work and is actively seeking paid employment or<br />
self-employment.<br />
Share of paid employment in nonagriculture,<br />
female: Share of women in paid employment in the<br />
nonagricultural sector, which comprises industry and<br />
services activities.<br />
Female legislators, senior officials and<br />
managers: Share of legislators, senior officials and<br />
managers who are female.<br />
Share of seats in parliament: Proportion of seats<br />
held by women in the national parliament, expressed<br />
as percentage of total seats. For countries with a<br />
bicameral legislative system, the share of seats is<br />
calculated based on both houses.<br />
Life expectancy at age 50, female: Additional<br />
number of years that a 50-year-old woman could<br />
expect to live if prevailing patterns of female agespecific<br />
mortality rates stay the same throughout the<br />
rest of her life.<br />
Old-age pension recipients, female to male<br />
ratio: Ratio of the percentage of women above<br />
the statutory pensionable age receiving an old-age<br />
pension (contributory, noncontributory or both) to the<br />
percentage of men above the statutory pensionable<br />
age receiving an old-age pension (contributory,<br />
noncontributory or both).<br />
MAIN DATA SOURCES<br />
Columns 1, 2, 13: UNDESA (2015s).<br />
Columns 3–5: UNESCO Institute for Statistics<br />
(<strong>2016</strong>).<br />
Columns 6 and 9: HDRO calculations based on<br />
ILO (<strong>2016</strong>a).<br />
Column 7: UN Maternal Mortality Estimation Group<br />
(<strong>2016</strong>).<br />
Column 8: HDRO calculations based on UNESCO<br />
Institute for Statistics (<strong>2016</strong>), Barro and Lee (<strong>2016</strong>),<br />
ICF Macro Demographic and Health Surveys and<br />
United Nations Children’s Fund Multiple Indicator<br />
Cluster Surveys.<br />
Column 10: ILO (<strong>2016</strong>b).<br />
Column 11: World Bank (<strong>2016</strong>a).<br />
Column 12: IPU (<strong>2016</strong>).<br />
Column 14: HDRO calculations based on ILO<br />
(<strong>2016</strong>c).<br />
DASH<br />
BOARD<br />
1<br />
DASHBOARD 1 Life-course gender gap | 263
DASHBOARD<br />
2<br />
Sustainable development<br />
Country groupings (terciles)<br />
Top third Middle third Bottom third<br />
Three-colour coding is used to visualize partial grouping of countries by indicator. For each indicator<br />
countries are divided into three groups of approximately equal size (terciles): the top third, the<br />
middle third and the bottom third. See Notes after the table.<br />
DASH<br />
BOARD<br />
2<br />
HDI rank<br />
Renewable<br />
energy<br />
consumption<br />
(% of total<br />
final energy<br />
consumption)<br />
Environmental sustainability Economic sustainability Social sustainability<br />
Carbon dioxide<br />
emissions<br />
Per<br />
capita<br />
(tonnes)<br />
2012 b 2013<br />
Average<br />
annual<br />
change<br />
(%)<br />
Forest area<br />
(% of<br />
total land<br />
area a )<br />
1990/<br />
2013 2015<br />
Change<br />
(%)<br />
Fresh water<br />
withdrawals<br />
(% of total<br />
renewable<br />
water<br />
resources)<br />
Natural<br />
resource<br />
depletion<br />
(% of<br />
GNI)<br />
Adjusted<br />
net<br />
savings<br />
(% of<br />
GNI)<br />
External<br />
debt<br />
stock<br />
(% of<br />
GNI)<br />
Research<br />
and<br />
development<br />
expenditure<br />
(% of<br />
GDP)<br />
Concentration<br />
index<br />
(exports)<br />
(value)<br />
Income<br />
quintile<br />
ratio<br />
Average<br />
annual<br />
change<br />
(%)<br />
Gender<br />
Inequality<br />
Index<br />
Average<br />
annual<br />
change<br />
(%)<br />
Population<br />
in multidimensional<br />
poverty<br />
Average<br />
annual<br />
change<br />
(%)<br />
Old-age<br />
(ages 65<br />
and older)<br />
dependency<br />
ratio<br />
(per 100<br />
people ages<br />
15–64)<br />
1990–<br />
2010– 2005– 2005–<br />
2015 2005–2014 c 2014 c 2014 c 2014 c 2005–2014 c 2014 2000/2014 2005/2015 2005/2014 2030 d<br />
VERY HIGH HUMAN DEVELOPMENT<br />
1 Norway 58.0 11.7 2.0 33.2 –0.2 0.8 7.1 21.0 .. 1.7 0.372 .. –3.8 .. 32.2<br />
2 Australia 8.4 16.3 0.2 16.2 –2.9 3.9 3.3 8.5 .. 2.2 0.266 0.0 –1.4 .. 31.3<br />
2 Switzerland 22.7 5.0 –1.0 31.7 9.0 3.8 0.0 15.0 .. 3.0 0.256 .. –5.1 .. 38.3<br />
4 Germany 12.4 9.2 .. 32.8 1.2 21.4 0.0 13.3 .. 2.9 0.097 .. –4.3 .. 47.7<br />
5 Denmark 27.6 6.8 –1.6 14.4 12.6 10.6 1.0 14.5 .. 3.1 0.086 .. –3.7 .. 37.1<br />
5 Singapore 0.5 9.4 –2.1 23.1 –5.2 .. 0.0 36.9 .. 2.2 0.250 .. –5.3 .. 36.5<br />
7 Netherlands 4.7 10.1 –0.2 11.2 9.3 11.8 0.4 16.9 .. 2.0 0.097 .. –4.3 .. 41.9<br />
8 Ireland 7.0 7.6 –0.7 10.9 62.2 1.5 0.1 16.1 .. 1.5 0.241 .. –3.5 .. 29.2<br />
9 Iceland 78.1 6.1 –1.1 0.5 205.6 1.8 0.0 11.2 .. 1.9 0.445 .. –5.9 .. 32.5<br />
10 Canada 20.6 13.5 –0.6 38.2 –0.3 1.3 2.1 7.0 .. 1.6 0.179 –0.2 –3.1 .. 38.5<br />
10 United States 7.9 16.4 –0.7 33.9 2.7 13.6 0.7 6.4 .. 2.7 0.095 0.4 –2.8 .. 33.8<br />
12 Hong Kong, China (SAR) 1.1 6.3 1.2 .. .. .. .. .. .. 0.7 0.233 .. .. .. 43.7<br />
13 New Zealand 30.8 7.6 0.3 38.6 5.1 1.6 0.9 13.8 .. 1.2 0.203 .. –1.0 .. 34.9<br />
14 Sweden 49.9 4.6 –1.2 68.9 0.8 1.6 0.2 18.8 .. 3.2 0.091 .. –0.9 .. 37.0<br />
15 Liechtenstein .. 1.4 .. 43.1 6.2 .. .. .. .. .. .. .. .. .. ..<br />
16 United Kingdom 4.4 7.1 –1.3 13.0 13.2 5.5 0.6 3.6 .. 1.7 0.111 .. –3.8 .. 35.0<br />
17 Japan 4.5 9.8 0.4 68.5 0.0 18.9 0.0 3.4 .. 3.6 0.128 .. –2.1 .. 53.1<br />
18 Korea (Republic of) 1.6 11.8 3.2 63.4 –3.9 41.9 0.0 18.7 .. 4.3 0.148 .. –4.4 .. 37.6<br />
19 Israel 8.7 8.8 0.5 7.6 25.0 .. 0.2 15.3 .. 4.1 0.287 2.2 –4.0 .. 22.9<br />
20 Luxembourg 4.1 18.7 –1.5 33.5 .. 1.2 0.0 12.5 .. 1.3 0.107 .. –5.8 .. 28.3<br />
21 France 12.6 5.1 –1.0 31.0 17.7 14.1 0.0 6.6 .. 2.3 0.092 .. –3.6 .. 40.5<br />
22 Belgium 7.4 8.4 –1.0 22.6 .. 32.8 0.0 9.8 .. 2.5 0.104 .. –2.9 .. 38.1<br />
23 Finland 39.1 8.5 –0.9 73.1 1.8 6.0 0.2 6.3 .. 3.2 0.135 .. –3.6 .. 43.3<br />
24 Austria 34.5 7.4 –0.1 46.9 2.5 4.5 0.1 11.8 .. 3.0 0.061 .. –3.9 .. 40.5<br />
25 Slovenia 19.3 7.0 .. 62.0 5.1 3.6 0.5 10.8 .. 2.4 0.158 –1.0 –6.4 .. 42.7<br />
26 Italy 12.1 5.7 –1.1 31.6 22.5 28.1 0.1 3.5 .. 1.3 0.054 .. –5.2 .. 48.6<br />
27 Spain 15.7 5.1 –0.4 36.8 33.2 33.0 0.0 6.6 .. 1.2 0.092 .. –3.3 .. 41.4<br />
28 Czech Republic 10.9 9.4 .. 34.5 1.5 12.6 0.1 5.7 .. 2.0 0.113 0.5 –1.6 .. 36.1<br />
29 Greece 13.9 6.3 –0.6 31.5 22.9 14.0 0.1 –5.8 .. 0.8 0.339 .. –3.5 .. 41.3<br />
30 Brunei Darussalam 0.0 18.9 –1.0 72.1 –8.0 .. 27.1 25.8 .. .. 0.646 .. .. .. 16.2<br />
30 Estonia 24.9 15.1 .. 52.7 1.2 13.4 0.8 16.5 .. 1.4 0.118 –0.6 –4.6 .. 37.9<br />
32 Andorra .. 6.5 .. 34.0 0.0 .. .. .. .. .. 0.192 .. .. .. ..<br />
33 Cyprus 8.4 5.2 –0.4 18.7 7.2 26.5 0.0 0.3 .. 0.5 0.209 .. –2.5 .. 26.9<br />
33 Malta 2.6 5.2 –0.7 1.1 0.0 44.4 .. .. .. 0.8 0.375 .. –1.9 .. 39.9<br />
33 Qatar .. 40.5 2.2 0.0 .. 374.1 13.8 29.6 .. 0.5 0.519 .. .. .. 5.1<br />
36 Poland 11.1 7.9 –0.8 30.8 6.3 19.0 0.7 10.0 .. 0.9 0.065 –0.6 –1.5 .. 36.3<br />
37 Lithuania 24.3 4.3 .. 34.8 12.1 2.6 0.4 20.1 .. 1.0 0.142 1.9 –3.2 .. 36.0<br />
38 Chile 30.3 4.7 2.8 23.9 16.2 3.8 8.0 4.1 .. 0.4 0.334 –1.9 –1.9 .. 27.0<br />
38 Saudi Arabia 0.0 17.9 1.3 0.5 0.0 943.3 20.4 20.0 .. 0.1 0.738 .. –6.2 .. 9.5<br />
40 Slovakia 10.5 6.2 .. 40.3 1.0 1.1 0.5 1.3 .. 0.9 0.175 0.1 –0.6 .. 31.6<br />
41 Portugal 25.6 4.4 0.2 34.7 –7.5 11.8 0.1 2.4 .. 1.3 0.079 .. –4.9 .. 44.7<br />
42 United Arab Emirates 0.1 18.7 –1.8 3.9 31.7 1,867.0 9.2 .. .. 0.7 0.405 .. –6.1 .. 7.7<br />
43 Hungary 10.2 4.2 –2.0 22.9 14.0 4.9 0.3 10.9 .. 1.4 0.113 2.1 0.0 .. 32.9<br />
44 Latvia 40.4 3.5 .. 54.0 5.8 0.7 1.0 0.2 .. 0.7 0.096 0.9 –1.1 .. 36.7<br />
45 Argentina 8.8 4.5 1.1 9.9 –22.1 4.3 2.7 10.1 .. 0.6 0.186 –3.8 .. .. 20.3<br />
45 Croatia 20.0 4.2 .. 34.3 3.8 0.6 1.6 3.0 .. 0.8 0.078 1.4 –2.0 .. 39.7<br />
47 Bahrain .. 23.7 –0.2 0.8 144.4 .. 26.4 –2.0 .. 0.1 0.369 .. –2.6 .. 8.7<br />
48 Montenegro 46.2 3.6 .. 61.5 32.1 .. .. .. 52.9 0.4 0.234 .. .. –23.4 30.0<br />
49 Russian Federation 3.2 12.5 .. 49.8 0.8 1.4 9.5 11.9 .. 1.2 0.370 1.6 –2.3 .. 29.5<br />
264 | HUMAN DEVELOPMENT REPORT <strong>2016</strong>
HUMAN DEVELOPMENT REPORT <strong>2016</strong><br />
<strong>Human</strong> <strong>Development</strong> for Everyone<br />
HDI rank<br />
Renewable<br />
energy<br />
consumption<br />
(% of total<br />
final energy<br />
consumption)<br />
Environmental sustainability Economic sustainability Social sustainability<br />
Carbon dioxide<br />
emissions<br />
Per<br />
capita<br />
(tonnes)<br />
2012 b 2013<br />
Average<br />
annual<br />
change<br />
(%)<br />
Forest area<br />
(% of<br />
total land<br />
area a )<br />
1990/<br />
2013 2015<br />
Change<br />
(%)<br />
Fresh water<br />
withdrawals<br />
(% of total<br />
renewable<br />
water<br />
resources)<br />
Natural<br />
resource<br />
depletion<br />
(% of<br />
GNI)<br />
Adjusted<br />
net<br />
savings<br />
(% of<br />
GNI)<br />
External<br />
debt<br />
stock<br />
(% of<br />
GNI)<br />
Research<br />
and<br />
development<br />
expenditure<br />
(% of<br />
GDP)<br />
Concentration<br />
index<br />
(exports)<br />
(value)<br />
Income<br />
quintile<br />
ratio<br />
Average<br />
annual<br />
change<br />
(%)<br />
Gender<br />
Inequality<br />
Index<br />
Average<br />
annual<br />
change<br />
(%)<br />
Population<br />
in multidimensional<br />
poverty<br />
Average<br />
annual<br />
change<br />
(%)<br />
Old-age<br />
(ages 65<br />
and older)<br />
dependency<br />
ratio<br />
(per 100<br />
people ages<br />
15–64)<br />
1990–<br />
2010– 2005– 2005–<br />
2015 2005–2014 c 2014 c 2014 c 2014 c 2005–2014 c 2014 2000/2014 2005/2015 2005/2014 2030 d<br />
50 Romania 21.7 3.5 –2.8 29.8 7.4 3.0 1.0 21.6 57.0 0.4 0.099 –0.9 0.2 .. 33.6<br />
51 Kuwait .. 27.3 0.7 0.4 81.2 .. 22.3 18.7 .. 0.3 0.657 .. –1.0 .. 6.8<br />
HIGH HUMAN DEVELOPMENT<br />
52 Belarus 7.2 6.7 .. 42.5 10.9 2.6 1.2 17.3 54.3 0.7 0.250 –1.1 .. .. 30.3<br />
52 Oman .. 15.7 4.1 0.0 0.0 .. 34.9 –20.1 .. 0.2 0.592 .. .. .. 7.8<br />
54 Barbados 9.5 5.1 0.9 14.7 0.0 87.5 0.7 –0.3 .. .. 0.163 .. –1.2 .. 35.6<br />
54 Uruguay 46.4 2.2 2.4 10.5 131.3 .. 2.6 8.1 .. 0.3 0.215 –1.6 –2.8 .. 26.8<br />
56 Bulgaria 15.8 5.4 –2.0 35.2 17.1 25.7 0.8 10.7 90.1 0.8 0.105 1.6 –0.9 .. 37.0<br />
56 Kazakhstan 1.4 15.4 .. 1.2 –3.3 18.4 13.7 3.0 83.3 0.2 0.668 –2.5 –4.5 –9.9 15.6<br />
58 Bahamas 1.6 8.2 0.3 51.4 0.0 .. 0.1 2.3 .. .. 0.412 .. 1.7 .. 22.4<br />
59 Malaysia 6.8 8.0 4.2 67.6 –0.8 1.9 5.5 12.0 66.8 1.3 0.178 –0.7 –0.1 .. 14.5<br />
60 Palau 2.7 10.7 –1.6 87.6 .. .. .. .. .. .. 0.845 .. .. .. ..<br />
60 Panama 22.9 2.7 3.9 62.1 –8.4 0.7 0.1 24.3 43.9 0.1 0.167 –2.4 –0.3 .. 17.7<br />
62 Antigua and Barbuda .. 5.8 0.8 22.3 –4.9 8.5 .. .. .. .. 0.597 .. .. .. 19.0<br />
63 Seychelles 0.5 7.2 5.4 89.4 1.1 .. 0.1 .. .. 0.3 0.489 1.0 .. .. 19.8<br />
64 Mauritius 3.4 3.0 3.4 19.0 –6.1 .. 0.0 2.7 90.9 0.2 0.219 .. 0.5 .. 25.9<br />
65 Trinidad and Tobago 0.3 34.5 4.0 45.7 –2.6 8.8 13.4 –14.4 .. 0.1 0.371 .. –0.7 .. 21.9<br />
66 Costa Rica 38.6 1.6 2.3 54.0 7.5 2.1 1.2 14.7 43.8 0.6 0.536 –1.5 –2.0 .. 22.6<br />
66 Serbia 19.6 6.3 .. 31.1 9.9 2.6 .. .. 78.7 0.8 0.105 –0.8 .. –21.6 32.7<br />
68 Cuba 18.9 3.5 0.4 30.1 56.9 18.3 3.0 .. .. 0.4 0.225 .. –2.0 .. 36.2<br />
69 Iran (Islamic Republic of) 0.9 8.0 3.3 6.6 17.8 .. 12.6 .. 1.3 0.3 0.571 –2.3 –0.2 .. 13.4<br />
70 Georgia 28.7 2.0 .. 40.6 2.6 2.9 0.8 9.4 85.0 0.1 0.222 0.2 –1.1 .. 29.7<br />
71 Turkey 12.8 4.2 2.0 15.2 21.8 19.8 0.3 10.8 51.6 1.0 0.069 –0.3 –3.7 .. 18.0<br />
71 Venezuela (Bolivarian Republic of) 11.2 6.1 0.0 52.9 –10.3 1.7 11.6 14.5 .. .. 0.760 –1.7 –0.3 .. 15.6<br />
73 Sri Lanka 60.9 0.8 5.5 33.0 –9.4 24.5 0.5 17.3 59.7 0.1 0.204 –0.6 –1.3 .. 23.7<br />
74 Saint Kitts and Nevis .. 5.1 2.3 42.3 0.0 51.3 .. .. .. .. 0.286 .. .. .. ..<br />
75 Albania 38.2 1.7 0.1 28.2 –2.2 4.3 3.8 –1.6 60.8 0.2 0.297 –0.8 –2.3 .. 31.8<br />
76 Lebanon 5.0 4.3 1.5 13.4 4.8 24.3 0.0 –7.7 68.0 .. 0.122 .. .. .. 21.1<br />
77 Mexico 9.4 3.9 0.3 34.0 –5.3 17.2 5.0 7.9 34.7 0.5 0.131 –1.1 –1.9 –2.3 15.4<br />
78 Azerbaijan 2.8 3.8 .. 13.8 34.6 34.5 19.6 17.8 16.1 0.2 0.856 7.4 .. .. 18.7<br />
79 Brazil 43.6 2.5 2.5 59.0 –9.7 0.9 2.5 7.3 24.1 1.2 0.147 .. –1.4 –6.2 19.9<br />
79 Grenada 10.0 2.9 4.2 50.0 0.0 7.1 .. .. 75.6 .. 0.194 .. .. .. 16.2<br />
81 Bosnia and Herzegovina 15.3 5.7 .. 42.7 –1.5 0.9 .. .. 57.1 0.3 0.104 2.1 .. –11.2 37.3<br />
82 The former Yugoslav Republic of Macedonia 16.5 4.0 .. 39.6 10.3 8.6 2.2 13.5 65.7 0.4 0.189 1.9 –3.6 –9.2 27.7<br />
83 Algeria 0.2 3.5 0.7 0.8 17.3 66.9 14.7 26.9 2.6 0.1 0.490 .. –2.1 .. 14.0<br />
84 Armenia 6.6 1.8 .. 11.7 –0.9 37.9 1.8 0.4 74.8 0.2 0.223 –0.9 –2.6 .. 28.7<br />
84 Ukraine 2.8 6.0 .. 16.7 4.1 8.5 3.2 –2.7 100.3 0.7 0.127 –1.7 –2.0 –8.8 30.8<br />
86 Jordan 3.1 3.4 0.5 1.1 –0.6 92.4 0.5 15.7 68.5 0.4 0.156 .. –1.4 5.4 8.0<br />
87 Peru 28.2 1.9 2.9 57.8 –5.1 0.7 4.8 13.3 34.3 .. 0.227 –3.0 –1.6 –10.2 15.5<br />
87 Thailand 23.0 4.5 4.6 32.1 17.1 13.1 3.4 12.0 38.2 0.5 0.076 –1.2 0.0 .. 29.2<br />
89 Ecuador 13.4 2.8 2.3 50.5 –4.4 2.2 7.8 11.2 26.6 0.3 0.500 –3.4 –1.8 –12.4 16.0<br />
90 China 18.4 7.6 5.6 22.2 32.6 19.5 2.3 34.5 9.3 2.0 0.101 .. –2.7 –4.4 25.3<br />
91 Fiji 12.2 1.9 2.4 55.7 6.7 0.3 0.8 4.7 21.6 .. 0.255 0.8 –2.1 .. 15.3<br />
92 Mongolia 3.2 14.5 5.2 8.1 0.1 1.6 12.2 8.2 186.2 0.2 0.485 –0.6 –3.1 –9.4 11.8<br />
92 Saint Lucia 2.3 2.2 2.8 33.3 –6.9 14.3 0.1 .. 39.2 .. 0.331 .. .. .. 19.9<br />
94 Jamaica 14.7 2.8 –0.4 31.0 –2.7 7.5 1.0 10.9 94.3 .. 0.470 .. –0.9 –14.1 21.0<br />
95 Colombia 26.3 1.9 0.5 52.7 –9.2 0.5 6.8 3.3 28.0 0.2 0.459 –1.7 –2.3 .. 18.8<br />
96 Dominica 11.6 1.8 3.5 57.8 –13.3 10.0 0.2 .. 56.3 .. 0.404 .. .. .. ..<br />
97 Suriname 19.4 3.9 –0.5 98.3 –0.6 0.6 9.8 –12.1 .. .. 0.484 .. 0.4 –4.7 16.2<br />
97 Tunisia 13.0 2.5 2.0 6.7 61.9 69.7 3.8 –2.7 57.3 0.6 0.145 –1.4 –0.9 .. 18.6<br />
99 Dominican Republic 13.2 2.1 2.3 41.0 79.5 30.4 1.4 14.6 44.0 .. 0.178 –1.9 –0.8 –0.7 15.6<br />
99 Saint Vincent and the Grenadines 5.1 1.9 4.2 69.2 8.0 7.9 0.1 .. 46.5 .. 0.295 .. .. .. 19.7<br />
101 Tonga 1.1 2.0 4.0 12.5 0.0 .. 0.1 .. 44.2 .. 0.296 –0.3 4.1 .. 11.9<br />
102 Libya 1.7 8.1 –0.1 0.1 0.0 822.9 16.2 34.1 .. .. 0.765 .. –3.4 .. 10.5<br />
103 Belize 26.8 1.5 –0.4 59.9 –15.5 .. 5.2 –5.5 82.9 .. 0.158 .. –2.4 1.3 8.3<br />
DASH<br />
BOARD<br />
2<br />
DASHBOARD 2 Sustainable development | 265
DASHBOARD 2 SUSTAINABLE DEVELOPMENT<br />
DASH<br />
BOARD<br />
2<br />
HDI rank<br />
Renewable<br />
energy<br />
consumption<br />
(% of total<br />
final energy<br />
consumption)<br />
Environmental sustainability Economic sustainability Social sustainability<br />
Carbon dioxide<br />
emissions<br />
Per<br />
capita<br />
(tonnes)<br />
2012 b 2013<br />
Average<br />
annual<br />
change<br />
(%)<br />
Forest area<br />
(% of<br />
total land<br />
area a )<br />
1990/<br />
2013 2015<br />
Change<br />
(%)<br />
Fresh water<br />
withdrawals<br />
(% of total<br />
renewable<br />
water<br />
resources)<br />
Natural<br />
resource<br />
depletion<br />
(% of<br />
GNI)<br />
Adjusted<br />
net<br />
savings<br />
(% of<br />
GNI)<br />
External<br />
debt<br />
stock<br />
(% of<br />
GNI)<br />
Research<br />
and<br />
development<br />
expenditure<br />
(% of<br />
GDP)<br />
Concentration<br />
index<br />
(exports)<br />
(value)<br />
Income<br />
quintile<br />
ratio<br />
Average<br />
annual<br />
change<br />
(%)<br />
Gender<br />
Inequality<br />
Index<br />
Average<br />
annual<br />
change<br />
(%)<br />
Population<br />
in multidimensional<br />
poverty<br />
Average<br />
annual<br />
change<br />
(%)<br />
Old-age<br />
(ages 65<br />
and older)<br />
dependency<br />
ratio<br />
(per 100<br />
people ages<br />
15–64)<br />
1990–<br />
2010– 2005– 2005–<br />
2015 2005–2014 c 2014 c 2014 c 2014 c 2005–2014 c 2014 2000/2014 2005/2015 2005/2014 2030 d<br />
104 Samoa 23.2 1.3 2.2 60.4 31.5 .. 0.8 .. 58.1 .. 0.277 .. –1.0 .. 13.7<br />
105 Maldives 3.2 2.7 6.3 3.3 0.0 15.7 0.1 8.6 39.1 .. 0.731 –0.1 –2.1 .. 11.0<br />
105 Uzbekistan 2.4 3.4 .. 7.6 5.7 100.6 9.0 .. 20.4 0.2 0.281 .. .. .. 11.9<br />
MEDIUM HUMAN DEVELOPMENT<br />
107 Moldova (Republic of) 4.7 1.4 .. 12.4 28.2 8.7 0.4 13.8 74.0 0.4 0.146 –2.8 –1.5 –2.8 24.7<br />
108 Botswana 23.9 2.5 1.1 19.1 –21.0 .. 1.3 34.8 15.1 0.3 0.824 –1.8 –1.9 .. 7.7<br />
109 Gabon 69.6 2.9 –2.1 89.3 4.5 0.1 26.2 –2.1 28.6 0.6 0.628 .. –0.2 .. 8.5<br />
110 Paraguay 62.7 0.8 1.8 38.6 –27.6 0.6 5.3 10.0 47.9 0.1 0.335 –2.3 –1.3 .. 13.2<br />
111 Egypt 5.5 2.4 2.6 0.1 65.9 126.6 6.4 2.3 14.2 0.7 0.163 .. .. –11.9 10.5<br />
111 Turkmenistan .. 12.8 .. 8.8 0.0 .. 35.7 .. 1.0 .. 0.756 .. .. .. 11.0<br />
113 Indonesia 37.1 1.9 3.7 50.2 –23.2 .. 2.6 26.3 34.1 0.1 0.152 .. –1.4 –10.3 12.4<br />
114 Palestine, State of .. 0.6 .. 1.5 1.0 48.8 .. .. .. .. 0.190 .. .. .. 6.5<br />
115 Viet Nam 35.6 1.7 7.5 47.6 65.6 9.3 4.0 15.0 40.6 0.2 0.143 0.8 0.7 .. 18.3<br />
116 Philippines 29.4 1.0 1.8 27.0 22.7 17.0 1.7 28.7 22.7 0.1 0.231 –1.0 –0.7 –2.7 10.3<br />
117 El Salvador 34.0 1.0 3.5 12.8 –29.7 8.1 2.5 0.5 59.6 0.1 0.212 –3.7 –2.4 .. 17.3<br />
118 Bolivia (Plurinational State of) 28.0 1.9 3.8 50.6 –12.8 0.4 9.5 8.3 27.0 0.2 0.474 –4.7 –1.9 .. 12.7<br />
119 South Africa 16.9 8.9 –0.1 7.6 0.0 30.2 3.1 2.1 42.3 0.7 0.119 2.6 –1.3 2.5 10.5<br />
120 Kyrgyzstan 22.5 1.7 .. 3.3 –23.8 32.6 6.1 –5.8 101.1 0.1 0.175 –1.3 –4.2 –5.5 12.1<br />
121 Iraq 1.6 4.9 2.2 1.9 3.3 .. 18.5 –2.6 .. 0.0 0.972 .. .. –6.3 6.0<br />
122 Cabo Verde 21.2 0.9 5.1 22.3 55.7 .. 0.5 20.3 86.4 0.1 0.411 –1.7 .. .. 10.0<br />
123 Morocco 11.3 1.8 2.7 12.6 13.7 35.7 1.0 16.6 41.1 0.7 0.157 –0.1 –1.3 .. 16.1<br />
124 Nicaragua 53.1 0.8 1.0 25.9 –31.0 0.9 7.4 11.7 88.8 .. 0.221 –3.7 –1.0 –8.7 13.1<br />
125 Guatemala 66.2 0.9 2.0 33.0 –25.4 2.6 4.6 2.6 33.1 0.0 0.132 –2.3 –1.6 .. 9.5<br />
125 Namibia 32.9 1.3 17.9 8.4 –21.0 .. 1.2 16.9 .. 0.1 0.212 .. .. 1.1 7.4<br />
127 Guyana 36.1 2.5 2.1 84.0 –0.8 0.5 10.8 –10.4 73.0 .. 0.424 .. –0.2 –0.6 15.0<br />
127 Micronesia (Federated States of) .. 1.4 .. 91.8 .. .. 0.1 .. .. .. 0.426 –5.7 .. .. 10.8<br />
129 Tajikistan 58.0 0.4 .. 2.9 1.0 51.1 1.1 14.3 44.3 0.1 0.406 –0.1 –1.2 –8.6 9.1<br />
130 Honduras 53.4 1.2 3.5 41.0 –43.6 .. 4.4 10.4 40.6 .. 0.235 –3.9 –1.1 –6.7 11.0<br />
131 India 39.0 1.6 3.6 23.8 10.5 33.9 2.9 19.0 22.7 0.8 0.175 .. –1.6 .. 12.5<br />
132 Bhutan 90.0 1.2 7.1 72.3 34.7 0.4 16.9 14.7 105.1 .. 0.362 .. –1.1 .. 10.8<br />
133 Timor-Leste 43.1 0.4 .. 46.1 –29.0 .. .. .. .. .. 0.906 –2.0 .. .. 8.2<br />
134 Vanuatu 34.2 0.4 –0.3 36.1 0.0 .. 0.0 .. 17.2 .. 0.638 .. .. .. 9.9<br />
135 Congo 48.2 0.6 0.6 65.4 –1.7 .. 39.2 –69.8 33.3 .. 0.788 .. –0.4 9.5 7.0<br />
135 Equatorial Guinea 29.8 6.8 14.2 55.9 –15.7 .. 67.2 .. .. .. 0.698 .. .. .. 9.4<br />
137 Kiribati 2.9 0.6 2.8 15.0 0.0 .. 0.0 .. .. .. 0.897 .. .. .. 9.5<br />
138 Lao People’s Democratic Republic 86.5 0.3 8.6 81.3 6.3 1.1 12.2 –4.1 95.9 .. 0.285 1.3 .. –6.5 8.1<br />
139 Bangladesh 38.3 0.4 4.9 11.0 –4.4 2.9 2.6 25.2 18.8 .. 0.396 –0.4 –0.9 –5.3 10.6<br />
139 Ghana 49.5 0.6 3.4 41.0 8.2 .. 17.5 1.6 47.7 0.4 0.401 1.1 –0.7 –3.1 6.5<br />
139 Zambia 88.2 0.3 –0.8 65.4 –7.9 .. 8.9 3.5 28.9 0.3 0.612 7.2 –1.6 –2.0 4.8<br />
142 Sao Tome and Principe 43.2 0.6 1.7 55.8 –4.3 .. 1.6 .. 63.9 .. 0.624 –0.5 .. .. 6.2<br />
143 Cambodia 72.6 0.4 3.6 53.6 –26.9 0.5 2.3 3.1 42.9 .. 0.317 .. –1.5 –5.8 10.4<br />
144 Nepal 84.7 0.2 8.8 25.4 –24.7 4.5 5.8 32.7 20.0 0.3 0.145 –0.8 –2.2 –10.1 10.8<br />
145 Myanmar 78.7 0.2 3.8 44.5 –25.9 .. 3.9 .. 10.2 .. 0.273 .. .. .. 12.5<br />
146 Kenya 78.5 0.3 0.9 7.8 –6.6 10.5 2.8 4.0 26.7 0.8 0.194 1.3 –1.3 –5.6 6.1<br />
147 Pakistan 45.5 0.8 1.2 1.9 –41.7 74.4 2.7 14.1 23.9 0.3 0.193 0.2 –0.9 0.8 8.6<br />
LOW HUMAN DEVELOPMENT<br />
148 Swaziland 39.5 0.9 2.5 34.1 24.2 .. 1.4 –1.6 13.8 .. 0.272 0.6 –0.6 .. 6.6<br />
149 Syrian Arab Republic 2.4 1.9 –2.0 2.7 32.1 84.2 .. 9.2 14.3 .. 0.172 .. 0.2 4.3 9.0<br />
150 Angola 57.2 1.4 4.9 46.4 –5.1 0.5 24.5 3.0 23.9 .. 0.958 –3.5 .. .. 5.0<br />
151 Tanzania (United Republic of) 88.2 0.2 3.9 52.0 –17.6 .. 2.0 15.1 30.1 0.5 0.180 –0.4 –0.7 .. 6.2<br />
152 Nigeria 86.5 0.6 1.4 7.7 –59.4 4.6 6.6 11.0 4.9 0.2 0.758 –2.9 .. –1.1 5.1<br />
153 Cameroon 78.1 0.3 3.3 39.8 –22.6 .. 5.6 –2.3 16.4 .. 0.442 3.1 –1.5 –1.5 5.8<br />
154 Papua New Guinea 53.4 0.8 2.1 74.1 –0.2 0.1 15.0 .. 147.6 .. 0.280 –4.4 –1.3 .. 6.4<br />
154 Zimbabwe 75.6 0.9 –2.0 36.4 –36.6 17.9 3.8 .. 84.2 .. 0.312 .. –0.7 –4.7 5.0<br />
156 Solomon Islands 67.2 0.4 –1.2 78.1 –6.0 .. 36.0 –11.1 17.0 .. 0.524 .. .. .. 7.0<br />
157 Mauritania 33.3 0.7 1.9 0.2 –45.9 11.8 20.7 –17.0 73.4 .. 0.468 –2.0 .. –4.2 6.8<br />
158 Madagascar 78.9 0.1 2.2 21.4 –8.9 .. 4.3 –5.3 27.6 0.0 0.253 –1.5 .. .. 6.4<br />
266 | HUMAN DEVELOPMENT REPORT <strong>2016</strong>
HUMAN DEVELOPMENT REPORT <strong>2016</strong><br />
<strong>Human</strong> <strong>Development</strong> for Everyone<br />
HDI rank<br />
Renewable<br />
energy<br />
consumption<br />
(% of total<br />
final energy<br />
consumption)<br />
Environmental sustainability Economic sustainability Social sustainability<br />
Carbon dioxide<br />
emissions<br />
Per<br />
capita<br />
(tonnes)<br />
2012 b 2013<br />
Average<br />
annual<br />
change<br />
(%)<br />
Forest area<br />
(% of<br />
total land<br />
area a )<br />
1990/<br />
2013 2015<br />
Change<br />
(%)<br />
Fresh water<br />
withdrawals<br />
(% of total<br />
renewable<br />
water<br />
resources)<br />
Natural<br />
resource<br />
depletion<br />
(% of<br />
GNI)<br />
Adjusted<br />
net<br />
savings<br />
(% of<br />
GNI)<br />
External<br />
debt<br />
stock<br />
(% of<br />
GNI)<br />
Research<br />
and<br />
development<br />
expenditure<br />
(% of<br />
GDP)<br />
Concentration<br />
index<br />
(exports)<br />
(value)<br />
Income<br />
quintile<br />
ratio<br />
Average<br />
annual<br />
change<br />
(%)<br />
Gender<br />
Inequality<br />
Index<br />
Average<br />
annual<br />
change<br />
(%)<br />
Population<br />
in multidimensional<br />
poverty<br />
Average<br />
annual<br />
change<br />
(%)<br />
Old-age<br />
(ages 65<br />
and older)<br />
dependency<br />
ratio<br />
(per 100<br />
people ages<br />
15–64)<br />
1990–<br />
2010– 2005– 2005–<br />
2015 2005–2014 c 2014 c 2014 c 2014 c 2005–2014 c 2014 2000/2014 2005/2015 2005/2014 2030 d<br />
159 Rwanda 86.8 0.1 –0.2 19.5 50.9 .. 5.7 4.8 26.1 .. 0.439 0.3 –2.0 –4.6 7.0<br />
160 Comoros 46.8 0.2 1.6 19.9 –24.5 .. 3.4 –2.2 22.4 .. 0.547 .. .. .. 6.3<br />
160 Lesotho 4.2 1.1 .. 1.6 22.5 .. 4.6 29.2 33.6 0.0 0.395 0.9 –0.3 .. 6.1<br />
162 Senegal 51.4 0.6 1.5 43.0 –11.5 .. 1.1 12.4 36.6 0.5 0.222 0.4 –1.3 –3.4 5.6<br />
163 Haiti 83.1 0.2 2.2 3.5 –16.4 10.3 3.1 16.6 22.2 .. 0.499 1.4 0.2 –2.7 9.6<br />
163 Uganda 90.3 0.1 5.0 10.4 –56.4 1.1 11.5 3.1 19.8 0.5 0.191 –1.0 –1.3 –1.1 4.3<br />
165 Sudan 64.0 0.3 1.9 8.1 –37.5 71.2 3.6 6.1 30.6 0.3 .. .. –1.2 .. 6.8<br />
166 Togo 72.7 0.3 2.0 3.5 –72.6 .. 7.8 –19.5 24.5 0.3 0.179 .. –1.3 –1.1 5.4<br />
167 Benin 50.6 0.6 6.2 38.2 –25.2 .. 1.4 12.3 22.8 .. 0.283 .. –0.5 –1.4 5.8<br />
168 Yemen 1.0 1.0 0.9 1.0 0.0 168.6 8.1 –11.5 22.0 .. 0.531 .. –0.2 0.9 5.7<br />
169 Afghanistan 10.8 0.7 5.2 2.1 0.0 .. 1.6 –18.3 12.2 .. 0.308 .. –1.0 .. 5.0<br />
170 Malawi 79.2 0.1 0.8 33.4 –19.2 7.9 10.8 1.8 40.1 .. 0.482 –3.4 –0.5 –4.2 5.6<br />
171 Côte d’Ivoire 74.4 0.4 –0.6 32.7 1.8 1.8 4.0 13.0 33.0 .. 0.357 1.4 –0.2 2.5 5.6<br />
172 Djibouti 34.4 0.7 1.1 0.2 0.0 .. .. .. 62.5 .. 0.173 2.2 .. .. 9.1<br />
173 Gambia 48.8 0.3 1.0 48.2 10.4 .. 7.0 8.3 63.9 0.1 0.340 .. 0.3 –0.9 4.9<br />
174 Ethiopia 93.5 0.1 2.6 12.5 –17.8 .. 11.2 14.5 30.4 0.6 0.313 1.4 .. .. 6.6<br />
175 Mali 83.9 0.1 1.0 3.9 –29.5 4.3 10.6 14.8 29.5 0.7 0.523 –2.2 –0.4 –1.2 4.5<br />
176 Congo (Democratic Republic of the) 96.0 0.0 –4.7 67.3 –4.9 0.1 31.8 –26.6 19.1 0.1 0.400 .. –0.2 –0.6 5.8<br />
177 Liberia 89.4 0.2 –0.1 43.4 –15.2 .. 27.4 –27.9 37.4 .. 0.498 .. –0.3 –2.6 5.9<br />
178 Guinea-Bissau 88.6 0.1 –0.5 70.1 –11.0 .. 12.3 –19.3 26.6 .. 0.936 8.0 .. .. 6.1<br />
179 Eritrea 80.4 0.1 e .. 15.0 –6.8 .. 15.1 .. 23.8 .. 0.366 .. .. .. 4.9<br />
179 Sierra Leone 80.3 0.2 1.9 42.2 –2.4 0.1 7.7 4.7 28.4 .. 0.481 .. –0.1 –0.5 4.8<br />
181 Mozambique 88.4 0.2 3.0 48.2 –12.5 .. 1.8 8.5 47.6 0.4 0.260 0.0 –0.9 0.1 6.4<br />
181 South Sudan .. 0.1 .. .. .. 1.3 .. .. .. .. .. .. .. .. 6.2<br />
183 Guinea 76.3 0.2 0.4 25.9 –12.4 .. 19.2 –47.8 22.9 .. 0.491 –2.5 .. –2.2 6.1<br />
184 Burundi 96.6 0.0 –2.7 10.7 –4.5 .. 13.8 –8.6 22.3 0.1 0.356 –3.5 –1.1 –1.4 5.9<br />
185 Burkina Faso 80.0 0.2 4.4 19.6 –21.9 6.1 10.9 9.9 20.5 0.2 0.473 –3.7 .. –0.7 4.7<br />
186 Chad 90.6 0.0 2.8 3.9 –27.3 1.9 13.0 .. 21.6 .. 0.905 .. –0.8 .. 4.7<br />
187 Niger 81.3 0.1 0.6 0.9 –41.3 2.9 13.7 5.7 32.1 .. 0.426 .. –0.5 –0.6 5.8<br />
188 Central African Republic 78.4 0.1 –0.3 35.6 –1.7 0.1 0.1 .. 36.7 .. 0.358 .. .. –1.3 6.8<br />
OTHER COUNTRIES OR TERRITORIES<br />
Korea (Democratic People’s Rep. of) 16.0 2.0 .. 41.8 –38.7 11.2 .. .. .. .. 0.341 .. .. .. 17.8<br />
Marshall Islands .. 1.9 2.9 70.2 .. .. .. .. .. .. 0.760 .. .. .. ..<br />
Monaco .. .. .. .. .. .. .. .. .. 0.0 .. .. .. .. ..<br />
Nauru .. 4.3 –4.8 0.0 .. .. .. .. .. .. 0.819 .. .. .. ..<br />
San Marino .. .. .. 0.0 .. .. .. .. .. .. .. .. .. .. ..<br />
Somalia 94.2 0.1 14.1 10.1 –23.2 .. 8.6 .. .. .. 0.605 .. .. .. 5.4<br />
Tuvalu .. .. .. 33.3 0.0 .. .. .. .. .. 0.752 .. .. .. ..<br />
<strong>Human</strong> development groups<br />
Very high human development 9.1 10.9 –0.4 34.7 1.0 6.1 1.4 8.3 .. 2.4 — — — — —<br />
High human development 17.3 6.2 1.4 29.4 –0.9 5.1 3.5 25.1 19.4 1.6 — — — — —<br />
Medium human development 35.6 1.6 1.1 29.2 –9.9 15.2 4.1 16.8 27.2 0.5 — — — — —<br />
Low human development 78.5 0.4 0.3 25.0 –13.8 .. 8.9 6.3 20.0 .. — — — — —<br />
Developing countries 23.8 3.4 0.7 26.6 –6.7 7.2 4.6 21.9 21.0 1.2 — — — — —<br />
Regions<br />
Arab States 3.6 4.8 0.5 3.0 –23.7 102.2 13.9 12.8 24.8 0.4 — — — — —<br />
East Asia and the Pacific 20.1 5.8 –0.6 29.8 3.8 .. 2.5 .. 14.3 .. — — — — —<br />
Europe and Central Asia 7.3 5.3 .. 9.1 8.3 17.0 4.8 8.9 56.7 0.7 — — — — —<br />
Latin America and the Caribbean 26.3 3.0 1.6 46.3 –9.4 1.7 4.5 8.4 30.1 .. — — — — —<br />
South Asia 32.5 1.6 3.8 14.7 7.6 23.9 4.2 18.7 20.5 0.7 — — — — —<br />
Sub-Saharan Africa 63.2 0.8 0.6 28.2 –11.7 .. 8.3 5.7 24.7 0.4 — — — — —<br />
Least developed countries 73.1 0.3 2.1 26.8 –12.4 .. 8.8 9.0 25.3 .. — — — — —<br />
Small island developing states 15.3 2.6 0.1 69.3 1.2 .. 4.4 .. 64.6 .. — — — — —<br />
Organisation for Economic<br />
Co‐operation and <strong>Development</strong> 10.4 9.7 –0.5 31.3 1.5 8.8 0.7 7.7 .. 2.5 — — — — —<br />
World 17.4 4.7 0.0 30.8 –3.2 6.9 2.2 13.0 21.4 2.0 — — — — —<br />
DASH<br />
BOARD<br />
2<br />
DASHBOARD 2 Sustainable development | 267
DASHBOARD 2 SUSTAINABLE DEVELOPMENT<br />
NOTES<br />
Three-colour coding is used to visualize partial<br />
grouping of countries by indicator. For each<br />
indicator countries are divided into three groups of<br />
approximately equal size (terciles): the top third,<br />
the middle third and the bottom third. SeeTechnical<br />
note 7 at http://hdr.undp.org/sites/default/files/<br />
hdr<strong>2016</strong>_technical_notes.pdf for details about partial<br />
grouping in this table.<br />
a This column is intentionally left without colour<br />
because it is meant to provide context for the<br />
indicator on change in forest area.<br />
b Data refer to 2012 or the most recent year<br />
available.<br />
c Data refer to the most recent year available<br />
during the period specified.<br />
d Projections based on medium-fertility variant.<br />
e Refers to 2011.<br />
DEFINITIONS<br />
Renewable energy consumption: Share of<br />
renewable energy in total final energy consumption.<br />
Renewable sources include hydroelectric,<br />
geothermal, solar, tides, wind, biomass and biofuels.<br />
Carbon dioxide emissions per capita: <strong>Human</strong>originated<br />
carbon dioxide emissions stemming<br />
from the burning of fossil fuels, gas flaring and the<br />
production of cement, divided by midyear population.<br />
Includes carbon dioxide emitted by forest biomass<br />
through the depletion of forest areas.<br />
Forest area: Land spanning more than 0.5 hectare<br />
with trees taller than 5 metres and a canopy cover<br />
of more than 10 percent or trees able to reach these<br />
thresholds in situ. Excludes land predominantly<br />
under agricultural or urban land use, tree stands in<br />
agricultural production systems (for example, in fruit<br />
plantations and agroforestry systems) and trees in<br />
urban parks and gardens. Areas under reforestation<br />
that have not yet reached but are expected to reach<br />
a canopy cover of 10 percent and a tree height of<br />
5 metres are included, as are temporarily unstocked<br />
areas resulting from human intervention or natural<br />
causes that are expected to regenerate.<br />
Fresh water withdrawals: Total fresh water<br />
withdrawn, expressed as a percentage of total<br />
renewable water resources.<br />
Natural resource depletion: Monetary expression<br />
of energy, mineral and forest depletion, expressed as<br />
a percentage of gross national income (GNI).<br />
Adjusted net savings: Net national savings plus<br />
education expenditure and minus energy depletion,<br />
mineral depletion, net forest depletion, and carbon<br />
dioxide and particulate emissions damage. Net<br />
national savings are equal to gross national savings<br />
less the value of consumption of fixed capital.<br />
External debt stock: Debt owed to nonresidents<br />
repayable in foreign currency, goods or services,<br />
expressed as a percentage of gross national income<br />
(GNI).<br />
Research and development expenditure:<br />
Current and capital expenditures (both public and<br />
private) on creative work undertaken systematically<br />
to increase knowledge, including knowledge of<br />
humanity, culture, and society, and the use of<br />
knowledge for new applications. Research and<br />
development covers basic research, applied research<br />
and experimental development.<br />
Concentration index (exports): A measure of<br />
the degree of product concentration in exports<br />
from a country (also referred to as the Herfindahl-<br />
Hirschmann Index). A value closer to 0 indicates<br />
that a country’s exports are more homogeneously<br />
distributed among a series of products (reflecting<br />
a well diversified economy); a value closer to 1<br />
indicates that a country’s exports are concentrated<br />
highly among a few products.<br />
Income quintile ratio, average annual change:<br />
Change in the ratio of the average income of the<br />
richest 20 percent of the population to the average<br />
income of the poorest 20 percent of the population<br />
over 2000–2014, divided by the respective number<br />
of years.<br />
Gender Inequality Index, average annual<br />
change: Change in Gender Inequality Index value<br />
over 2005–2015, divided by the respective number<br />
of years.<br />
Population in multidimensional poverty,<br />
average annual change: Change in the<br />
percentage of the population in multidimensional<br />
poverty over 2005–2014, divided by respective<br />
number of years.<br />
Old-age dependency ratio: Projected ratio of the<br />
population ages 65 and older to the population ages<br />
15–64, expressed as the number of dependants per<br />
100 people of working age (ages 15–64).<br />
MAIN DATA SOURCES<br />
Columns 1–4 and 7–10: World Bank (<strong>2016</strong>a).<br />
Column 5: HDRO calculations based on data on<br />
forest area from World Bank (<strong>2016</strong>a).<br />
Column 6: FAO (<strong>2016</strong>b).<br />
Column 11: UNCTAD (<strong>2016</strong>).<br />
Column 12: HDRO calculations based on data from<br />
World Bank (<strong>2016</strong>a).<br />
Column 13: HDRO calculations based on the Gender<br />
Inequality Index time series.<br />
Column 14: HDRO calculations based on the<br />
Multidimensional Poverty Index time series.<br />
Column 15: UNDESA (2015a).<br />
DASH<br />
BOARD<br />
2<br />
268 | HUMAN DEVELOPMENT REPORT <strong>2016</strong>
HUMAN DEVELOPMENT REPORT <strong>2016</strong><br />
<strong>Human</strong> <strong>Development</strong> for Everyone<br />
Regions<br />
Arab States (20 countries or territories)<br />
Algeria, Bahrain, Djibouti, Egypt, Iraq, Jordan, Kuwait, Lebanon, Libya, Morocco, Oman, State of Palestine, Qatar, Saudi<br />
Arabia, Somalia, Sudan, Syrian Arab Republic, Tunisia, United Arab Emirates, Yemen<br />
East Asia and the Pacific (24 countries)<br />
Cambodia, China, Fiji, Indonesia, Kiribati, Democratic People’s Republic of Korea, Lao People’s Democratic Republic,<br />
Malaysia, Marshall Islands, Federated States of Micronesia, Mongolia, Myanmar, Nauru, Palau, Papua New Guinea,<br />
Philippines, Samoa, Solomon Islands, Thailand, Timor-Leste, Tonga, Tuvalu, Vanuatu, Viet Nam<br />
Europe and Central Asia (17 countries)<br />
Albania, Armenia, Azerbaijan, Belarus, Bosnia and Herzegovina, Georgia, Kazakhstan, Kyrgyzstan, Republic of Moldova,<br />
Montenegro, Serbia, Tajikistan, The former Yugoslav Republic of Macedonia, Turkey, Turkmenistan, Ukraine, Uzbekistan<br />
Latin America and the Caribbean (33 countries)<br />
Antigua and Barbuda, Argentina, Bahamas, Barbados, Belize, Plurinational State of Bolivia, Brazil, Chile, Colombia, Costa<br />
Rica, Cuba, Dominica, Dominican Republic, Ecuador, El Salvador, Grenada, Guatemala, Guyana, Haiti, Honduras, Jamaica,<br />
Mexico, Nicaragua, Panama, Paraguay, Peru, Saint Kitts and Nevis, Saint Lucia, Saint Vincent and the Grenadines,<br />
Suriname, Trinidad and Tobago, Uruguay, Bolivarian Republic of Venezuela<br />
South Asia (9 countries)<br />
Afghanistan, Bangladesh, Bhutan, India, Islamic Republic of Iran, Maldives, Nepal, Pakistan, Sri Lanka<br />
Sub-Saharan Africa (46 countries)<br />
Angola, Benin, Botswana, Burkina Faso, Burundi, Cabo Verde, Cameroon, Central African Republic, Chad, Comoros, Congo,<br />
Democratic Republic of the Congo, Côte d’Ivoire, Equatorial Guinea, Eritrea, Ethiopia, Gabon, Gambia, Ghana, Guinea,<br />
Guinea-Bissau, Kenya, Lesotho, Liberia, Madagascar, Malawi, Mali, Mauritania, Mauritius, Mozambique, Namibia, Niger,<br />
Nigeria, Rwanda, São Tomé and Príncipe, Senegal, Seychelles, Sierra Leone, South Africa, South Sudan, Swaziland, United<br />
Republic of Tanzania, Togo, Uganda, Zambia, Zimbabwe<br />
Note: Countries included in aggregates for Least Developed Countries and Small Island Developing States follow UN classifications, which are available at www.unohrlls.org.<br />
Regions | 269
Statistical references<br />
Barro, R.J., and J.-W. Lee. <strong>2016</strong>. Dataset of Educational<br />
Attainment, February <strong>2016</strong> Revision. www.barrolee.com.<br />
Accessed 8 June <strong>2016</strong>.<br />
CRED EM-DAT (Centre for Research on the Epidemiology<br />
of Disasters). <strong>2016</strong>. The International Disaster Database.<br />
www.emdat.be. Accessed 7 July <strong>2016</strong>.<br />
Eurostat. <strong>2016</strong>. European Union Statistics on Income and<br />
Living Conditions (EUSILC). Brussels. http://ec.europa.eu/<br />
eurostat/web/microdata/european-union-statistics-on<br />
-income-and-living-conditions. EUSILC UDB 2014 — version<br />
2 of August <strong>2016</strong>.<br />
FAO (Food and Agriculture Organization). <strong>2016</strong>a. FAOSTAT<br />
database. http://faostat3.fao.org. Accessed 25 May <strong>2016</strong>.<br />
———. <strong>2016</strong>b. AQUASTAT database. www..fao.org/nr/<br />
water/aquastat/main/index.stm. Accessed 23 June <strong>2016</strong>.<br />
Gallup. <strong>2016</strong>. Gallup World Poll Analytics database. www.<br />
gallup.com/products/170987/gallup-analytics.aspx.<br />
Accessed 25 January <strong>2016</strong>.<br />
ICF Macro. Various years. Demographic and Health Surveys.<br />
www.measuredhs.com. Accessed 15 July <strong>2016</strong>.<br />
ICPS (International Centre for Prison Studies). <strong>2016</strong>.<br />
“World Prison Population List (11th edition).” London.<br />
www.prisonstudies.org. Accessed 7 June <strong>2016</strong>.<br />
IDMC (Internal Displacement Monitoring Centre). <strong>2016</strong>.<br />
Global <strong>Report</strong> on Internal Displacement. www.internal<br />
-displacement.org. Accessed 7 June <strong>2016</strong>.<br />
ILO (International Labour Organization). <strong>2016</strong>a. Key Indicators<br />
of the Labour Market: 9th edition. Geneva. www.ilo.<br />
org/kilm. Accessed 9 June <strong>2016</strong>.<br />
———. <strong>2016</strong>b. ILOSTAT database. www..ilo.org/ilostat.<br />
Accessed 24 October <strong>2016</strong>.<br />
———. <strong>2016</strong>c. World Social Protection <strong>Report</strong> 2014–<br />
15. Geneva. www..social-protection.org/gimi/gess/<br />
ShowTheme.do?tid=3985. Accessed 7 June <strong>2016</strong>.<br />
IMF (International Monetary Fund). <strong>2016</strong>. World Economic<br />
Outlook database. Washington, DC. www.imf.org/external/pubs/ft/weo/<strong>2016</strong>/02/.<br />
Accessed 10 October <strong>2016</strong>.<br />
IPU (Inter-Parliamentary Union). <strong>2016</strong>. Women in national<br />
parliaments. www.ipu.org/wmn-e/classif-arc.htm.<br />
Accessed 19 July <strong>2016</strong>.<br />
ITU (International Telecommunication Union). <strong>2016</strong>. ICT<br />
Facts and Figures <strong>2016</strong>. www.itu.int/en/ITU-D/Statistics/<br />
Pages/stat/. Accessed 2 August <strong>2016</strong>.<br />
LIS (Luxembourg Income Study). <strong>2016</strong>. Luxembourg Income<br />
Study Project. www.lisdatacenter.org/data-access.<br />
Accessed 15 July <strong>2016</strong>.<br />
Palma, J.G. 2011. “Homogeneous Middles vs. Heterogeneous<br />
Tails, and the End of the ‘Inverted-U’: The Share of the<br />
Rich is What it’s All About.” Cambridge Working Papers in<br />
Economics, 1111. Cambridge University, UK. www..econ.<br />
cam.ac.uk/dae/repec/cam/pdf/cwpe1111.pdf. Accessed<br />
15 September 2013.<br />
Syrian Centre for Policy Research. <strong>2016</strong>. Confronting Fragmentation!<br />
Impact of Syrian Crisis <strong>Report</strong>. http://scpr<br />
-syria.org/publications/confronting-fragmentation/.<br />
Accessed 15 March <strong>2016</strong>.<br />
UNCTAD (United Nations Conference on Trade and<br />
<strong>Development</strong>). <strong>2016</strong>. Data Center. http://unctadstat.<br />
unctad.org/EN/. Accessed 15 October <strong>2016</strong>.<br />
UNDESA (United Nations Department of Economic and<br />
Social Affairs). 2011. World Population Prospects: The<br />
2010 Revision. New York. www.un.org/en/development/<br />
desa/population/publications/trends/population-prospects<br />
_2010_revision.shtml. Accessed 15 October 2013.<br />
———. 2014. World Urbanization Prospects: The 2014<br />
Revision, CD-ROM Edition. http://esa.un.org/unpd/wup/.<br />
CD-ROM. Accessed 20 July <strong>2016</strong>.<br />
———. 2015a. World Population Prospects: The 2015 Revision.<br />
New York. https://esa.un.org/unpd/wpp/. Accessed<br />
19 July <strong>2016</strong>.<br />
———. 2015b. Trends in International Migrant Stock: The<br />
2015 Revision. www..un.org/en/development/desa/population/migration/data/estimates2/estimates15.shtml.<br />
Accessed 1 August <strong>2016</strong>.<br />
UNECLAC (United Nations Economic Commission for<br />
Latin America and the Caribbean). <strong>2016</strong>. Preliminary<br />
Overview of the Economies of Latin America and the Caribbean,<br />
2015. Santiago. www..cepal.org/en/<br />
publications/type/preliminary-overview-economies-latin<br />
-america-and-caribbean. Accessed 15 March <strong>2016</strong>.<br />
UNESCO (United Nations Educational, Scientific and Cultural<br />
Organization) Institute for Statistics. <strong>2016</strong>. Data<br />
Centre. http://data.uis.unesco.org. Accessed 10 June <strong>2016</strong>.<br />
UNESCWA (United Nations Economic and Social Commission<br />
for Western Asia). <strong>2016</strong>. Survey of Economic<br />
and Social <strong>Development</strong>s in the Arab Region 2015–<strong>2016</strong>.<br />
Beirut. https://www.unescwa.org/publications/survey<br />
-economic-social-development-arab-region-2015-<strong>2016</strong>.<br />
Accessed 15 May <strong>2016</strong>.<br />
UNHCR (Office of the United Nations High Commissioner<br />
for Refugees). <strong>2016</strong>. UNHCR Global Trends 2015. www..<br />
unhcr.org/global-trends-2015.html. Accessed 7 July <strong>2016</strong>.<br />
UNICEF (United Nations Children’s Fund). <strong>2016</strong>. The State<br />
of the World’s Children <strong>2016</strong>: A fair chance for every child.<br />
New York. www..unicef.org/publications/files/UNICEF_<br />
SOWC_<strong>2016</strong>.pdf. Accessed 22 July <strong>2016</strong>.<br />
———. Various years. Multiple Indicator Cluster Surveys.<br />
New York. http://mics.unicef.org. Accessed 15 July <strong>2016</strong>.<br />
UN Inter-agency Group for Child Mortality Estimation. 2015.<br />
www..childmortality.org. Accessed 25 July <strong>2016</strong>.<br />
United Nations Statistics Division. <strong>2016</strong>a. National<br />
Accounts Main Aggregates Database. http://unstats.<br />
un.org/unsd/snaama. Accessed 15 October <strong>2016</strong>.<br />
———. <strong>2016</strong>b. Millennium <strong>Development</strong> Goals Indicators<br />
Database. http://data.un.org. Accessed 5 August <strong>2016</strong>.<br />
———. <strong>2016</strong>c. Sustainable <strong>Development</strong> Goals Indicators<br />
Database. http://data.un.org. Accessed 5 August <strong>2016</strong>.<br />
UN Maternal Mortality Estimation Group (World Health<br />
Organization, United Nations Children’s Fund, United<br />
Nations Population Fund and World Bank). <strong>2016</strong>. Maternal<br />
mortality data. http://data.unicef.org/topic/maternal<br />
-health/maternal-mortality/. Accessed 28 April <strong>2016</strong>.<br />
UNODC (United Nations Office on Drugs and Crime).<br />
<strong>2016</strong>. UNODC Statistics. https://data.unodc.org. Accessed<br />
7 July <strong>2016</strong>.<br />
UNOHCHR (United Nations Office of the High Commissioner<br />
for <strong>Human</strong> Rights). <strong>2016</strong>. <strong>Human</strong> rights treaties.<br />
https://treaties.un.org/Pages/Treaties.aspx?id=4&subid=<br />
A&clang=_en. Accessed 1 May <strong>2016</strong>.<br />
UN Women (United Nations Entity for Gender Equality<br />
and the Empowerment of Women). <strong>2016</strong>. “UN Women<br />
Global Database on Violence against Women.” New York.<br />
http://evaw-global-database.unwomen.org. Accessed 4<br />
August <strong>2016</strong>.<br />
WHO (World Health Organization). <strong>2016</strong>. Global Health<br />
Observatory. www.who.int/gho/. Accessed 25 July <strong>2016</strong>.<br />
WHO (World Health Organization) and UNICEF (United<br />
Nations Children’s Fund). <strong>2016</strong>. Estimates of National<br />
Routine Immunization Coverage: 2014 Revision. www..<br />
who.int/immunization/monitoring_surveillance/routine/<br />
coverage/en/index4.html. Accessed 22 July <strong>2016</strong>.<br />
World Bank. <strong>2016</strong>a. World <strong>Development</strong> Indicators database.<br />
Washington, DC. http://data.worldbank.org.<br />
Accessed 14 October <strong>2016</strong>.<br />
———. <strong>2016</strong>b. Gender Statistics database. Washington, DC.<br />
http://data.worldbank.org. Accessed 1 August <strong>2016</strong>.<br />
270 | HUMAN DEVELOPMENT REPORT <strong>2016</strong>
Key to HDI countries and ranks, 2015<br />
Afghanistan169<br />
Albania75<br />
Algeria83<br />
Andorra32<br />
Angola150<br />
Antigua and Barbuda 62<br />
Argentina45<br />
Armenia84<br />
Australia2<br />
Austria24<br />
Azerbaijan78<br />
Bahamas58<br />
Bahrain47<br />
Bangladesh139<br />
Barbados54<br />
Belarus52<br />
Belgium22<br />
Belize103<br />
Benin167<br />
Bhutan132<br />
Bolivia (Plurinational State of) 118<br />
Bosnia and Herzegovina 81<br />
Botswana108<br />
Brazil79<br />
Brunei Darussalam 30<br />
Bulgaria56<br />
Burkina Faso 185<br />
Burundi184<br />
Cabo Verde 122<br />
Cambodia143<br />
Cameroon153<br />
Canada10<br />
Central African Republic 188<br />
Chad186<br />
Chile38<br />
China90<br />
Colombia95<br />
Comoros160<br />
Congo135<br />
Congo (Democratic Republic of the) 176<br />
Costa Rica 66<br />
Côte d'Ivoire 171<br />
Croatia45<br />
Cuba68<br />
Cyprus33<br />
Czech Republic 28<br />
Denmark5<br />
Djibouti172<br />
Dominica96<br />
Dominican Republic 99<br />
Ecuador89<br />
Egypt111<br />
El Salvador 117<br />
Equatorial Guinea 135<br />
Eritrea179<br />
Estonia30<br />
Ethiopia174<br />
Fiji91<br />
Finland23<br />
France21<br />
Gabon109<br />
Gambia173<br />
Georgia70<br />
Germany4<br />
Ghana139<br />
Greece29<br />
Grenada79<br />
Guatemala125<br />
Guinea183<br />
Guinea-Bissau178<br />
Guyana127<br />
Haiti163<br />
Honduras130<br />
Hong Kong, China (SAR) 12<br />
Hungary43<br />
Iceland9<br />
India131<br />
Indonesia113<br />
Iran (Islamic Republic of) 69<br />
Iraq121<br />
Ireland8<br />
Israel19<br />
Italy26<br />
Jamaica94<br />
Japan17<br />
Jordan86<br />
Kazakhstan56<br />
Kenya146<br />
Kiribati137<br />
Korea (Republic of) 18<br />
Kuwait51<br />
Kyrgyzstan120<br />
Lao People's Democratic Republic 138<br />
Latvia44<br />
Lebanon76<br />
Lesotho160<br />
Liberia177<br />
Libya102<br />
Liechtenstein15<br />
Lithuania37<br />
Luxembourg20<br />
Madagascar158<br />
Malawi170<br />
Malaysia59<br />
Maldives105<br />
Mali175<br />
Malta33<br />
Mauritania157<br />
Mauritius64<br />
Mexico77<br />
Micronesia (Federated States of) 127<br />
Moldova (Republic of) 107<br />
Mongolia92<br />
Montenegro48<br />
Morocco123<br />
Mozambique181<br />
Myanmar145<br />
Namibia125<br />
Nepal144<br />
Netherlands7<br />
New Zealand 13<br />
Nicaragua124<br />
Niger187<br />
Nigeria152<br />
Norway1<br />
Oman52<br />
Pakistan147<br />
Palau60<br />
Palestine, State of 114<br />
Panama60<br />
Papua New Guinea 154<br />
Paraguay110<br />
Peru87<br />
Philippines116<br />
Poland36<br />
Portugal41<br />
Qatar33<br />
Romania50<br />
Russian Federation 49<br />
Rwanda159<br />
Saint Kitts and Nevis 74<br />
Saint Lucia 92<br />
Saint Vincent and the Grenadines 99<br />
Samoa104<br />
Sao Tome and Principe 142<br />
Saudi Arabia 38<br />
Senegal162<br />
Serbia66<br />
Seychelles63<br />
Sierra Leone 179<br />
Singapore5<br />
Slovakia40<br />
Slovenia25<br />
Solomon Islands 156<br />
South Africa 119<br />
South Sudan 181<br />
Spain27<br />
Sri Lanka 73<br />
Sudan165<br />
Suriname97<br />
Swaziland148<br />
Sweden14<br />
Switzerland2<br />
Syrian Arab Republic 149<br />
Tajikistan129<br />
Tanzania (United Republic of) 151<br />
Thailand87<br />
The former Yugoslav Republic of Macedonia 82<br />
Timor-Leste133<br />
Togo166<br />
Tonga101<br />
Trinidad and Tobago 65<br />
Tunisia97<br />
Turkey71<br />
Turkmenistan111<br />
Uganda163<br />
Ukraine84<br />
United Arab Emirates 42<br />
United Kingdom 16<br />
United States 10<br />
Uruguay54<br />
Uzbekistan105<br />
Vanuatu134<br />
Venezuela (Bolivarian Republic of) 71<br />
Viet Nam 115<br />
Yemen168<br />
Zambia139<br />
Zimbabwe154
United Nations <strong>Development</strong> Programme<br />
One United Nations Plaza<br />
New York, NY 10017<br />
ISBN 978-92-1-126413-5<br />
Empowered lives.<br />
Resilient nations.<br />
www.undp.org<br />
Universalism is at the core of the human development<br />
approach. <strong>Human</strong> freedoms must be enlarged for all human<br />
beings—not a few, not the most, but all, in every corner of<br />
the world—to be able to realize their full potential now and in<br />
the future. The same spirit is shared by the 2030 Agenda and<br />
the Sustainable <strong>Development</strong> Goals—leaving no one out. So<br />
human development must be ensured for everyone.<br />
Over the past quarter-century impressive progress has been<br />
made in human development, enriching billions of human lives.<br />
Yet progress has been uneven, bypassing groups, communities<br />
and societies. Some have achieved only the basics of human<br />
development, some not even that. Deprivations are deeper<br />
among people in specific locations or with specific conditions.<br />
And substantial barriers persist for universal human<br />
development, some of which are deeply embedded in social and<br />
political identities and relationships—such as blatant violence,<br />
discriminatory laws, exclusionary social norms, imbalances in<br />
political participation and unequal distribution of opportunities.<br />
However, human development is about more than satisfying<br />
basic needs. It encompasses voice and autonomy that matter<br />
in a dynamic world and through varying life conditions. <strong>Human</strong><br />
development is about agency, self-determination and the<br />
freedom to make choices and shape outcomes.<br />
<strong>Human</strong> development for everyone requires refocusing<br />
on some aspects of the human development approach—<br />
collective capabilities, not only individual capabilities; voice<br />
and autonomy, not only well-being; and inclusion, not only<br />
diversity. It also needs focusing on assessment perspectives<br />
going beyond averages and quantitative achievements only.<br />
Caring for those left out requires a four pronged strategy<br />
at the national level: reaching those left out using universal<br />
policies, pursuing measures for groups with special needs,<br />
making human development resilient and empowering those<br />
left out. National policies must be complemented with actions<br />
at the global level by addressing issues related to the mandate,<br />
governance structures and work of global institutions.<br />
We have every reason to hope that things can be<br />
changed and transformations can be made. What seem to<br />
be challenges today can be overcome tomorrow. The world<br />
has fewer than 15 years to achieve its inspirational agenda<br />
of leaving no one out. With our hearts, heads and hands<br />
together, we shall strive for peace and prosperity, partner<br />
with each other and seek a balance between the people and<br />
the planet. Once those objectives are achieved, we will reach<br />
the end of the road together. And when we look back, we will<br />
see that no one has been left out.<br />
“What humanity has achieved over the last 25 years gives us hope that fundamental changes are possible. We can build on what<br />
we have achieved, we can explore new possibilities to overcome challenges, we can attain what once seemed unattainable.<br />
Hopes are within our reach to realize”.<br />
—Helen Clark, administrator of the United Nations <strong>Development</strong> Programme<br />
“<strong>Human</strong> development for everyone is a commitment that transcends our country and we want our work to impact and enrich the<br />
lives of citizens from other nations.”<br />
—Juan Manuel Santos, president of Colombia and <strong>2016</strong> Nobel Peace Prize Laureate<br />
“We all have a responsibility, day in and day out, to make sustainability a guiding principle in action—as responsible politicians<br />
and decisionmakers in business and society, as individuals who are truly interested in our future.”<br />
—Dr. Angela Merkel, chancellor of the Federal Republic of Germany<br />
“Getting a clearer picture of poverty and deprivation is a fundamental first step towards designing and implementing more<br />
effective policies and interventions, as well as better targeting scarce resources where they will have the greatest impact.”<br />
—Melinda Gates, co-chair of the Bill & Melinda Gates Foundation<br />
“<strong>Human</strong> development reflects universalism—every life values, and every life is equally valuable. <strong>Human</strong> development has to be<br />
sustained and sustainable to enrich every human life so that we all can realize the full potential of our lives.”<br />
—Selim Jahan, lead author of the <strong>Report</strong>