Apr 2016

You also want an ePaper? Increase the reach of your titles
YUMPU automatically turns print PDFs into web optimized ePapers that Google loves.
with<br />
Prof Charles McGhee<br />
& A/Prof Dipika Patel<br />
Series Editors<br />
The ABCs of OCT in glaucoma<br />
Background<br />
BY HANNAH KERSTEN*<br />
AND PROFESSOR HELEN DANESH-MEYER<br />
Glaucoma is a multifactorial optic neuropathy characterised by<br />
slowly progressive degeneration of the retinal ganglion cells and<br />
their axons. Unfortunately, there is not yet one single test that can<br />
discriminate glaucomatous eyes from normal eyes; the diagnosis<br />
of glaucoma is made based on a specific pattern of structural and<br />
functional changes. In the past, the retinal nerve fibre layer (RNFL)<br />
was only able to be assessed subjectively by slit-lamp examination<br />
and retinal photography, providing qualitative data. Optical<br />
coherence tomography (OCT) was first described by Huang and<br />
colleagues in 1991 1 . OCT, as used to acquire high resolution, crosssectional<br />
images of the ocular structures, utilises low-coherence<br />
near infrared light (800-1400 nm) generated by a super-luminescent<br />
diode, which passes through the pupil to the posterior structures<br />
of the eye 1 . It is analogous to B-scan ultrasound except that it uses<br />
light instead of sound. Over the past 10 to 15 years, OCT has become<br />
an invaluable tool and is in widespread use in both optometry<br />
and ophthalmology. OCT is used in the diagnosis and longitudinal<br />
analysis of a multitude of ophthalmic disorders that affect the optic<br />
nerve and macula, including glaucoma. Newer spectral-domain OCT<br />
has increased resolution (approximately 3 – 5 µm) and faster scan<br />
acquisition time than older time-domain OCT technology. Common<br />
spectral-domain OCT models include the Zeiss Cirrus and the<br />
Heidelberg Spectralis.<br />
Peripapillary Retinal Nerve Fibre Layer Measurements<br />
Measurement of the peripapillary RNFL thickness using OCT<br />
is now a routine component of the comprehensive glaucoma<br />
assessment. In healthy eyes, the RNFL is generally thickest in<br />
the in the inferior quadrant, followed by the superior, nasal and<br />
temporal quadrants (the “ISNT” rule). There is, however, a large<br />
degree of RNFL variability in “normal” eyes, and there is some<br />
overlap in the structural characteristics of normal eyes and eyes<br />
with early optic nerve damage due to glaucoma 2 . Many patients<br />
will have anomalous structural features that may confound<br />
the interpretation of OCT measurements, and the eye may be<br />
incorrectly classified as “abnormal”. In patients with perimetric<br />
glaucoma, the location of the RNFL thinning should correlate<br />
with the visual field defect. In those with pre-perimetric disease,<br />
it is important to compare the peripapillary RNFL thickness in the<br />
individual quadrants with the appearance of the optic nerve head<br />
on clinical examination.<br />
The ability to detect and measure structural change is essential<br />
in the diagnosis and management of glaucoma. Progression<br />
analysis software, included with some OCT models, is able to<br />
track the progression of RNFL thinning over time (figures 1 and 2).<br />
It is necessary to review the RNFL overview at each visit, as well<br />
as the progression scans, as these overview scans will give more<br />
comprehensive information regarding RNFL thickness in each eye<br />
(as well as the differences between the two eyes). It is important<br />
to discriminate true disease-related changes from measurement<br />
variability and normal age-related change. When a scan is accurate<br />
and well-centred, the 95% tolerance for average RNFL thickness<br />
is approximately 4 µm 2 . Spectral-domain OCT is more sensitive at<br />
detecting glaucoma progression than time-domain OCT 3 .<br />
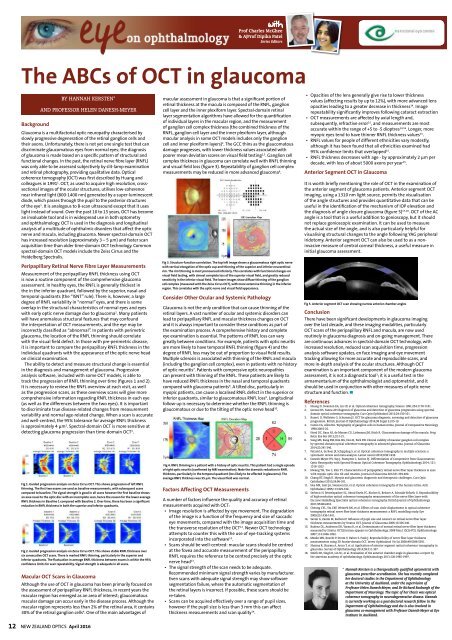
Fig 1. Guided progression analysis on Zeiss Cirrus OCT. This shows progression of left RNFL<br />
thinning. The first two exams are used as baseline measurements, with subsequent scans<br />
compared to baseline. The signal strength is good in all scans however the first baseline shows<br />
an area nasal to the optic disc with an incomplete scan, hence the reason for the lower average<br />
RNFL thickness in Baseline 1 compared with Baseline 2. Over time, there has been a significant<br />
reduction in RNFL thickness in both the superior and inferior quadrants.<br />
Fig 2. Guided progression analysis on Zeiss Cirrus OCT. This shows stable RNFL thickness over<br />
six consecutive OCT scans. There is marked RNFL thinning, particularly in the superior and<br />
inferior quadrants. The fluctuation in average RNFL thickness between exams is within the 95%<br />
confidence limits for scan repeatability. Signal strength is adequate in all scans.<br />
Macular OCT Scans in Glaucoma<br />
Although the use of OCT in glaucoma has been primarily focused on<br />
the assessment of peripapillary RNFL thickness, in recent years the<br />
macular region has emerged as an area of interest; glaucomatous<br />
macular damage can occur early in the disease process. Although the<br />
macular region represents less than 2% of the retinal area, it contains<br />
30% of the retinal ganglion cells 4 . One of the main advantages of<br />
12 NEW ZEALAND OPTICS <strong>Apr</strong>il <strong>2016</strong><br />
macular assessment in glaucoma is that a significant portion of<br />
retinal thickness at the macula is composed of the RNFL, ganglion<br />
cell layer and the inner plexiform layer. Spectral-domain retinal<br />
layer segmentation algorithms have allowed for the quantification<br />
of individual layers in the macular region, and the measurement<br />
of ganglion cell complex thickness (the combined thickness of the<br />
RNFL, ganglion cell layer and the inner plexiform layer, although<br />
macular analysis in some OCT models includes only the ganglion<br />
cell and inner plexiform layers) 3 . The GCC thins as the glaucomatous<br />
damage progresses, with lower thickness values associated with<br />
poorer mean deviation scores on visual field testing 2,5 . Ganglion cell<br />
complex thickness in glaucoma can correlate well with RNFL thinning<br />
and visual field loss (figure 3). Repeatability of ganglion cell complex<br />
measurements may be reduced in more advanced glaucoma 6 .<br />
Fig 3. Structure-function correlation. The top left image shows a glaucomatous right optic nerve<br />
with vertical elongation of the optic cup and thinning of the superior and inferior neuroretinal<br />
rim. The rim thinning is most pronounced inferiorly. This correlates with functional changes on<br />
visual field testing, with almost complete loss of the superior visual field, and greatly reduced<br />
sensitivity in the inferior visual field. The lower images show diffuse thinning of the ganglion<br />
cell complex (measured with the Zeiss Cirrus OCT), with more extensive thinning in the inferior<br />
region. This correlates with the optic nerve and visual field appearance.<br />
Consider Other Ocular and Systemic Pathology<br />
Glaucoma is not the only condition that can cause thinning of the<br />
retinal layers. A vast number of ocular and systemic disorders can<br />
lead to peripapillary RNFL and macular thickness changes on OCT<br />
and it is always important to consider these conditions as part of<br />
the examination process. A comprehensive history and complete<br />
eye examination is essential. The patterns of RNFL loss can vary<br />
greatly between conditions. For example, patients with optic neuritis<br />
are more likely to have temporal RNFL thinning (figure 4) and the<br />
degree of RNFL loss may be out of proportion to visual field results.<br />
Multiple sclerosis is associated with thinning of the RNFL and macula<br />
(including the ganglion cell complex), even in patients with no history<br />
of optic neuritis 7 . Patients with compressive optic neuropathies<br />
can present with thinning of the RNFL. These patients are likely to<br />
have reduced RNFL thickness in the nasal and temporal quadrants<br />
compared with glaucoma patients 8 . A tilted disc, particularly in<br />
myopic patients, can cause a localised RNFL defect in the superior or<br />
inferior quadrants, similar to glaucomatous RNFL loss 9 . Longitudinal<br />
follow-up is necessary to determine whether the RNFL thinning is<br />
glaucomatous or due to the tilting of the optic nerve head 10 .<br />
Fig 4. RNFL thinning in a patient with a history of optic neuritis. This patient had a single episode<br />
of right optic neuritis (confirmed by MRI examination). Note the dramatic reduction in RNFL<br />
thickness, particularly in the temporal quadrant (less likely to be affected in glaucoma). The<br />
average RNFL thickness was 55 µm. The visual field was normal.<br />
Factors Affecting OCT Measurements<br />
A number of factors influence the quality and accuracy of retinal<br />
measurements acquired with OCT:<br />
••<br />
Image resolution is affected by eye movement. The degradation<br />
of the image is a function of the frequency and size of saccadic<br />
eye movements, compared with the image acquisition time and<br />
the transverse resolution of the OCT 11 . Newer OCT technology<br />
attempts to counter this with the use of eye-tracking systems<br />
incorporated into the software 12 .<br />
••<br />
Scans should be well-centred: macular scans should be centred<br />
at the fovea and accurate measurement of the peripapillary<br />
RNFL requires the reference to be centred precisely at the optic<br />
nerve head 13 .<br />
••<br />
The signal strength of the scan needs to be adequate.<br />
Recommended minimum signal strength varies by manufacturer.<br />
Even scans with adequate signal strength may show software<br />
segmentation failure, where the automatic segmentation of<br />
the retinal layers is incorrect. If possible, these scans should be<br />
re-taken.<br />
••<br />
Scans can be acquired effectively over a range of pupil sizes,<br />
however if the pupil size is less than 3 mm this can affect<br />
thickness measurements and scan quality 14 .<br />
••<br />
Opacities of the lens generally give rise to lower thickness<br />
values (affecting results by up to 12%), with more advanced lens<br />
opacities leading to a greater decrease in thickness 14 . Image<br />
repeatability significantly improves following cataract extraction<br />
••<br />
OCT measurements are affected by axial length and,<br />
subsequently, refractive error 15 , and measurements are most<br />
accurate within the range of +5 to -5 dioptres 14,16 . Longer, more<br />
myopic eyes tend to have thinner RNFL thickness values 15 .<br />
••<br />
RNFL values for people of different ethnicities vary modestly,<br />
although it has been found that all ethnicities examined had<br />
95% confidence limits that overlapped 15 .<br />
••<br />
RNFL thickness decreases with age - by approximately 2 µm per<br />
decade, with loss of about 5000 axons per year 15 .<br />
Anterior Segment OCT in Glaucoma<br />
It is worth briefly mentioning the role of OCT in the examination of<br />
the anterior segment of glaucoma patients. Anterior segment OCT<br />
imaging, using a 1310 nm light source, permits the visualisation<br />
of the angle structures and provides quantitative data that can be<br />
useful in the identification of the mechanism of IOP elevation and<br />
the diagnosis of angle closure glaucoma (figure 5) 17,18 . OCT of the AC<br />
angle is a tool that is a useful addition to gonioscopy, but it should<br />
not replace gonioscopic examination. It can be used to measure<br />
the actual size of the angle, and is also particularly helpful for<br />
visualising structural changes to the angle following YAG peripheral<br />
iridotomy. Anterior segment OCT can also be used to as a noninvasive<br />
measure of central corneal thickness, a useful measure in<br />
initial glaucoma assessment.<br />
Fig 5. Anterior segment OCT scan showing narrow anterior chamber angles<br />
Conclusion<br />
There have been significant developments in glaucoma imaging<br />
over the last decade, and these imaging modalities, particularly<br />
OCT scans of the peripapillary RNFL and macula, are now used<br />
routinely in glaucoma diagnosis and on-going management. There<br />
are continuous advances in spectral-domain OCT technology, with<br />
increased resolution, reduced scan acquisition time, progression<br />
analysis software updates, en face imaging and eye movement<br />
tracking allowing for more accurate and reproducible scans, and<br />
more in-depth analysis of the ocular structures. Although OCT<br />
examination is an important component of the modern glaucoma<br />
assessment, it is not a diagnostic tool 3 ; it is a useful test in the<br />
armamentarium of the ophthalmologist and optometrist, and it<br />
should be used in conjunction with other measures of optic nerve<br />
structure and function. ▀<br />
References<br />
1. Huang D, Swanson EA, Lin CP, et al. Optical coherence tomography. Science 1991;254:1178-1181.<br />
2. Grewal DS, Tanna AP. Diagnosis of glaucoma and detection of glaucoma progression using spectral<br />
domain optical coherence tomography. Curr Opin Ophthalmol 2013;24:150-161.<br />
3. Bussel, II, Wollstein G, Schuman JS. OCT for glaucoma diagnosis, screening and detection of glaucoma<br />
progression. British Journal of Ophthalmology 2014;98 Suppl 2:ii15-19.<br />
4. Curcio CA, Allen KA. Topography of ganglion cells in human retina. Journal of Comparative Neurology<br />
1990;300:5-25.<br />
5. Hood DC, Raza AS, de Moraes CG, Liebmann JM, Ritch R. Glaucomatous damage of the macula. Prog<br />
Retin Eye Res 2013;32:1-21.<br />
6. Sung MS, Kang BW, Kim HG, Heo H, Park SW. Clinical validity of macular ganglion cell complex<br />
by spectral domain-optical coherence tomography in advanced glaucoma. Journal of Glaucoma<br />
2014;23:341-346.<br />
7. Petzold A, de Boer JF, Schippling S, et al. Optical coherence tomography in multiple sclerosis: a<br />
systematic review and meta-analysis. Lancet neurol 2010;9:921-932.<br />
8. Danesh-Meyer HV, Yap J, Frampton C, Savino PJ. Differentiation of Compressive from Glaucomatous<br />
Optic Neuropathy with Spectral-Domain Optical Coherence Tomography. Ophthalmology 2014; 121:<br />
1516-1523<br />
9. Hwang YH, Yoo C, Kim YY. Characteristics of peripapillary retinal nerve fiber layer thickness in eyes<br />
with myopic optic disc tilt and rotation. Journal of Glaucoma 2012;21:394-400.<br />
10. Chang RT, Singh K. Myopia and glaucoma: diagnostic and therapeutic challenges. Curr Opin<br />
Ophthalmol 2013;24:96-101.<br />
11. Hee MR, Izatt JA, Swanson EA, et al. Optical coherence tomography of the human retina. Arch<br />
Ophthalmol 1995;113:325-332.<br />
12. Serbecic N, Beutelspacher SC, Aboul-Enein FC, Kircher K, Reitner A, Schmidt-Erfurth U. Reproducibility<br />
of high-resolution optical coherence tomography measurements of the nerve fibre layer with<br />
the new Heidelberg Spectralis optical coherence tomography. British Journal of Ophthalmology<br />
2011;95:804-810.<br />
13. Cheung CYL, Yiu CKF, Weinreb RN, et al. Effects of scan circle displacement in optical coherence<br />
tomography retinal nerve fibre layer thickness measurement: a RNFL modelling study. Eye<br />
2009;23:1436-1441.<br />
14. Savini G, Zanini M, Barboni P. Influence of pupil size and cataract on retinal nerve fiber layer<br />
thickness measurements by Stratus OCT. Journal of Glaucoma 2006;15:336-340.<br />
15. Budenz DL, Anderson DR, Varma R, et al. Determinants of normal retinal nerve fiber layer thickness<br />
measured by Stratus OCT.[Erratum appears in Ophthalmology. 2008 Mar;115(3):472]. Ophthalmology<br />
2007;114:1046-1052.<br />
16. Menke MN, Knecht P, Sturm V, Dabov S, Funk J. Reproducibility of nerve fiber layer thickness<br />
measurements using 3D fourier-domain OCT. Invest Ophthalmol Vis Sci 2008;49:5386-5391.<br />
17. Sharma R, Sharma A, Arora T, et al. Application of anterior segment optical coherence tomography in<br />
glaucoma. Survey of Ophthalmology 2014;59:311-327.<br />
18. Smith SD, Singh K, Lin SC, et al. Evaluation of the anterior chamber angle in glaucoma: a report by<br />
the american academy of ophthalmology. Ophthalmology 2013;120:1985-1997.<br />
* Hannah Kersten is a therapeutically qualified optometrist with<br />
glaucoma prescriber accreditation. She has recently completed<br />
her doctoral studies in the Department of Ophthalmology<br />
at the University of Auckland, under the supervision of<br />
Professor Helen Danesh-Meyer, and Dr Richard Roxburgh of the<br />
Department of Neurology. The topic of her thesis was optical<br />
coherence tomography in neurodegenerative disease. Hannah<br />
is currently working as a post-doctoral research fellow in the<br />
Department of Ophthalmology and she is also involved in<br />
glaucoma co-management with Professor Danesh-Meyer at Eye<br />
Institute in Auckland.