
Create successful ePaper yourself
Turn your PDF publications into a flip-book with our unique Google optimized e-Paper software.
The Time-Temperature Graph<br />
We are going to heat a container that has 72.0 grams of ice (no liquid water yet!) in it. To make the<br />
illustration simple, please consider that 100% of the heat applied goes into the water. There is no loss<br />
of heat into heating the container and no heat is lost to the air.<br />
Let us suppose the ice starts at -10.0 °C and that the pressure is always one atmosphere. We will<br />
end the example with steam at 120.0 °C.<br />
There are five major steps to discuss in turn before this problem is completely solved. Here they are:<br />
1. the ice rises in temperature from -10.0 to 0.00 °C.<br />
2. the ice melts at 0.00 °C.<br />
3. the liquid water then rises in temperature from zero to 100.0 °C.<br />
4. the liquid water then boils at 100.0 °C.<br />
5. the steam then rises in temperature from 100.0 to 120.0 °C<br />
Each one of these steps will have a calculation associated with it. WARNING: many homework and<br />
test questions can be written which use less than the five steps. For example, suppose the water in<br />
the problem above started at 10.0 °C. Then, only steps 3, 4, and 5 would be required for solution.<br />
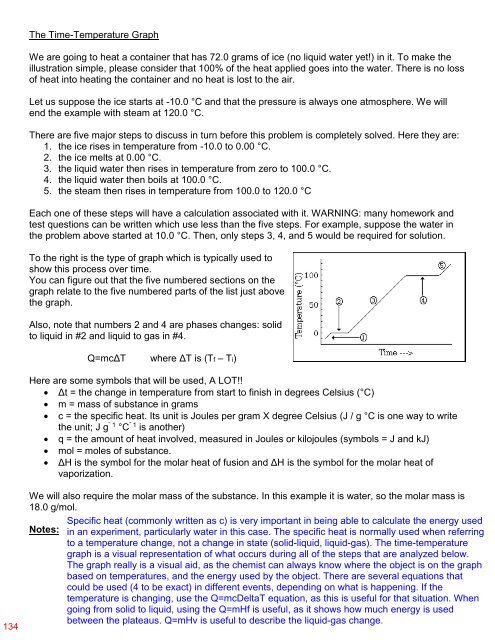
To the right is the type of graph which is typically used to<br />
show this process over time.<br />
You can figure out that the five numbered sections on the<br />
graph relate to the five numbered parts of the list just above<br />
the graph.<br />
Also, note that numbers 2 and 4 are phases changes: solid<br />
to liquid in #2 and liquid to gas in #4.<br />
Q=mcΔT<br />
where ΔT is (Tf – Ti)<br />
Here are some symbols that will be used, A LOT!!<br />
Δt = the change in temperature from start to finish in degrees Celsius (°C)<br />
m = mass of substance in grams<br />
c = the specific heat. Its unit is Joules per gram X degree Celsius (J / g °C is one way to write<br />
the unit; J g¯1 °C¯1 is another)<br />
q = the amount of heat involved, measured in Joules or kilojoules (symbols = J and kJ)<br />
mol = moles of substance.<br />
ΔH is the symbol for the molar heat of fusion and ΔH is the symbol for the molar heat of<br />
vaporization.<br />
134<br />
We will also require the molar mass of the substance. In this example it is water, so the molar mass is<br />
18.0 g/mol.<br />
Specific heat (commonly written as c) is very important in being able to calculate the energy used<br />
Notes: in an experiment, particularly water in this case. The specific heat is normally used when referring<br />
to a temperature change, not a change in state (solid-liquid, liquid-gas). The time-temperature<br />
graph is a visual representation of what occurs during all of the steps that are analyzed below.<br />
The graph really is a visual aid, as the chemist can always know where the object is on the graph<br />
based on temperatures, and the energy used by the object. There are several equations that<br />
could be used (4 to be exact) in different events, depending on what is happening. If the<br />
temperature is changing, use the Q=mcDeltaT equation, as this is useful for that situation. When<br />
going from solid to liquid, using the Q=mHf is useful, as it shows how much energy is used<br />
between the plateaus. Q=mHv is useful to describe the liquid-gas change.