International intellectual property
Globalization from a different angle Global Investor, 02/2006 Credit Suisse
Globalization from a different angle
Global Investor, 02/2006
Credit Suisse

You also want an ePaper? Increase the reach of your titles
YUMPU automatically turns print PDFs into web optimized ePapers that Google loves.
GLOBAL INVESTOR 2.06 Basics — 24<br />
report healthy balance sheets in 2005 and are expected to gear up<br />
(annual change in year-to-date fixed asset investments in 2006:<br />
+26.6%; industrial production: +20.5%). In addition, we estimate,<br />
for example, the value of Chinese consumption at USD 1.057 billion<br />
in 2005 (valued at the average annual RMB exchange rate of 8.19/<br />
USD). This is 48% higher in real terms than our 2004 estimate.<br />
China’s household consumption is so far only 3.8% of the global<br />
total (up 2.9% from 2004).<br />
The increasing spending power accents the need for infrastructure<br />
improvements, based simply on the fact that private consumption<br />
(cars, water pipes, infrastructure for housing, etc.) ultimately<br />
depends to a high degree on public infrastructure. One of the most<br />
accurate measures of economic and infrastructure development is<br />
the consumption of basic materials, in particular the consumption of<br />
cement. After 2002, the acceleration of cement demand increased<br />
sharply (see figure 5). In addition, Asia Pacific ex China and India<br />
stands in clear contrast to Asia Pacific as a whole, which underpins<br />
the importance of the role of India and China.<br />
Figure 3 shows cement consumption over the last 15 years<br />
(millions of tons) in major regions, and figure 4 shows the historic<br />
development of regional cement consumption since 1910 in regional<br />
economies, indicating increases in their infrastructure spending.<br />
The process reaches a self-energizing phase at a certain point,<br />
mainly driven by rising incomes, followed by increasing private consumption<br />
and the transformation of the economy from an agricultural<br />
economy via industrialization into a service society. While<br />
parts of China or India are still in a rural phase, other regions are<br />
already becoming significant financial centers.<br />
Urbanization and infrastructure in China and India<br />
China has the fastest growing construction industry in the world<br />
and currently accounts for approximately a quarter of the world’s<br />
building projects. A second wave of Chinese urbanization (secondtier<br />
cities not along the coast) is in the works. Given the historically<br />
high correlation between real estate development and metal<br />
consumption, statistical evidence for metal prices points towards a<br />
«second China» that will keep supply and demand tightly balanced.<br />
The positive outlook for the industry is being increasingly supported<br />
by the private sector. Overall, the development is boosted<br />
by the expanding economy, privatization, China’s entry to the World<br />
Trade Organization, the Olympic Games in 2008, foreign investments<br />
and changing laws.<br />
The 11th Five-Year Plan (2006–2010) foresees newly added<br />
employment of 45 million people in urban areas and the transfer of<br />
another 45 million from rural areas. Central government spending<br />
on infrastructure has actually declined because different projects<br />
are being increasingly outsourced to private investors or local<br />
governments. This means that a lot of infrastructure projects do<br />
not appear on government balance sheets anymore. This is, for<br />
example, the case for Shanghai’s metro lines, which are being built<br />
at stunning pace, or the expansion on Kowloon Railways, which<br />
never appear on Hong Kong’s government balance sheet. This<br />
supports our view that the measurement of basic materials consumption<br />
is still the most reliable indicator. Across all other economies<br />
throughout Asia Pacific, GDP growth is set to expand in 2006,<br />
in our view, and the construction sector will play a key role. Overall,<br />
the Asia Pacific region, primarily China, Indonesia, Taiwan and<br />
Malaysia, should see further strong infrastructure growth (the<br />
Philippines and Hong Kong are fiscally restrained).<br />
In India, the construction market was worth USD 51 billion and<br />
accounted for around 7% of GDP in 2004. Construction statistics<br />
are difficult to obtain and consequently make the forecast process<br />
quite difficult. We expect an increase in the contribution from the<br />
construction sector to India’s GDP as a result of the government’s<br />
major Golden Quadrilateral project (a road network linking the four<br />
biggest cities) and the Sagarmala project (an integrated port and<br />
shipping development scheme). Together with a large amount of<br />
infrastructure requirements and projects in the near future that are <br />
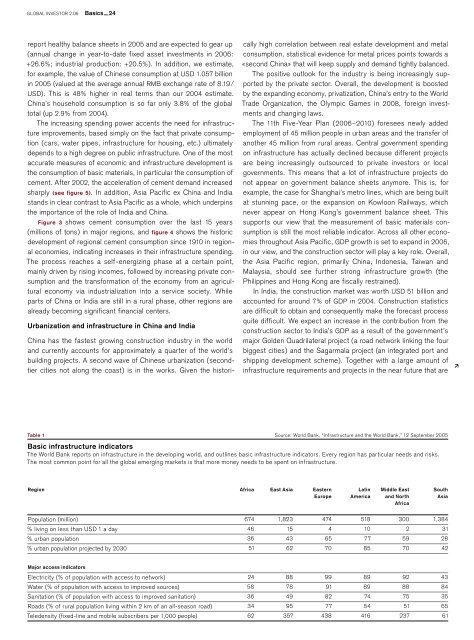
Table 1 Source: World Bank, “Infrastructure and the World Bank,” 12 September 2005<br />
Basic infrastructure indicators<br />
The World Bank reports on infrastructure in the developing world, and outlines basic infrastructure indicators. Every region has particular needs and risks.<br />
The most common point for all the global emerging markets is that more money needs to be spent on infrastructure.<br />
Region Africa East Asia Eastern<br />
Europe<br />
Latin<br />
America<br />
Middle East<br />
and North<br />
Africa<br />
South<br />
Asia<br />
Population (million) 674 1,823 474 518 300 1,384<br />
% living on less than USD 1 a day 46 15 4 10 2 31<br />
% urban population 36 43 65 77 59 28<br />
% urban population projected by 2030 51 62 70 85 70 42<br />
Major access indicators<br />
Electricity (% of population with access to network) 24 88 99 89 92 43<br />
Water (% of population with access to improved sources) 58 78 91 89 88 84<br />
Sanitation (% of population with access to improved sanitation) 36 49 82 74 75 35<br />
Roads (% of rural population living within 2 km of an all-season road) 34 95 77 54 51 65<br />
Teledensity (fixed-line and mobile subscribers per 1,000 people) 62 357 438 416 237 61