Property Report A4 2

Create successful ePaper yourself
Turn your PDF publications into a flip-book with our unique Google optimized e-Paper software.
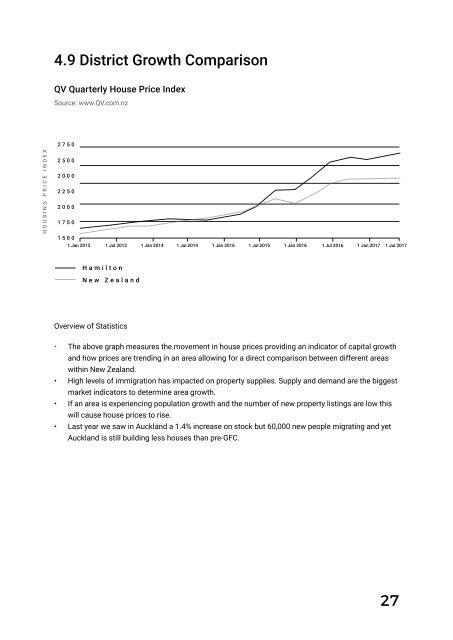
4.9 District Growth Comparison<br />
QV Quarterly House Price Index<br />
Source: www.QV.com.nz<br />
HOUSING PRICE INDEX<br />
2750<br />
2500<br />
2000<br />
2250<br />
2000<br />
1750<br />
1500<br />
1 Jan 2013 1 Jul 2013 1 Jan 2014 1 Jul 2014 1 Jan 2016 1 Jul 2015 1 Jan 2016 1 Jul 2016<br />
1 Jan 2017<br />
1 Jul 2017<br />
Hamilton<br />
New Zealand<br />
Overview of Statistics<br />
• The above graph measures the movement in house prices providing an indicator of capital growth<br />
and how prices are trending in an area allowing for a direct comparison between different areas<br />
within New Zealand.<br />
• High levels of immigration has impacted on property supplies. Supply and demand are the biggest<br />
market indicators to determine area growth.<br />
• If an area is experiencing population growth and the number of new property listings are low this<br />
will cause house prices to rise.<br />
• Last year we saw in Auckland a 1.4% increase on stock but 60,000 new people migrating and yet<br />
Auckland is still building less houses than pre-GFC.<br />
27