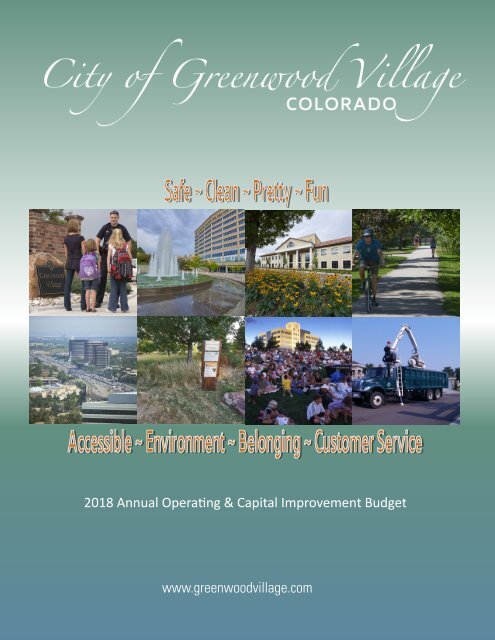
2018 Adopted Annual Operating & Capital Improvement Budget

You also want an ePaper? Increase the reach of your titles
YUMPU automatically turns print PDFs into web optimized ePapers that Google loves.
<strong>2018</strong> <strong>Annual</strong> <strong>Operating</strong> & <strong>Capital</strong> <strong>Improvement</strong> <strong>Budget</strong><br />
www.greenwoodvillage.com
TABLE OF CONTENTS<br />
Introduction<br />
Reader’s Guide to the <strong>Budget</strong> Document ..................................................................................................................... 1<br />
Distinguished <strong>Budget</strong> Presentation Award .................................................................................................................... 2<br />
Government Profile ....................................................................................................................................................... 3<br />
Community Profile ......................................................................................................................................................... 9<br />
Economic Indicators .................................................................................................................................................... 13<br />
<strong>Budget</strong> Summary<br />
<strong>Budget</strong> Process ........................................................................................................................................................... 15<br />
Revenue Assessment ................................................................................................................................................ 19<br />
Expenditure Assessment ............................................................................................................................................ 27<br />
Other Sources & Uses ................................................................................................................................................ 32<br />
Fund Balance Analysis ............................................................................................................................................... 33<br />
City-Wide Financial Summary .................................................................................................................................... 35<br />
City-Wide Revenue Detail .......................................................................................................................................... 36<br />
City-Wide Expenditure Detail ..................................................................................................................................... 38<br />
Fund/Department Appropriations ............................................................................................................................... 40<br />
General Fund<br />
General Fund Financial Summary .............................................................................................................................. 41<br />
General Fund Revenue Detail .................................................................................................................................... 43<br />
General Fund Expenditure Detail ............................................................................................................................... 45<br />
General Fund - Departments<br />
Mayor & Council .......................................................................................................................................................... 47<br />
City Management ........................................................................................................................................................ 49<br />
City Attorney ................................................................................................................................................................ 57<br />
Municipal Judge .......................................................................................................................................................... 61<br />
Administrative Services ............................................................................................................................................... 63<br />
Finance........................................................................................................................................................................ 79<br />
Community Development ............................................................................................................................................ 89<br />
Parks, Trails & Recreation......................................................................................................................................... 105<br />
Police......................................................................................................................................................................... 131<br />
Public Works ............................................................................................................................................................. 151<br />
Special Revenue Funds<br />
SGID #1 Fund Financial Summary............................................................................................................................ 175<br />
<strong>Capital</strong> Project Funds<br />
<strong>Capital</strong> Projects Fund Financial Summary ................................................................................................................ 177<br />
<strong>Capital</strong> Projects Fund Revenue Detail ..................................................................................................................... 179<br />
<strong>Capital</strong> Projects Fund Expenditure Detail ................................................................................................................. 180<br />
<strong>Capital</strong> <strong>Improvement</strong> Program<br />
<strong>Capital</strong> <strong>Improvement</strong> Program Overview .................................................................................................................. 181<br />
<strong>Capital</strong> <strong>Improvement</strong> Project Summary..................................................................................................................... 182<br />
Individual Project Details ........................................................................................................................................... 184<br />
i
TABLE OF CONTENTS<br />
Appendix<br />
Long-Range Financial Plans ..................................................................................................................................... 237<br />
Personnel Summary .................................................................................................................................................. 240<br />
Financial & <strong>Budget</strong> Policies ....................................................................................................................................... 243<br />
Glossary of Terms ..................................................................................................................................................... 246<br />
Ordinance No. 17-17 ................................................................................................................................................. 251<br />
Ordinance No. 18-17 ................................................................................................................................................. 253<br />
ii
READER’S GUIDE TO THE BUDGET DOCUMENT<br />
This budget document is prepared in a format that strives to reduce the level of difficulty for readers unfamiliar with public<br />
budgeting systems, yet still provides comprehensive information useful in communicating the overall financial direction<br />
and policy of the City of Greenwood Village, Colorado.<br />
Introduction - This section provides general information about the City, including:<br />
• Information regarding key officials<br />
• Overview of the operational structure of the City<br />
• Organizational purpose, goals and objectives<br />
• Priorities, challenges and opportunities<br />
• A brief history and profile of the community<br />
• Economic profile and indicators<br />
<strong>Budget</strong> Summary - This section includes:<br />
• An overview of the budget process, cycle and calendar<br />
• The fiscal structure of the organization<br />
• An assessment of City revenues and expenditures<br />
• Fund balance analysis<br />
• City-Wide financial summary with revenue and expenditure detail statements<br />
General Fund - This section includes summary and detailed financial statements pertaining to the General Fund, as well<br />
as, department-specific budget statements, descriptive narratives, goals, outcome measures and staffing levels.<br />
Special Revenue Fund - In February 2017, the City dissolved the Sewer General <strong>Improvement</strong> District and transferred<br />
all assets and operations to the Southgate Sanitation District. This section provides a summary financial statement of the<br />
Fund prior to the dissolution.<br />
<strong>Capital</strong> Projects Fund - This section provides information pertaining to the City’s <strong>Capital</strong> Projects Fund. This fund is<br />
used to account for the purchase and/or construction of major capital assets other than those financed by Enterprise or<br />
Internal Service Funds. Revenues are derived from various restricted and non-restricted sources including transfers from<br />
the General Fund.<br />
<strong>Capital</strong> <strong>Improvement</strong> Program - This section provides an explanation of each capital improvement project including<br />
program summaries, descriptions, estimated costs, and information regarding the impacts of the projects on future<br />
operations and maintenance.<br />
Appendix - The appendix includes various information, including:<br />
• Long-range financial planning<br />
• Personnel summaries<br />
• A summary of the City’s financial policies<br />
• Glossary of terms and acronyms<br />
• Ordinances adopting/appropriating the annual budget and establishing the property tax mill levy<br />
1
DISTINGUISHED BUDGET PRESENTATION AWARD<br />
The Government Finance Officers Association of the United States and Canada (GFOA) presented a Distinguished<br />
<strong>Budget</strong> Presentation Award to the City of Greenwood Village for its annual operating and capital improvement budget for<br />
the fiscal year beginning January 1, 2017. In order to receive this award, a governmental unit must publish a budget<br />
document that meets program criteria as a policy document, as an operations guide, as a financial plan and as a<br />
communications device.<br />
The award is valid for a period of one year. The City of Greenwood Village believes the current budget document continues<br />
to conform to the provisions set forth by the program and will be submitting it to GFOA to determine its eligibility for another<br />
award.<br />
2
GOVERNMENT PROFILE<br />
Form of Government<br />
The City of Greenwood Village is a home rule community consisting of a council-manager form of government with<br />
power vested in an elected Mayor and eight-member City Council. Elected by four separate districts on a non-partisan<br />
basis, Council Members serve two-year terms. The Mayor is elected at-large every four years. The Mayor does not vote<br />
on issues or items before City Council unless there is a tie vote. Policy-making and legislative authority remain the<br />
responsibility of the City Council. The City Council may take action through ordinances, resolutions and motions. The<br />
Mayor, with the consent of a majority of City Council, appoints the City Manager. City Council appoints the City Attorney<br />
and Municipal Judge, as well as the membership of various advisory boards and commissions. The City Council meets<br />
on the first and third Mondays of each month, at 6:00 p.m. at City Hall, 6060 South Quebec Street.<br />
City Council<br />
Mayor<br />
District I<br />
District I<br />
District II<br />
District II<br />
District III<br />
District III<br />
District IV, Mayor Pro Tem<br />
District IV<br />
Ron Rakowsky<br />
Freda Miklin<br />
Dave Bullock<br />
Leslie Schluter<br />
Darryl Jones<br />
Steve Moran<br />
George Lantz<br />
T.J. Gordon<br />
Tom Bishop<br />
Back Row (L to R): George Lantz, Steve Moran, Dave Bullock, T.J. Gordon, Darryl Jones<br />
Front Row (L to R): Leslie Schluter, Ron Rakowsky, Freda Miklin, Tom Bishop<br />
Administration<br />
City Manager<br />
City Attorney<br />
Municipal Judge<br />
Director of Administrative Services<br />
Director of Finance<br />
Director of Community Development<br />
Director of Parks, Trails & Recreation<br />
Chief of Police<br />
Director of Public Works<br />
Jim Sanderson<br />
Tonya Haas Davidson<br />
Elizabeth Shifrin<br />
Camie Chapman<br />
Shawn Cordsen<br />
Heather Vidlock<br />
Suzanne Moore<br />
John Jackson<br />
John Sheldon<br />
Boards & Commissions<br />
Planning Commission<br />
Board of Adjustments & Appeals<br />
Parks, Trails & Recreation Commission<br />
Arts & Humanities Council<br />
3
GOVERNMENT PROFILE<br />
Organizational Chart<br />
Residents of Greenwood Village<br />
Mayor & City Council<br />
Planning<br />
Commission<br />
Parks, Trails &<br />
Recreation<br />
Commission<br />
Board of<br />
Adjustments &<br />
Appeals<br />
Arts & Humanities<br />
Council<br />
Municipal Judge<br />
City Manager<br />
City Attorney<br />
City Manager's<br />
Office<br />
Community<br />
Outreach<br />
Director of<br />
Administrative<br />
Services<br />
Director of<br />
Finance<br />
Director of<br />
Community<br />
Development<br />
Director of Parks,<br />
Trails &<br />
Recreation<br />
Chief of Police<br />
Director of Public<br />
Works<br />
Administration<br />
Administration<br />
Administration<br />
Administration<br />
Administration<br />
Administration<br />
Information<br />
Management<br />
Services<br />
Municipal Court<br />
Services<br />
Human Resource<br />
Services<br />
Shared<br />
Technology<br />
Services<br />
Accounting &<br />
Financial<br />
Reporting<br />
Taxpayer<br />
Services<br />
Planning<br />
Building Safety<br />
Neighborhood<br />
Services<br />
Building Services<br />
Recreation<br />
Cultural Arts<br />
Parks, Trails &<br />
Open Space<br />
Developed Parks<br />
Streetscapes,<br />
Medians & Trails<br />
Open Space &<br />
Urban Forestry<br />
Support Services<br />
Patrol Services<br />
Detective<br />
Services<br />
Environmental<br />
Services<br />
Transportation<br />
Snow & Ice<br />
Control<br />
Roads<br />
Fleet<br />
Management<br />
Small Engine<br />
Equipment<br />
Parks & Trails<br />
Snow Removal<br />
4
GOVERNMENT PROFILE<br />
Municipal Facilities<br />
City Hall & Police Department<br />
6060 South Quebec Street<br />
Greenwood Village, Colorado 80111<br />
303.773.0252<br />
Maintenance Facility<br />
10001 East Costilla Avenue<br />
Greenwood Village, Colorado 80112<br />
303.708.6100<br />
Curtis Center for the Arts<br />
2349 East Orchard Road<br />
Greenwood Village, Colorado 80121<br />
303.797.1779<br />
5
GOVERNMENT PROFILE<br />
Organizational Purpose<br />
The organizational purpose of the City of Greenwood Village Government is to make a difference in the quality and<br />
character of the community. To meet this purpose, the organization employs an outcome based management<br />
philosophy whereby success is measured not by the amount of work accomplished, but instead by the benefits provided<br />
to the organization’s stakeholders as a result of its activities. As such, each program area has identified outcome<br />
measures and goals, which correlate to the program area’s purpose. Such purposes were developed in direct support<br />
of the organizational goals and objectives.<br />
The organizational focus provides direction and helps define the scope of services offered by the organization. The<br />
organizational focus of the City of Greenwood Village is that of sustaining a high quality of life for residents and providing<br />
high quality customer service. The following list provides the quality of life outcomes:<br />
<br />
<br />
<br />
<br />
<br />
<br />
<br />
<br />
Safe - A Safe & Secure Village<br />
Clean - A Clean Village<br />
Pretty - High Quality Appearance<br />
Fun - Leisure & Learning Opportunities<br />
Accessible - Organized & Easily Traveled<br />
Environment - High Quality Built & Natural<br />
Belonging - A Sense of Community<br />
Customer Service - Quality Customer Service<br />
6
GOVERNMENT PROFILE<br />
Executive Summary<br />
The primary purpose of the City’s budget and budgetary process is to develop, adopt and implement a fiscally sound<br />
and sustainable plan for accomplishing the established goals of the upcoming year while remaining consistent with the<br />
long-term vision of the community. The Proposed <strong>2018</strong> <strong>Annual</strong> <strong>Operating</strong> & <strong>Capital</strong> <strong>Improvement</strong> <strong>Budget</strong> focuses on 1)<br />
maintaining existing levels of service; 2) reinvestment in the capital infrastructure of the community; and 3) safeguarding<br />
the financial condition of the organization. The budget maintains the high-quality services that residents expect, and<br />
provides for reinvestment in the community’s infrastructure without the imposition of new taxes or use of debt.<br />
In <strong>2018</strong>, the City expects to generate revenues of approximately $48.8 million. The amount represents an increase in<br />
revenues of $162,645 or 0.3% when compared to the prior year’s amended budget. The slight increase is the combined<br />
result of existent negligible growth in sales, lodging and occupational privilege tax collections, as well as an anticipated<br />
decline in future development activity. Given the irregularity of development-related collections, the City remains<br />
conservative when forecasting revenues associated with building material use tax, building permits, and plan review<br />
fees. Omitting development-related revenue sources from the comparison, results in an anticipated, and relatively<br />
modest increase in revenue of $1.02 million or 2.3%.<br />
An ongoing challenge facing the City is its dependency on sales and use tax revenues. More than 60% of the City’s<br />
total revenue is attributable to sales and use tax collections, making the organization especially reliant upon, and<br />
vulnerable to, patterns in consumer and commercial spending. Furthermore, as a regional employment center, the City’s<br />
tax collections depend heavily on business spending, as well as that of the local workforce. In addition to local economic<br />
data, the City employs the use of several national consumer and development based economic indexes to interpret<br />
current and future trends, forecast revenues, and adopt financial strategies to maintain the financial condition and<br />
outlook of the organization. The underlying revenue assumptions in the <strong>2018</strong> budget are intended to be conservative<br />
but realistic given the materiality of sales and use tax revenue to the City and their inherent sensitivity to consumer and<br />
commercial spending. Furthermore, the figures and ongoing volatility reported in the consumer confidence, purchasing<br />
managers’, and retail sales indexes over the past twelve months, indicates a reasonably healthy, yet uncertain economy.<br />
The City of Greenwood Village is a mature community, surrounded by other jurisdictions with relatively limited area<br />
available for new development. It is because of this that development-related revenues are not only viewed as<br />
unsustainable, but are in fact expected to decline. As such, the City does not use development-related collections to<br />
support the ongoing operating costs of the organization, but instead, allocates such revenues for the purpose of<br />
supporting the capital improvement program.<br />
As previously stated, a primary focus of the <strong>2018</strong> budget is that of maintaining current service levels. Forecasted citywide<br />
expenditures of $54.4 million are 9.1% below that of the current year’s amended budget. Similar to revenues, the<br />
total expenditure figure is misleading without the benefit of additional discussion. As per the Municipal Charter,<br />
appropriations related to capital improvement projects do not expire or terminate at the close of the fiscal year. Thus,<br />
unspent appropriations from the prior year have been “carried over” to the 2017 amended budget. The process inflates<br />
the prior year capital outlay appropriations and consequently, makes it appear as though the City is reducing the capital<br />
improvement budget by $4.5 million. Additionally, one-time expenditures such as the dissolution of the Greenwood<br />
Village Sewer General <strong>Improvement</strong> District #1 in 2017, as well as the proposed offset of personnel expenditures via<br />
the use of retirement plan forfeitures also serves to distort the year-to-year comparison. Omitting the above items from<br />
the budget comparison provides a much more accurate assessment and results in an increase of $1.1 million or 3.0%.<br />
The <strong>2018</strong> budget continues the City’s commitment to maintaining high-quality services and attracting and retaining highquality<br />
employees. This includes funding for compensation and benefits competitive within the market. Costs associated<br />
with personnel represent 64.9% of the City’s operating budget or 44.2% of the total budget. The <strong>2018</strong> budget includes<br />
market adjustments to the City’s pay plan, an average 3.5% performance increase for general employees, and step<br />
increases for sworn personnel. Benefits, meanwhile, are continuing at 2017 rates with the exception of health insurance,<br />
for which the employer cost is increasing by 8.8% to remain competitive within the marketplace. Of notable interest is<br />
the deliberate use of previously accumulated retirement plan forfeitures in the amount of $783,265 to offset <strong>2018</strong><br />
employer contributions. Overall, costs associated with personnel are projected to increase 1.3% over that of the prior<br />
year’s amended budget.<br />
The City recognizes that in order to continue providing the high-quality services the community expects, it is imperative<br />
that the organization continue efforts to foster a healthy and attractive commercial environment. The <strong>2018</strong> budget<br />
7
GOVERNMENT PROFILE<br />
supports ongoing efforts to engage in cooperative civic partnerships so as to play an active role in the attraction,<br />
retention and expansion of the local business community. More specifically, the organization will continue to engage the<br />
local business community via the business retention and expansion program, maintain participation in site selection<br />
efforts with regional partners, and actively market the community to potential commercial enterprises via recently rebranded<br />
materials.<br />
Maintaining the public infrastructure and assets are a core responsibility of the City and essential to effective service<br />
delivery. Streets, sidewalks, parks, trails and open spaces of the highest quality are a significant part of what makes the<br />
community such an exceptional place to live and work. The <strong>2018</strong> budget supports the ongoing reinvestment in public<br />
infrastructure and includes $17.2 million in capital improvement projects or roughly 31.6% of the total expenditure<br />
appropriation.<br />
The <strong>2018</strong> budget includes $7.8 million for the second phase of the redesign and construction of the maintenance facility.<br />
Phase one of the project consisted of constructing a new fleet building, additional material storage and protective<br />
canopies for vehicles and equipment. The remodel and expansion of the existing space allowed for the relocation of<br />
various equipment and activities to the maintenance facility, allowing for the expansion of the crime lab and evidence<br />
storage located at the City Hall. Phase two of the project includes expanding the existing office space, completing the<br />
shop spaces, site grading, lighting and security, and providing an additional canopy for vehicle and equipment storage.<br />
Infrastructure demands are driven by residents, as well as the City’s considerable workforce population. Approximately<br />
2,700 businesses operate within the City, offering a wide variety of goods and services. The City is home to three major<br />
business parks, namely; the Village Center at Arapahoe Station, the Denver Technological Center, and Greenwood<br />
Plaza. The business parks attract a large workforce resulting in a weekday population of approximately 45,000<br />
individuals making the City one of the largest employment centers in the region. It should therefore come as no surprise<br />
that regional transportation is of great importance to the community. The City has initiated steps to update the<br />
community’s Transportation Plan in response to the anticipated future growth of the Denver South I-25 Corridor.<br />
Although most of the growth is projected to occur beyond the boundaries of the community, such growth will undoubtedly<br />
impact the City’s local transportation system. The <strong>2018</strong> budget continues to place a priority on transportation and<br />
includes $7.3 million for street and transportation infrastructure improvements including the extension of the eastbound<br />
left turn lanes at I-25 and Orchard Road, the enhancement of the traffic signals via connectivity with regional partners<br />
and replacement of vehicle detection systems, and the continuation of the sign replacement program to assure visibility,<br />
as well as a well-maintained community appearance.<br />
Greenwood Village’s parks, trails and open spaces are a substantial part of what makes the community such a special<br />
place to live and visit. Encompassing more than 280 acres of developed parks and 186 acres of open space, these<br />
areas are unique in landscape, including a mix of urban and rural lands that provide a wide range of recreational<br />
opportunities through a variety of facilities including equestrian parks, soccer, baseball and softball fields, basketball<br />
and tennis courts, a skate park, disc golf course, mountain bike course, and numerous playgrounds and pavilions. The<br />
<strong>2018</strong> budget includes planned improvements of $800,000 to the City’s parks and recreation infrastructure, including<br />
expansion of the existing skate park, the initial planning of improvements to the medians along Belleview Avenue, and<br />
the addition of restroom facilities located at both the Orchard Trailhead of the High Line Canal and Castlewood Park.<br />
Following sound financial management, the City confines the use of fund balance to items which are commonly regarded<br />
as one-time or limited in duration. By maintaining appropriate fund balances in each of its funds, the City is able to adapt<br />
to changing market conditions, take advantage of unforeseen opportunities, and maintain adequate cash balances given<br />
the cyclical nature of the local economy. The budget results in a decrease to fund balance of 14.7% or $5.5 million. The<br />
use of fund balance is attributable to the $7.8 million associated with the redesign and construction of the maintenance<br />
facility for which resources had been previously accumulated, allowing for the cash-funding of the project. The <strong>2018</strong><br />
budget provides for all externally enforceable restrictions, as well as a 25% <strong>Operating</strong> Reserve Assignment and an<br />
Open Space Acquisition Assignment. The 25% <strong>Operating</strong> Reserve Assignment is determined via a calculation of 25%<br />
of the General Fund operating expenditures and serves to shore up reserves and assist in meeting the cash flow needs<br />
of the organization. On the other hand, the Open Space Acquisition assignment operates much like a savings account<br />
in an effort to accumulate reserves for future expenditures. Additionally, the <strong>2018</strong> budget includes an assignment for<br />
the rebate of development fees anticipated to be collected during the fiscal period. The assignment maintains those<br />
resources which are expected to be rebated upon completion of the development.<br />
8
COMMUNITY PROFILE<br />
History<br />
The area surrounding the City of Greenwood Village has a rich heritage that includes early settlers, prospecting, farming,<br />
and ranching. Although the first pioneers began to arrive in the region in the early 1800s, it was not until fifty years later<br />
that the discovery of gold brought about profound changes to the<br />
area and gave rise to several small communities.<br />
During the early 1900s, the area continued to thrive as prospecting<br />
gave way to agriculture. Orchards of cherry, apple, apricot, plum, and<br />
pear trees flourished in the area until 1933 when the Castlewood<br />
Dam burst, effectively drying up the source of irrigation. While dairy<br />
farming and ranching remained widespread, by the 1940s the region<br />
had attracted a number of suburbanites along with seasonal<br />
residents from Denver looking to escape to the rural countryside. As<br />
the area’s popularity increased,<br />
so did concerns that ongoing<br />
development from Denver would<br />
threaten the pastoral lifestyle<br />
enjoyed by local residents. In response, the City of Greenwood Village officially<br />
incorporated as a statutory city on September 8, 1950.<br />
Location<br />
The City of Greenwood Village is a mature community,<br />
surrounded by other jurisdictions and situated in<br />
Arapahoe County 9 miles south of downtown Denver,<br />
Colorado. The City occupies 8.4 square miles and per<br />
the US Census Bureau, is home to an estimated<br />
16,043 residents.<br />
Climate<br />
At 5,422 feet above sea level, the area is considered<br />
semi-arid with very low humidity and relatively little<br />
precipitation. The area is well-known for its abundant<br />
sunshine, averaging over 275 sunny days per year.<br />
During the summer, it is not uncommon to have<br />
temperatures in excess of 90°; however, days for which<br />
temperatures reach 100° are unusual. Thunderstorms<br />
are common during the growing season between April<br />
and September and supply approximately 75% of the<br />
annual precipitation to the area. Winters are normally<br />
mild; however, snowstorms measured in feet, do occur<br />
on occasion.<br />
Whereas farming and ranching characterized the area during the first half of the<br />
century, by the late-1960s the community had transformed into a predominately<br />
residential area. However, the absence of a revenue-generating commercial tax<br />
base made it difficult to provide the most basic of municipal services. Therefore,<br />
Greenwood Village embarked on what would become a twenty-year period of<br />
annexation and growth, resulting in the incorporation of several emerging, yet<br />
lucrative, business parks and commercial areas, including the Denver Technological<br />
Center and Greenwood Plaza business parks. As the population of the City<br />
increased, so did the desire for enhanced local control, resulting in the adoption of<br />
a city charter on July 30, 1968, transforming the community into a self-governing,<br />
Colorado Home Rule Municipality.<br />
9
COMMUNITY PROFILE<br />
Transportation<br />
As a major employment center, regional transportation is of great importance to the community. I-25 bisects the City in<br />
a north-south direction, and serves as the area’s primary arterial along the foothills. Additionally, I-225 just to the north,<br />
as well as the 470 beltway located three miles south of the City provide convenient access to both the east and west<br />
portions of the metropolitan area. The Regional Transportation District (RTD) provides rapid transit services to the area,<br />
including three park-n-ride/light rail stations located within the City of<br />
Greenwood Village. For more information regarding routes,<br />
schedules or fares please visit www.rtd-denver.com.<br />
The commercial centers within the City of Greenwood Village attract<br />
numerous business travelers from all over the world. Located less<br />
than one hour northeast of Greenwood Village via E-470, Denver<br />
International Airport (DIA) is the 18th-busiest airport in the world and<br />
the 6th-busiest airport in the United States serving more than 58<br />
million passengers each year. Additionally, Centennial Airport,<br />
which was developed in the 1960s specifically to serve the Denver<br />
Technological Center, is located just south of the City, and has<br />
become the second busiest general aviation facility in the country,<br />
catering to smaller, private, non-commercial aircraft and charter flights. For more information regarding flights or services<br />
please visit www.flydenver.com or www.centennialairport.com.<br />
Parks & Recreation<br />
Greenwood Village’s parks, trails and open spaces are a significant part of what makes the community such a special<br />
place to live and visit. Encompassing more than 280 acres of developed parks and 186 acres of open space, these<br />
areas are unique in landscape, including a mix of urban and rural lands that provide a wide range of recreational<br />
opportunities via a variety of facilities including equestrian parks,<br />
soccer, baseball and softball fields, basketball and tennis courts, a<br />
skate park, disc golf course, mountain bike course, and numerous<br />
playgrounds and pavilions. Additionally, there are approximately 47<br />
miles of trails which wind through the community suitable for walking,<br />
running, bicycling and horseback riding. These trails also connect and<br />
provide access to local parks, schools, neighborhoods, as well as<br />
several regional trail systems.<br />
Education<br />
The City of Greenwood Village is served by two school districts, both<br />
of which consistently score well above state and national averages in<br />
student achievement. The Cherry Creek School District (CCSD) is the fourth largest school district in the state, serving<br />
54,700 students. Additionally, the Littleton Public School District (LPSD) which has been ranked as the highest<br />
academically achieving school district in the metropolitan area, serves more than 15,200 students district-wide. For<br />
additional information please visit www.cherrycreekschools.org or www.littletonpublicschools.net.<br />
Housing<br />
Greenwood Village’s residential communities include a variety of residential options ranging from urban lofts and<br />
condominiums to single-family homes and multi-acre estates. The convenient location of the community’s<br />
neighborhoods to business parks, restaurants, entertainment and shopping, combined with the preservation of rural<br />
elements has created a desirable living environment. There are an estimated 6,491 housing units within the City of<br />
Greenwood Village with much of those (58.4%) being detached single-family homes. The percentage of owner-occupied<br />
and renter-occupied housing units is 67.2% and 32.8%, respectively. The City’s median home value is one of the highest<br />
in the region at $805,600, while monthly rents average over $1,418. According to the Federal Housing Finance Agency<br />
(FHFA), as of March 31, 2017, Colorado ranked second in home price appreciation, suggesting housing market<br />
performance far exceeding that of the national average.<br />
10
COMMUNITY PROFILE<br />
Income & Employment<br />
The community boasts a highly-educated workforce with 74.4% of individuals over the age of 25 having obtained a<br />
bachelor’s degree or higher. Income levels exceed those of most other jurisdictions in the metropolitan area, reporting<br />
a median household income and per capita income of $117,500 and $81,934 respectively. Approximately 3.0% of the<br />
population reported incomes below that of the poverty level. The following chart provides additional information<br />
regarding local resident employment by industry:<br />
Local Employment by Industry<br />
Other<br />
20%<br />
Education & Health Care<br />
17%<br />
Professional Services &<br />
Management<br />
18%<br />
Construction &<br />
Manufacturing<br />
8%<br />
Retail & Wholesale Trade<br />
13%<br />
Information Services<br />
7%<br />
Finance & Real Estate<br />
17%<br />
According to the U.S. Department of Labor, as of July 2017, the unemployment rate in Colorado decreased 1.3% from<br />
the prior year to 2.4%, and remaining below the national average of 4.3%. Similarly, the Denver Metropolitan Area<br />
unemployment rate decreased 1.5% compared to the prior year to 2.5%. Job growth in the State grew by 2.6% as<br />
compared to the national average of 2.4%. However, average<br />
weekly wages in the metropolitan area increased 2.0% during the<br />
previous twelve-month period while the national average<br />
increased 2.8%. Employment opportunities continue to<br />
predominantly reside within retail, accommodation, food services,<br />
as well as occupations in business management and technology.<br />
Major Employers<br />
Approximately 2,700 businesses operate within the City, offering<br />
a wide variety of goods and services. The City is home to three<br />
major business parks, namely; the Village Center at Arapahoe<br />
Station, the Denver Technological Center, and Greenwood<br />
Plaza. The business parks attract a large workforce resulting in a<br />
weekday population of approximately 45,000 individuals making the City one of the largest employment centers in the<br />
region. The considerable commercial presence serves to substantially augment the local economy, and in turn, the<br />
financial resources of the organization. Major employers located within the City of Greenwood Village include:<br />
Commercial/Office Retail/Restaurant Government/Recreation<br />
Fascore, LLC<br />
King Soopers Cherry Creek School District<br />
Comcast<br />
Red Robin<br />
City of Greenwood Village<br />
Great West Life & Annuity Starbucks<br />
Colorado State University<br />
Cigna Health & Life<br />
Pappadeux<br />
Tri-County Health<br />
Charter Communications Home Depot<br />
South Metro Fire Rescue<br />
Fidelity Brokerage Services Kuni Lexus<br />
Greenwood Athletic Club<br />
11
COMMUNITY PROFILE<br />
Economic Development<br />
Access to a highly educated and skilled workforce, favorable business climate, suitable infrastructure and past economic<br />
performance remain key components which attract new businesses to the City. Notable businesses openings within the<br />
past twelve months include:<br />
<br />
<br />
In August 2016, Flagship Food Group relocated their corporate headquarters from Los Angeles to Greenwood<br />
Village. Flagship manufactures and sells products under the 505 Southwestern®, Lilly B’s®, TJ Farms® and<br />
Steak-N-Shake® brands. It also supplies specialized food products for private label customers as well as for<br />
leading global restaurant chains. In addition, Flagship provides comprehensive logistics solutions for leading<br />
food companies.<br />
Recreational Equipment, Inc. (REI) is in the process of completing tenant improvements and will be opening a<br />
45,000-square foot storefront located at 9000 East Peakview Avenue just east of I-25 and north of Arapahoe<br />
Road. REI is a premier outdoor gear and sporting goods store. They provide outdoor enthusiasts with top-brand<br />
gear & clothing for c<strong>amp</strong>ing, climbing, cycling, fitness, hiking, paddling, skiing, snowboarding and more.<br />
Greenwood Village continues to see significant economic growth and while limited, opportunities for infill development<br />
within the City still exist. Vacant land along the I-25 corridor offers several desirable development prospects. In fact,<br />
there are a number of large-scale projects currently in various<br />
stages ranging from concept to construction.<br />
The Charter Communications building, currently under<br />
construction, is the third, and final building of the 900,000 square<br />
foot Arapahoe at Village Center Station development located at<br />
I-25 and Arapahoe Road. The 11-story building will include<br />
283,103 square feet of office space, an additional 9,416 square<br />
feet suited for retail, and a 6-level parking garage concealed on<br />
the west side by a 2-story retail/office wrapper building. The<br />
Village Center Station plaza creates additional outdoor meeting<br />
spaces with multiple seating areas while also providing a<br />
convenient connection to the onsite light rail station.<br />
Construction is also nearly complete on the new Village Center<br />
DTC office building on the east side of I-25. Village Center DTC<br />
will add to the City’s inventory of high quality commercial<br />
buildings. Village Center DTC will include a 280,000-square foot office property on 5.24 acres, consisting of a 10-story,<br />
speculative office building with a separate six-story, 986 parking space structure. Village Center DTC will be located<br />
within walking distance of the Arapahoe Light-Rail Station and<br />
directly adjacent to the proposed Westin Hotel, as discussed<br />
below. The project includes two outdoor plazas and a series<br />
of off-site transportation improvements, including the extension<br />
of Willow Drive and Caley Avenue.<br />
The Westin Hotel will be the first five-star hotel in the south<br />
metropolitan area and is expected to begin construction in<br />
<strong>2018</strong>. The new hotel franchise will be located on the east side<br />
of I-25, adjacent to the Arapahoe Light-Rail parking garage,<br />
where the current surface parking lot is now located. The<br />
proposed hotel will include approximately 170 hotel rooms a<br />
restaurant, bar, coffee shop and meeting spaces. The hotel will be located steps from the pedestrian bridge and parking<br />
structure serving the RTD Arapahoe at Village Center light-rail station and the Village Center retail and office buildings.<br />
The hotel will be highly visible and convenient to I-25, making it easily accessible for motorists and light rail users alike.<br />
12
ECONOMIC INDICATORS<br />
Overview<br />
Historically, more than 60% of the City’s total revenue has been directly attributable to sales and use tax collections,<br />
making it especially reliant upon, and vulnerable to, patterns in both consumer and commercial spending and<br />
development. In addition to local economic data, the City employs the use of several national consumer and<br />
development based economic indexes to interpret current and future trends, forecast revenues, and adopt financial<br />
strategies in an effort to maintain the financial condition and outlook of the organization. Those indexes most often used<br />
by the City are presented below:<br />
Consumer Price Index (CPI)<br />
The Consumer Price Index (CPI) is a measure of the average change in prices over time in a fixed market basket of<br />
goods and services (i.e. inflation). The Consumer Price Index for the Denver-Boulder-Greeley area increased 2.6% in<br />
2016 and increased 3.1% from the first half of 2016 to the first half of 2017. Higher costs for shelter (7%) are largely<br />
responsible for the overall increase. Costs for energy fell 4.6%, food prices rose 0.2%, while all others advanced 3.5%.<br />
The rate of inflation of the CPI for the Denver-Boulder-Greeley area is presented in the chart below:<br />
Consumer Price Index<br />
4.50%<br />
4.00%<br />
3.50%<br />
3.00%<br />
2.50%<br />
2.00%<br />
1.50%<br />
1.00%<br />
0.50%<br />
0.00%<br />
-0.50%<br />
-1.00%<br />
2007 2008 2009 2010 2011 2012 2013 2014 2015 2016 2017<br />
Purchasing Manager’s Index (PMI)<br />
The Purchasing Managers Index (PMI) was established in 1948 to measure the degree of optimism that businesses<br />
(owners/executives) have with regard to the economy. As of June 2017, the PMI reported an index measure of 57.8.<br />
This reading represents the strongest rate of expansion since August 2014. An index level above 50.0 indicates that the<br />
number of business owners/executives who expect their company’s performance to increase over the next twelve<br />
months outnumber those anticipating weaker performance. The following chart illustrates a gradual increase in the PMI<br />
over the past twelve-month period, indicating continued improvement in business owner optimism.<br />
Purchasing Manager's Index<br />
60.0<br />
58.0<br />
56.0<br />
54.0<br />
52.0<br />
50.0<br />
48.0<br />
46.0<br />
44.0<br />
Jul<br />
2016<br />
Aug Sep Oct Nov Dec Jan<br />
2017<br />
Feb Mar Apr May Jun<br />
13
ECONOMIC INDICATORS<br />
Consumer Confidence Index (CCI)<br />
The Consumer Confidence Index (CCI) was established in 1967 to measure the degree of optimism that consumers<br />
have with regard to the economy. Each monthly survey contains approximately 50 core questions, each of which tracks<br />
a different aspect of consumer attitudes and expectations. Consumer confidence in the United States averaged 86.10<br />
from 1952 until 2017, while a reading of 90.0 is associated with a healthy economic outlook. As of July, the CCI reported<br />
an index measure of 93.1, below market estimates of 95, although the same measure as reported in July 2016. The<br />
chart below illustrates consumer sentiment has improved during the past twelve months but more recently demonstrates<br />
a fall in future expectations.<br />
United States Consumer Sentiment<br />
100.0<br />
98.0<br />
96.0<br />
94.0<br />
92.0<br />
90.0<br />
88.0<br />
86.0<br />
84.0<br />
82.0<br />
80.0<br />
Aug<br />
2016<br />
Sep Oct Nov Dec Jan<br />
2017<br />
Feb Mar Apr May Jun Jul<br />
Retail Sales Year-Over-Year<br />
The year-over-year change in retail sales compares the aggregated sales of retail goods and services during a certain<br />
month to the same month a year ago. Retail sales in the United States averaged 4.37% from 1993 until 2017, reaching<br />
an all-time high of 11.2% in March of 1994 and a record low of -11.5% in March of 2009. Retail sales increased 2.8% in<br />
June of 2017 over the same month in the previous year. As evident in the following chart, increases in retail sales were<br />
steady from July 2016 to January 2017 but have since been declining.<br />
United States Retail Sales Year-Over-Year<br />
6.0<br />
5.0<br />
4.0<br />
3.0<br />
2.0<br />
1.0<br />
-<br />
Jul<br />
2016<br />
Aug Sep Oct Nov Dec Jan<br />
2017<br />
Feb Mar Apr May Jun<br />
14
BUDGET PROCESS<br />
Overview<br />
The City of Greenwood Village’s fiscal year begins on January 1 st and ends on December 31 st of each year. Although<br />
the City legally appropriates its budget on an annual basis, the process includes discussions regarding multi-year<br />
financial planning such as the City’s Comprehensive Plan, Transportation Plan, Master Regional Drainage Plan,<br />
individual Park Development Master Plans, and <strong>Capital</strong> <strong>Improvement</strong> Plan. Such plans assess the City of Greenwood<br />
Village’s short and long-term infrastructure needs and strategic priorities. Where appropriate, the recommendations and<br />
initiatives provided in these plans have been incorporated into the planning and development of the annual budget.<br />
<strong>Capital</strong> project expenditures for the upcoming year are directly associated with the City’s <strong>Capital</strong> <strong>Improvement</strong> Plan.<br />
Departments prepare budgets via a line-item method, providing detailed documentation for revenues and expenditures.<br />
Service levels, as approved by City Council, assist departments in determining expenditure requests. In order to present<br />
a balanced budget, the City Manager works closely with departments to coordinate funding levels. In accordance with<br />
the Home Rule Charter, the City Manager must present a balanced budget, for which proposed expenditures do not<br />
exceed available resources, no later than October 15 th ; followed by a public hearing which must be held on or before<br />
November 1 st . At any point after the public hearing, City Council may adopt the budget with or without amendment. If<br />
City Council fails to adopt the budget prior to December 31 st , the amounts appropriated for the previous fiscal year shall<br />
be deemed adopted for the ensuing fiscal year on a month-to-month basis. The City encourages citizen participation by<br />
publishing notices of the hearing in the local newspaper and online. Copies of the budget document are made available<br />
for citizen review.<br />
<strong>Budget</strong> Cycle<br />
Establishment of<br />
Goals/Objectives<br />
Distribution of the<br />
<strong>Adopted</strong> <strong>Budget</strong><br />
Process<br />
Refinement &<br />
Training<br />
City Council<br />
Adoption of the<br />
<strong>Annual</strong> <strong>Budget</strong><br />
Development of<br />
Revenue<br />
Forecasts<br />
Public Hearing<br />
(Citizen Input)<br />
Departmental<br />
Expenditure<br />
Requests<br />
City Council<br />
<strong>Budget</strong> Workshop<br />
Executive Review<br />
& Refinement<br />
Distribution of the<br />
Proposed <strong>Budget</strong><br />
15
BUDGET PROCESS<br />
<strong>Budget</strong> Calendar<br />
January 29, 2017<br />
May 16<br />
May 23<br />
May 25<br />
Jun 5<br />
June 8-9<br />
June 12<br />
June 12<br />
July 7<br />
July 14<br />
July 17<br />
July 21<br />
July 24<br />
July 31- August 4<br />
August 7<br />
August 11<br />
August 18<br />
August 21<br />
August 21<br />
August 25<br />
August 25<br />
August 30<br />
September 1<br />
September 6<br />
October 2<br />
October 16<br />
December 10<br />
December 15<br />
December 18-29<br />
File the <strong>Adopted</strong> <strong>Budget</strong> with the Colorado Division of Local Governments<br />
Due by January 29 th (C.R.S. 29-1-113(1))<br />
Discussion of the <strong>Capital</strong> <strong>Improvement</strong> Program with the Planning & Zoning Commission<br />
Discussion of the <strong>Capital</strong> <strong>Improvement</strong> Program with the Parks, Trails & Recreation<br />
Commission<br />
Discussion of the <strong>Capital</strong> <strong>Improvement</strong> Program with the Board of Adjustments & Appeals<br />
Public Hearing – <strong>Capital</strong> <strong>Improvement</strong> Program<br />
<strong>Budget</strong> System User & Process Training<br />
Distribution of <strong>Budget</strong> Process Instructions, Forms & Worksheets<br />
<strong>Budget</strong> Submission Period Opened – System User Access Granted<br />
Inter-Departmental Service Requests Due to Appropriate Department(s)<br />
Establishment of Preliminary Revenue<br />
Presentation of the Draft <strong>Capital</strong> <strong>Improvement</strong> Program to the City Council<br />
<strong>Budget</strong> Submission Period Closed – System User Access Terminated<br />
Distribution of Preliminary <strong>Budget</strong> Reports to the Executive Management Team<br />
Executive Review & Discussion of Preliminary <strong>Budget</strong> Reports<br />
<strong>Budget</strong> Revision Period Opened – System User Access Granted<br />
<strong>Budget</strong> Revision Period Closed – System User Access Terminated<br />
Departmental <strong>Budget</strong> Narratives & Performance Measures Due to Finance Department<br />
Presentation of the Proposed Employee Compensation & Benefits to the City Council<br />
City Council Discussion of the Proposed <strong>Capital</strong> <strong>Improvement</strong> Program<br />
Submission of the Proposed <strong>Budget</strong> Document to the Mayor & Executive Management<br />
Team<br />
Receive Preliminary Assessed Valuation from the County Assessor<br />
Due by August 25 th (C.R.S. 39-5-121(2)(b))<br />
Mayoral Review & Discussion of the Proposed <strong>Budget</strong><br />
Submission of the Proposed <strong>Budget</strong> to the City Council<br />
Due by October 15 th (H.R.C. 11.02)<br />
City Council <strong>Budget</strong> Workshop<br />
Public Hearing & First Reading – Adoption of the Proposed <strong>Budget</strong> & Mill Levy<br />
Due by November 1 st (H.R.C. 11.06)<br />
Second Reading – Adoption of the Proposed <strong>Budget</strong> & Mill Levy<br />
Due by December 12 th (H.R.C. 11.07 & 11.08)<br />
Receive Final Assessed Valuation from the County Assessor<br />
Due by December 10 th (C.R.S. 39-1-111(5))<br />
Submit Certification of the <strong>Annual</strong> Mill Levy to the County Assessor<br />
Due by December 15 th (C.R.S. 39-5-128(1))<br />
Printing & Publication of the <strong>Annual</strong> <strong>Operating</strong> & <strong>Capital</strong> <strong>Improvement</strong> <strong>Budget</strong><br />
16
BUDGET PROCESS<br />
<strong>Budget</strong>ary Control<br />
All budgeted expenditures of the organization are subject to appropriation by the governing board. Expenditure<br />
appropriations are made on an annual basis, and with the exception of those pertaining to capital expenditures, lapse<br />
at the close of the fiscal year. Appropriations for capital expenditures continue in force until expended, revised,<br />
abandoned or repealed. Adoption of the budget by City Council establishes appropriations at both the fund and<br />
department level. Once appropriated, it becomes the responsibility of the Finance Department to monitor and report on<br />
the financial activity and condition of the organization. The City incorporates the use of financial software, policies, and<br />
procedures to provide an adequate level of control over public resources. Each department is responsible for controlling<br />
expenditures within authorized appropriations; however, ultimate budgetary responsibility is retained by City Council.<br />
As allowed by the City’s Charter, requests for supplemental, emergency or reduction appropriations to the budget shall<br />
be issued in a public notice and subject to the approval of City Council through enactment of an ordinance.<br />
Basis of Accounting vs. Basis of <strong>Budget</strong>ing<br />
Basis of Accounting refers to the specific time at which revenues and expenditures are recognized in the accounts and<br />
reported in the financial statements. The basis of accounting used often depends on the purpose for which the fund has<br />
been established. Proprietary funds utilize the accrual basis of accounting while all other funds utilize the modified<br />
accrual basis. Under the accrual basis of accounting, revenues are recognized when earned, and expenses are<br />
recognized when a liability is incurred, regardless of the timing of related cash flows. However, under the modified<br />
accrual basis of accounting, revenues are recognized when they become both measurable and available. Revenues<br />
are considered to be available when they are collected within the current year or soon enough thereafter to pay liabilities<br />
of the current year. Expenditures are generally recorded when a liability is incurred. However, debt service expenditures<br />
and compensated absences are recorded only when payment is due.<br />
Basis of <strong>Budget</strong>ing refers to the methodology used to include revenues and expenditures in the budget. The City’s basis<br />
of budgeting mirrors the basis of accounting used in the preparation of its fund financial statements, which is the modified<br />
accrual basis of accounting. Thus, capital costs and debt and lease payments are recorded as expenditures in the year<br />
in which they occur. Furthermore, depreciation and amortization costs are not budgeted since these costs represent<br />
non-cash transactions.<br />
Fund Structure<br />
The activities of the organization are organized into separate funds to account for the activity of specific operations,<br />
programs, and/or functions. Each fund is considered a separate accounting entity and, therefore, maintains an<br />
independent, self-balancing ledger subject to appropriation. The three basic fund categories are Governmental,<br />
Proprietary and Fiduciary; within each fund category there are additional fund types. A description of the fund<br />
categories, types, and those funds employed by the City are included below:<br />
Governmental Funds<br />
The General Fund is the City’s primary operating fund used to account for resources associated with general<br />
government operations, which are not required legally or by sound financial management to be accounted for in another<br />
fund. Activities in the General Fund include general administration, community development, police, parks, and public<br />
works.<br />
Special Revenue Funds account for the proceeds of specific revenue sources that are legally restricted to support<br />
specified purposes. The Sewer General <strong>Improvement</strong> District #1 Fund accumulated money to support service costs and<br />
repairs related to the District’s connection with the South Englewood Sanitation District. Revenues were provided via<br />
property tax assessments levied upon property within the improvement district. In February 2017, the City dissolved the<br />
Sewer General <strong>Improvement</strong> District and transferred all assets and operations to Southgate Sanitation District.<br />
<strong>Capital</strong> Project Funds account for financial resources used for the acquisition, improvement or construction of major<br />
capital assets other than those financed via proprietary funds. The <strong>Capital</strong> Projects Fund records various restricted and<br />
non-restricted sources in support of the City’s capital improvement program as presented later in this document.<br />
17
BUDGET PROCESS<br />
Debt Service Funds account for the accumulation of resources for, and the payment of general long-term debt principal,<br />
interest, and related costs. The City of Greenwood Village is debt-free, thus, does not report a Debt Service Fund.<br />
Proprietary Funds<br />
Enterprise Funds account for operations similar to private business enterprises, where the intent of the governing body<br />
is that the costs of providing these services on a continuing basis be financed or recovered primarily through user<br />
charges. The City of Greenwood Village does not report an Enterprise Fund.<br />
Internal Service Funds account for goods and/or services provided by one department to other departments within the<br />
City or to other government units on a cost reimbursement basis. The City of Greenwood Village currently does not<br />
report an Internal Service Fund.<br />
Fiduciary Funds<br />
Trust & Agency Funds account for resources for which the City is holding as a trustee or an agent for another<br />
organizational unit and as such, does not have spending authority. The City does not currently report a Fiduciary Fund.<br />
18
REVENUE ASSESSMENT<br />
Overview<br />
To simplify financial reporting, the City of Greenwood Village has organized its revenues into seven categories: Taxes<br />
& Special Assessments, Intergovernmental, Licenses & Permits, Charges & Fees, Fines & Forfeitures, Investment<br />
Earnings, and Miscellaneous Revenue. The following table and chart illustrate the City’s total revenue for all funds, not<br />
including other sources or uses:<br />
2016<br />
Audited<br />
Actuals<br />
2017<br />
Amended<br />
<strong>Budget</strong><br />
<strong>2018</strong><br />
<strong>Adopted</strong><br />
<strong>Budget</strong><br />
% Change<br />
Revenue:<br />
Taxes & Assessments $ 38,889,425 $ 39,679,000 $ 39,621,521 -0.14%<br />
Intergovernmental 4,635,492 2,791,359 3,055,028 9.45%<br />
Licenses & Permits 1,629,321 1,755,000 1,701,000 -3.08%<br />
Charges & Fees 2,800,927 3,039,000 2,898,955 -4.61%<br />
Fines & Forfeitures 971,245 1,087,000 1,020,000 -6.16%<br />
Investment Earnings 166,457 291,000 500,000 71.82%<br />
Miscellaneous Revenue 112,925 8,000 16,500 106.25%<br />
Total Revenue $ 49,205,792 $ 48,650,359 $ 48,813,004 0.33%<br />
Total Revenue by Category<br />
Intergovernmental<br />
6%<br />
Taxes &<br />
Assessments<br />
81%<br />
Licenses & Permits<br />
4%<br />
Charges & Fees<br />
6%<br />
Fines & Forfeitures<br />
2%<br />
Miscellaneous<br />
Revenue<br />
0%<br />
Investment Earnings<br />
1%<br />
As illustrated in the above table, in <strong>2018</strong>, the City expects to generate revenues of approximately $48.8 million. The<br />
amount represents an increase in revenues of $162,645 or 0.3% when compared to the prior year’s amended budget.<br />
The slight increase is the combined result of recent negligible growth in sales, lodging and occupational privilege tax<br />
collections, as well as an anticipated decline in future development activity. Given the irregularity of development-related<br />
collections, the City remains conservative when forecasting revenues associated with building material use tax, building<br />
permits, and plan review fees. Omitting development-related revenue sources from the comparison, results in an<br />
anticipated, and relatively modest increase in revenue of $1.02 million or 2.3%.<br />
Additional detail pertaining to the trends and forecasting methods of the City’s significant funding sources, including the<br />
related impacts of the current and anticipated economic environment are presented in the following sections.<br />
19
REVENUE ASSESSMENT<br />
Taxes & Special Assessments<br />
Taxes and special assessments represent the largest revenue category for the City, accounting for 81.2% of <strong>2018</strong><br />
forecasted revenue. The category consists of property, specific ownership, sales, use, lodging, and occupational<br />
privilege taxes. Due to the material nature of these sources, each is discussed in more detail below.<br />
Property Tax<br />
Property taxes are generated via a mill levy on the assessed real and personal property located within the City. The<br />
city-wide mill levy consists of 2.932 mills used to support the general operating activities of the City. In <strong>2018</strong>, property<br />
tax collections are expected to total $3.4 million, making up approximately 7.0% of the City’s total revenue. The amount<br />
represents an increase of 14.6% as compared to the prior year’s amended budget due to continued improvement in<br />
local residential and commercial property values.<br />
The County Assessor is responsible for identifying, classifying, and valuing all property in the County. The Assessor’s<br />
goal is to establish accurate values of all property located within the County, which in turn ensures that the tax burden<br />
is distributed fairly and equitably among all property owners. Real property is revalued every odd-numbered year, while<br />
personal property is revalued every year. The table below shows the current and historical assessed valuation of all real<br />
and personal property located within the City.<br />
Year<br />
Assessed<br />
Valuation<br />
%<br />
Change<br />
2014 871,634,290 8.73%<br />
2015 859,904,776 -1.35%<br />
2016 982,360,897 14.24%<br />
2017 993,812,028 1.17%<br />
<strong>2018</strong>* 1,160,578,734 16.78%<br />
* Represents preliminary assessed valuation<br />
While property tax has historically remained one of the City’s more stable revenue sources, it is also one of the most<br />
regulated under State Statute. In accordance with the Gallagher Amendment enacted in 1982, the statewide total<br />
assessed valuation of residential versus commercial properties is calculated at 45% and 55% respectively. To<br />
accomplish this, the assessment rate for commercial properties is fixed at 29% of market value, while residential rates<br />
are adjusted during years of reappraisal to maintain the ratio. Prior to the Gallagher Amendment, the residential<br />
assessment rate was 30%. From 2003 through 2017 the rate remained stable at 7.96%; however, for <strong>2018</strong> the rate will<br />
decrease to 7.20%. The following table shows the City’s collection of property taxes for both residential and commercial<br />
property with an appraised value of $500,000:<br />
Residential<br />
Commercial<br />
Property Value $500,000 $500,000<br />
Assessment Rate 7.2% 29.00%<br />
Assessed Value $36,000 $145,000<br />
Greenwood Village Mill Levy 2.932 2.932<br />
<strong>Annual</strong> Property Tax Obligation $105.55 $425.14<br />
Sales Tax<br />
The City of Greenwood Village levies a 3.0% sales tax upon all sales, purchases, and leases of tangible personal<br />
property and taxable services. Sales tax is not imposed on the purchase of food for home consumption. Sales tax<br />
collections are forecasted to comprise $25.4 million or 51.9% of the total annual revenue, making the City especially<br />
reliant upon, and vulnerable to patterns in consumer and commercial spending. The following table shows the combined<br />
local sales tax rates by jurisdiction:<br />
20
REVENUE ASSESSMENT<br />
Taxing Authority<br />
Tax Rate<br />
City of Greenwood Village 3.00%<br />
State of Colorado 2.90%<br />
Arapahoe County Open Spaces 0.25%<br />
Regional Transportation District 1.00%<br />
Scientific Cultural Facilities District 0.10%<br />
Total: 7.25%<br />
As a home-rule municipality, the City of Greenwood Village closely monitors sales tax collections through a selfcollection<br />
and audit program. Forecasts of sales tax are based on the detailed analysis of historical trends, evaluation<br />
of local and national economic indicators, and anticipated alterations to the local commercial/consumer environment.<br />
The following chart illustrates the sales tax trends and forecasts:<br />
$26.0<br />
$25.0<br />
$24.0<br />
$23.0<br />
$22.0<br />
$21.0<br />
$20.0<br />
Sales Tax<br />
(in millions)<br />
2014<br />
Actuals<br />
2015<br />
Actuals<br />
Sales Tax<br />
(in millions)<br />
2016<br />
Actuals<br />
2017 Amended <strong>Budget</strong><br />
$25.28 Million<br />
2017<br />
Estimate<br />
<strong>2018</strong><br />
<strong>Adopted</strong><br />
<strong>Budget</strong><br />
21.78 24.16 24.65 25.00 25.35<br />
As evident in the above chart, sales tax collections are forecasted to increase 0.29% over those of the prior year’s<br />
amended budget. The negligible increase is due to an unexpected recent flattening of sales tax collections. Thus, the<br />
City expects 2017 collections to fall slightly below initial forecasts. Due to the inherent sensitivity of sales tax to consumer<br />
and commercial spending, coupled with the continued volatility of the consumer confidence and retail sales indexes<br />
over the past twelve months, <strong>2018</strong> sales tax collections have been forecasted to increase 1.4% above those of the<br />
revised 2017 year-end estimates.<br />
Use Tax<br />
In addition to sales tax, the City also imposes a 3.0% use tax. Use taxes are levied upon the privilege to store, use,<br />
distribute, or consume tangible personal property located within the boundaries of the City. Such property is often initially<br />
purchased or leased outside of the jurisdictional boundaries of the community. Use tax complements sales tax by<br />
eliminating any tax advantage that out-of-jurisdiction retailers may have. Use tax is not due when the appropriate<br />
Greenwood Village sales tax has been paid or when another agency’s lawfully imposed sales or use tax has been paid<br />
at a rate equal to or greater than the City’s sales/use tax rate.<br />
Use tax is subdivided into two classifications, general use tax and building materials use tax. The building materials use<br />
tax applies when performing construction work which requires a building permit. The tax is estimated and paid prior to<br />
the issuance of the building permit. The estimated tax due is 3.0% of 60.0% percent of the total cost of construction.<br />
The first $3,500 of building materials are exempt from use tax.<br />
In <strong>2018</strong>, general use tax and building materials use tax collections are forecasted at $3.3 million and $2.4 million,<br />
respectively. Overall use tax collections account for $5.7 million or roughly 11.6% of the City’s total revenue. Use tax<br />
collections are far more volatile than sales tax due to the often unpredictable commercial and development-related<br />
spending from which it is generated. Projections of use tax are based on a combination of historical trending, staff<br />
21
REVENUE ASSESSMENT<br />
discussions with local developers, and a weighted probability analysis. The following chart reports the use tax trends<br />
and forecasts:<br />
$7.0<br />
$6.0<br />
$5.0<br />
$4.0<br />
$3.0<br />
$2.0<br />
$1.0<br />
$0.0<br />
Use Tax<br />
(in millions)<br />
2014<br />
Actuals<br />
2015<br />
Actuals<br />
Use Tax<br />
(in millions)<br />
2016<br />
Actuals<br />
2017 Amended <strong>Budget</strong><br />
$6.17 Million<br />
2017<br />
Estimate<br />
<strong>2018</strong><br />
<strong>Adopted</strong><br />
<strong>Budget</strong><br />
5.60 4.98 6.24 6.29 5.67<br />
As the above chart illustrates, use tax collections are expected to decrease 8.2% when compared to the previous year’s<br />
amended budget. Based on current collections and known or probable development projects, the City anticipates that<br />
2017 collections will exceed those included in the prior year’s amended budget by approximately 1.9%. Given an<br />
anticipated decline in future development activity, as well as the irregularity of development and commercial spending,<br />
the City has elected to remain conservative when forecasting use tax collections. As such, the <strong>2018</strong> use tax collections<br />
are forecasted to decrease 9.9% below those of the revised 2017 year-end estimates.<br />
Lodging Tax<br />
A 3.0% lodging tax is assessed on all lodging services provided within the City. Lodging tax collections are forecasted<br />
at $1.7 million or 3.4% of the organization’s total revenue. Projections of lodging tax are based on the analysis of<br />
historical trends, evaluation of local and national economic indicators, and anticipated alterations to the local lodging<br />
environment. The following chart provides lodging tax collection trends and forecasts:<br />
$1.9<br />
$1.7<br />
$1.5<br />
$1.3<br />
$1.1<br />
$0.9<br />
$0.7<br />
$0.5<br />
Lodging Tax<br />
(in millions)<br />
2014<br />
Actuals<br />
2015<br />
Actuals<br />
Lodging Tax<br />
(in millions)<br />
2016<br />
Actuals<br />
2017 Amended <strong>Budget</strong><br />
$1.72 Million<br />
2017<br />
Estimate<br />
<strong>2018</strong><br />
<strong>Adopted</strong><br />
<strong>Budget</strong><br />
1.37 1.53 1.62 1.63 1.65<br />
As shown in the above chart, lodging tax collections are forecasted to decrease 4.0% when compared to the forecasts<br />
of the previous year’s amended budget. Based on current collection rates, the City expects collections to fall below<br />
those of the 2017 amended budget by approximately 5.2%. Due to the inherent sensitivity of lodging tax to consumer<br />
spending, <strong>2018</strong> lodging tax collections have been forecasted to increase 1.2% above those of the revised 2017 yearend<br />
estimates.<br />
22
REVENUE ASSESSMENT<br />
Occupational Privilege Tax<br />
An occupational privilege tax is levied upon all employees who perform services within the City. In each month where<br />
an employee earns at least $250, both the employee and employer are assessed a $2.00 tax. The occupational privilege<br />
tax is collected and accounted for in the <strong>Capital</strong> Projects Fund, as the resources are restricted for the purposes of<br />
rehabilitating and/or improving the community’s infrastructure. Occupational privilege tax projections account for $2.0<br />
million or 4.1% of the City’s total revenue. The <strong>2018</strong> forecast represents an increase of 0.5% above the prior year’s<br />
amended budget and that of current year-end estimates. The following chart represents the historical collection trends<br />
and forecast of occupational privilege tax:<br />
Occupational Privilege Tax<br />
(in millions)<br />
$2.5<br />
$2.3<br />
$2.0<br />
$1.8<br />
$1.5<br />
$1.3<br />
$1.0<br />
Occupational Privilege Tax<br />
(in millions)<br />
2014<br />
Actuals<br />
2015<br />
Actuals<br />
2016<br />
Actuals<br />
2017 Amended <strong>Budget</strong><br />
$1.99 Million<br />
2017<br />
Estimate<br />
<strong>2018</strong><br />
<strong>Adopted</strong><br />
<strong>Budget</strong><br />
1.80 1.95 1.95 1.99 2.00<br />
Intergovernmental<br />
The intergovernmental revenue category represents approximately 6.3% of total revenues. The category is made up of<br />
revenues which are collected on behalf of the City by other governments. Revenues which fall under this category<br />
include grants and proceeds received from other government agencies. In an effort to remain conservative, the City<br />
does not forecast the receipt of grant and/or intergovernmental agreement resources until awarded or otherwise<br />
confirmed. Instead, the City has elected to amend the budget via the supplemental appropriation process as necessary,<br />
if and when such resources materialize.<br />
Intergovernmental<br />
(in millions)<br />
$6.0<br />
$5.0<br />
$4.0<br />
$3.0<br />
$2.0<br />
$1.0<br />
Intergovernmental<br />
(in millions)<br />
2014<br />
Actuals<br />
2015<br />
Actuals<br />
2016<br />
Actuals<br />
2017 Amended <strong>Budget</strong><br />
$2.79 Million<br />
2017<br />
Estimate<br />
<strong>2018</strong><br />
<strong>Adopted</strong><br />
<strong>Budget</strong><br />
2.42 3.18 4.64 2.79 3.06<br />
Licenses & Permits<br />
The City issues various licenses and permits which grant the holder specific use privileges. The fees, which account for<br />
approximately 3.5% of the <strong>2018</strong> budgeted revenues, are intended to offset the administration costs associated with<br />
those activities. Currently, the City issues and collects fees for business and liquor licenses, as well as building permits,<br />
23
REVENUE ASSESSMENT<br />
and park use. Revenues within the licenses and permits category are expected to decrease 3.1% compared to the prior<br />
year’s amended budget due to a slowdown in building permit activity. Forecasts are supported by historical collection<br />
trends, staff discussions with local developers, and a weighted probability analysis. The following chart illustrates the<br />
historical licenses and permits trends and forecasts:<br />
$1.8<br />
$1.6<br />
$1.4<br />
$1.2<br />
$1.0<br />
$0.8<br />
$0.6<br />
$0.4<br />
$0.2<br />
$0.0<br />
Licenses & Permits<br />
(in millions)<br />
2014<br />
Actuals<br />
Licenses & Permits<br />
(in millions)<br />
2015<br />
Actuals<br />
2016<br />
Actuals<br />
2017 Amended <strong>Budget</strong><br />
$1.76 Million<br />
2017<br />
Estimate<br />
<strong>2018</strong><br />
<strong>Adopted</strong><br />
<strong>Budget</strong><br />
1.21 1.35 1.63 1.68 1.70<br />
Charges & Fees<br />
Charges and fees are intended to offset costs associated with specific goods and services provided to identifiable<br />
recipients. The revenue category represents approximately 5.9% of the organization’s revenue. Ex<strong>amp</strong>les of user<br />
charges include franchise fees, review fees, recreation participant fees, off-duty police officer charges, and the sale of<br />
miscellaneous goods and services. Revenues within the charges and fees category are expected to decrease 4.6%<br />
compared to the prior year’s amended budget due to an anticipated decrease in plan review fees pertaining to<br />
commercial development activity. Collection forecasts are supported via assumptions regarding the continuation of<br />
customer demand for fee-related goods and/or services, as well as changes to the fee structures.<br />
Charges & Fees<br />
(in millions)<br />
$3.4<br />
$3.2<br />
$3.0<br />
$2.8<br />
$2.6<br />
$2.4<br />
$2.2<br />
$2.0<br />
Charges & Fees<br />
(in millions)<br />
2014<br />
Actuals<br />
2015<br />
Actuals<br />
2016<br />
Actuals<br />
2017 Amended <strong>Budget</strong><br />
$3.04 Million<br />
2017<br />
Estimate<br />
<strong>2018</strong><br />
<strong>Adopted</strong><br />
<strong>Budget</strong><br />
2.84 2.67 2.80 2.91 2.90<br />
24
REVENUE ASSESSMENT<br />
Fines & Forfeitures<br />
Fines and forfeitures comprise approximately 2.1% of the City’s total revenue and include court fees and fines imposed<br />
by the Municipal Judge. Funds received are punitive in nature for the commission of minor crimes, code violations or<br />
the settlement of claims.<br />
Fine and forfeiture revenue collections are anticipated to decrease approximately 6.2% when compared to the prior<br />
year’s amended budget. The decrease is the result of collections associated with the photo red light program, and is<br />
more representative of what was recorded during the last audited fiscal year. The following chart illustrates the historical<br />
fines and forfeiture trends and forecasts:<br />
Fines & Forfeitures<br />
(in millions)<br />
$1.2<br />
$1.1<br />
$1.0<br />
$0.9<br />
$0.8<br />
$0.7<br />
$0.6<br />
Fines & Forfeitures<br />
(in millions)<br />
2014<br />
Actuals<br />
2015<br />
Actuals<br />
2016<br />
Actuals<br />
2017 Amended <strong>Budget</strong><br />
$1.09 Million<br />
2017<br />
Estimate<br />
<strong>2018</strong><br />
<strong>Adopted</strong><br />
<strong>Budget</strong><br />
1.09 1.12 0.97 1.00 1.02<br />
Investment Earnings<br />
The City of Greenwood Village invests primarily in a combination of local government investment pools, collateralized<br />
time deposits, and money market accounts. Although market rates continue to improve, it is anticipated that a high<br />
percentage of the organization’s portfolio will consist of short duration and/or liquid instruments. However, the adoption<br />
of an investment policy in 2016 has resulted in a more effective portfolio to include government and corporate securities<br />
as shown by the higher returns.<br />
Investment Earnings<br />
(in thousands)<br />
$525.0<br />
$475.0<br />
$425.0<br />
$375.0<br />
$325.0<br />
$275.0<br />
$225.0<br />
$175.0<br />
$125.0<br />
$75.0<br />
$25.0<br />
Investment Earnings<br />
(in thousands)<br />
2014<br />
Actuals<br />
2015<br />
Actuals<br />
2017 Amended <strong>Budget</strong><br />
$291 Thousand<br />
2016<br />
Actuals<br />
2017<br />
Estimate<br />
<strong>2018</strong><br />
<strong>Adopted</strong><br />
<strong>Budget</strong><br />
27.33 33.44 166.46 250.92 500.00<br />
25
REVENUE ASSESSMENT<br />
Miscellaneous Revenue<br />
Revenue sources categorized as miscellaneous revenue include miscellaneous reimbursements, grants/contributions<br />
from nongovernmental sources, and other unforeseen collections which cannot accurately be accounted for in the above<br />
categories. Miscellaneous revenue accounts for 0.03% of the City’s total revenue.<br />
Miscellaneous Revenue<br />
(in thousands)<br />
$120.0<br />
$100.0<br />
$80.0<br />
$60.0<br />
$40.0<br />
$20.0<br />
$0.0<br />
Miscellaneous Revenue<br />
(in thousands)<br />
2014<br />
Actuals<br />
2015<br />
Actuals<br />
2016<br />
Actuals<br />
2017 Amended <strong>Budget</strong><br />
$8 Thousand<br />
2017<br />
Estimate<br />
<strong>2018</strong><br />
<strong>Adopted</strong><br />
<strong>Budget</strong><br />
53.50 73.17 112.93 8.58 16.50<br />
26
EXPENDITURE ASSESSMENT<br />
Overview<br />
To simplify financial reporting, the City of Greenwood Village has organized its expenditures into six categories:<br />
Personnel, Purchased Services, Supplies/Non-<strong>Capital</strong> Equipment, <strong>Capital</strong> Outlay, Debt Service, and Miscellaneous<br />
Expenditures.<br />
2016<br />
Audited<br />
Actuals<br />
2017<br />
Amended<br />
<strong>Budget</strong><br />
<strong>2018</strong><br />
<strong>Adopted</strong><br />
<strong>Budget</strong><br />
% Change<br />
Expenditures:<br />
Personnel $ 22,559,457 $ 23,760,018 $ 24,057,465 1.25%<br />
Purchased Services 5,843,390 8,501,522 6,843,333 -19.50%<br />
Supplies/Non-<strong>Capital</strong> Equipment 3,048,118 3,246,037 3,129,034 -3.60%<br />
<strong>Capital</strong> Outlay 10,920,256 23,711,048 19,613,597 -17.28%<br />
Debt Service 31,522 31,522 13,135 -58.33%<br />
Miscellaneous Expenditures 2,566,943 580,256 746,230 28.60%<br />
Total Expenditures $ 44,969,686 $ 59,830,403 $ 54,402,794 -9.07%<br />
Supplies/Non-<strong>Capital</strong><br />
Equipment<br />
6%<br />
Total Expenditures by Category<br />
Purchased Services<br />
13%<br />
<strong>Capital</strong> Outlay<br />
36%<br />
Personnel<br />
44%<br />
Debt Service<br />
0%<br />
Miscellaneous<br />
Expenditures<br />
1%<br />
As reported in the above table, forecasted city-wide expenditures of $54.4 million are 9.1% below that of the current<br />
year’s amended budget. Similar to revenues, the total expenditure figure is misleading without the benefit of additional<br />
discussion. As per the Municipal Charter, appropriations related to capital improvement projects do not expire or<br />
terminate at the close of the fiscal year. Thus, unspent appropriations from the prior year have been “carried over” to<br />
the 2017 amended budget. The process inflates the prior year capital outlay appropriations and consequently, makes it<br />
appear as though the City is reducing the capital improvement budget by $4.5 million. Additionally, one-time<br />
expenditures such as the dissolution of the Greenwood Village Sewer General <strong>Improvement</strong> District #1 in 2017, as well<br />
as the proposed offset of personnel expenditures via the use of retirement plan forfeitures also serves to distort the<br />
year-to-year comparison. Omitting the above items from the budget comparison provides a much more accurate<br />
assessment and results in an increase of $1.1 million or 3.0%.<br />
The expenditure categories, as well as some of the more significant changes in spending authorization are discussed<br />
in more detail below. Detail regarding individual changes in budgeted expenditures are contained in the departmental<br />
budget variance justifications.<br />
27
EXPENDITURE ASSESSMENT<br />
Personnel<br />
Personnel expenditures include the payment of employee salaries, overtime, allowances, benefits, and employer tax<br />
obligations. Costs associated with personnel represent 44.2% of the total budgeted expenditures. Personnel<br />
expenditures increased 1.3% or $297,447 over those of the prior year’s amended budget. Due to the materiality of<br />
personnel costs on the City’s budget, each element of the change is presented below. Where appropriate, additional<br />
information regarding the addition or transition of positions has been included in the appropriate department narratives.<br />
Correction of Prior Year Calculation Error: +$104,671<br />
Additional FTE Facility Service Worker: +$48,701<br />
Transition of 1 Commander to Sergeant: -$16,820<br />
Promotion of 6 Police Officers to Corporals: +$28,243<br />
Impact of Prior Year Merit Increases/Employee Transition: +$69,135<br />
Employee Selection Changes to Health/Dental Plans: +$96,648<br />
<strong>2018</strong> General Employee Market Adjustments: +$18,602<br />
<strong>2018</strong> General Employee Merit Adjustments: +$207,720<br />
<strong>2018</strong> Commissioned Officer Market Adjustments: +$224,551<br />
<strong>2018</strong> Commissioned Officer Pay Plan Step Adjustment: +$77,271<br />
<strong>2018</strong> Seasonal Wage Adjustments: +$12,936<br />
<strong>2018</strong> Rate/Shift Differential Adjustments: -$10,000<br />
<strong>2018</strong> Overtime Wage Adjustments: -$7,478<br />
<strong>2018</strong> Allowance Adjustments: +$2,270.<br />
<strong>2018</strong> Medical/Dental Insurance Premium Adjustments: +$224,262<br />
Use of Retirement Plan Forfeitures: -$783,265<br />
The following chart illustrates the historical personnel trends and forecasts:<br />
$24.5<br />
$24.0<br />
$23.5<br />
$23.0<br />
$22.5<br />
$22.0<br />
$21.5<br />
$21.0<br />
$20.5<br />
$20.0<br />
Personnel<br />
(in millions)<br />
2014<br />
Actuals<br />
2015<br />
Actuals<br />
Personnel<br />
(in millions)<br />
2016<br />
Actuals<br />
2017 Amended <strong>Budget</strong><br />
$23.76 Million<br />
2017<br />
Estimate<br />
<strong>2018</strong><br />
<strong>Adopted</strong><br />
<strong>Budget</strong><br />
21.26 22.13 22.56 23.10 24.06<br />
As depicted in the above chart, personnel costs are forecasted to increase approximately 4.2% above those of the yearend<br />
estimate. That said, there is often a difference between personnel forecasts and the costs which are actually<br />
recognized by the organization. The personnel budget is generated using current payroll data, yet such data is modified<br />
so as to infer the complete occupancy of all available positions. The method does not take into account the vacancy<br />
savings recognized when positions are vacated for a period of time, nor does it account for the often reduced rate which<br />
newly hired individuals earn in comparison to their predecessors.<br />
28
EXPENDITURE ASSESSMENT<br />
Purchased Services<br />
The purchased services category represents approximately 12.6% of the total expenditures. Forecasted expenditures<br />
decreased 19.5% when compared to the prior year primarily due to the one-time expenditure associated with the<br />
dissolution of the Greenwood Village Sewer General <strong>Improvement</strong> District #1 in 2017. This category is made up of<br />
expenditures, which by their nature, are performed by persons or firms external to the organization. While a product<br />
may or may not result from the transaction, the primary reason for the purchase is the service provided. Expenditures<br />
which fall under this category include; administrative services, technical services, travel, training, repairs/maintenance,<br />
rentals/leases, and non-personnel related insurance premiums. Changes within the purchased services category are<br />
discussed within the departmental budgets.<br />
$8.5<br />
$8.0<br />
$7.5<br />
$7.0<br />
$6.5<br />
$6.0<br />
$5.5<br />
$5.0<br />
$4.5<br />
Purchased Services<br />
(in millions)<br />
2014<br />
Actuals<br />
Purchased Services<br />
(in millions)<br />
2015<br />
Actuals<br />
2016<br />
Actuals<br />
2017<br />
Estimate<br />
2017 Amended <strong>Budget</strong><br />
$8.5 Million<br />
<strong>2018</strong><br />
<strong>Adopted</strong><br />
<strong>Budget</strong><br />
4.85 5.22 5.84 7.90 6.84<br />
Supplies/Non-<strong>Capital</strong> Equipment<br />
The supplies and non-capital equipment category represents approximately 5.8% of the total organizational<br />
expenditures. Forecasted expenditures decreased 3.6% from the 2017 amended budget. Expenditures in this category<br />
are for items that are consumed, worn out, or deteriorated through use, and do not meet the requirements of the City’s<br />
definition of capital assets. Supplies, natural gas, electricity, fuel, as well as non-capital equipment such as file cabinets,<br />
desks, and personal computers are included in this category. Changes within the supplies/non-capital equipment<br />
category are discussed within the departmental budgets.<br />
$3.5<br />
Supplies/Non-<strong>Capital</strong> Equipment<br />
(in millions)<br />
2017 Amended <strong>Budget</strong><br />
$3.25 Million<br />
$3.0<br />
$2.5<br />
$2.0<br />
Supplies/Non-<strong>Capital</strong> Equipment<br />
(in millions)<br />
2014<br />
Actuals<br />
2015<br />
Actuals<br />
2016<br />
Actual<br />
2017<br />
Estimate<br />
<strong>2018</strong><br />
<strong>Adopted</strong><br />
<strong>Budget</strong><br />
2.73 2.85 3.05 3.10 3.13<br />
29
EXPENDITURE ASSESSMENT<br />
<strong>Capital</strong> Outlay<br />
The capital outlay category makes up 36.1% of the total budgeted expenditures. Expenditures in this category include<br />
capital assets and capital improvement projects including the acquisition of land, buildings, infrastructure and/or the<br />
improvements thereof. Expenditures in this category tend to vary substantially from year to year based on the needs of<br />
the organization and community. Additional detail regarding the capital improvement projects can be found in the <strong>Capital</strong><br />
<strong>Improvement</strong> Program section of the budget document. The planned capital asset replacements and purchases for<br />
<strong>2018</strong> are shown in the following chart:<br />
Item Description<br />
Amount<br />
Administrative Services<br />
Final Phase of Conference Room Upgrade $ 11,000<br />
Keri Door System Upgrades to IP-based Management Systems 25,130<br />
New Backup System to Replace CommVault 71,339<br />
Tax Software Replacement 75,000<br />
RMS System Replacement 434,430<br />
Fleet and Work Order Management System Replacement 86,700<br />
Total Administrative Services $ 703,599<br />
Parks, Trails & Recreation<br />
Kiln and Installation (Curtis School) $ 6,000<br />
Bluegrass Mower Replacement (3) 45,300<br />
Power Unit 11,500<br />
Ride On Aerator 10,750<br />
Equestrian Trail/Open Space Tractor with Mowing Deck 38,275<br />
Aerator Attachment 17,200<br />
60" Broom Attachment for JD Tractor 6,100<br />
Enclosed 4X4 Utility Vehicle with Plow and Broom Attachments 37,650<br />
Total Parks, Trails & Recreation $ 172,775<br />
Public Works<br />
400 Gallon Diesel Exhaust Fluid Dispenser $ 45,000<br />
Dump Truck (Replaces Unit 8204) 79,000<br />
Small Pickup (Replaces Unit 8202) 45,000<br />
Wood Chipper (Replaces Unit 8207) 45,000<br />
Utility Truck (Replaces Unit 8131, Developed Parks) 70,000<br />
Pickup Truck (Replaces Unit 8146, Developed Parks) 36,000<br />
Pickup Truck (Replaces Unit 8175, Developed Parks) 36,000<br />
Utility Truck (Replaces Unit 112, Developed Parks) 77,000<br />
Utility Truck (Replaces Unit 8301, Streetscapes) 45,000<br />
Pickup Truck (Replaces Unit 9704, Community Development) 38,000<br />
Passenger Van (Replaces Unit 9604, Fleet) 35,000<br />
Vehicle (Replaces Unit 4301, Water Quality) 45,000<br />
Dump Truck (Replaces Unit 8923, Snow & Ice) 203,000<br />
Dump Truck (Replaces Unit 8931, Snow & Ice) 210,000<br />
Pickup Truck (Replaces Unit 4101, Drainage) 50,000<br />
Vehicle (Replaces Unit 6203, Police) 45,000<br />
Vehicle (Replaces Unit 914, Police) 50,000<br />
Vehicle (Replaces Unit 915, Police) 50,000<br />
Vehicle (Replaces Unit 916, Police) 50,000<br />
Vehicle (Replaces Unit 933, Police) 65,000<br />
Vehicle (Replaces Unit 8807, Police) 40,000<br />
Vehicle (Replaces Unit 8808, Police) 40,000<br />
Speed Trailer (Replaces Unit T15) 12,000<br />
Trailer (Community Service Program) 15,000<br />
Video Detection System 85,140<br />
Layer Three Switch and Firewall for Traffic Signal/ITS System 36,083<br />
Total Public Works $ 1,547,223<br />
City-Wide Total $ 2,423,597<br />
30
EXPENDITURE ASSESSMENT<br />
Debt Service<br />
Colorado State Statute limits the total amount of General Obligation debt to three percent of the jurisdiction’s actual<br />
value of the taxable property within the City, as determined by the County Assessor. The City’s current legal debt limit<br />
and debt margin are as follows:<br />
Calculation of Legal Debt Margin<br />
<strong>2018</strong> Actual Value* $ 7,421,011,715<br />
Debt Limit – 3% of Net Assessed Value 222,630,351<br />
Outstanding Debt Applicable to Limit -<br />
Debt Margin $ 222,630,351<br />
*Based on preliminary actual valuation<br />
As shown in the above table, the City currently does not carry any debt applicable to the debt limit, however, other<br />
obligations do exist. The following table highlights the City’s current debt obligations:<br />
Principal<br />
Payment<br />
<strong>2018</strong> Activity<br />
Interest<br />
Payment<br />
Ending<br />
Balance<br />
Maturity<br />
Miscellaneous Expenditures<br />
Xerox Copier Lease:<br />
$ 13,135 $ - $ - 05/13/<strong>2018</strong><br />
Expenditure sources categorized as miscellaneous expenditures include; grants/contributions issued by the City, the<br />
Recreation Reimbursement program, and other unforeseen expenditures which cannot accurately be accounted for in<br />
the above categories. Miscellaneous expenditures account for 1.4% of the city-wide appropriation.<br />
31
OTHER SOURCES & USES<br />
Overview<br />
Since governmental funds focus on near-term liquidity (current financial resources), two categories in addition to<br />
revenues and expenditures are used in the governmental fund financial statements to classify events that do not<br />
generate or spend near-term, liquid resources. Other Financing Sources, increases in the net position of the<br />
government, are used to report events such as the issuance of long-term debt, sales of capital assets and transfers<br />
between funds. Other Financing Uses, decreases in the net position of the government, also classify events associated<br />
with long-term debt, such as, the recording of original issue discounts and payments to escrow agents for advanced<br />
refundings and transfers between funds.<br />
Interfund Transfers<br />
To meet the ever-changing needs of the community, the City is often required to transfer non-restricted revenues from<br />
one fund to another. In <strong>2018</strong>, the City plans for a single interfund transfer from the General Fund to the <strong>Capital</strong> Projects<br />
Fund in the amount of $4.7 million to support the future capital improvement efforts of the City.<br />
Sale of <strong>Capital</strong> Assets<br />
Each year the City evaluates the condition, disposal and replacement of its capital assets. The proceeds from the<br />
disposition of worn out assets are received and accounted for within the other sources category. In <strong>2018</strong>, the City<br />
anticipates the sale of such property will generate approximately $75,000.<br />
32
FUND BALANCE ANALYSIS<br />
Changes in Fund Balance<br />
Following sound financial management, the City confines the use of fund balance to items which are commonly regarded<br />
as one-time or limited in duration. By maintaining appropriate fund balances in each of its funds, the City is able to adapt<br />
to changing market conditions, take advantage of unforeseen opportunities, and maintain adequate cash balances given<br />
the cyclical nature of the local economy. In some cases, funds are designed to accumulate fund balance in order to<br />
finance future projects and/or purchases. As shown in the following table, <strong>2018</strong> expenditure requests exceed revenue<br />
forecasts by $5.5 million resulting in an overall decrease in fund balance.<br />
<strong>2018</strong> Beginning<br />
Fund Balance<br />
Revenues &<br />
Other Sources<br />
Expenditures &<br />
Other Uses<br />
Surplus/<br />
(Deficits)<br />
<strong>2018</strong> Ending<br />
Fund Balance<br />
General Fund $ 24,966,098 $ 41,806,483 $ 41,806,483 $ - $ 24,966,098<br />
<strong>Capital</strong> Projects Fund 12,461,042 11,823,640 17,338,430 (5,514,790) 6,946,252<br />
$ 37,427,140 $ 53,630,123 $ 59,144,913 $ (5,514,790) $ 31,912,350<br />
A discussion of the changes in fund balance for each fund is included below:<br />
<br />
<br />
General Fund – Fund balance is forecasted to remain unchanged from the prior year as the annual operating<br />
surplus of $4.7 million is slated for transfer to the <strong>Capital</strong> Projects Fund to support future reinvestment in the<br />
community’s capital infrastructure.<br />
<strong>Capital</strong> Projects Fund – Fund balance is forecasted to decrease by 44.3% or $5.5 million. As designed, resources<br />
within the fund are accumulated over a period of time for the purposes of supporting future capital reinvestment.<br />
The use of fund balance is entirely attributable to the planned $7.8 million redesign and construction of the<br />
maintenance facility, for which funding was previously accumulated as an assigned fund balance.<br />
Restrictions, Commitments & Assignments<br />
Due to limitations placed on the purposes for which portions of the City’s financial resources may be used, it is necessary<br />
to classify various components of fund balance. The components are developed in such a manner as to identify the<br />
extent to which the City is bound to the constraints and specific purposes for which amounts in the fund can be spent.<br />
<br />
<br />
<br />
<br />
Restricted Fund Balance – Describes the portion of fund balance which reflects resources that are subject to<br />
externally enforceable legal restrictions.<br />
Committed Fund Balance – Describes the portion of fund balance which represents resources that are constrained<br />
by self-imposed limitations. Commitments of this type are made by the City Council via ordinance or resolution<br />
and may only be abolished in the same manner.<br />
Assigned Fund Balance – Describes the portion of fund balance which reflects the government’s intended use of<br />
resources. Assignments are often made by the governing body, committee or executive of the organization.<br />
Unassigned Fund Balance – If funds are not restricted, committed or assigned, they could not properly be reported<br />
in a fund other than the General Fund, as such, resources are in fact assigned in conjunction with the overall,<br />
non-specific purposes of the funds themselves. Therefore, only the General Fund can technically report a positive<br />
amount of unassigned fund balance.<br />
33
FUND BALANCE ANALYSIS<br />
<strong>2018</strong> Beginning<br />
Fund Balance<br />
Revenues &<br />
Other Sources<br />
Expenditures &<br />
Other Uses<br />
Restrictions/<br />
Commitments/<br />
Assignments<br />
<strong>2018</strong><br />
Unassigned<br />
Fund Balance<br />
General Fund $ 24,966,098 $ 41,806,483 $ 41,806,483 $ 11,092,900 $ 13,873,198<br />
<strong>Capital</strong> Projects Fund 12,461,042 11,823,640 17,338,430 6,946,252 -<br />
$ 37,427,140 $ 53,630,123 $ 59,144,913 $ 18,039,152 $ 13,873,198<br />
As shown in the above table, the forecasted ending fund balance of $31.9 million exceeds all restrictions, commitments<br />
and assignments of the organization by $13.9 million (unassigned fund balance). These funds are available to meet the<br />
needs of the community without regard to spending limitations otherwise imposed by the City or external agencies.<br />
The <strong>2018</strong> budget provides for all externally enforceable restrictions, as well as a 25% <strong>Operating</strong> Reserve Assignment,<br />
and an Open Space Acquisition Assignment. The 25% <strong>Operating</strong> Reserve Assignment is determined via a calculation<br />
of 25% of the General Fund operating expenditures and serves to shore up reserves and assist in meeting cash flow<br />
needs of the organization. On the other hand, the Open Space Acquisition Assignment operates much like a savings<br />
account to accumulate reserves for future expenditures. Additionally, the <strong>2018</strong> budget includes an assignment for the<br />
rebate of development fees anticipated to be collected during the fiscal period. The assignment maintains those<br />
resources which are expected to be rebated upon completion of the development.<br />
34
CITY-WIDE FINANCIAL SUMMARY<br />
2016<br />
Audited<br />
Actuals<br />
2017<br />
Amended<br />
<strong>Budget</strong><br />
<strong>2018</strong><br />
<strong>Adopted</strong><br />
<strong>Budget</strong><br />
% Change<br />
Revenue:<br />
Taxes & Assessments $ 38,889,425 $ 39,679,000 $ 39,621,521 -0.14%<br />
Intergovernmental 4,635,492 2,791,359 3,055,028 9.45%<br />
Licenses & Permits 1,629,321 1,755,000 1,701,000 -3.08%<br />
Charges & Fees 2,800,927 3,039,000 2,898,955 -4.61%<br />
Fines & Forfeitures 971,245 1,087,000 1,020,000 -6.16%<br />
Investment Earnings 166,457 291,000 500,000 71.82%<br />
Miscellaneous Revenue 112,925 8,000 16,500 106.25%<br />
Total Revenue 49,205,792 48,650,359 48,813,004 0.33%<br />
Expenditures:<br />
Personnel 22,559,457 23,760,018 24,057,465 1.25%<br />
Purchased Services 5,843,390 8,501,522 6,843,333 -19.50%<br />
Supplies/Non-<strong>Capital</strong> Equipment 3,048,118 3,246,037 3,129,034 -3.60%<br />
<strong>Capital</strong> Outlay 10,920,256 23,711,048 19,613,597 -17.28%<br />
Debt Service 31,522 31,522 13,135 -58.33%<br />
Miscellaneous Expenditures 2,566,943 580,256 746,230 28.60%<br />
Total Expenditures 44,969,686 59,830,403 54,402,794 -9.07%<br />
Excess/(Deficiency) of Revenues<br />
Over Expenditures 4,236,106 (11,180,044) (5,589,790) -50.00%<br />
Other Financing Sources/(Uses):<br />
Sale of <strong>Capital</strong> Assets 81,281 50,000 75,000 50.00%<br />
Insurance Recovery 402,644 162,646 - -100.00%<br />
Total Other Financing Sources/(Uses) 483,925 212,646 75,000 -64.73%<br />
Net Change In Fund Balance: 4,720,031 (10,967,398) (5,514,790) -49.72%<br />
Cumulative Fund Balance<br />
Beginning Fund Balance 43,674,507 48,394,538 37,427,140 -22.66%<br />
Ending Fund Balance 48,394,538 37,427,140 31,912,350 -14.73%<br />
Less Restrictions, Commitments, & Assignments:<br />
3% TABOR Emergency Restriction 1,402,000 1,459,511 1,464,390 0.33%<br />
Arts/Humanities Council Restriction 86,712 81,219 81,219 0.00%<br />
Federal/State Forfeiture Restriction 225,679 - - 0.00%<br />
25% <strong>Operating</strong> Reserve Assignment 8,743,187 9,224,555 9,266,091 0.45%<br />
SGID #1 Restriction 1,270,414 - - 0.00%<br />
Open Space Tax Restriction 1,637,387 202,534 602,534 197.50%<br />
Lottery Proceeds Restriction 272,451 108,563 253,563 133.56%<br />
<strong>Capital</strong> Project Commitment 11,576,245 1,607,181 3,420,021 112.80%<br />
Open Space Acquisition Assignment 391,334 491,334 591,334 20.35%<br />
Maintenance Facility Phase II Assignment 5,825,000 7,825,000 - -100.00%<br />
Development Rebate Assignment 1,765,974 2,525,974 2,360,000 -6.57%<br />
Unassigned Fund Balance* $ 15,198,155 $ 13,901,269 $ 13,873,198 -0.20%<br />
*The reported Unassigned Fund Balance is that of the General Fund<br />
35
CITY-WIDE REVENUE DETAIL<br />
2016<br />
Audited<br />
Actuals<br />
2017<br />
Amended<br />
<strong>Budget</strong><br />
<strong>2018</strong><br />
<strong>Adopted</strong><br />
<strong>Budget</strong><br />
% Change<br />
Taxes & Assessments<br />
Property Tax $ 2,932,527 $ 2,967,000 $ 3,400,000 14.59%<br />
Specific Ownership Tax 227,892 231,000 235,000 1.73%<br />
Sales Tax 24,651,353 25,277,000 25,350,000 0.29%<br />
Use Tax 3,110,696 3,223,000 3,250,000 0.84%<br />
Building Materials Use Tax 3,124,856 2,949,000 2,418,000 -18.01%<br />
Lodging Tax 1,616,864 1,718,000 1,650,000 -3.96%<br />
Occupational Privilege Tax 1,949,501 1,990,000 2,000,000 0.50%<br />
Special Assessments 78,633 74,000 68,521 -7.40%<br />
Audit & Compliance 1,197,103 1,250,000 1,250,000 0.00%<br />
Total Taxes & Assessments 38,889,425 39,679,000 39,621,521 -0.14%<br />
Intergovernmental<br />
Tobacco Tax 109,499 109,000 105,000 -3.67%<br />
Mineral Lease/Severance Tax 7,613 15,000 7,500 -50.00%<br />
Open Space Tax 371,862 381,000 400,000 4.99%<br />
Lottery Proceeds 158,549 174,000 145,000 -16.67%<br />
District Court Proceeds 23,201 35,000 30,000 -14.29%<br />
State/Federal Forfeitures 9,926 - - 0.00%<br />
Road & Bridge Tax 321,232 331,000 330,000 -0.30%<br />
Motor Vehicle Registration 59,780 61,000 60,000 -1.64%<br />
Highway Users Tax 545,202 566,000 550,000 -2.83%<br />
Intergovernmental Agreements 595,292 624,740 951,909 52.37%<br />
Grant Proceeds 2,433,336 494,619 475,619 -3.84%<br />
Total Intergovernmental 4,635,492 2,791,359 3,055,028 9.45%<br />
Licenses & Permits<br />
Business Licenses 15,750 15,000 15,000 0.00%<br />
Liquor Licenses 37,808 30,000 30,000 0.00%<br />
Contractor Licenses 111,900 108,000 115,000 6.48%<br />
Building Permits 1,297,150 1,461,000 1,375,000 -5.89%<br />
Park Use Permits 39,610 40,000 40,000 0.00%<br />
Guard/Merchant Patrol Licenses 1,000 1,000 1,000 0.00%<br />
Right-Of-Way Permits 126,103 100,000 125,000 25.00%<br />
Total Licenses & Permits 1,629,321 1,755,000 1,701,000 -3.08%<br />
36
CITY-WIDE REVENUE DETAIL<br />
2016<br />
Audited<br />
Actuals<br />
2017<br />
Amended<br />
<strong>Budget</strong><br />
<strong>2018</strong><br />
<strong>Adopted</strong><br />
<strong>Budget</strong><br />
% Change<br />
Charges & Fees<br />
Administrative Fees 3,996 4,000 4,000 0.00%<br />
Plan Review Fees 500,372 604,000 359,000 -40.56%<br />
Zoning & Subdivision Fees 16,850 23,000 20,000 -13.04%<br />
Elevator Inspection Fees 120,820 170,000 183,455 7.91%<br />
Rental/Lease Proceeds 38,527 39,000 40,000 2.56%<br />
Participant Fees 163,200 150,000 160,000 6.67%<br />
Franchise Fees 1,642,962 1,613,000 1,700,000 5.39%<br />
Overtime Service Fees 5,445 10,000 5,000 -50.00%<br />
Extra Duty Service Fees 299,305 415,000 415,000 0.00%<br />
Fingerprinting Fees 6,445 6,000 7,500 25.00%<br />
Sale of Goods 2,973 5,000 5,000 0.00%<br />
Documents/Media 32 - - 0.00%<br />
Total Charges & Fees 2,800,927 3,039,000 2,898,955 -4.61%<br />
Fines & Forfeitures<br />
Court Costs 92,743 88,000 95,000 7.95%<br />
Court Fines 466,280 474,000 475,000 0.21%<br />
Photo Red Light Fines 412,222 525,000 450,000 -14.29%<br />
Total Fines & Forfeitures 971,245 1,087,000 1,020,000 -6.16%<br />
Investment Earnings<br />
Investment Earnings 166,457 291,000 500,000 71.82%<br />
Total Investment Earnings 166,457 291,000 500,000 71.82%<br />
Miscellaneous Revenue<br />
Miscellaneous Revenue 49,889 - - 0.00%<br />
Contributions & Donations 63,036 8,000 16,500 106.25%<br />
Total Miscellaneous Revenue 112,925 8,000 16,500 106.25%<br />
Total Revenues $ 49,205,792 $ 48,650,359 $ 48,813,004 0.33%<br />
37
CITY-WIDE EXPENDITURE DETAIL<br />
2016<br />
Audited<br />
Actuals<br />
2017<br />
Amended<br />
<strong>Budget</strong><br />
<strong>2018</strong><br />
<strong>Adopted</strong><br />
<strong>Budget</strong><br />
% Change<br />
Personnel<br />
Regular Wages $ 16,054,209 $ 16,836,049 $ 17,492,436 3.90%<br />
Seasonal/Temporary Wages 158,999 173,725 186,661 7.45%<br />
Longevity Service Award 147,520 163,694 160,549 -1.92%<br />
Rate/Shift Differential 25,369 33,000 23,000 -30.30%<br />
Extra Duty Assignment 400,114 464,200 464,200 0.00%<br />
Overtime Wages 412,153 459,711 452,233 -1.63%<br />
Tuition Reimbursement 22,165 35,000 35,000 0.00%<br />
Clothing Allowance 20,527 21,550 22,900 6.26%<br />
Cleaning Allowance 32,402 33,000 33,500 1.52%<br />
Communication Allowance 14,050 16,860 16,800 -0.36%<br />
Vehicle Allowance 21,600 21,600 21,600 0.00%<br />
Social Security 688,527 752,129 763,074 1.46%<br />
Medicare 240,924 250,548 259,493 3.57%<br />
Workers Compensation 284,084 348,259 360,969 3.65%<br />
FPPA Death & Disability 95,013 95,422 107,036 12.17%<br />
Retirement Contributions 1,449,371 1,535,127 822,287 -46.44%<br />
Medical Insurance 2,223,996 2,239,010 2,556,631 14.19%<br />
Dental Insurance 108,642 116,229 122,643 5.52%<br />
Insurance Waivers 54,465 53,100 49,975 -5.89%<br />
Life/AD&D Insurance 56,442 60,211 56,315 -6.47%<br />
Disability Insurance 48,885 51,594 50,163 -2.77%<br />
Total Personnel 22,559,457 23,760,018 24,057,465 1.25%<br />
Purchased Services<br />
Professional Services 1,008,115 1,750,139 1,443,677 -17.51%<br />
Contracted Services 1,100,289 2,708,684 1,445,432 -46.64%<br />
Catering/Dining Services 65,005 76,062 82,242 8.12%<br />
Repair/Maintenance Services 1,585,909 1,668,667 1,565,269 -6.20%<br />
Disposal/Recycling Services 812,611 805,203 813,993 1.09%<br />
Telecommunication Services 160,234 193,562 201,925 4.32%<br />
Postage/Shipping Services 71,009 69,930 71,330 2.00%<br />
Advertising/Notification Services 12,514 18,250 19,000 4.11%<br />
Printing/Publication Services 145,508 192,450 190,466 -1.03%<br />
Training/Education 294,490 376,356 363,559 -3.40%<br />
Dues/Memberships 184,601 214,137 197,681 -7.68%<br />
Mileage/Travel 12,336 7,821 7,797 -0.31%<br />
Rentals/Leases 58,158 66,556 62,620 -5.91%<br />
Insurance Premiums/Deductibles 332,505 351,955 376,592 7.00%<br />
Miscellaneous Services 106 1,750 1,750 0.00%<br />
Total Purchased Services 5,843,390 8,501,522 6,843,333 -19.50%<br />
38
CITY-WIDE EXPENDITURE DETAIL<br />
2016<br />
Audited<br />
Actuals<br />
2017<br />
Amended<br />
<strong>Budget</strong><br />
<strong>2018</strong><br />
<strong>Adopted</strong><br />
<strong>Budget</strong><br />
% Change<br />
Supplies/Non-<strong>Capital</strong> Equipment<br />
Office Supplies 32,731 30,473 27,270 -10.51%<br />
<strong>Operating</strong> Supplies 1,149,610 1,326,482 1,274,287 -3.93%<br />
Non-<strong>Capital</strong> Equipment 726,732 598,023 609,993 2.00%<br />
Uniforms/Safety Equipment 183,765 155,549 167,874 7.92%<br />
Gas/Electricity 447,739 461,500 481,000 4.23%<br />
Water/Sewer 334,603 423,910 336,010 -20.74%<br />
Fuel/Propane 172,938 250,100 232,600 -7.00%<br />
Total Supplies/Non-<strong>Capital</strong> Equipment 3,048,118 3,246,037 3,129,034 -3.60%<br />
<strong>Capital</strong> Outlay<br />
<strong>Capital</strong> Equipment 1,958,490 2,050,279 2,423,597 18.21%<br />
<strong>Capital</strong> <strong>Improvement</strong> Projects 8,961,766 21,660,769 17,190,000 -20.64%<br />
Total <strong>Capital</strong> Outlay 10,920,256 23,711,048 19,613,597 -17.28%<br />
Debt Service<br />
Principal Payments 31,522 31,522 13,135 -58.33%<br />
Total Debt Service 31,522 31,522 13,135 -58.33%<br />
Miscellaneous Expenditures<br />
Contributions/Donations 10,275 10,800 10,800 0.00%<br />
Community Incentives 556,668 569,456 569,456 0.00%<br />
Development Rebates 2,000,000 - 165,974 100.00%<br />
Total Miscellaneous Expenditures 2,566,943 580,256 746,230 28.60%<br />
Total Expenditures $ 44,969,686 $ 59,830,403 $ 54,402,794 -9.07%<br />
39
FUND/DEPARTMENT APPROPRIATIONS<br />
Appropriations<br />
All budgeted expenditures of the organization are subject to appropriation by the governing board. Expenditure<br />
appropriations are made on an annual basis, and with the exception of those pertaining to capital expenditures, lapse<br />
at the close of the fiscal year. Appropriations for capital expenditures continue in force until expended, revised,<br />
abandoned or repealed. Adoption of the budget by City Council establishes appropriations at both the fund and<br />
department level.<br />
General<br />
Fund<br />
<strong>Capital</strong> Projects<br />
Fund Total<br />
Mayor & Council $ 398,537 $ - $ 398,537<br />
City Management 879,954 - 879,954<br />
City Attorney 538,461 - 538,461<br />
Municipal Judge 38,184 - 38,184<br />
Administrative Services 4,241,820 - 4,241,820<br />
Finance 1,693,682 800 1,694,482<br />
Community Development 2,653,286 147,630 2,800,916<br />
Parks, Trails & Recreation 7,117,962 800,000 7,917,962<br />
Police 10,940,056 - 10,940,056<br />
Public Works 8,549,287 16,390,000 24,939,287<br />
Debt Service 13,135 - 13,135<br />
Total Expenditure Appropriations: $ 37,064,364 $ 17,338,430 $ 54,402,794<br />
Expenditures by Fund<br />
General<br />
Fund<br />
68%<br />
<strong>Capital</strong> Projects Fund<br />
32%<br />
Expenditures by Department<br />
Public Works<br />
46%<br />
Police<br />
20%<br />
Parks, Trails & Recreation<br />
14%<br />
Debt Service<br />
0%<br />
Mayor & Council<br />
1%<br />
City Management<br />
2%<br />
City Attorney<br />
1%<br />
Municipal Judge<br />
0%<br />
Administrative Services<br />
8%<br />
Finance<br />
3%<br />
Community Development<br />
5%<br />
40
GENERAL FUND FINANCIAL SUMMARY<br />
2016<br />
Audited<br />
Actuals<br />
2017<br />
Amended<br />
<strong>Budget</strong><br />
<strong>2018</strong><br />
<strong>Adopted</strong><br />
<strong>Budget</strong><br />
% Change<br />
Revenue:<br />
Taxes & Assessments $ 33,606,303 $ 34,641,000 $ 35,110,000 1.35%<br />
Intergovernmental 731,505 821,886 735,028 -10.57%<br />
Licenses & Permits 1,629,321 1,755,000 1,701,000 -3.08%<br />
Charges & Fees 2,800,927 3,039,000 2,898,955 -4.61%<br />
Fines & Forfeitures 971,245 1,087,000 1,020,000 -6.16%<br />
Investment Earnings 90,650 171,000 250,000 46.20%<br />
Miscellaneous Revenue 112,925 8,000 16,500 106.25%<br />
Total Revenue 39,942,876 41,522,886 41,731,483 0.50%<br />
Expenditures:<br />
Personnel 22,559,457 23,760,018 24,057,465 1.25%<br />
Purchased Services 5,840,258 7,230,108 6,842,533 -5.36%<br />
Supplies/Non-<strong>Capital</strong> Equipment 3,034,174 3,246,037 3,129,034 -3.60%<br />
<strong>Capital</strong> Outlay 1,958,490 2,050,279 2,423,597 18.21%<br />
Debt Service 31,522 31,522 13,135 -58.33%<br />
Miscellaneous Expenditures 1,548,846 580,256 598,600 3.16%<br />
Total Expenditures 34,972,747 36,898,220 37,064,364 0.45%<br />
Excess/(Deficiency) of Revenues<br />
Over Expenditures 4,970,129 4,624,666 4,667,119 0.92%<br />
Other Financing Sources/(Uses):<br />
Transfers In/(Out) (5,065,277) (5,382,645) (4,742,119) -11.90%<br />
Sale of <strong>Capital</strong> Assets 81,281 50,000 75,000 50.00%<br />
Insurance Recovery 69,851 - - 0.00%<br />
Total Other Financing Sources/(Uses) (4,914,145) (5,332,645) (4,667,119) -12.48%<br />
Net Change In Fund Balance: 55,984 (707,979) - -100.00%<br />
Cumulative Fund Balance<br />
Beginning Fund Balance 25,618,093 25,674,077 24,966,098 -2.76%<br />
Ending Fund Balance 25,674,077 24,966,098 24,966,098 0.00%<br />
Less Restrictions, Commitments, & Assignments:<br />
3% TABOR Emergency Restriction 1,402,000 1,459,511 1,464,390 0.33%<br />
Arts/Humanities Council Restriction 86,712 81,219 81,219 0.00%<br />
Federal/State Forfeiture Restriction 225,679 - - 0.00%<br />
25% <strong>Operating</strong> Reserve Assignment 8,743,187 9,224,555 9,266,091 0.45%<br />
Development Rebate Assignment 18,344 299,544 281,200 -6.12%<br />
Unassigned Fund Balance $ 15,198,155 $ 13,901,269 $ 13,873,198 -0.20%<br />
41
GENERAL FUND FINANCIAL SUMMARY<br />
Revenues, Expenditures & Fund Balance<br />
$45,000,000<br />
$40,000,000<br />
$35,000,000<br />
$30,000,000<br />
$25,000,000<br />
$20,000,000<br />
$15,000,000<br />
$10,000,000<br />
$5,000,000<br />
$-<br />
2016<br />
Audited<br />
Actuals<br />
2017<br />
Amended<br />
<strong>Budget</strong><br />
<strong>2018</strong><br />
<strong>Adopted</strong><br />
<strong>Budget</strong><br />
Total Revenue Total Expenditures Ending Fund Balance<br />
Total Revenue by Category<br />
Taxes &<br />
Assessments<br />
84%<br />
Intergovernmental<br />
2%<br />
Licenses & Permits<br />
4%<br />
Charges & Fees<br />
7%<br />
Fines & Forfeitures<br />
2%<br />
Miscellaneous<br />
Revenue<br />
0%<br />
Investment Earnings<br />
1%<br />
Total Expenditures by Category<br />
Personnel<br />
65%<br />
Purchased Services<br />
18%<br />
Supplies/Non-<strong>Capital</strong><br />
Equipment<br />
8%<br />
<strong>Capital</strong> Outlay<br />
7%<br />
Debt Service<br />
0%<br />
Miscellaneous<br />
Expenditures<br />
2%<br />
42
GENERAL FUND REVENUE DETAIL<br />
2016<br />
Audited<br />
Actuals<br />
2017<br />
Amended<br />
<strong>Budget</strong><br />
<strong>2018</strong><br />
<strong>Adopted</strong><br />
<strong>Budget</strong><br />
% Change<br />
Taxes & Assessments<br />
Property Tax $ 2,839,953 $ 2,967,000 $ 3,400,000 14.59%<br />
Specific Ownership Tax 220,803 231,000 235,000 1.73%<br />
Sales Tax 24,651,353 25,277,000 25,350,000 0.29%<br />
Use Tax 3,110,696 3,223,000 3,250,000 0.84%<br />
Lodging Tax 1,616,864 1,718,000 1,650,000 -3.96%<br />
Audit & Compliance 1,166,634 1,225,000 1,225,000 0.00%<br />
Total Taxes & Assessments 33,606,303 34,641,000 35,110,000 1.35%<br />
Intergovernmental<br />
Tobacco Tax 109,499 109,000 105,000 -3.67%<br />
Mineral Lease/Severance Tax 7,613 15,000 7,500 -50.00%<br />
District Court Proceeds 23,201 35,000 30,000 -14.29%<br />
State/Federal Forfeitures 9,926 - - 0.00%<br />
Intergovernmental Agreements 436,295 476,909 476,909 0.00%<br />
Grant Proceeds 144,971 185,977 115,619 -37.83%<br />
Total Intergovernmental 731,505 821,886 735,028 -10.57%<br />
Licenses & Permits<br />
Business Licenses 15,750 15,000 15,000 0.00%<br />
Liquor Licenses 37,808 30,000 30,000 0.00%<br />
Contractor Licenses 111,900 108,000 115,000 6.48%<br />
Building Permits 1,297,150 1,461,000 1,375,000 -5.89%<br />
Park Use Permits 39,610 40,000 40,000 0.00%<br />
Guard/Merchant Patrol Licenses 1,000 1,000 1,000 0.00%<br />
Right-Of-Way Permits 126,103 100,000 125,000 25.00%<br />
Total Licenses & Permits 1,629,321 1,755,000 1,701,000 -3.08%<br />
Charges & Fees<br />
Administrative Fees 3,996 4,000 4,000 0.00%<br />
Plan Review Fees 500,372 604,000 359,000 -40.56%<br />
Zoning & Subdivision Fees 16,850 23,000 20,000 -13.04%<br />
Elevator Inspection Fees 120,820 170,000 183,455 7.91%<br />
Rental/Lease Proceeds 38,527 39,000 40,000 2.56%<br />
Participant Fees 163,200 150,000 160,000 6.67%<br />
Franchise Fees 1,642,962 1,613,000 1,700,000 5.39%<br />
Overtime Service Fees 5,445 10,000 5,000 -50.00%<br />
Extra Duty Service Fees 299,305 415,000 415,000 0.00%<br />
Fingerprinting Fees 6,445 6,000 7,500 25.00%<br />
Sale of Goods 2,973 5,000 5,000 0.00%<br />
Documents/Media 32 - - 0.00%<br />
Total Charges & Fees 2,800,927 3,039,000 2,898,955 -4.61%<br />
43
GENERAL FUND REVENUE DETAIL<br />
2016<br />
Audited<br />
Actuals<br />
2017<br />
Amended<br />
<strong>Budget</strong><br />
<strong>2018</strong><br />
<strong>Adopted</strong><br />
<strong>Budget</strong><br />
% Change<br />
Fines & Forfeitures<br />
Court Costs 92,743 88,000 95,000 7.95%<br />
Court Fines 466,280 474,000 475,000 0.21%<br />
Photo Red Light Fines 412,222 525,000 450,000 -14.29%<br />
Total Fines & Forfeitures 971,245 1,087,000 1,020,000 -6.16%<br />
Investment Earnings<br />
Investment Earnings 90,650 171,000 250,000 46.20%<br />
Total Investment Earnings 90,650 171,000 250,000 46.20%<br />
Miscellaneous Revenue<br />
Miscellaneous Revenue 49,889 - - 0.00%<br />
Contributions & Donations 63,036 8,000 16,500 106.25%<br />
Total Miscellaneous Revenue 112,925 8,000 16,500 106.25%<br />
Total Revenues $ 39,942,876 $ 41,522,886 $ 41,731,483 0.50%<br />
44
GENERAL FUND EXPENDITURE DETAIL<br />
2016<br />
Audited<br />
Actuals<br />
2017<br />
Amended<br />
<strong>Budget</strong><br />
<strong>2018</strong><br />
<strong>Adopted</strong><br />
<strong>Budget</strong><br />
% Change<br />
Personnel<br />
Regular Wages $ 16,054,209 $ 16,836,049 $ 17,492,436 3.90%<br />
Seasonal/Temporary Wages 158,999 173,725 186,661 7.45%<br />
Longevity Service Award 147,520 163,694 160,549 -1.92%<br />
Rate/Shift Differential 25,369 33,000 23,000 -30.30%<br />
Extra Duty Assignment 400,114 464,200 464,200 0.00%<br />
Overtime Wages 412,153 459,711 452,233 -1.63%<br />
Tuition Reimbursement 22,165 35,000 35,000 0.00%<br />
Clothing Allowance 20,527 21,550 22,900 6.26%<br />
Cleaning Allowance 32,402 33,000 33,500 1.52%<br />
Communication Allowance 14,050 16,860 16,800 -0.36%<br />
Vehicle Allowance 21,600 21,600 21,600 0.00%<br />
Social Security 688,527 752,129 763,074 1.46%<br />
Medicare 240,924 250,548 259,493 3.57%<br />
Workers Compensation 284,084 348,259 360,969 3.65%<br />
FPPA Death & Disability 95,013 95,422 107,036 12.17%<br />
Retirement Contributions 1,449,371 1,535,127 822,287 -46.44%<br />
Medical Insurance 2,223,996 2,239,010 2,556,631 14.19%<br />
Dental Insurance 108,642 116,229 122,643 5.52%<br />
Insurance Waivers 54,465 53,100 49,975 -5.89%<br />
Life/AD&D Insurance 56,442 60,211 56,315 -6.47%<br />
Disability Insurance 48,885 51,594 50,163 -2.77%<br />
Total Personnel 22,559,457 23,760,018 24,057,465 1.25%<br />
Purchased Services<br />
Professional Services 1,008,112 1,750,139 1,443,677 -17.51%<br />
Contracted Services 1,098,114 1,437,270 1,444,632 0.51%<br />
Catering/Dining Services 65,005 76,062 82,242 8.12%<br />
Repair/Maintenance Services 1,584,953 1,668,667 1,565,269 -6.20%<br />
Disposal/Recycling Services 812,611 805,203 813,993 1.09%<br />
Telecommunication Services 160,234 193,562 201,925 4.32%<br />
Postage/Shipping Services 71,009 69,930 71,330 2.00%<br />
Advertising/Notification Services 12,514 18,250 19,000 4.11%<br />
Printing/Publication Services 145,506 192,450 190,466 -1.03%<br />
Training/Education 294,492 376,356 363,559 -3.40%<br />
Dues/Memberships 184,602 214,137 197,681 -7.68%<br />
Mileage/Travel 12,335 7,821 7,797 -0.31%<br />
Rentals/Leases 58,160 66,556 62,620 -5.91%<br />
Insurance Premiums/Deductibles 332,505 351,955 376,592 7.00%<br />
Miscellaneous Services 106 1,750 1,750 0.00%<br />
Total Purchased Services 5,840,258 7,230,108 6,842,533 -5.36%<br />
45
GENERAL FUND EXPENDITURE DETAIL<br />
2016<br />
Audited<br />
Actuals<br />
2017<br />
Amended<br />
<strong>Budget</strong><br />
<strong>2018</strong><br />
<strong>Adopted</strong><br />
<strong>Budget</strong><br />
% Change<br />
Supplies/Non-<strong>Capital</strong> Equipment<br />
Office Supplies 32,729 30,473 27,270 -10.51%<br />
<strong>Operating</strong> Supplies 1,149,611 1,326,482 1,274,287 -3.93%<br />
Non-<strong>Capital</strong> Equipment 726,732 598,023 609,993 2.00%<br />
Uniforms/Safety Equipment 183,766 155,549 167,874 7.92%<br />
Gas/Electricity 447,739 461,500 481,000 4.23%<br />
Water/Sewer 320,659 423,910 336,010 -20.74%<br />
Fuel/Propane 172,938 250,100 232,600 -7.00%<br />
Total Supplies/Non-<strong>Capital</strong> Equipment 3,034,174 3,246,037 3,129,034 -3.60%<br />
<strong>Capital</strong> Outlay<br />
<strong>Capital</strong> Equipment 1,958,490 2,050,279 2,423,597 18.21%<br />
Total <strong>Capital</strong> Outlay 1,958,490 2,050,279 2,423,597 18.21%<br />
Debt Service<br />
Principal Payments 31,522 31,522 13,135 -58.33%<br />
Total Debt Service 31,522 31,522 13,135 -58.33%<br />
Miscellaneous Expenditures<br />
Contributions/Donations 10,275 10,800 10,800 0.00%<br />
Community Incentives 556,668 569,456 569,456 0.00%<br />
Development Rebates 981,903 - 18,344 100.00%<br />
Total Miscellaneous Expenditures 1,548,846 580,256 598,600 3.16%<br />
Total Expenditures $ 34,972,747 $ 36,898,220 $ 37,064,364 0.45%<br />
46
MAYOR & COUNCIL<br />
Description<br />
The City of Greenwood Village is a home rule community consisting of a council-manager form of government with<br />
power vested in an elected Mayor and eight-member City Council. Elected by four separate districts on a non-partisan<br />
basis, Council Members serve two-year terms. The Mayor is elected at-large every four years. The Mayor does not vote<br />
on issues or items before City Council unless there is a tie vote. Policy-making and legislative authority remain the<br />
responsibility of the City Council. The City Council may take action through ordinances, resolutions, and motions. The<br />
Mayor, with the consent of a majority of City Council, appoints the City Manager. City Council appoints the City Attorney<br />
and Municipal Judge, as well as the membership of various advisory boards and commissions. The City Council meets<br />
on the first and third Mondays of each month, at 6:00 p.m. at City Hall, 6060 South Quebec Street.<br />
Organizational Chart<br />
Residents of Greenwood Village<br />
Mayor<br />
Mayor Pro-Tem<br />
Council Members<br />
(7)<br />
Personnel & Financial Summary<br />
2016<br />
Audited<br />
Actuals<br />
2017<br />
Amended<br />
<strong>Budget</strong><br />
<strong>2018</strong><br />
<strong>Adopted</strong><br />
<strong>Budget</strong><br />
% Change<br />
Staff - Full Time Equivalency (FTE): 9.00 9.00 9.00 0.00%<br />
Expenditures By Category:<br />
Personnel $ 194,194 $ 194,510 $ 194,448 -0.03%<br />
Purchased Services 176,724 223,058 204,089 -8.50%<br />
Total Expenditures $ 370,918 $ 417,568 $ 398,537 -4.56%<br />
Expenditures & Full-Time Equivalency<br />
Expenditures<br />
$425,000<br />
$400,000<br />
$375,000<br />
$350,000<br />
$325,000<br />
$300,000<br />
2016<br />
Audited<br />
Actuals<br />
2017<br />
Amended<br />
<strong>Budget</strong><br />
<strong>2018</strong><br />
<strong>Adopted</strong><br />
<strong>Budget</strong><br />
10.00<br />
9.00<br />
8.00<br />
7.00<br />
6.00<br />
5.00<br />
4.00<br />
3.00<br />
2.00<br />
1.00<br />
-<br />
Full-Time Equivalent (FTE)<br />
Total Expenditures<br />
Staff - Full Time Equivalency (FTE):<br />
47
MAYOR & COUNCIL<br />
Expenditure Detail<br />
2016<br />
Audited<br />
Actuals<br />
2017<br />
Amended<br />
<strong>Budget</strong><br />
<strong>2018</strong><br />
<strong>Adopted</strong><br />
<strong>Budget</strong><br />
% Change<br />
Personnel<br />
Regular Wages $ 180,000 $ 180,000 $ 180,000 0.00%<br />
Social Security 10,992 11,145 11,145 0.00%<br />
Medicare 2,571 2,607 2,606 -0.04%<br />
Workers Compensation 221 270 230 -14.81%<br />
Dental Insurance 246 246 246 0.00%<br />
Life/AD&D Insurance 52 130 117 -10.00%<br />
Disability Insurance 112 112 104 -7.14%<br />
Total Personnel 194,194 194,510 194,448 -0.03%<br />
Purchased Services<br />
Professional Services 36,835 47,250 47,250 0.00%<br />
Catering/Dining Services 15,141 20,417 20,417 0.00%<br />
Telecommunication Services 629 600 600 0.00%<br />
Postage/Shipping Services 1,398 3,200 3,200 0.00%<br />
Training/Education 818 7,000 7,000 0.00%<br />
Dues/Memberships 119,779 142,924 123,955 -13.27%<br />
Mileage/Travel 2,124 1,667 1,667 0.00%<br />
Total Purchased Services 176,724 223,058 204,089 -8.50%<br />
Total Expenditures $ 370,918 $ 417,568 $ 398,537 -4.56%<br />
Variance Justification<br />
Purchased Services (-$18,969):<br />
<br />
Dues/Memberships (-$18,969): Removal of one time funding for the creation of the Highline Canal<br />
Conservancy (-$20,000) and small increases in the cost of other memberships which offset the<br />
conservancy removal<br />
48
CITY MANAGEMENT<br />
Statement of Purpose<br />
The purpose of the City Manager’s Office is to provide organizational leadership and assure quality program outcomes<br />
as authorized by the Mayor and City Council.<br />
Description<br />
The City Manager’s Office consists of City Management staff and the Community Outreach Division.<br />
The office provides staff support and a lead role in discussions regarding a number of items throughout the organization,<br />
such as economic development, maintaining superior levels of service, and development and redevelopment projects<br />
within the I-25 Corridor. The office coordinates with all departments as well as with many state and regional partners<br />
on items of common interest, such as the Colorado Municipal League (CML) and the Denver South Economic<br />
Development Partnership (DSEDP).<br />
Through the Community Outreach Program, Village values, image, and identity are presented and reinforced to<br />
residents and corporate citizens through the monthly newsletter, GVTV Channel 8, print materials, and social media.<br />
Organizational Chart<br />
City Manager<br />
Executive Assistant to<br />
the City Manager<br />
Assistant to the<br />
City Manager<br />
Communications<br />
Officer<br />
49
CITY MANAGEMENT<br />
Personnel & Financial Summary<br />
2016<br />
Audited<br />
Actuals<br />
2017<br />
Amended<br />
<strong>Budget</strong><br />
<strong>2018</strong><br />
<strong>Adopted</strong><br />
<strong>Budget</strong><br />
% Change<br />
Staff - Full Time Equivalency (FTE): 4.00 4.00 4.00 0.00%<br />
Expenditures By Category:<br />
Personnel $ 532,911 $ 517,911 $ 524,325 1.24%<br />
Purchased Services 206,827 354,201 306,474 -13.47%<br />
Supplies/Non-<strong>Capital</strong> Equipment 45,725 46,180 49,155 6.44%<br />
<strong>Capital</strong> Outlay - 60,000 - -100.00%<br />
Total Expenditures $ 785,463 $ 978,292 $ 879,954 -10.05%<br />
Expenditures By Division:<br />
City Manager's Office $ 482,868 $ 492,358 $ 500,063 1.56%<br />
Community Outreach 302,595 485,934 379,891 -21.82%<br />
Total Expenditures $ 785,463 $ 978,292 $ 879,954 -10.05%<br />
Expenditures & Full-Time Equivalency<br />
Expenditures<br />
$1,000,000<br />
$975,000<br />
$950,000<br />
$925,000<br />
$900,000<br />
$875,000<br />
$850,000<br />
$825,000<br />
$800,000<br />
$775,000<br />
$750,000<br />
$725,000<br />
$700,000<br />
2016<br />
Audited<br />
Actuals<br />
2017<br />
Amended<br />
<strong>Budget</strong><br />
<strong>2018</strong><br />
<strong>Adopted</strong><br />
<strong>Budget</strong><br />
4.50<br />
4.00<br />
3.50<br />
3.00<br />
2.50<br />
2.00<br />
1.50<br />
1.00<br />
0.50<br />
-<br />
Full-Time Equivalent (FTE)<br />
Total Expenditures<br />
Staff - Full Time Equivalency (FTE):<br />
Explanation of <strong>Budget</strong> Variances<br />
<br />
Purchased Services (-$47,727): Decline is due to the removal of one-time expenses for the purchase of new<br />
equipment and upgrades to GVTV Channel 8 from the Community Outreach Division.<br />
50
CITY MANAGEMENT<br />
Expenditure Detail<br />
2016<br />
Audited<br />
Actuals<br />
2017<br />
Amended<br />
<strong>Budget</strong><br />
<strong>2018</strong><br />
<strong>Adopted</strong><br />
<strong>Budget</strong><br />
% Change<br />
Personnel<br />
Regular Wages $ 392,996 $ 406,854 $ 423,387 4.06%<br />
Longevity Service Award 3,145 3,665 3,895 6.28%<br />
Overtime Wages 112 - - 0.00%<br />
Social Security 20,491 21,555 22,433 4.07%<br />
Medicare 5,766 5,863 6,083 3.75%<br />
Workers Compensation 480 614 550 -10.42%<br />
Retirement Contributions 51,555 32,548 17,347 -46.70%<br />
Medical Insurance 53,065 41,493 45,441 9.51%<br />
Dental Insurance 2,862 2,586 2,586 0.00%<br />
Life/AD&D Insurance 1,233 1,471 1,376 -6.46%<br />
Disability Insurance 1,206 1,262 1,227 -2.77%<br />
Total Personnel 532,911 517,911 524,325 1.24%<br />
Purchased Services<br />
Professional Services 45,215 149,000 104,553 -29.83%<br />
Contracted Services 5,709 6,500 8,400 29.23%<br />
Catering/Dining Services 1,333 16,625 16,625 0.00%<br />
Repair/Maintenance Services - 1,000 3,500 250.00%<br />
Telecommunication Services 629 496 496 0.00%<br />
Postage/Shipping Services 30,857 25,000 25,000 0.00%<br />
Printing/Publication Services 110,469 133,100 129,600 -2.63%<br />
Training/Education 4,617 15,465 11,130 -28.03%<br />
Dues/Memberships 5,767 5,915 6,070 2.62%<br />
Mileage/Travel 2,231 1,100 1,100 0.00%<br />
Total Purchased Services 206,827 354,201 306,474 -13.47%<br />
Supplies/Non-<strong>Capital</strong> Equipment<br />
Office Supplies 1,601 1,830 1,805 -1.37%<br />
<strong>Operating</strong> Supplies 991 1,000 1,000 0.00%<br />
Non-<strong>Capital</strong> Equipment 43,133 43,350 46,350 6.92%<br />
Total Supplies/Non-<strong>Capital</strong> Equipment 45,725 46,180 49,155 6.44%<br />
<strong>Capital</strong> Outlay<br />
<strong>Capital</strong> Equipment - 60,000 - -100.00%<br />
Total <strong>Capital</strong> Outlay - 60,000 - -100.00%<br />
Total Expenditures $ 785,463 $ 978,292 $ 879,954 -10.05%<br />
51
CITY MANAGER’S OFFICE<br />
Statement of Purpose<br />
The purpose of the City Manager’s Office is to provide organizational leadership and assure quality program outcomes<br />
as authorized by the Mayor and City Council.<br />
Description<br />
The City Manager’s office provides staff support and a lead role in discussions regarding a number of items throughout<br />
the organization, such as economic development, maintaining superior levels of service, and development and<br />
redevelopment projects within the I-25 Corridor. The office coordinates with all departments as well as with many state<br />
and regional partners on items of common interest, such as the Colorado Municipal League (CML) and the Denver<br />
South Economic Development Partnership (DSEDP).<br />
Accomplishments<br />
In 2017, the City Manager’s Office finalized negotiations with Comcast to renew our long-term franchise agreement for<br />
them to continue offering cable services for our citizens. Staff provided support to large projects, such as the Arapahoe<br />
and I/25 interchange, which included working with businesses to resolve impacts from construction with city departments<br />
and other agencies. Additionally, the City Manager’s Office coordinated with regional partners on issues of common<br />
concern, such as the installation of small cell wireless infrastructure throughout the region and subsequent efforts with<br />
the Colorado Municipal League to make the language in legislation on the topic more amenable for local governments.<br />
Additionally, staff also worked with city departments on a new design for our city webpage, which was also launched in<br />
2017. Community Outreach staff also lead an involved effort with multiple departments to write a special edition<br />
newsletter dedicated to the proposed redevelopment at Orchard and I/25, as well as other staff scheduling and<br />
facilitating public meetings in each district on the issue to openly share information and get input from our citizens.<br />
Goals/Objectives<br />
In <strong>2018</strong>, the City Manager’s Office will continue to work on regional issues, economic development initiatives,<br />
redevelopment and development opportunities in the Village and furthering the organization’s ability to deliver desired<br />
outcomes.<br />
Outcome Measures<br />
2015<br />
Actual<br />
2016<br />
Actual<br />
2017<br />
Estimate<br />
Percent of citizens rating Greenwood Village quality of life as Good or<br />
Excellent as measured by Village Citizen Survey.<br />
N/A N/A N/A 98<br />
Percent of performance expectations achieved by Village departments. N/A 70 80<br />
Service Level Indicators<br />
2015<br />
Actual<br />
2016<br />
Actual<br />
2017<br />
Estimate<br />
Number of employees (FTE). 4 4 4<br />
Number of Village departments. 7 7 7<br />
Percentage of Village Citizen Surveys received. N/A 26% N/A<br />
Number of ordinances and resolutions approved by City Council. 40 60 30<br />
<strong>2018</strong><br />
Target<br />
52
CITY MANAGER’S OFFICE<br />
Expenditure Detail<br />
2016<br />
Audited<br />
Actuals<br />
2017<br />
Amended<br />
<strong>Budget</strong><br />
<strong>2018</strong><br />
<strong>Adopted</strong><br />
<strong>Budget</strong><br />
% Change<br />
Personnel<br />
Regular Wages $ 311,543 $ 319,793 $ 335,711 4.98%<br />
Longevity Service Award 1,760 2,215 2,395 8.13%<br />
Overtime Wages 112 - - 0.00%<br />
Social Security 15,527 16,251 17,144 5.50%<br />
Medicare 4,605 4,622 4,846 4.85%<br />
Workers Compensation 381 482 435 -9.75%<br />
Retirement Contributions 45,064 25,583 13,755 -46.23%<br />
Medical Insurance 36,955 26,279 28,754 9.42%<br />
Dental Insurance 2,044 1,768 1,768 0.00%<br />
Life/AD&D Insurance 951 1,157 1,091 -5.70%<br />
Disability Insurance 956 992 973 -1.92%<br />
Total Personnel 419,898 399,142 406,872 1.94%<br />
Purchased Services<br />
Professional Services 9,004 11,000 11,000 0.00%<br />
Catering/Dining Services 1,333 16,625 16,625 0.00%<br />
Telecommunication Services 629 496 496 0.00%<br />
Printing/Publication Services - 6,500 7,000 7.69%<br />
Training/Education 2,166 9,180 7,680 -16.34%<br />
Dues/Memberships 3,375 3,935 3,935 0.00%<br />
Mileage/Travel 2,004 800 800 0.00%<br />
Total Purchased Services 18,511 48,536 47,536 -2.06%<br />
Supplies/Non-<strong>Capital</strong> Equipment<br />
Office Supplies 1,326 1,330 1,305 -1.88%<br />
Non-<strong>Capital</strong> Equipment 43,133 43,350 44,350 2.31%<br />
Total Supplies/Non-<strong>Capital</strong> Equipment 44,459 44,680 45,655 2.18%<br />
Total Expenditures $ 482,868 $ 492,358 $ 500,063 1.56%<br />
Variance Justification<br />
<br />
No notable variances<br />
53
COMMUNITY OUTREACH<br />
Statement of Purpose<br />
The purpose of the Community Outreach Program is to educate, inform, and engage citizens of Village outcomes and<br />
foster relationships with residents and members of the business community.<br />
Description<br />
Community values, image, and identity are presented and reinforced to residents and corporate and retail citizens<br />
through the Community Outreach Program. The current program includes the production of a monthly<br />
newsletter/magazine; video production programs and bulletin board announcements on GVTV 8; utilization of social<br />
media tools such as Facebook, Instagram, LinkedIn, Next Door, Twitter, YouTube; content oversight of the Village<br />
Website; and implementation of Village branding guidelines in all Village and department publications.<br />
Accomplishments<br />
In 2017, staff continued the delivery of high quality tactics as part of the Village’s Community Outreach efforts to provide<br />
multiple opportunities for citizens to learn about their local government and become better informed about Village<br />
happenings.<br />
In addition to the continued production of the top-rated communication resource by residents, the Greenwood Village<br />
Newsletter, new video programs for GVTV 8 and the Village’s YouTube channel were produced to capture more viewers.<br />
Staff heightened its presence on social media by activating the use of additional social media sites of Instagram,<br />
LinkedIn, and Twitter.<br />
An overall Social Media Strategy was approved by City Council to expand the Village’s Social Media Program. Further,<br />
a Communications Strategy was implemented with departments to coordinate, clarify and ensure the continuity of<br />
messaging in all communication channels. The Strategy will assist departments in using the communications channels<br />
effectively, based on guidelines established by the City Manager’s Office.<br />
A new playback system was implemented for GVTV 8. The new playback system will allow all Village videos to stream<br />
in high definition (HD) format, have a web-interface control to live stream to the Website, and include a bulletin board<br />
component that has modern graphics.<br />
Lastly, as part of the Village’s branding program, a Park Permit/Reservation brochure was developed along with a<br />
Homeowner’s Association Guide. A new presentation folder was also developed.<br />
Goals/Objectives<br />
In <strong>2018</strong>, staff will continue to focus on improving the quality of the information delivered by the Community Outreach<br />
Program and make modifications as necessary based on results of the <strong>2018</strong> Citizen Survey. Work will commence with<br />
departments to continue “branding” department brochures; continued implementation of a new playback and bulletin<br />
board system for GVTV 8; and continued enhancement of the Village’s presence on social media, in coordination with<br />
departments.<br />
54
COMMUNITY OUTREACH<br />
Outcome Measures<br />
Percent of citizens who indicate a good understanding of Village<br />
outcomes as a result of the program as measured by Village Citizen<br />
Survey.<br />
Percent citizen satisfaction with being informed about issues and values<br />
as measured by Village Citizen Survey.<br />
Percent of citizens who indicate they learned something new about their<br />
community or neighborhood as a result of the Village’s Community<br />
Outreach Program.<br />
Percent of citizens who have a high degree of confidence and trust in<br />
Village government.<br />
Percent of citizens who use the Village Website as a source to stay<br />
informed about the Village.<br />
* Citizen Survey not conducted during these years.<br />
2015<br />
Actual<br />
2016<br />
Actual<br />
2017<br />
Estimate<br />
<strong>2018</strong><br />
Target<br />
NA* NA* NA* >80<br />
NA* NA* NA* >85<br />
NA* NA* NA* NA*<br />
NA* NA* NA* >82<br />
NA* NA* NA* >55<br />
Service Level Indicators<br />
2015<br />
Actual<br />
2016<br />
Actual<br />
2017<br />
Estimate<br />
Total number of programs produced for GVTV Channel 8. 25 25 25<br />
Total number of copies of the Greenwood Village Newsletter distributed<br />
monthly.<br />
8,700 8,700 8,700<br />
Number of press releases produced and distributed annually. 5 5 5<br />
Number of production hours for GVTV Channel 8 programming. 3,000 3,500 3,500<br />
Number of followers on Facebook. 1,600 1,630 6,000<br />
Total Number of Video Views on YouTube. 30,000 45,481 65,000<br />
Number of Website visits. 260,000 282,000 285,000<br />
Number of Website page views. 534,000 510,000 510,000<br />
55
COMMUNITY OUTREACH<br />
Expenditure Detail<br />
2016<br />
Audited<br />
Actuals<br />
2017<br />
Amended<br />
<strong>Budget</strong><br />
<strong>2018</strong><br />
<strong>Adopted</strong><br />
<strong>Budget</strong><br />
% Change<br />
Personnel<br />
Regular Wages $ 81,453 $ 87,061 $ 87,676 0.71%<br />
Longevity Service Award 1,385 1,450 1,500 3.45%<br />
Social Security 4,964 5,304 5,289 -0.28%<br />
Medicare 1,161 1,241 1,237 -0.32%<br />
Workers Compensation 99 132 115 -12.88%<br />
Retirement Contributions 6,491 6,965 3,592 -48.43%<br />
Medical Insurance 16,110 15,214 16,687 9.68%<br />
Dental Insurance 818 818 818 0.00%<br />
Life/AD&D Insurance 282 314 285 -9.24%<br />
Disability Insurance 250 270 254 -5.93%<br />
Total Personnel 113,013 118,769 117,453 -1.11%<br />
Purchased Services<br />
Professional Services 36,211 138,000 93,553 -32.21%<br />
Contracted Services 5,709 6,500 8,400 29.23%<br />
Repair/Maintenance Services - 1,000 3,500 250.00%<br />
Postage/Shipping Services 30,857 25,000 25,000 0.00%<br />
Printing/Publication Services 110,469 126,600 122,600 -3.16%<br />
Training/Education 2,451 6,285 3,450 -45.11%<br />
Dues/Memberships 2,392 1,980 2,135 7.83%<br />
Mileage/Travel 227 300 300 0.00%<br />
Total Purchased Services 188,316 305,665 258,938 -15.29%<br />
Supplies/Non-<strong>Capital</strong> Equipment<br />
Office Supplies 275 500 500 0.00%<br />
<strong>Operating</strong> Supplies 991 1,000 1,000 0.00%<br />
Non-<strong>Capital</strong> Equipment - - 2,000 100.00%<br />
Total Supplies/Non-<strong>Capital</strong> Equipment 1,266 1,500 3,500 133.33%<br />
<strong>Capital</strong> Outlay<br />
<strong>Capital</strong> Equipment - 60,000 - -100.00%<br />
Total <strong>Capital</strong> Outlay - 60,000 - -100.00%<br />
Total Expenditures $ 302,595 $ 485,934 $ 379,891 -21.82%<br />
Variance Justification<br />
Purchased Services (-$46,727):<br />
<br />
Professional Services (-$44,467): Removal of one-time funding for the purchase of new equipment,<br />
software, installation and upgrading of GVTV Channel 8 to HD and cost increases to other services<br />
which offset the reduction<br />
56
CITY ATTORNEY<br />
Statement of Purpose<br />
The City Attorney provides day-to-day legal advice to the Mayor, City Council, City Manager, staff, and all Boards and<br />
Commissions on ethical matters, ordinances and regulations, contracts, land use, litigation and a wide range of other<br />
legal issues including taxation, water, employment, and zoning, and is responsible for the prosecution of cases in<br />
Municipal Court.<br />
Description<br />
The City Attorney Department is comprised of two attorneys, the City Attorney and the Assistant City Attorney. The City<br />
Attorney advises the Mayor and City Council, Boards and Commissions, prepares or reviews all ordinances, resolutions<br />
and contracts, advises all departments and the City Manager, and oversees private law firms retained to assist the City<br />
with specialized legal matters.<br />
The Assistant City Attorney prosecutes traffic, zoning, tax and animal control cases and other violations of the<br />
Greenwood Village Municipal Code in Municipal Court. The Assistant City Attorney also handles liquor code<br />
enforcement before the Local Licensing Authority, serves as the Police Legal Advisor for the Greenwood Village Police<br />
Department, and is responsible for the legal training and update of police recruits and all current Police Department<br />
employees.<br />
Organizational Chart<br />
City Attorney<br />
Assistant City Attorney<br />
57
CITY ATTORNEY<br />
Personnel & Financial Summary<br />
2016<br />
Audited<br />
Actuals<br />
2017<br />
Amended<br />
<strong>Budget</strong><br />
<strong>2018</strong><br />
<strong>Adopted</strong><br />
<strong>Budget</strong><br />
% Change<br />
Staff - Full Time Equivalency (FTE): 2.00 2.00 2.00 0.00%<br />
Expenditures By Category:<br />
Personnel $ 303,969 $ 309,917 $ 321,896 3.87%<br />
Purchased Services 161,221 209,665 209,665 0.00%<br />
Supplies/Non-<strong>Capital</strong> Equipment 4,413 6,900 6,900 0.00%<br />
Total Expenditures $ 469,603 $ 526,482 $ 538,461 2.28%<br />
Expenditures & Full-Time Equivalency<br />
Expenditures<br />
$600,000<br />
$550,000<br />
$500,000<br />
$450,000<br />
$400,000<br />
$350,000<br />
2.50<br />
2.00<br />
1.50<br />
1.00<br />
0.50<br />
Full-Time Equivalent (FTE)<br />
$300,000<br />
2016<br />
Audited<br />
Actuals<br />
2017<br />
Amended<br />
<strong>Budget</strong><br />
<strong>2018</strong><br />
<strong>Adopted</strong><br />
<strong>Budget</strong><br />
-<br />
Total Expenditures<br />
Staff - Full Time Equivalency (FTE):<br />
Explanation of <strong>Budget</strong> Variances<br />
<br />
No notable variances<br />
58
CITY ATTORNEY<br />
Expenditure Detail<br />
2016<br />
Audited<br />
Actuals<br />
2017<br />
Amended<br />
<strong>Budget</strong><br />
<strong>2018</strong><br />
<strong>Adopted</strong><br />
<strong>Budget</strong><br />
% Change<br />
Personnel<br />
Regular Wages $ 236,031 $ 249,166 $ 276,839 11.11%<br />
Longevity Service Award 750 870 990 13.79%<br />
Communication Allowance 840 840 840 0.00%<br />
Vehicle Allowance 3,600 3,600 3,600 0.00%<br />
Social Security 12,432 13,356 14,364 7.55%<br />
Medicare 3,453 3,671 4,063 10.68%<br />
Workers Compensation 301 381 360 -5.51%<br />
Retirement Contributions 28,808 19,933 11,342 -43.10%<br />
Medical Insurance 15,565 15,932 6,102 -61.70%<br />
Dental Insurance 246 246 246 0.00%<br />
Insurance Waivers 250 250 1,450 480.00%<br />
Life/AD&D Insurance 931 900 898 -0.22%<br />
Disability Insurance 762 772 802 3.89%<br />
Total Personnel 303,969 309,917 321,896 3.87%<br />
Purchased Services<br />
Professional Services 154,807 200,000 200,000 0.00%<br />
Catering/Dining Services 69 - - 0.00%<br />
Postage/Shipping Services 1 - - 0.00%<br />
Training/Education 2,872 6,500 6,500 0.00%<br />
Dues/Memberships 2,735 2,865 2,865 0.00%<br />
Mileage/Travel 737 300 300 0.00%<br />
Total Purchased Services 161,221 209,665 209,665 0.00%<br />
Supplies/Non-<strong>Capital</strong> Equipment<br />
Office Supplies 4,413 6,900 6,900 0.00%<br />
Total Supplies/Non-<strong>Capital</strong> Equipment 4,413 6,900 6,900 0.00%<br />
Total Expenditures $ 469,603 $ 526,482 $ 538,461 2.28%<br />
59
60
MUNICIPAL JUDGE<br />
Personnel & Financial Summary<br />
2016<br />
Audited<br />
Actuals<br />
2017<br />
Amended<br />
<strong>Budget</strong><br />
<strong>2018</strong><br />
<strong>Adopted</strong><br />
<strong>Budget</strong><br />
% Change<br />
Staff - Full Time Equivalency (FTE): 1.00 1.00 1.00 0.00%<br />
Expenditures By Category:<br />
Personnel $ 33,360 $ 34,597 $ 37,184 7.48%<br />
Purchased Services - 1,000 1,000 0.00%<br />
Supplies/Non-<strong>Capital</strong> Equipment 216 - - 0.00%<br />
Total Expenditures $ 33,576 $ 35,597 $ 38,184 7.27%<br />
Expenditures & Full-Time Equivalency<br />
Expenditures<br />
$50,000<br />
$40,000<br />
$30,000<br />
$20,000<br />
$10,000<br />
$-<br />
2016<br />
Audited<br />
Actuals<br />
2017<br />
Amended<br />
<strong>Budget</strong><br />
<strong>2018</strong><br />
<strong>Adopted</strong><br />
<strong>Budget</strong><br />
1.20<br />
1.00<br />
0.80<br />
0.60<br />
0.40<br />
0.20<br />
-<br />
Full-Time Equivalent (FTE)<br />
Total Expenditures<br />
Staff - Full Time Equivalency (FTE):<br />
61
MUNICIPAL JUDGE<br />
Expenditure Detail<br />
2016<br />
Audited<br />
Actuals<br />
2017<br />
Amended<br />
<strong>Budget</strong><br />
<strong>2018</strong><br />
<strong>Adopted</strong><br />
<strong>Budget</strong><br />
% Change<br />
Personnel<br />
Regular Wages $ 30,953 $ 32,094 $ 34,501 7.50%<br />
Social Security 1,919 1,990 2,139 7.49%<br />
Medicare 449 465 500 7.53%<br />
Workers Compensation 39 48 44 -8.33%<br />
Total Personnel 33,360 34,597 37,184 7.48%<br />
Purchased Services<br />
Training/Education - 1,000 1,000 0.00%<br />
Total Purchased Services - 1,000 1,000 0.00%<br />
Supplies/Non-<strong>Capital</strong> Equipment<br />
<strong>Operating</strong> Supplies 216 - - 0.00%<br />
Total Supplies/Non-<strong>Capital</strong> Equipment 216 - - 0.00%<br />
Total Expenditures $ 33,576 $ 35,597 $ 38,184 7.27%<br />
Variance Justification<br />
<br />
No notable variances<br />
62
ADMINISTRATIVE SERVICES<br />
Statement of Purpose<br />
The Administrative Services Department contributes to successful Village outcomes by providing reliable information,<br />
services, and resources in an accurate and timely manner.<br />
Description<br />
The Administrative Services Department is comprised of five program areas. These program areas include<br />
Administration, Information Management Services, Municipal Court Services, Human Resource Services, and Shared<br />
Technology Services.<br />
The Administration Program assures high quality department outcomes.<br />
The Information Management Services Program collects, manages, and disseminates reliable information in a timely<br />
manner. The City Clerk, who manages this program, is the custodian of the Village’s official records and thus is<br />
responsible for preserving and maintaining documents while ensuring information availability.<br />
The Municipal Court Services Program assures the proper administration of the judicial process. This includes managing<br />
all activities related to the Village Court system.<br />
The Human Resource Services Program supports and contributes to creating and sustaining high performing work<br />
teams committed to achieving organizational outcomes. This includes a variety of human resources and risk<br />
management activities.<br />
The Shared Technology Services Program provides reliable and purposeful information technology services to<br />
contribute to achieving organizational outcomes.<br />
Organizational Chart<br />
Director of<br />
Administrative<br />
Services<br />
City Clerk<br />
Court Administrator<br />
Human Resources<br />
/Risk Manager<br />
Chief Technology<br />
Officer<br />
Deputy City Clerk<br />
Court Clerk (2)<br />
Human Resources<br />
Analyst<br />
Technology<br />
Operations<br />
Supervisor<br />
Data Services<br />
Supervisor<br />
Licensing Specialist<br />
Administrative<br />
Assistant (3)<br />
Service Desk<br />
Analyst<br />
ERP Systems<br />
Analyst<br />
Service Desk<br />
Technician<br />
Online Services<br />
Analyst<br />
GIS Coordinator<br />
63
ADMINISTRATIVE SERVICES<br />
Personnel & Financial Summary<br />
2016<br />
Audited<br />
Actuals<br />
2017<br />
Amended<br />
<strong>Budget</strong><br />
<strong>2018</strong><br />
<strong>Adopted</strong><br />
<strong>Budget</strong><br />
% Change<br />
Staff - Full Time Equivalency (FTE): 20.00 20.00 20.00 0.00%<br />
Expenditures By Category:<br />
Personnel $ 1,782,606 $ 1,878,628 $ 1,943,109 3.43%<br />
Purchased Services 1,185,357 1,384,558 1,314,780 -5.04%<br />
Supplies/Non-<strong>Capital</strong> Equipment 226,582 202,060 280,332 38.74%<br />
<strong>Capital</strong> Outlay 163,253 152,900 703,599 360.17%<br />
Total Expenditures $ 3,357,798 $ 3,618,146 $ 4,241,820 17.24%<br />
Expenditures By Division:<br />
Administration $ 180,037 $ 181,074 $ 185,272 2.32%<br />
Information Management Services 243,401 313,728 283,360 -9.68%<br />
Municipal Court Services 233,623 238,183 239,500 0.55%<br />
Human Resource Services 801,529 861,966 916,831 6.37%<br />
Shared Technology Services 1,899,208 2,023,195 2,616,857 29.34%<br />
Total Expenditures $ 3,357,798 $ 3,618,146 $ 4,241,820 17.24%<br />
Expenditures & Full-Time Equivalency<br />
Expenditures<br />
$4,500,000<br />
$4,000,000<br />
$3,500,000<br />
$3,000,000<br />
$2,500,000<br />
$2,000,000<br />
$1,500,000<br />
$1,000,000<br />
$500,000<br />
$-<br />
2016<br />
Audited<br />
Actuals<br />
2017<br />
Amended<br />
<strong>Budget</strong><br />
<strong>2018</strong><br />
<strong>Adopted</strong><br />
<strong>Budget</strong><br />
20.50<br />
20.00<br />
19.50<br />
19.00<br />
18.50<br />
18.00<br />
17.50<br />
17.00<br />
16.50<br />
16.00<br />
15.50<br />
15.00<br />
Full-Time Equivalent (FTE)<br />
Total Expenditures<br />
Staff - Full Time Equivalency (FTE):<br />
64
ADMINISTRATIVE SERVICES<br />
Expenditure Detail<br />
2016<br />
Audited<br />
Actuals<br />
2017<br />
Amended<br />
<strong>Budget</strong><br />
<strong>2018</strong><br />
<strong>Adopted</strong><br />
<strong>Budget</strong><br />
% Change<br />
Personnel<br />
Regular Wages $ 1,352,008 $ 1,416,291 $ 1,468,536 3.69%<br />
Longevity Service Award 9,080 10,115 10,070 -0.44%<br />
Overtime Wages 1,155 3,240 2,363 -27.07%<br />
Tuition Reimbursement 22,165 35,000 35,000 0.00%<br />
Communication Allowance 2,940 3,360 2,940 -12.50%<br />
Vehicle Allowance 3,600 3,600 3,600 0.00%<br />
Social Security 81,257 86,053 88,324 2.64%<br />
Medicare 19,250 20,493 20,924 2.10%<br />
Workers Compensation 1,713 2,162 3,725 72.29%<br />
Retirement Contributions 84,438 96,814 52,600 -45.67%<br />
Medical Insurance 179,978 174,988 230,479 31.71%<br />
Dental Insurance 9,976 10,492 11,407 8.72%<br />
Insurance Waivers 6,162 6,500 4,100 -36.92%<br />
Life/AD&D Insurance 4,739 5,128 4,783 -6.73%<br />
Disability Insurance 4,145 4,392 4,258 -3.05%<br />
Total Personnel 1,782,606 1,878,628 1,943,109 3.43%<br />
Purchased Services<br />
Professional Services 60,918 87,061 79,636 -8.53%<br />
Contracted Services 22,762 67,093 40,393 -39.80%<br />
Catering/Dining Services 13,432 11,600 12,000 3.45%<br />
Repair/Maintenance Services 555,531 658,070 607,562 -7.68%<br />
Telecommunication Services 111,176 95,053 88,988 -6.38%<br />
Postage/Shipping Services 913 1,280 1,280 0.00%<br />
Advertising/Notification Services 11,794 14,000 14,000 0.00%<br />
Printing/Publication Services 3,227 8,460 9,161 8.29%<br />
Training/Education 54,619 74,156 69,052 -6.88%<br />
Dues/Memberships 17,158 15,318 16,016 4.56%<br />
Mileage/Travel 1,225 512 100 -80.47%<br />
Rentals/Leases 97 - - 0.00%<br />
Insurance Premiums/Deductibles 332,505 351,955 376,592 7.00%<br />
Total Purchased Services 1,185,357 1,384,558 1,314,780 -5.04%<br />
Supplies/Non-<strong>Capital</strong> Equipment<br />
Office Supplies 2,197 3,413 2,900 -15.03%<br />
<strong>Operating</strong> Supplies 11,344 19,000 19,100 0.53%<br />
Non-<strong>Capital</strong> Equipment 213,041 179,647 258,332 43.80%<br />
Total Supplies/Non-<strong>Capital</strong> Equipment 226,582 202,060 280,332 38.74%<br />
<strong>Capital</strong> Outlay<br />
<strong>Capital</strong> Equipment 163,253 152,900 703,599 360.17%<br />
Total <strong>Capital</strong> Outlay 163,253 152,900 703,599 360.17%<br />
Total Expenditures $ 3,357,798 $ 3,618,146 $ 4,241,820 17.24%<br />
Explanation of <strong>Budget</strong> Variances<br />
The Administrative Services Department <strong>2018</strong> budget represents an increase of 17.24 percent over 2017, for a total of<br />
$623,674, of which $64,481 is an increase in personnel costs. The majority of this increase, a total of $550,699, can<br />
be attributed to the addition of new capital technology throughout the Village. The Police Department will be<br />
implementing a new records management system, which is currently expected to cost $434,430. Additional capital<br />
upgrades include a new revenue management system for collection and processing of Village taxes, a new backup<br />
system for increased security of Village records, a new Keri door system securing all Village facilities, and the final<br />
phase of conference room technology upgrades result in a total of $182,469. The addition of non-capital equipment,<br />
including the replacement of the Brazos handheld devices in the Police Department, result in an increase of $66,034.<br />
65
ADMINISTRATION<br />
Statement of Purpose<br />
The Administration Program assures high quality department outcomes.<br />
Description<br />
The Administration Program assures high quality department outcomes by developing plans, initiating action, and<br />
maintaining programs consistent with department goals and objectives. This program is also responsible for managing<br />
finances, information, and human resources within the department. Evaluating the overall effectiveness of programs<br />
and developing strategies for continuous improvement are important aspects of the Administration Program.<br />
Accomplishments<br />
In 2017, the Administrative Services Department focused on several improvements positively impacting service delivery<br />
in multiple areas. Electronic documents were created in the Municipal Court that are saved in an electronic file cabinet<br />
eliminating time, effort, and physical resources; court staff reassigned court appearance times resulting in decreased<br />
wait times for customers; strategic application questions were added to job applications resulting in a reduction in time<br />
to identify the most qualified candidates for vacant positions; and online service features were added for building<br />
permitting and inspections including inspection status lookup and online payments. Internally, staff completed<br />
implementation of a new records management system allowing improvements in maintaining and accessing accurate<br />
employee files; additional training programs were implemented to assist with supervisors’ professional development;<br />
staff developed and began implementation and training of the City Hall Emergency Plan reducing employees’ exposure<br />
to hazards; and several upgrades to current software systems were completed.<br />
Staff continued with wellness and safety initiatives implementing a variety of programs to include employees,<br />
dependents, and Village residents. Staff partnered with Village departments to provide additional training opportunities<br />
to positively impact workers’ compensation rates resulting in decreased claims which reduced the net loss ratio for<br />
workers’ compensation by 7% and decreased our classification rating by 0.03 due to a continued low number of workrelated<br />
injuries/accidents.<br />
Multiple technology improvements were made including upgrades to the audio/visual system in the City Hall Community<br />
Room and City Council Chambers, and completion of the final phase of network infrastructure upgrades including the<br />
replacement of the core fiber switches that connect the three Village facilities. Evaluation and planning began to replace<br />
the current enterprise software systems over the course of the next few years.<br />
Goals/Objectives<br />
In <strong>2018</strong>, the Administration Program will continue to proactively identify areas where improvements can be made to<br />
directly impact the successful attainment of Village outcomes. Specific areas of emphasis include:<br />
<br />
<br />
<br />
Work with all Village departments to continue with strategic replacement of enterprise software systems<br />
ensuring systems continue to be integrated with one another as needed.<br />
Provide additional leadership development opportunities including implementing Village-wide management<br />
meetings to ensure organizational alignment and professional development to meet strategic goals.<br />
Evaluate effectiveness of the current employee performance evaluation process to better align goals and<br />
objectives with Village-wide strategic initiatives.<br />
Outcome Measures<br />
2015 2016 2017 <strong>2018</strong><br />
Actual Actual Estimate Target<br />
Percent of department objectives met for the year. 83 80 86 100<br />
66
ADMINISTRATION<br />
Expenditure Detail<br />
2016<br />
Audited<br />
Actuals<br />
2017<br />
Amended<br />
<strong>Budget</strong><br />
<strong>2018</strong><br />
<strong>Adopted</strong><br />
<strong>Budget</strong><br />
% Change<br />
Personnel<br />
Regular Wages $ 136,451 $ 137,642 $ 144,460 4.95%<br />
Longevity Service Award 1,150 1,215 1,275 4.94%<br />
Vehicle Allowance 3,600 3,600 3,600 0.00%<br />
Social Security 7,377 7,347 7,886 7.34%<br />
Medicare 1,968 2,025 2,112 4.30%<br />
Workers Compensation 166 213 192 -9.86%<br />
Retirement Contributions 10,875 11,011 5,919 -46.24%<br />
Medical Insurance 16,110 15,214 16,687 9.68%<br />
Dental Insurance 818 818 818 0.00%<br />
Life/AD&D Insurance 488 497 469 -5.63%<br />
Disability Insurance 420 427 419 -1.87%<br />
Total Personnel 179,423 180,009 183,837 2.13%<br />
Purchased Services<br />
Postage/Shipping Services 22 - - 0.00%<br />
Training/Education 338 875 1,250 42.86%<br />
Dues/Memberships 235 190 185 -2.63%<br />
Total Purchased Services 595 1,065 1,435 34.74%<br />
Supplies/Non-<strong>Capital</strong> Equipment<br />
Office Supplies 19 - - 0.00%<br />
Total Supplies/Non-<strong>Capital</strong> Equipment 19 - - 0.00%<br />
Total Expenditures $ 180,037 $ 181,074 $ 185,272 2.32%<br />
Variance Justification<br />
<br />
No notable variances<br />
67
INFORMATION MANAGEMENT SERVICES<br />
Statement of Purpose<br />
The Information Management Services Program collects, manages, and disseminates reliable information in a timely<br />
manner.<br />
Description<br />
The Information Management Services (IMS) Program coordinates and administers all of the Village’s general and<br />
special elections and liquor licenses throughout the Village. IMS is responsible for maintaining the legislative history of<br />
the Village, the preparation and retention of official records, and ensuring the accessibility of official Village documents.<br />
The Information Management Services’ staff maintains and provides information related to City Council including<br />
agendas and minutes of all City Council meetings and all official actions of the Village to City Council, staff, the<br />
community, and other external customers.<br />
Accomplishments<br />
In 2017, staff conducted a special mail ballot election called by City Council regarding Ordinance No. 4, Series 2017,<br />
proposing a change to the Village’s Comprehensive Plan. This election was conducted under Title 31 of the Colorado<br />
Revised Statutes, for Mail Ballot elections including the requirement to mail ballots to overseas voters. The election<br />
resulted in one of the highest voter turnouts in the Village’s history with 54% turnout. In addition, IMS conducted the<br />
Regular November Municipal election wherein candidates filled eight council seats for two-year terms of office.<br />
IMS completed implementation of the pilot records management program in the Human Resource Services. New<br />
software enabled the Village to implement a comprehensive records management program to include automated<br />
classification, retention, and destruction of records to ensure compliance with state and other regulatory agencies and<br />
to improve accessibility to information. The system allowed Human Resources to improve efficiencies in maintaining<br />
and accessing accurate employee files while automating records retention requirements. Staff planned to further<br />
implement the program to other service areas and departments in 2017. However, other time-intensive activities<br />
throughout the year delayed implementation.<br />
Goals/Objectives<br />
In <strong>2018</strong>, the program will focus on the following initiatives:<br />
●<br />
●<br />
●<br />
Implementation of the next phase of the records management program to other service areas and departments<br />
in the Village. Bringing all Village records into one system allows for comprehensive sharing of information<br />
organizationally and publicly, while adhering to the core requirements of records management principles with<br />
online classification schemes, retention schedules, public record request tracking, and archiving per the<br />
Colorado Open Records Act (CORA).<br />
Implementation of GovQA software to improve the tracking of the Public Record Requests received by the<br />
Village. This module will allow the Village to manage, review, and track record requests allowing the customers<br />
to request and have the ability to pay for services online.<br />
Implementation of BoardSync software to replace the software currently used for Boards, Commissions, and<br />
Council agenda management and packet distribution. This migration will allow the users to access information<br />
over any device and is not limited to use of iPads only. BoardSync has the capability to customize the agenda<br />
process to better meet Village needs and unique approval processes.<br />
Outcome Measures<br />
2015<br />
Actual<br />
2016<br />
Actual<br />
2017<br />
Estimate<br />
<strong>2018</strong><br />
Target<br />
Percent of respondents rating service received from the Information<br />
Management Services staff as good or excellent.<br />
98 96 98 98<br />
Percent of public records requests completed within legal requirement. 100 100 100 100<br />
Percent of information requests disseminated within established service<br />
level target.<br />
98 98 96 98<br />
68
INFORMATION MANAGEMENT SERVICES<br />
Service Level Indicators<br />
2015<br />
Actual<br />
2016<br />
Actual<br />
2017<br />
Estimate<br />
Number of Employees (FTE). 3 3 3<br />
Total Number of Meeting Minutes Prepared for the Year. 26 23 24<br />
Total Number of Liquor Documents Processed for the Year. 204 178 174<br />
Total Number of Record Requests Processed for the Year. 209 231 246<br />
Expenditure Detail<br />
2016<br />
Audited<br />
Actuals<br />
2017<br />
Amended<br />
<strong>Budget</strong><br />
<strong>2018</strong><br />
<strong>Adopted</strong><br />
<strong>Budget</strong><br />
% Change<br />
Personnel<br />
Regular Wages $ 176,175 $ 194,742 $ 201,052 3.24%<br />
Longevity Service Award 915 975 1,035 6.15%<br />
Overtime Wages 390 1,640 800 -51.22%<br />
Social Security 10,797 12,223 12,402 1.46%<br />
Medicare 2,525 2,859 2,901 1.47%<br />
Workers Compensation 238 298 260 -12.75%<br />
Retirement Contributions 10,323 12,908 6,810 -47.24%<br />
Medical Insurance 18,299 15,932 23,530 47.69%<br />
Dental Insurance 886 967 967 0.00%<br />
Insurance Waivers 500 1,200 - -100.00%<br />
Life/AD&D Insurance 615 706 655 -7.22%<br />
Disability Insurance 539 604 584 -3.31%<br />
Total Personnel 222,202 245,054 250,996 2.42%<br />
Purchased Services<br />
Professional Services 90 - - 0.00%<br />
Contracted Services 1,204 39,710 1,710 -95.69%<br />
Postage/Shipping Services 33 - - 0.00%<br />
Advertising/Notification Services 10,284 10,000 10,000 0.00%<br />
Printing/Publication Services 2,418 7,555 7,960 5.36%<br />
Training/Education 3,785 7,800 9,265 18.78%<br />
Dues/Memberships 1,700 1,455 1,470 1.03%<br />
Mileage/Travel 24 100 100 0.00%<br />
Total Purchased Services 19,538 66,620 30,505 -54.21%<br />
Supplies/Non-<strong>Capital</strong> Equipment<br />
Office Supplies 408 654 259 -60.40%<br />
<strong>Operating</strong> Supplies 1,253 1,400 1,600 14.29%<br />
Total Supplies/Non-<strong>Capital</strong> Equipment 1,661 2,054 1,859 -9.49%<br />
Total Expenditures $ 243,401 $ 313,728 $ 283,360 -9.68%<br />
Variance Justification<br />
● Purchased Services (-$38,000):<br />
●<br />
Contracted Services (-$38,000): Both a Regular Election and a Special Election were conducted in<br />
2017. No Municipal Election is scheduled for <strong>2018</strong> as elections are held on odd years unless a special<br />
election is called for by City Council.<br />
69
MUNICIPAL COURT SERVICES<br />
Statement of Purpose<br />
The Municipal Court Services Program assures the proper administration of the judicial process.<br />
Description<br />
The Municipal Court Services Program manages the operations and activities related to the Village court system. Cases<br />
processed include traffic violations, parking violations, and other criminal misdemeanor offenses such as shoplifting,<br />
theft under $2,000, curfew, assault, disturbances, harassment, and possession or consumption of alcohol by an<br />
underage person. The Municipal Court staff is responsible for processing all court cases and providing accurate<br />
information to guide customers through their court experience.<br />
Accomplishments<br />
Staff continued to utilize customer feedback to improve the online payment feature, as this is still a fairly new service.<br />
Survey results were very positive as users expressed the ease of use and convenience. Staff analyzed the physical<br />
court file with actual docket entries in the court management software in an effort to identify where additional documents<br />
could be scanned and paper copies shredded in order to improve efficiencies. A new DMV clearance document was<br />
created that could be printed from the case and saved using the electronic file cabinet. This eliminated the previous<br />
method of st<strong>amp</strong>ing and copying the paper ticket saving time and decreasing the use of physical resources.<br />
In the ever-continuing effort to improve customer service, staff monitored defendant wait times during various court<br />
sessions to identify areas of opportunity for service enhancements. Assigned court times for defendants who had to<br />
appear on their case because they failed to execute a component of their sentence were shifted to later in the evening.<br />
This allowed for an easier transition from attorney cases to defendants appearing for their initial arraignment thus<br />
improving on wait times for most customers.<br />
Tyler Incode Court software was upgraded to a version that was more compatible with Windows operating system.<br />
Goals/Objectives<br />
In <strong>2018</strong>, the program will focus on the following initiatives:<br />
<br />
<br />
Implement service enhancements made available with court management software upgrades completed in<br />
2017 to move toward a paper lite process.<br />
Evaluate several bills that were passed by the General Assembly during the 2017 legislative session that have<br />
substantial impacts to the Municipal Court. Staff will work in tandem with the Judge, Prosecutor, and Court<br />
Administrators in other similarly situated communities to develop the best procedures and practices to ensure<br />
full compliance is achieved. Subject matter from various House Bills include advisements, record sealing for<br />
adults, having appointed counsel present at initial court appearance when defendant is in custody, and<br />
requiring Municipal Courts to hold a hearing within 2 calendar days for persons in custody being held solely<br />
on the municipal warrant.<br />
Outcome Measures<br />
2015<br />
Actual<br />
2016<br />
Actual<br />
2017<br />
Estimate<br />
<strong>2018</strong><br />
Target<br />
Accuracy:<br />
Bench Warrant Accuracy – All bench warrants shall be issued and<br />
recalled with 100% accuracy.<br />
100 100 100 100<br />
Timeliness:<br />
Defendants in custody shall be brought to court in a timely manner. 100 100 100 100<br />
Quality:<br />
Percent of defendants rating Court process as Good or Excellent. 95 95 86 95<br />
70
MUNICIPAL COURT SERVICES<br />
Service Level Indicators<br />
2015<br />
Actual<br />
2016<br />
Actual<br />
2017<br />
Estimate<br />
Number of employees (FTE). 3 3 3<br />
Number of tickets received. 4,066 3,900 4,100<br />
Number of plea bargains paid online. 1,020 1,010 800<br />
Bench warrants issued/processed. 125 165 210<br />
Fines collected from guilty defendants. $580,000 $568,000 $550,000<br />
Expenditure Detail<br />
2016<br />
Audited<br />
Actuals<br />
2017<br />
Amended<br />
<strong>Budget</strong><br />
<strong>2018</strong><br />
<strong>Adopted</strong><br />
<strong>Budget</strong><br />
% Change<br />
Personnel<br />
Regular Wages $ 168,893 $ 177,573 $ 182,693 2.88%<br />
Longevity Service Award 1,365 1,485 1,605 8.08%<br />
Overtime Wages 23 500 463 -7.40%<br />
Social Security 10,281 11,146 11,412 2.39%<br />
Medicare 2,404 2,607 2,669 2.38%<br />
Workers Compensation 217 274 241 -12.04%<br />
Retirement Contributions 9,288 13,016 6,860 -47.30%<br />
Medical Insurance 16,110 15,214 16,687 9.68%<br />
Dental Insurance 818 818 818 0.00%<br />
Insurance Waivers 2,779 2,900 2,900 0.00%<br />
Life/AD&D Insurance 634 643 596 -7.31%<br />
Disability Insurance 518 551 530 -3.81%<br />
Total Personnel 213,330 226,727 227,474 0.33%<br />
Purchased Services<br />
Professional Services 14,316 4,456 5,094 14.32%<br />
Catering/Dining Services 48 200 200 0.00%<br />
Postage/Shipping Services 703 530 530 0.00%<br />
Printing/Publication Services 809 905 1,201 32.71%<br />
Training/Education 1,357 3,245 2,925 -9.86%<br />
Dues/Memberships 175 185 185 0.00%<br />
Mileage/Travel 1,137 86 - -100.00%<br />
Total Purchased Services 18,545 9,607 10,135 5.50%<br />
Supplies/Non-<strong>Capital</strong> Equipment<br />
Office Supplies 1,748 1,849 1,891 2.27%<br />
Total Supplies/Non-<strong>Capital</strong> Equipment 1,748 1,849 1,891 2.27%<br />
Total Expenditures $ 233,623 $ 238,183 $ 239,500 0.55%<br />
Variance Justification<br />
<br />
No notable variances<br />
71
HUMAN RESOURCE SERVICES<br />
Statement of Purpose<br />
The Human Resource Services Program supports and contributes to creating and sustaining high performing work<br />
teams committed to achieving organizational outcomes.<br />
Description<br />
The Human Resource Services Program provides information and assistance regarding a variety of human resources<br />
and risk management activities. Human Resources’ staff is responsible for administering personnel policies; analyzing,<br />
recommending, and administering appropriate compensation and benefit programs; providing guidance regarding<br />
employee relations issues; and providing assistance with recruitment and retention activities. In addition, the Human<br />
Resource Services Program administers the loss control, workers’ compensation, and safety programs; manages the<br />
Village’s liability claims; and coordinates employee training and wellness programs.<br />
Accomplishments<br />
In 2017, Human Resources (HR) implemented several improvements positively impacting service delivery. Staff<br />
implemented a new procedure to streamline and expedite the hiring process by utilizing strategic application questions<br />
allowing the most qualified candidates to be identified expeditiously. These efforts reduced the selection process review<br />
time by several days. Additional training programs were implemented to assist with supervisors’ professional<br />
development including harassment training that required interactive scenarios to prepare managers for the sensitive<br />
conversations that are required in these situations. A new training guidebook was created for supervisors providing<br />
specific policy, procedure, and legal requirements to provide supervisors with an easy-to-use desk reference. Staff fully<br />
implemented new records management software providing improved processes in maintaining and accessing accurate<br />
employee files while automating records retention requirements. Staff developed and began implementation and<br />
training of the City Hall Emergency Plan that provides for the safety of our employees in emergency situations reducing<br />
employees’ exposure to hazards.<br />
In addition, staff continued with wellness and safety initiatives as part of the risk management program. Staff<br />
implemented impactful wellness programs designed to keep overall health and wellness in the forefront of employees’<br />
minds and provided the Weigh and Win program that allowed for inclusion of dependents and Village residents. This<br />
year-round program benefited employees with a variety of information and motivation while providing reward incentives.<br />
Staff partnered with Village departments to provide additional training opportunities to positively impact workers’<br />
compensation rates and general liability exposure. These efforts resulted in a reduction in claims, a 7% reduction to<br />
the net loss ratio for workers’ compensation, and a decrease of 0.03 in our classification rating due to a continued low<br />
number of work-related injuries/accidents. Staff identified an electronic delivery system for all safety measures<br />
including, but not limited to, training, audits, and safety manual information. Staff continued its efforts in updating the<br />
Safety Manual by reviewing State and Federal laws, along with OSHA requirements which will be implemented in an<br />
updated electronic manual to be published in <strong>2018</strong>.<br />
Goals/Objectives<br />
In <strong>2018</strong>, the program will focus on the following initiatives:<br />
<br />
<br />
<br />
<br />
<br />
<br />
Continue the development of our robust applicant system to identify new and innovative ways to attract qualified<br />
candidates for the Village utilizing new technologies.<br />
Evaluation will begin on the replacement of the Payroll and Human Resource Information Systems in<br />
partnership with Finance and Shared Technology Services.<br />
Develop and implement a “competent person” training for high risk jobs to enhance and promote safety<br />
practices in the Village.<br />
Expand wellness activities to include financial and emotional well-being initiatives.<br />
Implement continued leadership development programs to further develop employees.<br />
Implement comprehensive electronic Risk Management Center to publish and train employees on an updated<br />
safety manual, while incorporating CIRSA audit requirements and on-going safety training.<br />
72
HUMAN RESOURCE SERVICES<br />
Outcome Measures<br />
2015<br />
Actual<br />
2016<br />
Actual<br />
2017<br />
Estimate<br />
<strong>2018</strong><br />
Target<br />
Human Resources Department Assistance:<br />
Percent of respondents rating service received from the Human<br />
Resource Services’ staff as good or excellent.<br />
100 100 100 100<br />
Recruitment Assistance:<br />
Percent of respondents rating the Human Resource Services’ staff<br />
assistance with meeting the recruitment standards of the department as 100 100 100 100<br />
good or excellent.<br />
Retention Assistance:<br />
Percent of new employees achieving a successful or above rating on first<br />
year performance assessment.<br />
100 100 100 100<br />
Risk Management/Loss Control:<br />
Percent prior year Safety Committee objectives met. 97 98 98 98<br />
Percent of respondents rating service received from the Human<br />
Resource Services staff regarding handling of workers’ compensation<br />
claims as good or excellent.<br />
99 100 100 100<br />
Service Level Indicators<br />
2015<br />
Actual<br />
2016<br />
Actual<br />
2017<br />
Estimate<br />
Number of employees (FTE). 5.20 5.20 5.20<br />
Number of Village FTEs budgeted:<br />
Full time. 247 247 247<br />
Part time. 2.65 2.15 2.15<br />
Seasonal. 6.06 6.06 6.06<br />
Number of new hires processed. 52 62 64<br />
Number of applications processed. 2,200 4,856 5,208<br />
Number of injury claims processed. 25 28 30<br />
Number of vehicle/property loss claims processed. 39 32 42<br />
Number of “other” liability claims processed. 3 7 8<br />
73
HUMAN RESOURCE SERVICES<br />
Expenditure Detail<br />
2016<br />
Audited<br />
Actuals<br />
2017<br />
Amended<br />
<strong>Budget</strong><br />
<strong>2018</strong><br />
<strong>Adopted</strong><br />
<strong>Budget</strong><br />
% Change<br />
Personnel<br />
Regular Wages $ 252,254 $ 267,203 $ 278,675 4.29%<br />
Longevity Service Award 340 705 825 17.02%<br />
Overtime Wages 28 - - 0.00%<br />
Tuition Reimbursement 22,165 35,000 35,000 0.00%<br />
Social Security 15,187 16,166 16,447 1.74%<br />
Medicare 3,552 3,781 3,846 1.72%<br />
Workers Compensation 328 400 359 -10.25%<br />
Retirement Contributions 13,929 17,772 10,810 -39.17%<br />
Medical Insurance 50,197 47,078 67,488 43.35%<br />
Dental Insurance 2,184 2,260 2,832 25.31%<br />
Life/AD&D Insurance 916 968 910 -5.99%<br />
Disability Insurance 776 828 807 -2.54%<br />
Total Personnel 361,856 392,161 417,999 6.59%<br />
Purchased Services<br />
Professional Services 15,799 16,755 16,755 0.00%<br />
Contracted Services 21,558 27,383 38,683 41.27%<br />
Catering/Dining Services 13,384 11,400 11,800 3.51%<br />
Postage/Shipping Services 9 - - 0.00%<br />
Advertising/Notification Services 1,510 4,000 4,000 0.00%<br />
Training/Education 32,199 30,836 24,212 -21.48%<br />
Dues/Memberships 6,905 6,390 6,290 -1.56%<br />
Mileage/Travel 37 326 - -100.00%<br />
Rentals/Leases 97 - - 0.00%<br />
Insurance Premiums/Deductibles 332,505 351,955 376,592 7.00%<br />
Total Purchased Services 424,003 449,045 478,332 6.52%<br />
Supplies/Non-<strong>Capital</strong> Equipment<br />
Office Supplies 7 160 - -100.00%<br />
<strong>Operating</strong> Supplies 9,873 17,600 17,500 -0.57%<br />
Non-<strong>Capital</strong> Equipment - 3,000 3,000 0.00%<br />
Total Supplies/Non-<strong>Capital</strong> Equipment 9,880 20,760 20,500 -1.25%<br />
<strong>Capital</strong> Outlay<br />
<strong>Capital</strong> Equipment 5,790 - - 0.00%<br />
Total <strong>Capital</strong> Outlay 5,790 - - 0.00%<br />
Total Expenditures $ 801,529 $ 861,966 $ 916,831 6.37%<br />
Variance Justification<br />
Purchased Services (+$29,287):<br />
<br />
<br />
<br />
Contracted Services (+$11,300): Employee service awards increased based on actual number of<br />
employee awards.<br />
Training/Education (-$6,624): Elimination of Organizational Development Certification Program for<br />
Human Resources/Risk Manager.<br />
Insurance Premiums/Deductibles (+$24,637): Projected 7% increase to CIRSA general property and<br />
liability insurance due to increase properties added and property claims.<br />
74
SHARED TECHNOLOGY SERVICES<br />
Statement of Purpose<br />
The Shared Technology Services Program provides reliable and purposeful information technology services to<br />
contribute to achieving organizational outcomes.<br />
Description<br />
The Shared Technology Services (STS) Program is responsible for the delivery of services through the application,<br />
maintenance, and improvement of all computer and telephone related technology, both hardware and software, used in<br />
the Village. The services provided include data security and protection, system performance monitoring and tuning,<br />
deployment of new technology, management of licensing and maintenance, and support of all technology systems in<br />
the Village through the service desk. In addition, staff provides extensive training to employees on the use of technology<br />
in support of expected outcomes.<br />
Accomplishments<br />
In 2017, the STS team worked closely with Village departments on upgrades and updates to current software systems<br />
including Finance, Tax, and Community Development. The team continued work on implementation of online services<br />
for building permitting and inspections by launching the online inspection status lookup and the anticipated completion<br />
of building permit submittal. In collaboration with the Public Works and Parks, Trails and Recreation departments, STS<br />
continued support for the implementation of the new asset/work order management system. Phase one of this system<br />
was completed in 2017, with expanded functionality and use coming in <strong>2018</strong>. After continued support issues with our<br />
current system software provider, Harris Software, STS has begun the process of working with departments on the<br />
evaluation and selection of new enterprise software systems to replace the Revenue Management System, the Financial<br />
Management System, the Fleet Management System, and the Payroll/HR Management System. Efforts in launching<br />
online services for the Revenue Management System have been put on hold pending the selection and implementation<br />
of a new system and will be completed as part of this software deployment. In 2017, the Police Department took sole<br />
ownership of the Emergency Command Vehicle, formerly shared between the Village and South Metro Fire, and made<br />
significant updates and improvements to the technology and communication systems contained in the vehicle. STS also<br />
completed a significant audio/visual system upgrade in the City Hall Community Room and City Council Chambers,<br />
which included the replacement of the speaker and microphone systems and upgrades to the audio recording<br />
infrastructure. Work also continued on the deployment of the electronic records management system for the Village in<br />
partnership with the City Clerk’s Office. Additionally, the final phase of the current network infrastructure upgrades were<br />
completed with the replacement of the core fiber switches that connect the three Village facilities.<br />
Goals/Objectives<br />
In <strong>2018</strong>, the program will focus on the following initiatives:<br />
<br />
<br />
<br />
<br />
<br />
<br />
<br />
Deploy phase two of asset/work order management system for use by the Public Works and Parks, Trails and<br />
Recreation departments. This will include online service requests for the departments.<br />
Implementation of asset, fleet, and work request management system in the Public Works department for the<br />
Fleet Services area.<br />
Planning and initial deployment work for the replacement of the Finance Management system.<br />
Working in conjunction with Arapahoe County and three other coalition agencies, the Village will be<br />
implementing a new Computer Aided Dispatch (CAD) system in the Police Department. This implementation<br />
will also institute the move to a new Records Management System (RMS) to facilitate the integration of CAD<br />
and RMS data and reporting.<br />
Evaluation will begin on the replacement of the Payroll and Human Resource Information Systems in<br />
partnership with Finance and Human Resources.<br />
Following the success of the online records request system in the Police Department, the same system will be<br />
implemented in the City Clerk’s Office to process and manage all Village record requests.<br />
Improve data availability and security by replacing our nine-year-old data backup system with technology<br />
designed to support the current and future data storage needs of the departments.<br />
75
SHARED TECHNOLOGY SERVICES<br />
Outcome Measures<br />
2015<br />
Actual<br />
2016<br />
Actual<br />
2017<br />
Estimate<br />
Percent of respondents who rated service received from Shared<br />
Technology Services staff as good or excellent.<br />
92.6 95 95 95<br />
Enterprise Services:<br />
Percent of time the enterprise-level applications such as Innoprise, Tyler,<br />
HTE, etc. were available.<br />
100 100 99.5 99<br />
Percent of time the Geographic Information Systems map services were<br />
available.<br />
99 100 100 90<br />
Percent of Service Desk technology support requests (both service and<br />
incident) resolved within established service level targets.<br />
87.5 90.7 95 90<br />
Communication Services:<br />
Percent of time the network communications were available. 99.9 100 100 99<br />
Percent of time the telephone communications were available. 100 100 100 99<br />
Service Level Indicators<br />
2015<br />
Actual<br />
2016<br />
Actual<br />
2017<br />
Estimate<br />
Number of employees (FTE). 8 8 8<br />
Number of telephone extensions/voice mail boxes/mobile devices<br />
maintained.<br />
Number of support incidents for telephone related questions, including<br />
mobile phones.<br />
436/391/<br />
142<br />
436/391/<br />
142<br />
436/391/<br />
142<br />
69 75 75<br />
Number of network accounts. 298 304 304<br />
Number of support incidents and service requests for all technology<br />
systems.<br />
1,788 1,621 1,700<br />
<strong>2018</strong><br />
Target<br />
76
SHARED TECHNOLOGY SERVICES<br />
Expenditure Detail<br />
2016<br />
Audited<br />
Actuals<br />
2017<br />
Amended<br />
<strong>Budget</strong><br />
<strong>2018</strong><br />
<strong>Adopted</strong><br />
<strong>Budget</strong><br />
% Change<br />
Personnel<br />
Regular Wages $ 618,235 $ 639,131 $ 661,656 3.52%<br />
Longevity Service Award 5,310 5,735 5,330 -7.06%<br />
Overtime Wages 714 1,100 1,100 0.00%<br />
Communication Allowance 2,940 3,360 2,940 -12.50%<br />
Social Security 37,615 39,171 40,177 2.57%<br />
Medicare 8,801 9,221 9,396 1.90%<br />
Workers Compensation 764 977 2,673 173.59%<br />
Retirement Contributions 40,023 42,107 22,201 -47.27%<br />
Medical Insurance 79,262 81,550 106,087 30.09%<br />
Dental Insurance 5,270 5,629 5,972 6.09%<br />
Insurance Waivers 2,883 2,400 1,200 -50.00%<br />
Life/AD&D Insurance 2,086 2,314 2,153 -6.96%<br />
Disability Insurance 1,892 1,982 1,918 -3.23%<br />
Total Personnel 805,795 834,677 862,803 3.37%<br />
Purchased Services<br />
Professional Services 30,713 65,850 57,787 -12.24%<br />
Repair/Maintenance Services 555,531 658,070 607,562 -7.68%<br />
Telecommunication Services 111,176 95,053 88,988 -6.38%<br />
Postage/Shipping Services 146 750 750 0.00%<br />
Training/Education 16,940 31,400 31,400 0.00%<br />
Dues/Memberships 8,143 7,098 7,886 11.10%<br />
Mileage/Travel 27 - - 0.00%<br />
Total Purchased Services 722,676 858,221 794,373 -7.44%<br />
Supplies/Non-<strong>Capital</strong> Equipment<br />
Office Supplies 15 750 750 0.00%<br />
<strong>Operating</strong> Supplies 218 - - 0.00%<br />
Non-<strong>Capital</strong> Equipment 213,041 176,647 255,332 44.54%<br />
Total Supplies/Non-<strong>Capital</strong> Equipment 213,274 177,397 256,082 44.36%<br />
<strong>Capital</strong> Outlay<br />
<strong>Capital</strong> Equipment 157,463 152,900 703,599 360.17%<br />
Total <strong>Capital</strong> Outlay 157,463 152,900 703,599 360.17%<br />
Total Expenditures $ 1,899,208 $ 2,023,195 $ 2,616,857 29.34%<br />
77
SHARED TECHNOLOGY SERVICES<br />
Variance Justification<br />
Purchased Services (-$63,848):<br />
<br />
<br />
<br />
Professional Services (-$8,063): Decreased cost for Phase II of Asset Management Deployment<br />
(-$17,350).<br />
Repair/Maintenance Services (-$50,508): Decreased maintenance support costs for ERP system as<br />
a result of software replacement (-$48,464) and decreased cost for replacement of Granicus with<br />
BoardSync (-$16,300).<br />
Telecommunication Services (-$6,065): Elimination of police department telecommunication charges<br />
for 9-1-1 Center as E-911 Authority now pays for that service (-$8,015).<br />
Supplies/Non-<strong>Capital</strong> Equipment (+$78,685):<br />
<br />
Non-<strong>Capital</strong> Equipment (+$78,685): Replacement of non-capital equipment including:<br />
Brazos handheld devices in Police Department ($66,034).<br />
Video recording system in Police Department booking and interview rooms ($2,700).<br />
Disk Drives for VNX Storage Units ($12,000).<br />
Web filtering software to actively filter inappropriate internet traffic ($4,800).<br />
<br />
<strong>Capital</strong> Outlay (+$550,699): Replacement of capital equipment including:<br />
<strong>Capital</strong> Equipment (+$550,699):<br />
Police Department records management system ($434,430).<br />
Tax software system ($75,000).<br />
Backup system for CommVault ($71,339).<br />
Keri door system ($25,130).<br />
Final Phase of conference room technology upgrades ($11,000).<br />
78
FINANCE<br />
Statement of Purpose<br />
The purpose of the Finance Department is to support the organizational outcomes through the implementation of<br />
financial policies and practices which provide for the sound financial management and the stewardship of public<br />
resources.<br />
Description<br />
The Finance Department consists of the Administration Program, the Accounting and Financial Reporting Program, and<br />
the Taxpayer Services Program.<br />
The Administration Program is responsible for the leadership, oversight and general support of the department.<br />
The Accounting & Financial Reporting Program ensures financial integrity through the dissemination of timely and<br />
reliable information in accordance with generally accepted accounting principles within the context of a comprehensive<br />
framework of internal control. The program is responsible for the production of the annual operating and capital<br />
improvement budget, the comprehensive annual financial report, and coordination of the year-end financial audit.<br />
Additional services provided by the program include payroll, accounts payable and receivable, cash management,<br />
investments, and administration of the City’s purchasing card program.<br />
The Taxpayer Services Program supports the continued delivery of public services through the licensing and collection<br />
of sales, use, lodging, and occupational privilege taxes in a manner which fosters a mutually beneficial partnership with<br />
the local business community. The program is responsible for the auditing, assessment, collection, reporting and<br />
analysis of city-imposed tax revenue consistent with that of the ordinances of the City of Greenwood Village. Additional<br />
services provided by the program include business licensing, administration of the residential solicitation permit function,<br />
as well as the provision of tax-related educational resources to the local business community.<br />
Organizational Chart<br />
Director of Finance<br />
Administrative<br />
Assistant<br />
Accounting<br />
Manager<br />
Revenue<br />
Manager<br />
Senior<br />
Accountant<br />
Payroll Specialist<br />
Senior Tax<br />
Auditor<br />
Accountant<br />
Accounting<br />
Technician<br />
(2.00)<br />
Tax Auditor<br />
(4.00)<br />
Tax Technician<br />
(2.00)<br />
79
FINANCE<br />
Personnel & Financial Summary<br />
2016<br />
Audited<br />
Actuals<br />
2017<br />
Amended<br />
<strong>Budget</strong><br />
<strong>2018</strong><br />
<strong>Adopted</strong><br />
<strong>Budget</strong><br />
% Change<br />
Staff - Full Time Equivalency (FTE): 16.00 16.00 16.00 0.00%<br />
Expenditures By Category:<br />
Personnel $ 1,253,866 $ 1,316,565 $ 1,354,697 2.90%<br />
Purchased Services 333,926 321,391 330,485 2.83%<br />
Supplies/Non-<strong>Capital</strong> Equipment 6,126 11,595 8,500 -26.69%<br />
Total Expenditures $ 1,593,918 $ 1,649,551 $ 1,693,682 2.68%<br />
Expenditures By Division:<br />
Administration $ 274,405 $ 258,381 $ 256,456 -0.75%<br />
Accounting & Financial Reporting 625,157 662,792 701,997 5.92%<br />
Taxpayer Services 694,356 728,378 735,229 0.94%<br />
Total Expenditures $ 1,593,918 $ 1,649,551 $ 1,693,682 2.68%<br />
Expenditures & Full-Time Equivalency<br />
Expenditures<br />
$1,720,000<br />
$1,700,000<br />
$1,680,000<br />
$1,660,000<br />
$1,640,000<br />
$1,620,000<br />
$1,600,000<br />
$1,580,000<br />
$1,560,000<br />
$1,540,000<br />
2016<br />
Audited<br />
Actuals<br />
2017<br />
Amended<br />
<strong>Budget</strong><br />
<strong>2018</strong><br />
<strong>Adopted</strong><br />
<strong>Budget</strong><br />
18.00<br />
16.00<br />
14.00<br />
12.00<br />
10.00<br />
8.00<br />
6.00<br />
4.00<br />
2.00<br />
-<br />
Full-Time Equivalent (FTE)<br />
Total Expenditures<br />
Staff - Full Time Equivalency (FTE):<br />
Explanation of <strong>Budget</strong> Variances<br />
Significant changes to the <strong>2018</strong> budget include an additional $5,000 in purchased services related to banking services<br />
fees. The increase is due to the growing volume of credit card transactions as the City converts to accepting online<br />
payments for various services.<br />
An additional change to the <strong>2018</strong> budget includes an increase of $4,870 for fees associated with the collection of property<br />
taxes. The fee imposed by Arapahoe County is based on the dollar amount collected, and therefore as property taxes<br />
increase so do the associated collection fees.<br />
80
FINANCE<br />
Expenditure Detail<br />
2016<br />
Audited<br />
Actuals<br />
2017<br />
Amended<br />
<strong>Budget</strong><br />
<strong>2018</strong><br />
<strong>Adopted</strong><br />
<strong>Budget</strong><br />
% Change<br />
Personnel<br />
Regular Wages $ 990,044 $ 1,039,281 $ 1,069,258 2.88%<br />
Longevity Service Award 5,560 6,840 6,880 0.58%<br />
Overtime Wages 201 - - 0.00%<br />
Vehicle Allowance 3,600 3,600 3,600 0.00%<br />
Social Security 59,681 63,069 64,740 2.65%<br />
Medicare 14,068 14,941 15,298 2.39%<br />
Workers Compensation 1,048 1,404 1,277 -9.05%<br />
Retirement Contributions 61,607 74,560 40,231 -46.04%<br />
Medical Insurance 100,509 94,332 138,079 46.38%<br />
Dental Insurance 4,269 4,308 5,355 24.30%<br />
Insurance Waivers 6,888 7,250 3,400 -53.10%<br />
Life/AD&D Insurance 3,332 3,757 3,477 -7.45%<br />
Disability Insurance 3,059 3,223 3,102 -3.75%<br />
Total Personnel 1,253,866 1,316,565 1,354,697 2.90%<br />
Purchased Services<br />
Professional Services 217,528 223,710 228,710 2.24%<br />
Contracted Services 33,823 28,400 34,120 20.14%<br />
Catering/Dining Services 18,385 - - 0.00%<br />
Repair/Maintenance Services 3,520 3,750 3,750 0.00%<br />
Postage/Shipping Services 31,034 30,000 30,000 0.00%<br />
Printing/Publication Services 9,872 10,750 11,250 4.65%<br />
Training/Education 14,261 18,520 18,200 -1.73%<br />
Dues/Memberships 2,234 2,570 2,505 -2.53%<br />
Mileage/Travel 1,700 1,975 1,950 -1.27%<br />
Rentals/Leases 1,569 1,716 - -100.00%<br />
Total Purchased Services 333,926 321,391 330,485 2.83%<br />
Supplies/Non-<strong>Capital</strong> Equipment<br />
Office Supplies 3,627 5,000 5,000 0.00%<br />
<strong>Operating</strong> Supplies 499 3,845 3,500 -8.97%<br />
Non-<strong>Capital</strong> Equipment 2,000 2,750 - -100.00%<br />
Total Supplies/Non-<strong>Capital</strong> Equipment 6,126 11,595 8,500 -26.69%<br />
Total Expenditures $ 1,593,918 $ 1,649,551 $ 1,693,682 2.68%<br />
81
ADMINISTRATION<br />
Statement of Purpose<br />
The purpose of the Administration Program is to ensure high quality program outcomes of the Finance Department.<br />
Description<br />
The Administration Program ensures that the programs and activities of the department achieve their purpose. The<br />
primary activities of the program include the planning, directing, and the evaluation of services. Major activities include<br />
the management of personnel, the preparation and management of the department budget, and responsibility for the<br />
accuracy and completeness of financial information regarding City accounts and activities.<br />
Accomplishments<br />
In 2017, the City received an unmodified opinion for the previous year’s financial reports. City Council received monthly<br />
financial updates and a budget was adopted which continued to support high quality outcomes. Revenue projections<br />
were met and the financial health of the organization remains strong.<br />
Goals/Objectives<br />
The <strong>2018</strong> objectives of the program include the following:<br />
<br />
<br />
<br />
Enhance process efficiency, develop adequate internal control features, and provide for consistent application of<br />
best practices.<br />
o Develop a comprehensive financial policy (budgeting, accounting, investment, purchasing, etc.) to<br />
provide continuity and increased efficiencies.<br />
o Initialize a training regimen to incorporate best practices when and where appropriate.<br />
Establish an ongoing financial system user training/orientation program so as to provide end users with the ability<br />
to extract financial information on demand, greatly enhancing the decision-making process.<br />
o Initiate the development of a comprehensive financial system user manual, including the application of<br />
policies, practices, and procedures.<br />
o Work in coordination with Administrative Services to institute an orientation program whereby new users<br />
receive one-on-one training and tutoring.<br />
o Develop a seasonal ongoing training regimen in which upcoming financial practices (e.g. budget, yearend,<br />
etc.) are presented using a group training method.<br />
Evaluate the organization’s comprehensive framework of internal control as an approach to achieving the<br />
managerial objectives of effective and efficient operations, financial reporting, and compliance.<br />
o Establish a baseline of effective internal control via the identification of risks, existing compensating<br />
controls, adequacy of such controls, and utilization thereof.<br />
o Evaluate actual performance against established baseline using control cycles and vulnerability<br />
assessments.<br />
o Resolve identified deficiencies via a corrective action plan with an appropriate time table.<br />
Outcome Measures<br />
2015 2016 2017 <strong>2018</strong><br />
Actual Actual Estimate Target<br />
Percent of department objectives achieved. 95 95 100 100<br />
82
ADMINISTRATION<br />
Expenditure Detail<br />
2016<br />
Audited<br />
Actuals<br />
2017<br />
Amended<br />
<strong>Budget</strong><br />
<strong>2018</strong><br />
<strong>Adopted</strong><br />
<strong>Budget</strong><br />
% Change<br />
Personnel<br />
Regular Wages $ 163,084 $ 169,355 $ 177,685 4.92%<br />
Longevity Service Award - 325 385 18.46%<br />
Vehicle Allowance 3,600 3,600 3,600 0.00%<br />
Social Security 9,730 9,794 10,520 7.41%<br />
Medicare 2,385 2,481 2,617 5.48%<br />
Workers Compensation 201 259 233 -10.04%<br />
Retirement Contributions 11,811 12,316 6,619 -46.26%<br />
Medical Insurance 16,826 15,932 12,204 -23.40%<br />
Dental Insurance 722 721 492 -31.76%<br />
Life/AD&D Insurance 609 612 576 -5.88%<br />
Disability Insurance 502 525 515 -1.90%<br />
Total Personnel 209,470 215,920 215,446 -0.22%<br />
Purchased Services<br />
Professional Services 2,604 - - 0.00%<br />
Contracted Services 5,368 2,400 3,250 35.42%<br />
Catering/Dining Services 18,291 - - 0.00%<br />
Repair/Maintenance Services 3,520 3,750 3,750 0.00%<br />
Postage/Shipping Services 31,034 30,000 30,000 0.00%<br />
Training/Education 1,848 3,275 3,275 0.00%<br />
Dues/Memberships 280 320 235 -26.56%<br />
Rentals/Leases 1,569 1,716 - -100.00%<br />
Total Purchased Services 64,514 41,461 40,510 -2.29%<br />
Supplies/Non-<strong>Capital</strong> Equipment<br />
<strong>Operating</strong> Supplies 421 1,000 500 -50.00%<br />
Total Supplies/Non-<strong>Capital</strong> Equipment 421 1,000 500 -50.00%<br />
Total Expenditures $ 274,405 $ 258,381 $ 256,456 -0.75%<br />
Variance Justification<br />
Purchased Services (-$951):<br />
<br />
<br />
Contracted Services (+$850): This amount has been increased to more accurately represent the actual<br />
historical costs associated with stormwater fees pertaining to the fleet building located within the<br />
Southeast Metro Stormwater Authority (SEMSWA).<br />
Rentals/Leases (-$1,716): The reduction is attributable to the lease cancellation pertaining to a<br />
temporary storage unit used to house surplus equipment during construction of the maintenance facility.<br />
Supplies/Non-<strong>Capital</strong> Equipment (-$500):<br />
<br />
<strong>Operating</strong> Supplies (-$500): The amount has been reduced to more accurately represent the actual<br />
historical costs associated with miscellaneous office supplies.<br />
83
ACCOUNTING & FINANCIAL REPORTING<br />
Statement of Purpose<br />
The purpose of the Accounting and Financial Reporting Program is to ensure the communication of accurate and useful<br />
financial information in a manner that contributes to successful organizational outcomes.<br />
Description<br />
The Accounting & Financial Reporting Program ensures financial integrity through the dissemination of timely and<br />
reliable information in accordance with generally accepted accounting principles within the context of a comprehensive<br />
framework of internal control. The program is responsible for the production of the annual operating and capital<br />
improvement budget, the comprehensive annual financial report, and coordination of the year-end financial audit.<br />
Additional services provided by the program include payroll, accounts payable and receivable, cash management,<br />
investments, and administration of the City’s purchasing card program.<br />
Accomplishments<br />
In 2017, for the twenty-seventh consecutive year, the City received the Government Finance Officers Association<br />
(GFOA) Certificate of Achievement for Excellence in Financial Reporting. The City also received its fourth GFOA<br />
Distinguished <strong>Budget</strong> Presentation Award. Both programs require that the City publish transparent, comprehensible<br />
financial documents which demonstrate best practices and exceed the minimum requirements of generally accepted<br />
accounting principles and state and local guidelines.<br />
In addition, internally, the program focused on staff development particularly in governmental financial reporting.<br />
Externally, the program began the development and implementation of a training program to educate financial system<br />
users on a variety of unknown processes and system enhancements.<br />
Goals/Objectives<br />
In <strong>2018</strong>, the program will focus on the following initiatives:<br />
<br />
<br />
Evaluate and refine the financial system end user training program.<br />
Continue the assessment of the effectiveness of the City’s system of internal control which involves (1) analyzing<br />
and documenting the assessment including the presence and functioning of components and relevant principles<br />
as set forth in the Committee of Sponsoring Organizations of the Treadway Commission (COSO) Integrated<br />
Framework, (2) documenting internal control deficiencies, and (3) developing a corrective action plan.<br />
Outcome Measures<br />
2015<br />
Actual<br />
2016<br />
Actual<br />
2017<br />
Estimate<br />
<strong>2018</strong><br />
Target<br />
Accuracy:<br />
Number of error/corrections discovered by the external auditors during<br />
the previous year’s financial statement audit.<br />
0 2 0 0<br />
Number of errors found in previous year’s financial reports. 1 1 0 0<br />
Unmodified opinion received on previous year’s Comprehensive <strong>Annual</strong><br />
Financial Report.<br />
Yes Yes Yes Yes<br />
Number of post-payroll corrections required due to processing errors. 6 2 2
ACCOUNTING & FINANCIAL REPORTING<br />
Service Level Indicators<br />
2015<br />
Actual<br />
2016<br />
Actual<br />
2017<br />
Estimate<br />
Number of full-time employees (as of December 31st). 254 251 264<br />
Number of payroll checks/direct deposits issued. 7,389 7,111 7,200<br />
Number of W-2’s issued. 341 333 340<br />
Number of accounts payable checks issued. 5,636 5,249 5,150<br />
Number of purchasing card transactions processed. 3,776 3,867 3,900<br />
Expenditure Detail<br />
2016<br />
Audited<br />
Actuals<br />
2017<br />
Amended<br />
<strong>Budget</strong><br />
<strong>2018</strong><br />
<strong>Adopted</strong><br />
<strong>Budget</strong><br />
% Change<br />
Personnel<br />
Regular Wages $ 344,062 $ 364,993 $ 379,613 4.01%<br />
Longevity Service Award 1,415 1,780 2,165 21.63%<br />
Overtime Wages 133 - - 0.00%<br />
Social Security 20,971 22,594 22,948 1.57%<br />
Medicare 4,905 5,285 5,368 1.57%<br />
Workers Compensation 401 554 493 -11.01%<br />
Retirement Contributions 20,876 26,369 14,899 -43.50%<br />
Medical Insurance 23,836 21,296 51,543 142.03%<br />
Dental Insurance 968 967 1,785 84.59%<br />
Insurance Waivers 3,988 4,350 1,700 -60.92%<br />
Life/AD&D Insurance 1,167 1,322 1,236 -6.51%<br />
Disability Insurance 1,063 1,132 1,102 -2.65%<br />
Total Personnel 423,785 450,642 482,852 7.15%<br />
Purchased Services<br />
Professional Services 157,235 165,990 170,990 3.01%<br />
Contracted Services 28,455 26,000 30,870 18.73%<br />
Catering/Dining Services 94 - - 0.00%<br />
Training/Education 8,259 9,995 9,675 -3.20%<br />
Dues/Memberships 1,499 1,890 1,910 1.06%<br />
Mileage/Travel 125 225 200 -11.11%<br />
Total Purchased Services 195,667 204,100 213,645 4.68%<br />
Supplies/Non-<strong>Capital</strong> Equipment<br />
Office Supplies 3,627 5,000 5,000 0.00%<br />
<strong>Operating</strong> Supplies 78 300 500 66.67%<br />
Non-<strong>Capital</strong> Equipment 2,000 2,750 - -100.00%<br />
Total Supplies/Non-<strong>Capital</strong> Equipment 5,705 8,050 5,500 -31.68%<br />
Total Expenditures $ 625,157 $ 662,792 $ 701,997 5.92%<br />
85
ACCOUNTING & FINANCIAL REPORTING<br />
Variance Justification<br />
Purchased Services (+$9,545):<br />
<br />
<br />
Professional Services (+$5,000): This amount represents additional banking fees resulting from an<br />
increase in the volume of on-line credit card transactions.<br />
Contracted Services (+$4,870): As property tax revenue increases, the 1% collection fee due to<br />
Arapahoe County also increases.<br />
Supplies/Non-<strong>Capital</strong> Equipment (-$2,550):<br />
<br />
Non-<strong>Capital</strong> Equipment (-$2,750): In 2017, the program purchased a cross-cut shredder. Such<br />
equipment replacements are not necessary in <strong>2018</strong>.<br />
86
TAXPAYER SERVICES<br />
Statement of Purpose<br />
The Taxpayer Services Program ensures the receipt of tax revenues in a manner that contributes to successful<br />
Village outcomes.<br />
Description<br />
The Taxpayer Services Program is responsible for the collection of Sales, Use, Lodging, and Occupational Privilege<br />
taxes. Ensuring the receipt of Village revenues is accomplished through information, education, and auditing<br />
activities.<br />
Accomplishments<br />
In 2017, staff participated in the Standardized Definitions Steering Committee under the guidance of Colorado<br />
Municipal League. Staff prepared and presented an Ordinance to adopt the standardized definitions. Thus, providing<br />
our business community with better uniformity and simplicity when operating in multiple home rule jurisdictions. The<br />
Ordinance became effective in May 2017. Staff continues to complete work with the highest level of accuracy as well<br />
as providing our customers with timely information. Staff development and continuing education continue to be of<br />
great concern. Staff participated in the Western States Tax Administrator’s meeting, Government Financial Officers<br />
Association, Colorado Tax Audit Coalition as well as the Municipal Enforcement and Collections Group.<br />
Goals/Objectives<br />
In <strong>2018</strong>, Staff hopes to implement a new tax software that would provide enhanced functionality to our internal users<br />
and ease of access for online filing for members of the business community. Reliable and straight forward online filing<br />
options will allow taxpayers to easily file and remit taxes. In addition, staff will continue to actively participate in the<br />
Sales Tax Simplification Committee, under the guidance of Colorado Municipal League. Staff strives to develop<br />
mutually beneficial relationships with members of our business community. Quarterly tax classes will be offered on a<br />
variety of topics. This will be in addition to one-on-one training as requested by our taxpayers. Staff will work diligently<br />
to meet our <strong>2018</strong> audit and enforcement budget.<br />
Outcome Measures<br />
2015<br />
Actual<br />
2016<br />
Actual<br />
2017<br />
Estimate<br />
<strong>2018</strong><br />
Target<br />
Actual audit revenues compared to annual projected audit revenues<br />
expressed as a percentage.<br />
52 96 100 100<br />
Remitted value of tax returns compared to audited value of tax returns<br />
expressed as a percentage.<br />
90 83 85 85<br />
Percent of audited taxpayers rating quality of audit as Good or Excellent. 95 97 95 95<br />
Percent of tax revenue audited. 31 29 30 35<br />
Service Level Indicators<br />
2015<br />
Actual<br />
2016<br />
Actual<br />
2017<br />
Estimate<br />
Number of sales/use tax accounts. 3,641 3,600 3,770<br />
Number of occupational privilege tax accounts. 2,920 2,900 3,000<br />
Number of audits conducted. 165 150 110<br />
87
TAXPAYER SERVICES<br />
Expenditure Detail<br />
2016<br />
Audited<br />
Actuals<br />
2017<br />
Amended<br />
<strong>Budget</strong><br />
<strong>2018</strong><br />
<strong>Adopted</strong><br />
<strong>Budget</strong><br />
% Change<br />
Personnel<br />
Regular Wages $ 482,898 $ 504,933 $ 511,960 1.39%<br />
Longevity Service Award 4,145 4,735 4,330 -8.55%<br />
Overtime Wages 68 - - 0.00%<br />
Social Security 28,980 30,681 31,272 1.93%<br />
Medicare 6,778 7,175 7,313 1.92%<br />
Workers Compensation 446 591 551 -6.77%<br />
Retirement Contributions 28,920 35,875 18,713 -47.84%<br />
Medical Insurance 59,847 57,104 74,332 30.17%<br />
Dental Insurance 2,579 2,620 3,078 17.48%<br />
Insurance Waivers 2,900 2,900 1,700 -41.38%<br />
Life/AD&D Insurance 1,556 1,823 1,665 -8.67%<br />
Disability Insurance 1,494 1,566 1,485 -5.17%<br />
Total Personnel 620,611 650,003 656,399 0.98%<br />
Purchased Services<br />
Professional Services 57,689 57,720 57,720 0.00%<br />
Printing/Publication Services 9,872 10,750 11,250 4.65%<br />
Training/Education 4,154 5,250 5,250 0.00%<br />
Dues/Memberships 455 360 360 0.00%<br />
Mileage/Travel 1,575 1,750 1,750 0.00%<br />
Total Purchased Services 73,745 75,830 76,330 0.66%<br />
Supplies/Non-<strong>Capital</strong> Equipment<br />
<strong>Operating</strong> Supplies - 2,545 2,500 -1.77%<br />
Total Supplies/Non-<strong>Capital</strong> Equipment - 2,545 2,500 -1.77%<br />
Total Expenditures $ 694,356 $ 728,378 $ 735,229 0.94%<br />
Variance Justification<br />
<br />
No notable variances<br />
88
COMMUNITY DEVELOPMENT<br />
Statement of Purpose<br />
The Department of Community Development preserves and protects the desirable characteristics of the existing built<br />
and natural environments while planning for the future development of the Village.<br />
Description<br />
The Community Development Department is comprised of five programs: Administration, Planning, Building Safety,<br />
Neighborhood Services and Building Services.<br />
The Administration Program provides administrative support and management oversight to assure high quality<br />
department outcomes.<br />
The Planning Program assists elected officials in articulating goals and objectives for the physical development of the<br />
Village in the form of the Comprehensive and Transportation Plans. The Planning Program also assures high quality<br />
development outcomes through the interpretation of the Comprehensive Plan and administration of development codes.<br />
The Building Safety Program assures the construction safety of new and existing buildings through construction plan<br />
review and approval and the inspection of new and existing buildings.<br />
The Neighborhood Services Program sustains high quality appearance of the community by assuring property owner<br />
compliance with property use and maintenance standards.<br />
The Building Services Program assures that Village owned buildings are safe, clean, and comfortable.<br />
Organizational Chart<br />
Director of<br />
Community<br />
Development<br />
Chief Building<br />
Official<br />
Planning<br />
Manager<br />
Plans Examiner<br />
Building<br />
Services<br />
Supervisor<br />
Communiity<br />
Development<br />
Engineer<br />
Senior Planner<br />
Electrical<br />
Inspector/Plan<br />
Reviewer<br />
Facilities<br />
Maintenance<br />
Technician<br />
Planner II<br />
Combination<br />
Inspector (2)<br />
Facility Service<br />
Worker (6)<br />
Planner I<br />
Administrative<br />
Supervisor<br />
Neighborhood<br />
Services Officer<br />
Planning<br />
Technician<br />
Administrative<br />
Assistant (2.5)<br />
89
COMMUNITY DEVELOPMENT<br />
Personnel & Financial Summary<br />
2016<br />
Audited<br />
Actuals<br />
2017<br />
Amended<br />
<strong>Budget</strong><br />
<strong>2018</strong><br />
<strong>Adopted</strong><br />
<strong>Budget</strong><br />
% Change<br />
Staff - Full Time Equivalency (FTE): 23.50 23.50 24.50 4.26%<br />
Expenditures By Category:<br />
Personnel $ 1,748,615 $ 1,875,706 $ 1,916,141 2.16%<br />
Purchased Services 474,880 562,564 456,036 -18.94%<br />
Supplies/Non-<strong>Capital</strong> Equipment 258,146 286,280 262,765 -8.21%<br />
<strong>Capital</strong> Outlay 63,972 106,000 - -100.00%<br />
Miscellaneous Expenditures 981,903 - 18,344 100.00%<br />
Total Expenditures $ 3,527,516 $ 2,830,550 $ 2,653,286 -6.26%<br />
Expenditures By Division:<br />
Administration $ 1,343,055 $ 392,174 $ 453,038 15.52%<br />
Planning 578,518 715,546 546,933 -23.56%<br />
Building Safety 583,396 633,072 651,320 2.88%<br />
Neighborhood Services 76,855 82,115 83,785 2.03%<br />
Building Services 945,692 1,007,643 918,210 -8.88%<br />
Total Expenditures $ 3,527,516 $ 2,830,550 $ 2,653,286 -6.26%<br />
Expenditures & Full-Time Equivalency<br />
Expenditures<br />
$4,000,000<br />
$3,500,000<br />
$3,000,000<br />
$2,500,000<br />
$2,000,000<br />
$1,500,000<br />
$1,000,000<br />
$500,000<br />
$-<br />
2016<br />
Audited<br />
Actuals<br />
2017<br />
Amended<br />
<strong>Budget</strong><br />
<strong>2018</strong><br />
<strong>Adopted</strong><br />
<strong>Budget</strong><br />
25.00<br />
24.50<br />
24.00<br />
23.50<br />
23.00<br />
22.50<br />
22.00<br />
21.50<br />
21.00<br />
20.50<br />
20.00<br />
Full-Time Equivalent (FTE)<br />
Total Expenditures<br />
Staff - Full Time Equivalency (FTE):<br />
Explanation of <strong>Budget</strong> Variances<br />
Overall in Community Development there is a reduction of 6.26% for <strong>2018</strong>, mostly attributable to facilities capital projects<br />
completed in 2017. Proposed for <strong>2018</strong> is the addition of 1 FTE, Facility Service Worker, which is proposed to perform<br />
cleaning services for the Maintenance Facility, Fleet Building, and 3 new hardwalled bathrooms in the parks. Elimination<br />
of the contract cleaning services for the Maintenance Facility and Fleet Building, together with the reduction in cost of<br />
port-o-let servicing for the 3 park locations where hardwalled bathrooms are constructed will significantly offset the<br />
personnel cost of the new FTE Facility Service Worker. There is an anticipated increase of 4% for electricity costs for<br />
City facilities based on projections by Xcel Energy.<br />
The Building Safety program proposes the adoption of the <strong>2018</strong> International Building Codes and associated purchase of<br />
code books in the Administration program. An increase in elevator inspection fees provided by our contracted inspection<br />
service is reflected with the $14,085 increase in Contracted Services for Building Safety. This increased fee will be<br />
reflected in what is charged back to the commercial property owners for elevator inspections. In the Planning program,<br />
the update to the Drainage Criteria Manual in conjunction with Urban Drainage and Flood Control District is anticipated<br />
for <strong>2018</strong>, but $40,000 was allocated for this work in 2017, thus the reduction in the Professional Services line item for<br />
<strong>2018</strong>. The other $60,000 reduction in the Planning program in Professional Services results from the elimination of the<br />
sign designs for a wayfinding sign program. Smart phone technology advances available to the public are viewed as to<br />
have eliminated the need for wayfinding signs for commercial destinations. Pedestrian wayfinding signage around the<br />
light-rail stations is still anticipated in coordination with RTD and SPIMD.<br />
90
COMMUNITY DEVELOPMENT<br />
Expenditure Detail<br />
2016<br />
Audited<br />
Actuals<br />
2017<br />
Amended<br />
<strong>Budget</strong><br />
<strong>2018</strong><br />
<strong>Adopted</strong><br />
<strong>Budget</strong><br />
% Change<br />
Personnel<br />
Regular Wages $ 1,323,501 $ 1,415,864 $ 1,477,295 4.34%<br />
Seasonal/Temporary Wages 994 - - 0.00%<br />
Longevity Service Award 7,600 10,500 7,825 -25.48%<br />
Overtime Wages 9,854 7,580 12,500 64.91%<br />
Clothing Allowance 1,852 1,850 850 -54.05%<br />
Vehicle Allowance 3,600 3,600 3,600 0.00%<br />
Social Security 81,198 87,257 90,889 4.16%<br />
Medicare 18,990 20,509 21,282 3.77%<br />
Workers Compensation 12,257 14,461 16,096 11.31%<br />
Retirement Contributions 74,193 96,704 47,656 -50.72%<br />
Medical Insurance 192,297 193,179 214,789 11.19%<br />
Dental Insurance 8,799 9,366 9,660 3.14%<br />
Insurance Waivers 4,963 5,325 4,600 -13.62%<br />
Life/AD&D Insurance 4,407 5,122 4,814 -6.01%<br />
Disability Insurance 4,110 4,389 4,285 -2.37%<br />
Total Personnel 1,748,615 1,875,706 1,916,141 2.16%<br />
Purchased Services<br />
Professional Services 28,395 105,100 5,100 -95.15%<br />
Contracted Services 155,712 178,170 192,255 7.91%<br />
Catering/Dining Services 6,579 8,500 8,500 0.00%<br />
Repair/Maintenance Services 253,838 223,220 199,620 -10.57%<br />
Disposal/Recycling Services - 1,000 1,000 0.00%<br />
Telecommunication Services 5,609 7,592 7,320 -3.58%<br />
Postage/Shipping Services 21 - - 0.00%<br />
Printing/Publication Services 1,099 1,980 2,095 5.81%<br />
Training/Education 17,423 29,825 32,797 9.96%<br />
Dues/Memberships 3,676 5,538 5,669 2.37%<br />
Mileage/Travel 2,528 1,639 1,680 2.50%<br />
Total Purchased Services 474,880 562,564 456,036 -18.94%<br />
Supplies/Non-<strong>Capital</strong> Equipment<br />
Office Supplies 3,414 6,200 3,500 -43.55%<br />
<strong>Operating</strong> Supplies 56,213 48,505 51,225 5.61%<br />
Non-<strong>Capital</strong> Equipment 41,135 70,100 37,800 -46.08%<br />
Uniforms/Safety Equipment 2,707 5,975 6,240 4.44%<br />
Gas/Electricity 136,546 137,500 146,000 6.18%<br />
Water/Sewer 18,131 18,000 18,000 0.00%<br />
Total Supplies/Non-<strong>Capital</strong> Equipment 258,146 286,280 262,765 -8.21%<br />
<strong>Capital</strong> Outlay<br />
<strong>Capital</strong> Equipment 63,972 106,000 - -100.00%<br />
Total <strong>Capital</strong> Outlay 63,972 106,000 - -100.00%<br />
Miscellaneous Expenditures<br />
Development Rebates 981,903 - 18,344 100.00%<br />
Total Miscellaneous Expenditures 981,903 - 18,344 100.00%<br />
Total Expenditures $ 3,527,516 $ 2,830,550 $ 2,653,286 -6.26%<br />
91
ADMINISTRATION<br />
Statement of Purpose<br />
The Administration Program assures high quality department outcomes.<br />
Description<br />
High quality department outcomes are assured by developing and maintaining a department work plan and initiating<br />
and maintaining programs consistent with the department work plan. Other major aspects of the program include<br />
managing financial information and staff resources, managing development processes to protect Village interests, and<br />
facilitating the completion of development and construction projects. Evaluating the overall effectiveness of programs<br />
and activities and developing strategies for continuous improvement are important aspects of the program. The program<br />
provides administrative support for all department functions.<br />
Accomplishments<br />
During 2017, emphasis was placed on customer service enhancements. The beginning stages of technology based<br />
electronic submission of applications and permit plans was started and will continue throughout <strong>2018</strong>. Online permitting<br />
and payments for over the counter permits was implemented.<br />
Goals/Objectives<br />
During <strong>2018</strong>, technology based customer service enhancements to allow electronic submission of plans and permits<br />
will be implemented. The department will place increased emphasis on employee training and professional growth and<br />
continue to focus on strengthening internal relationships through focused team building activities.<br />
Outcome Measures<br />
2015<br />
Actual<br />
2016<br />
Actual<br />
2017<br />
Estimate<br />
<strong>2018</strong><br />
Target<br />
Percent of respondents rating the Department as Good or Excellent as<br />
measured by customer survey.<br />
95 95 95 95<br />
Percent of department objectives achieved. 95 95 95 95<br />
Percent of planned activities that had desired impact. 100 100 100 100<br />
92
ADMINISTRATION<br />
Expenditure Detail<br />
2016<br />
Audited<br />
Actuals<br />
2017<br />
Amended<br />
<strong>Budget</strong><br />
<strong>2018</strong><br />
<strong>Adopted</strong><br />
<strong>Budget</strong><br />
% Change<br />
Personnel<br />
Regular Wages $ 254,755 $ 278,511 $ 318,348 14.30%<br />
Longevity Service Award 1,360 330 - -100.00%<br />
Overtime Wages 4,636 1,980 2,000 1.01%<br />
Vehicle Allowance 3,600 3,600 3,600 0.00%<br />
Social Security 15,884 17,041 19,606 15.05%<br />
Medicare 3,715 4,087 4,612 12.85%<br />
Workers Compensation 346 370 419 13.24%<br />
Retirement Contributions 16,210 20,312 10,846 -46.60%<br />
Medical Insurance 25,874 31,146 43,336 39.14%<br />
Dental Insurance 1,181 1,539 1,965 27.68%<br />
Insurance Waivers 2,175 2,175 1,450 -33.33%<br />
Life/AD&D Insurance 830 1,010 1,040 2.97%<br />
Disability Insurance 806 863 923 6.95%<br />
Total Personnel 331,372 362,964 408,145 12.45%<br />
Purchased Services<br />
Professional Services 27 - - 0.00%<br />
Contracted Services 7,905 - - 0.00%<br />
Catering/Dining Services 6,552 8,500 8,500 0.00%<br />
Postage/Shipping Services 21 - - 0.00%<br />
Printing/Publication Services 1,099 1,980 2,095 5.81%<br />
Training/Education 9,207 9,850 9,725 -1.27%<br />
Dues/Memberships 970 2,176 2,184 0.37%<br />
Mileage/Travel 345 104 145 39.42%<br />
Total Purchased Services 26,126 22,610 22,649 0.17%<br />
Supplies/Non-<strong>Capital</strong> Equipment<br />
Office Supplies 3,414 6,200 3,500 -43.55%<br />
<strong>Operating</strong> Supplies 240 400 400 0.00%<br />
Total Supplies/Non-<strong>Capital</strong> Equipment 3,654 6,600 3,900 -40.91%<br />
Miscellaneous Expenditures<br />
Development Rebates 981,903 - 18,344 100.00%<br />
Total Miscellaneous Expenditures 981,903 - 18,344 100.00%<br />
Total Expenditures $ 1,343,055 $ 392,174 $ 453,038 15.52%<br />
Variance Justification<br />
Supplies/Non-<strong>Capital</strong> Equipment (-$2,700):<br />
<br />
Office Supplies (-$2,700): The 2017 budget included the planned purchase of new international<br />
Building Code books, which will not occur. Staff plans to request a carryover of these unspent funds<br />
from 2017 into the <strong>2018</strong> budget, when the <strong>2018</strong> International Building Codes are adopted.<br />
93
PLANNING<br />
Statement of Purpose<br />
The Planning Program assists the Planning and Zoning Commission and City Council in formally articulating community<br />
values in the Comprehensive Plan. The program is responsible for interpreting identified values by making<br />
recommendations for the adoption of ordinances that support the development values of the City and in making<br />
recommendations for development projects.<br />
Description<br />
The application of Village codes occurs through the recommendations in staff reports to the Board of Adjustments and<br />
Appeals, Planning and Zoning Commission, and the City Council. In addition, staff’s interpretation of the community<br />
values influences and guides decision making to improve the built environment of the community.<br />
Accomplishments<br />
In 2017, a revision to the wireless communication facilities code was approved by Council to allow the City to<br />
accommodate the communication needs of the community while complying with state and federal telecommunications<br />
laws and regulations and providing for an administrative permit process. An update to the storm drainage design and<br />
technical criteria manual was commenced as a collaborative effort involving the Community Development Engineer,<br />
Public Works staff and the Urban Drainage and Flood Control District.<br />
The larger development review cases included the Harrison Oaks Subdivision and the new Village Center Station II<br />
office building. The nearing completion of the Arapahoe Road and I-25 interchange improvements and the construction<br />
of the new Alton Way road alignment has prompted reinvestment in a number of properties on and around the Arapahoe<br />
corridor. An amendment to reuse existing commercial spaces to accommodate an REI (formerly Sports Authority) and<br />
two new theme restaurants on Arapahoe Road (formerly Gunther Toody’s) were approved. La Quinta and Brothers BBQ<br />
saw parking lot and landscape improvements as well as changes in signage for the Courtyard Mariott. Park Place<br />
Residence Inn hotel and the Landmark Village residential development requests were reviewed by the City.<br />
Goals/Objectives<br />
In <strong>2018</strong>, the updates to the Drainage Criteria Manual will be completed. Community Development staff will assist the<br />
Public Works on the update to the Transportation Plan. Also in <strong>2018</strong>, staff will engage with Planning and Zoning<br />
Commission, City Council, citizens, and commercial property owners on the Arapahoe Road Corridor. The City’s sign<br />
code will be analyzed and amendments recommended to address the importance of signs in the built environment and<br />
recent decision by the Supreme Court on content neutrality.<br />
Outcome Measures<br />
2015<br />
Actual<br />
2016<br />
Actual<br />
2017<br />
Estimate<br />
Accuracy in Interpretation:<br />
Measurement of the aesthetic quality and functionality of new<br />
development as measured by outside observer.<br />
N/A 93 94 94<br />
Effectiveness of Implementation:<br />
Percent of customer survey respondents rating program as Good or<br />
Excellent.<br />
95 90 92 95<br />
Percent of time development case initial review timeframes were met. N/A 90 95 98<br />
<strong>2018</strong><br />
Target<br />
94
PLANNING<br />
Service Level Indicators<br />
2015<br />
Actual<br />
2016<br />
Actual<br />
2017<br />
Estimate<br />
Rezone. 2 2 0<br />
Development plan (SDP/PUD). 14 9 9<br />
Subdivision. 12 11 6<br />
Special use permit. 6 2 4<br />
Sign program. 7 7 9<br />
Miscellaneous. 5 3 9<br />
Variance. 7 6 10<br />
Grading/Landscape/Flatwork permit. 103 144 93<br />
County/City referrals. 5 6 6<br />
Total Cases. 161 190 146<br />
Expenditure Detail<br />
2016<br />
Audited<br />
Actuals<br />
2017<br />
Amended<br />
<strong>Budget</strong><br />
<strong>2018</strong><br />
<strong>Adopted</strong><br />
<strong>Budget</strong><br />
% Change<br />
Personnel<br />
Regular Wages $ 427,249 $ 468,030 $ 425,999 -8.98%<br />
Seasonal/Temporary Wages 994 - - 0.00%<br />
Longevity Service Award 1,290 3,345 2,395 -28.40%<br />
Overtime Wages - - 2,900 100.00%<br />
Social Security 26,020 28,778 26,305 -8.59%<br />
Medicare 6,085 6,730 6,151 -8.60%<br />
Workers Compensation 547 605 554 -8.43%<br />
Retirement Contributions 23,996 33,038 14,294 -56.73%<br />
Medical Insurance 52,707 52,663 46,319 -12.05%<br />
Dental Insurance 2,385 2,506 2,031 -18.95%<br />
Insurance Waivers 121 - - 0.00%<br />
Life/AD&D Insurance 1,370 1,692 1,387 -18.03%<br />
Disability Insurance 1,340 1,450 1,236 -14.76%<br />
Total Personnel 544,104 598,837 529,571 -11.57%<br />
Purchased Services<br />
Professional Services 27,743 102,600 2,600 -97.47%<br />
Telecommunication Services 566 800 600 -25.00%<br />
Training/Education 2,518 9,112 10,472 14.93%<br />
Dues/Memberships 2,288 2,717 2,840 4.53%<br />
Mileage/Travel 1,207 300 300 0.00%<br />
Total Purchased Services 34,322 115,529 16,812 -85.45%<br />
Supplies/Non-<strong>Capital</strong> Equipment<br />
<strong>Operating</strong> Supplies - 780 250 -67.95%<br />
Uniforms/Safety Equipment 92 400 300 -25.00%<br />
Total Supplies/Non-<strong>Capital</strong> Equipment 92 1,180 550 -53.39%<br />
Total Expenditures $ 578,518 $ 715,546 $ 546,933 -23.56%<br />
Variance Justification<br />
Purchased Services (-$98,717):<br />
<br />
Professional Services (-$100,000): Allocation for the Drainage Criteria Manual Update occurred in<br />
2017 (-$40,000) and elimination of the Wayfinding Sign Program due to personal technology navigation<br />
advances (-$60,000).<br />
95
BUILDING SAFETY<br />
Statement of Purpose<br />
The Building Safety Program assures the construction safety of new and existing buildings through construction plan<br />
review and approval and the inspection of new and existing buildings.<br />
Description<br />
The public health, safety, and welfare of the built environment is fostered through the maintenance of up-to-date building<br />
codes, the proper interpretation of the codes during plan reviews, and high quality field inspections. Staff and contractor<br />
quality is maintained through on-going training and certification of staff and a licensing program for contractors.<br />
Accomplishments<br />
Large projects completed in 2017 were Caley Ponds Townhomes and Springhill Suites Hotel, Village Center Station II<br />
and the Granite building. Major tenant finish projects included Charter Communications in the Granite Building, AAA<br />
Colorado in Atrium 1, REI and Bank of America. Online permit reviewing was made available, as well as payment<br />
acceptance. Staff evaluated and updated the service level indicators to ensure that accurate plan review activity is<br />
reported annually.<br />
Goals/Objectives<br />
In <strong>2018</strong>, staff will expand the implementation of online permit and plan submittals. Staff will present the <strong>2018</strong><br />
International Building Codes to City Council for adoption.<br />
Outcome Measures<br />
2015<br />
Actual<br />
2016<br />
Actual<br />
2017<br />
Estimate<br />
<strong>2018</strong><br />
Target<br />
Percent of customer survey respondents rating program as good or<br />
excellent.<br />
N/A N/A N/A 90<br />
Percent of time Building Safety plan review timeframes were met. 95 100 100 100<br />
Percent of time Building Safety inspections were performed next day. 100 100 100 100<br />
Service Level Indicators<br />
2015<br />
Actual<br />
2016<br />
Actual<br />
2017<br />
Estimate<br />
Case Load:<br />
Plan reviews. 1,816 2,052 7,402*<br />
Permits issued. 2,408 1,681 1,496<br />
Inspections. 14,207 12,200 10,846<br />
Revenue:<br />
Plan review. $413,446 $410,000 $646,656<br />
Permit fees. $1,012,343 $900,800 $1,146,221<br />
Use tax. $2,321,267 $2,100,000 $3,646,388<br />
*Includes 2 nd and 3 rd Plan Reviews on the same project.<br />
96
BUILDING SAFETY<br />
Expenditure Detail<br />
2016<br />
Audited<br />
Actuals<br />
2017<br />
Amended<br />
<strong>Budget</strong><br />
<strong>2018</strong><br />
<strong>Adopted</strong><br />
<strong>Budget</strong><br />
% Change<br />
Personnel<br />
Regular Wages $ 334,625 $ 345,765 $ 362,706 4.90%<br />
Longevity Service Award 1,170 1,235 700 -43.32%<br />
Overtime Wages 570 2,600 2,600 0.00%<br />
Clothing Allowance 402 750 750 0.00%<br />
Social Security 20,459 21,449 22,471 4.76%<br />
Medicare 4,785 5,017 5,255 4.74%<br />
Workers Compensation 2,527 2,620 2,728 4.12%<br />
Retirement Contributions 13,661 21,077 10,317 -51.05%<br />
Medical Insurance 42,140 36,013 33,374 -7.33%<br />
Dental Insurance 2,086 1,882 1,636 -13.07%<br />
Insurance Waivers 2,417 2,900 2,900 0.00%<br />
Life/AD&D Insurance 1,103 1,247 1,181 -5.29%<br />
Disability Insurance 1,019 1,072 1,052 -1.87%<br />
Total Personnel 426,964 443,627 447,670 0.91%<br />
Purchased Services<br />
Professional Services 495 2,500 2,500 0.00%<br />
Contracted Services 143,445 169,370 183,455 8.32%<br />
Catering/Dining Services 27 - - 0.00%<br />
Telecommunication Services 2,857 4,600 3,720 -19.13%<br />
Training/Education 4,679 8,500 9,500 11.76%<br />
Dues/Memberships 373 575 575 0.00%<br />
Mileage/Travel 976 1,200 1,200 0.00%<br />
Total Purchased Services 152,852 186,745 200,950 7.61%<br />
Supplies/Non-<strong>Capital</strong> Equipment<br />
<strong>Operating</strong> Supplies 1,879 1,300 1,300 0.00%<br />
Non-<strong>Capital</strong> Equipment 412 - - 0.00%<br />
Uniforms/Safety Equipment 1,289 1,400 1,400 0.00%<br />
Total Supplies/Non-<strong>Capital</strong> Equipment 3,580 2,700 2,700 0.00%<br />
Total Expenditures $ 583,396 $ 633,072 $ 651,320 2.88%<br />
Variance Justification<br />
Purchased Services (+$14,205):<br />
<br />
<br />
Contracted Services (+$14,085): Additional elevators and increased inspection costs.<br />
Training/Education (+$1,000): Additional training and certifications for new building inspector hires.<br />
97
NEIGHBORHOOD SERVICES<br />
Statement of Purpose<br />
The Neighborhood Services Program assures the high quality appearance of the existing built environment.<br />
Description<br />
Property maintenance standards are enforced systematically in commercial areas and on a complaint basis in residential<br />
areas. Wetland areas and water resources are protected through the enforcement of the drainage code and flood plain<br />
protection ordinances.<br />
Accomplishments<br />
In 2017, the program had continued success in bringing many properties into compliance with the quality standards and<br />
maintenance values of the community. The program expanded the inspections of commercial properties requiring<br />
maintenance and upgrades to bring the properties into compliance with code standards and approved plans (when<br />
available). The efforts included identifying and bringing a number of trash, recycling and generator enclosures into<br />
compliance through repairs and construction necessary to conceal external storage. Involvement with contractors was<br />
expanded to address construction site maintenance including parking and permit schedules to minimize the impacts on<br />
the neighborhoods. The partnership with Police was strengthened through participation in officer training and integrating<br />
into the program through operational announcements on the tracking software (SmartForce). The Program was an<br />
active participant in the teamwork necessary to handle the fuel truck explosion emergency and the coordination on the<br />
environmental clean-up.<br />
Goals/Objectives<br />
In <strong>2018</strong>, the program will expand the communication, training and coordination efforts with the Police Department<br />
more specifically in reference to the transient community and the impacts on private and public lands. The<br />
Neighborhood Brochure will be developed as a tool to assist the program in informing and communicating with<br />
Homeowner Associations and residents on code related matters. The program will improve on tracking the inventory<br />
of storm water management and pond inspections, erosion control and preconstruction meetings in coordination with<br />
the Community Development Engineer. The Program will continue to assist in filtering information, responding to<br />
inquiries and assisting owners in achieving property maintenance compliance that reassures the high quality<br />
appearance of the community.<br />
Outcome Measures<br />
2015<br />
Actual<br />
2016<br />
Actual<br />
2017<br />
Estimate<br />
Rating of the property maintenance codes as Good or Excellent as<br />
measured by outside assessment:<br />
Village overall. N/A 90 91 92<br />
Office and commercial areas in the Village. N/A 93 93 93<br />
Residential areas in the Village. N/A 87 89 90<br />
Percent of customer survey respondents rating program as Good or<br />
Excellent.<br />
98 98 98 98<br />
<strong>2018</strong><br />
Target<br />
98
NEIGHBORHOOD SERVICES<br />
Service Level Indicators<br />
2015<br />
Actual<br />
2016<br />
Actual<br />
2017<br />
Estimate<br />
Residential:<br />
Specific Nuisances. 16 3 3<br />
General Property Maintenance. 16 18 18<br />
Vegetation/Weeds & Grass/Landscape<br />
Maintenance/Visibility Triangle.<br />
97 60 75<br />
Rubbish/Litter. 25 24 18<br />
Noise Levels. 4 4 4<br />
Grading/Landscaping/Construction Site Maintenance. 42 24 18<br />
Fences. 10 8 9<br />
Signs. 31 40 35<br />
Zone District Violation. 3 0 3<br />
Permit Required/Permit Non-Conforming. 14 12 15<br />
Outdoor Storage. 12 10 14<br />
Accessory Structures. 3 2 4<br />
Customer Service. 3 3 24<br />
Vehicle Parking/Recreational Trailer. 15 12 25<br />
Snow Removal. 28 12 12<br />
Home Occupation. 2 2 5<br />
Total Residential Cases. 322 234 282<br />
Commercial:<br />
Nuisances. 12 3 6<br />
Customer Service. 3 1 1<br />
Property Maintenance/Vegetation/Weeds &<br />
Grass/Landscape Maintenance/Visibility Triangle.<br />
50 40 63<br />
Noise Levels. 5 5 6<br />
Construction Site Maintenance. 6 25 15<br />
Snow Removal. 21 12 11<br />
Zone District Violation. 3 0 9<br />
Outdoor Storage/Display. 5 5 12<br />
Lighting. 1 1 1<br />
Vehicle Parking. 11 11 9<br />
Rubbish/Litter. 9 9 31<br />
Outdoor Dining/Eating. 0 0 4<br />
Permit Required/Permit Non-Conforming. 9 6 13<br />
Signs Removed/Signs Not Allowed/Banners. 86 70 68<br />
Fences. 1 1 2<br />
Graffiti. 1 1 8<br />
Total Commercial Cases. 224 190 189<br />
Residential & Commercial:<br />
Total Cases. 546 424 471<br />
99
NEIGHBORHOOD SERVICES<br />
Expenditure Detail<br />
2016<br />
Audited<br />
Actuals<br />
2017<br />
Amended<br />
<strong>Budget</strong><br />
<strong>2018</strong><br />
<strong>Adopted</strong><br />
<strong>Budget</strong><br />
% Change<br />
Personnel<br />
Regular Wages $ 53,664 $ 55,476 $ 58,196 4.90%<br />
Longevity Service Award 570 635 695 9.45%<br />
Overtime Wages 500 - - 0.00%<br />
Clothing Allowance 100 100 100 0.00%<br />
Social Security 3,302 3,390 3,542 4.48%<br />
Medicare 772 793 828 4.41%<br />
Workers Compensation 534 728 764 4.95%<br />
Retirement Contributions 2,673 2,774 1,490 -46.29%<br />
Medical Insurance 10,934 10,347 11,326 9.46%<br />
Dental Insurance 476 475 475 0.00%<br />
Life/AD&D Insurance 209 202 190 -5.94%<br />
Disability Insurance 165 172 169 -1.74%<br />
Total Personnel 73,899 75,092 77,775 3.57%<br />
Purchased Services<br />
Contracted Services 1,370 4,050 4,050 0.00%<br />
Telecommunication Services 418 400 600 50.00%<br />
Training/Education 1,019 1,063 1,000 -5.93%<br />
Dues/Memberships 45 70 70 0.00%<br />
Mileage/Travel - 35 35 0.00%<br />
Total Purchased Services 2,852 5,618 5,755 2.44%<br />
Supplies/Non-<strong>Capital</strong> Equipment<br />
<strong>Operating</strong> Supplies - 825 75 -90.91%<br />
Non-<strong>Capital</strong> Equipment - 400 - -100.00%<br />
Uniforms/Safety Equipment 104 180 180 0.00%<br />
Total Supplies/Non-<strong>Capital</strong> Equipment 104 1,405 255 -81.85%<br />
Total Expenditures $ 76,855 $ 82,115 $ 83,785 2.03%<br />
Variance Justification<br />
<br />
No notable variances<br />
100
BUILDING SERVICES<br />
Statement of Purpose<br />
The Building Services Program assures that Village owned buildings are safe, clean, and comfortable.<br />
Description<br />
Building Services maintains over 100,500 square feet of space comprising City Hall, Curtis Center for the Arts, the<br />
Maintenance Facility, Fleet Maintenance, and the restrooms at Westland Park, Silo Park, and Village Greens Park. The<br />
program is also responsible for meeting room set-ups in public facilities for internal and external meetings and events.<br />
Finally, the program coordinates and implements office modifications of Village facilities as needed.<br />
Accomplishments<br />
In 2017, Building Services completed the following projects:<br />
Replaced security cameras for City Hall. 24 cameras including all equipment and installation<br />
Replaced chairs and tables in the Main lobby area at City Hall<br />
Replaced seven water fountains with bottle fills. 3 at City Hall, 3 at Public Works and 1 at the Fleet Facility<br />
Replaced 22 tables in the Community Room<br />
Replaced 14 tables in the Maintenance Facility lunchroom<br />
Replaced 55 chairs in the Maintenance Facility lunchroom<br />
Replaced two urinals at Village Greens Park<br />
Replaced the flooring in the Community Development Copy Room<br />
Replaced the flooring in the City Hall lunchroom Room<br />
Replaced the main RTU 1 Roof top HVAC unit at City Hall<br />
Oversee the remodeling of the Police Department front lobby and records area<br />
Goals/Objectives<br />
In <strong>2018</strong>, the program plans to do the following:<br />
Upgrade the HVAC control system throughout City Hall<br />
Replace Gutters on City Hall and the Evidence Building<br />
Replace four urinals, 3 at Westlands Park and 1 at Silo Park<br />
Provide cleaning services directly to the Maintenance Facility and Fleet Building<br />
Provide cleaning services to the remodeled/expanded Curtis Center for the Arts<br />
Provide cleaning services to the new hard-walled bathrooms in the parks<br />
Outcome Measures<br />
2015<br />
Actual<br />
2016<br />
Actual<br />
2017<br />
Estimate<br />
Percent of employees rating Village buildings as Clean. 62 72 70 72<br />
Percent of employees rating Village buildings as Comfortable. 60 72 71 78<br />
Percent of respondents rating program services as Good or Excellent as<br />
measured by Department Survey.<br />
90 98 98 98<br />
Percent of respondents rating cleanliness of Park Shelter/Pavilion as<br />
good or excellent.<br />
85 82 86 90<br />
Percent of respondents rating cleanliness of Park restroom facilities as<br />
good or excellent.<br />
86 82 88 90<br />
Number of accident/claims at Village buildings due to maintenance. 0 0 0 0<br />
<strong>2018</strong><br />
Target<br />
101
BUILDING SERVICES<br />
Service Level Indicators<br />
2015<br />
Actual<br />
2016<br />
Actual<br />
2017<br />
Estimate<br />
Number of service requests. 150 339 335<br />
Number of requests completed within one day. 72 271 290<br />
Number of office modifications requested. 7 6 2<br />
Number of incidents that interrupted Village operations. 3 4 0<br />
Number of meeting room set ups. 596 618 578<br />
Expenditure Detail<br />
2016<br />
Audited<br />
Actuals<br />
2017<br />
Amended<br />
<strong>Budget</strong><br />
<strong>2018</strong><br />
<strong>Adopted</strong><br />
<strong>Budget</strong><br />
% Change<br />
Personnel<br />
Regular Wages $ 253,208 $ 268,082 $ 312,046 16.40%<br />
Longevity Service Award 3,210 4,955 4,035 -18.57%<br />
Overtime Wages 4,148 3,000 5,000 66.67%<br />
Clothing Allowance 1,350 1,000 - -100.00%<br />
Social Security 15,533 16,599 18,965 14.25%<br />
Medicare 3,633 3,882 4,436 14.27%<br />
Workers Compensation 8,303 10,138 11,631 14.73%<br />
Retirement Contributions 17,653 19,503 10,709 -45.09%<br />
Medical Insurance 60,642 63,010 80,434 27.65%<br />
Dental Insurance 2,671 2,964 3,553 19.87%<br />
Insurance Waivers 250 250 250 0.00%<br />
Life/AD&D Insurance 895 971 1,016 4.63%<br />
Disability Insurance 780 832 905 8.77%<br />
Total Personnel 372,276 395,186 452,980 14.62%<br />
Purchased Services<br />
Professional Services 130 - - 0.00%<br />
Contracted Services 2,992 4,750 4,750 0.00%<br />
Repair/Maintenance Services 253,838 223,220 199,620 -10.57%<br />
Disposal/Recycling Services - 1,000 1,000 0.00%<br />
Telecommunication Services 1,768 1,792 2,400 33.93%<br />
Training/Education - 1,300 2,100 61.54%<br />
Total Purchased Services 258,728 232,062 209,870 -9.56%<br />
Supplies/Non-<strong>Capital</strong> Equipment<br />
<strong>Operating</strong> Supplies 54,094 45,200 49,200 8.85%<br />
Non-<strong>Capital</strong> Equipment 40,723 69,700 37,800 -45.77%<br />
Uniforms/Safety Equipment 1,222 3,995 4,360 9.14%<br />
Gas/Electricity 136,546 137,500 146,000 6.18%<br />
Water/Sewer 18,131 18,000 18,000 0.00%<br />
Total Supplies/Non-<strong>Capital</strong> Equipment 250,716 274,395 255,360 -6.94%<br />
<strong>Capital</strong> Outlay<br />
<strong>Capital</strong> Equipment 63,972 106,000 - -100.00%<br />
Total <strong>Capital</strong> Outlay 63,972 106,000 - -100.00%<br />
Total Expenditures $ 945,692 $ 1,007,643 $ 918,210 -8.88%<br />
102
BUILDING SERVICES<br />
Variance Justification<br />
Personnel (+$57,794):<br />
<br />
Salary and Benefits (+$48,701): One additional FTE Facility Services Worker to provide cleaning<br />
services for the Maintenance Facility, Fleet Building, and three new hardwalled bathrooms in the parks<br />
that will be constructed in <strong>2018</strong>.<br />
Purchased Services (-$22,192):<br />
<br />
<br />
<br />
Repair/Maintenance Services (-$31,000): Elimination of contract cleaning services at the Maintenance<br />
Facility and Fleet Building with the transition of this cleaning to the proposed new FTE Facility Services<br />
Worker. The 2019 proposed budget will reflect a reduction of $8,841 for the elimination of the port-o-let<br />
servicing costs for the 3 locations where hardwalled bathrooms are proposed to be fully constructed in<br />
<strong>2018</strong>.<br />
Repair/Maintenance Services (+$3,700): Increased cost of pumping septic system at Village<br />
Greens with addition of additional bathroom.<br />
Repair/Maintenance Services (+$3,700): Increased cost of unclogging drain systems at City<br />
facilities, based on actual costs experienced.<br />
Supplies/Non-<strong>Capital</strong> Equipment (-$19,035):<br />
Non-<strong>Capital</strong> Equipment (-$35,000): Completion of City Hall security camera replacement in 2017.<br />
<br />
<br />
<br />
Non-<strong>Capital</strong> Equipment (-$15,400): Replacement of chairs and tables in City Hall lobby, tables in<br />
Community Room, and table and chairs in Maintenance Facility lunchroom in 2017.<br />
Non-<strong>Capital</strong> Equipment (-$10,500): Replacement of water fountains with bottle fills at City facilities in<br />
2017.<br />
Non-<strong>Capital</strong> Equipment (+$12,000): Installation of new gutters and downspouts at City Hall and<br />
Evidence Building in <strong>2018</strong>.<br />
Non-<strong>Capital</strong> Equipment (+$15,000): Installation of new HVAC controls at City facilities in <strong>2018</strong>.<br />
Non-<strong>Capital</strong> Equipment (+$2,000): Installation of 2 urinals at Village Greens Park completed in 2017.<br />
Installation of 3 urinals in Westlands Park and 1 urinal in Silo Park planned for <strong>2018</strong>.<br />
<br />
<br />
<strong>Operating</strong> Supplies (+$4,000): Increased costs of cleaning supplies.<br />
Gas/Electricity (+$8,500): There is an anticipated increase of 4% for electricity costs for City facilities<br />
based on projections by Xcel Energy.<br />
103
104
PARKS, TRAILS & RECREATION<br />
Statement of Purpose<br />
The Department of Parks, Trails and Recreation assures the provision of personal enjoyment and personal development<br />
through high quality parks, trails, open spaces, recreation and arts programs and community events for Greenwood<br />
Village.<br />
Description<br />
The Department consists of the Administration Program, the Recreation Program, the Cultural Arts Program, the Parks,<br />
Trails and Open Spaces Program, and the Parks and Trails Maintenance Program.<br />
The Administration Program assures the provision of high quality recreation and arts programs, cultural art activities,<br />
community events and parks, trails and open space experiences through the development and achievement of annual<br />
department outcomes.<br />
The Recreation Program provides recreational opportunities through the following services: preschool, youth, teen,<br />
adult and senior recreation programming; community special events; the Recreation Reimbursement program; park<br />
pavilion/shelter permitting; and assignment of athletic playing fields to local youth sports agencies.<br />
The Cultural Arts Program provides programming and operation of the Curtis Center for the Arts. Cultural arts activities<br />
offered throughout the year include: adult and youth art programming; art exhibits and receptions; lectures; and<br />
performing/community art events. Additionally, the Cultural Arts Program supports the Greenwood Village Arts and<br />
Humanities Council with fundraising events and programs for the benefit of public art and community art education.<br />
The Parks, Trails and Open Space Program is responsible for the overall quality of parks, open spaces and trail facilities.<br />
Through collaborative planning and coordination of land acquisition and capital improvement projects, staff ensures that<br />
projects are well coordinated, include public input from residents and appropriate stakeholders, and are designed and<br />
constructed to meet Village standards. Additionally, the Parks, Trails and Open Space Program supports the Parks,<br />
Trails and Recreation Commission’s efforts to make sound recommendations to City Council on parks, trails and open<br />
space issues.<br />
Parks and Trails Maintenance Services is responsible for maintaining aesthetic, clean, safe and useable recreational<br />
areas which include 279 acres of developed parks, 186 acres of open space, 53 acres of streetscape and medians,<br />
over 1 acre of floral beds, and 47 miles of trails.<br />
In addition, the Department is responsible for managing all of the Village capital projects related to parks, trails and open<br />
spaces within the <strong>Capital</strong> <strong>Improvement</strong> Program. The total recreation CIP budget for <strong>2018</strong> is approximately $800,000.<br />
Managing capital projects entails determining project feasibility, developing project scope, facilitating public involvement,<br />
allocation of funding, preparing project proposals, managing the bid process, project scheduling, real-property<br />
acquisition, site preparation, design and construction management, and assuring the completed projects meet intended<br />
outcomes.<br />
105
PARKS, TRAILS & RECREATION<br />
Organizational Chart<br />
Director of Parks,<br />
Trails &<br />
Recreation<br />
Administrative<br />
Supervisor<br />
Administrative<br />
Assistant (0.5)<br />
Recreation<br />
Manager<br />
Cultural Arts<br />
Coordinator<br />
Parks Project<br />
Manager<br />
Parks Manager<br />
Recreation<br />
Coordinators<br />
(2.0)<br />
Assistant<br />
Cultural Arts<br />
Coordinator<br />
Administrative<br />
Assistant (0.5)<br />
Parks Inspector<br />
Maintenance Worker/<br />
Streetscapes Inspector<br />
Seasonal Rec<br />
Aides (1.96)<br />
Senior Rec<br />
Aide (0.17)<br />
Art Instructors/<br />
Models (0.88)<br />
Supervisors (5.0)<br />
Maintenance<br />
Workers (29.0)<br />
Seasonals<br />
(3.05)<br />
106
PARKS, TRAILS & RECREATION<br />
Personnel & Financial Summary<br />
2016<br />
Audited<br />
Actuals<br />
2017<br />
Amended<br />
<strong>Budget</strong><br />
<strong>2018</strong><br />
<strong>Adopted</strong><br />
<strong>Budget</strong><br />
% Change<br />
Staff - Full Time Equivalency (FTE): 52.06 52.06 52.06 0.00%<br />
Expenditures By Category:<br />
Personnel $ 3,659,752 $ 3,966,689 $ 3,894,186 -1.83%<br />
Purchased Services 1,180,122 1,563,333 1,518,336 -2.88%<br />
Supplies/Non-<strong>Capital</strong> Equipment 886,150 1,033,506 952,409 -7.85%<br />
<strong>Capital</strong> Outlay 168,495 163,785 172,775 5.49%<br />
Miscellaneous Expenditures 566,943 580,256 580,256 0.00%<br />
Total Expenditures $ 6,461,462 $ 7,307,569 $ 7,117,962 -2.59%<br />
Expenditures By Division:<br />
Administration $ 280,865 $ 315,704 $ 299,290 -5.20%<br />
Recreation 1,134,928 1,165,340 1,181,219 1.36%<br />
Cultural Arts 282,571 401,862 439,330 9.32%<br />
Parks, Trails & Open Space 210,473 289,731 217,824 -24.82%<br />
Developed Parks 2,245,734 2,536,357 2,474,286 -2.45%<br />
Streetscapes, Medians & Trails 1,311,247 1,517,784 1,432,654 -5.61%<br />
Open Space & Urban Forestry 696,655 797,001 773,919 -2.90%<br />
Small Engine Equipment 272,682 248,355 259,905 4.65%<br />
Parks & Trails Snow Removal 26,307 35,435 39,535 11.57%<br />
Total Expenditures $ 6,461,462 $ 7,307,569 $ 7,117,962 -2.59%<br />
Expenditures & Full-Time Equivalency<br />
Expenditures<br />
$7,400,000<br />
$7,200,000<br />
$7,000,000<br />
$6,800,000<br />
$6,600,000<br />
$6,400,000<br />
$6,200,000<br />
$6,000,000<br />
2016<br />
Audited<br />
Actuals<br />
2017<br />
Amended<br />
<strong>Budget</strong><br />
<strong>2018</strong><br />
<strong>Adopted</strong><br />
<strong>Budget</strong><br />
60.00<br />
50.00<br />
40.00<br />
30.00<br />
20.00<br />
10.00<br />
-<br />
Full-Time Equivalent (FTE)<br />
Total Expenditures<br />
Staff - Full Time Equivalency (FTE):<br />
107
PARKS, TRAILS & RECREATION<br />
Explanation of <strong>Budget</strong> Variances<br />
For the <strong>2018</strong> budget, the Parks, Trails and Recreation Department budget is relatively flat with increases in some areas<br />
being balanced by decreases in others.<br />
There is an overall increase in the temporary/seasonal wages for the Department in the amount of $12,936 due to increase<br />
in hourly rates. Most of the increase is attributed to the Recreation program increasing by $11,056 due to minimum wage<br />
raising from $9.30/hour to $10.20/hour for recreation aides through the year to assist with special events and recreation<br />
and art programming.<br />
The Arts and Humanities Council (GVAHC) budget and the Scientific and Cultural Facilities District (SCFD) grant funding<br />
is incorporated into the Cultural Arts Program. GVAHC is showing an increase of $5,000 to allow for their contribution in<br />
rotating public art at Westlands in partnership with the Museum of Outdoor Art. Additionally, there is SCFD funding<br />
budgeted for a kiln in capital equipment equaling $6,000. This will allow for pottery classes which has been a long-time<br />
request from Curtis patrons.<br />
A significant decrease of $88,000 is being made in the water budget in the developed parks program. The budget had<br />
been increased in past years due to lower than average rainfall. Since this has not been experienced since 2012, the<br />
budget was reduced to reflect historic spending for the last 5 years plus a predicted 4% increase by providers. This results<br />
in a significant decrease in the overall Department budget. Conversely, the electric budget was increased by $11,000 to<br />
reflect historic use plus a predicted 4% increase by providers.<br />
108
PARKS, TRAILS & RECREATION<br />
Expenditure Detail<br />
2016<br />
Audited<br />
Actuals<br />
2017<br />
Amended<br />
<strong>Budget</strong><br />
<strong>2018</strong><br />
<strong>Adopted</strong><br />
<strong>Budget</strong><br />
% Change<br />
Personnel<br />
Regular Wages $ 2,455,975 $ 2,680,038 $ 2,642,052 -1.42%<br />
Seasonal/Temporary Wages 158,005 173,725 186,661 7.45%<br />
Longevity Service Award 31,355 35,410 33,380 -5.73%<br />
Overtime Wages 85,748 67,196 74,480 10.84%<br />
Clothing Allowance 6,700 7,600 7,400 -2.63%<br />
Communication Allowance 3,710 5,040 5,880 16.67%<br />
Vehicle Allowance 3,600 3,600 3,600 0.00%<br />
Social Security 166,455 179,496 175,922 -1.99%<br />
Medicare 38,439 37,572 38,386 2.17%<br />
Workers Compensation 69,535 83,749 81,087 -3.18%<br />
Retirement Contributions 173,328 201,406 99,824 -50.44%<br />
Medical Insurance 421,920 443,987 498,176 12.21%<br />
Dental Insurance 20,732 23,107 24,062 4.13%<br />
Insurance Waivers 7,851 6,750 7,000 3.70%<br />
Life/AD&D Insurance 8,874 9,707 8,611 -11.29%<br />
Disability Insurance 7,525 8,306 7,665 -7.72%<br />
Total Personnel 3,659,752 3,966,689 3,894,186 -1.83%<br />
Purchased Services<br />
Professional Services 37,430 109,550 38,550 -64.81%<br />
Contracted Services 840,904 1,111,953 1,127,207 1.37%<br />
Catering/Dining Services 6,183 9,970 14,850 48.95%<br />
Repair/Maintenance Services 177,026 174,645 172,650 -1.14%<br />
Disposal/Recycling Services 3,290 1,390 1,390 0.00%<br />
Telecommunication Services 8,504 9,744 11,349 16.47%<br />
Postage/Shipping Services 6,262 9,800 11,200 14.29%<br />
Advertising/Notification Services 720 4,250 5,000 17.65%<br />
Printing/Publication Services 20,370 35,710 35,910 0.56%<br />
Training/Education 31,577 43,025 44,040 2.36%<br />
Dues/Memberships 5,047 7,198 7,120 -1.08%<br />
Mileage/Travel 630 328 300 -8.54%<br />
Rentals/Leases 42,179 45,770 48,770 6.55%<br />
Total Purchased Services 1,180,122 1,563,333 1,518,336 -2.88%<br />
Supplies/Non-<strong>Capital</strong> Equipment<br />
Office Supplies 4,512 2,750 2,750 0.00%<br />
<strong>Operating</strong> Supplies 442,401 494,580 488,230 -1.28%<br />
Non-<strong>Capital</strong> Equipment 44,737 32,102 31,245 -2.67%<br />
Uniforms/Safety Equipment 22,187 35,074 38,184 8.87%<br />
Gas/Electricity 76,665 69,000 80,000 15.94%<br />
Water/Sewer 295,648 400,000 312,000 -22.00%<br />
Total Supplies/Non-<strong>Capital</strong> Equipment 886,150 1,033,506 952,409 -7.85%<br />
<strong>Capital</strong> Outlay<br />
<strong>Capital</strong> Equipment 168,495 163,785 172,775 5.49%<br />
Total <strong>Capital</strong> Outlay 168,495 163,785 172,775 5.49%<br />
Miscellaneous Expenditures<br />
Contributions/Donations 10,275 10,800 10,800 0.00%<br />
Community Incentives 556,668 569,456 569,456 0.00%<br />
Total Miscellaneous Expenditures 566,943 580,256 580,256 0.00%<br />
Total Expenditures $ 6,461,462 $ 7,307,569 $ 7,117,962 -2.59%<br />
109
ADMINISTRATION<br />
Statement of Purpose<br />
The Administration Program assures high quality department outcomes.<br />
Description<br />
The Administration Program assures that programs, activities, parks and trails, exhibits and community events support<br />
the department outcomes of personal development and personal enjoyment. The program conserves and preserves<br />
land in the Village for the enjoyment of Village residents as parks, trails and open spaces through the acquisition of<br />
land. Additionally, the program is responsible for the application and reporting of grants.<br />
Accomplishments<br />
In 2017, the Parks, Trails and Recreation department continued to support community events, youth and adult art and<br />
recreation programs, planning and implementing park projects and parks maintenance. The Village received an<br />
Arapahoe County Open Spaces planning grant of $40,000 for the Greenwood Gulch Trail Undercrossing at Orchard<br />
Road feasibility study. In addition, staff applied to Arapahoe County Open Spaces for Joint Project funding of $800,000<br />
to construct Phase IV of the Village Greens North Master Plan and for a small grant of $97,500 to construct an extension<br />
to the Carson Skatepark through their fall grant cycle. Department staff looked at how department outcomes were<br />
measured and determined that overall, they accurately reflected outcomes; % of capacity was added to the program<br />
reporting so that staff could easily determine which classes to build on and which might need a hiatus.<br />
Goals/Objectives<br />
In <strong>2018</strong>, the department will continue to seek grant funding from Arapahoe County Open Spaces. The department will<br />
implement a new online registration system through CivicRec for <strong>2018</strong> classes which will replace the existing ASAP<br />
program. Changing to the new program will allow for the department to also offer online park permitting and special<br />
event ticketing through the online CivicRec system as well which would greatly increase customer service.<br />
Outcome Measures<br />
2015<br />
Actual<br />
2016<br />
Actual<br />
2017<br />
Estimate<br />
Percent of respondents rating the diversity of Recreation and<br />
Cultural Arts Programs as Good or Excellent as measured by the N/A* 80 N/A* 85<br />
Village Citizen Survey.<br />
Percent of respondents indicating that participating in Community<br />
Events enhanced their sense of community as Good or Excellent 95 95 95 95<br />
as measured by the department Survey.<br />
Percent of respondents rating the Village’s parks, trails and open<br />
spaces as Good or Excellent as measured by the Village Citizen N/A* 95 N/A* 95<br />
Survey.<br />
Percentage of department objectives achieved. 95 95 95 95<br />
*Survey not conducted.<br />
<strong>2018</strong><br />
Target<br />
110
ADMINISTRATION<br />
Expenditure Detail<br />
2016<br />
Audited<br />
Actuals<br />
2017<br />
Amended<br />
<strong>Budget</strong><br />
<strong>2018</strong><br />
<strong>Adopted</strong><br />
<strong>Budget</strong><br />
% Change<br />
Personnel<br />
Regular Wages $ 195,613 $ 216,000 $ 206,529 -4.38%<br />
Seasonal/Temporary Wages 1,257 - - 0.00%<br />
Longevity Service Award 1,095 1,220 1,340 9.84%<br />
Overtime Wages 3,952 5,472 5,460 -0.22%<br />
Communication Allowance 490 840 840 0.00%<br />
Vehicle Allowance 3,600 3,600 3,600 0.00%<br />
Social Security 11,997 13,553 13,005 -4.04%<br />
Medicare 2,806 3,203 3,041 -5.06%<br />
Workers Compensation 3,342 4,029 4,195 4.12%<br />
Retirement Contributions 14,693 16,929 8,462 -50.01%<br />
Medical Insurance 36,345 34,338 36,425 6.08%<br />
Dental Insurance 1,808 1,808 1,759 -2.71%<br />
Life/AD&D Insurance 643 783 674 -13.92%<br />
Disability Insurance 575 670 599 -10.60%<br />
Total Personnel 278,216 302,445 285,929 -5.46%<br />
Purchased Services<br />
Catering/Dining Services 535 2,350 2,350 0.00%<br />
Printing/Publication Services 1,553 4,000 4,000 0.00%<br />
Training/Education 155 4,710 4,700 -0.21%<br />
Dues/Memberships 345 1,401 1,541 9.99%<br />
Mileage/Travel 18 28 - -100.00%<br />
Total Purchased Services 2,606 12,489 12,591 0.82%<br />
Supplies/Non-<strong>Capital</strong> Equipment<br />
Office Supplies 43 200 200 0.00%<br />
<strong>Operating</strong> Supplies - 300 300 0.00%<br />
Uniforms/Safety Equipment - 270 270 0.00%<br />
Total Supplies/Non-<strong>Capital</strong> Equipment 43 770 770 0.00%<br />
Total Expenditures $ 280,865 $ 315,704 $ 299,290 -5.20%<br />
Variance Justification<br />
Purchased Services (+$102):<br />
<br />
<br />
Dues/Memberships (+$140): Increase due to upgrading to department wide memberships. Savings<br />
recognized in other programs.<br />
Mileage/Travel (-$28): Eliminated due to lack of use.<br />
111
RECREATION<br />
Statement of Purpose<br />
The Recreation Program contributes to personal development and personal enjoyment and fosters a sense of<br />
community.<br />
Description<br />
The Recreation Program encourages the participation of Village residents in pee wee and youth recreation activities,<br />
adult sport programs and community events.<br />
Accomplishments<br />
In 2017, staff offered 49 recreation activities that included pee wee, youth, and adult recreation programs providing<br />
personal enjoyment to over 2,700 participants. Fun in the Sun was extremely popular with 188 children on the waiting<br />
list. The most popular activities included: Wet ‘N’ Wild, Archery, Super Science and Fort Building. Staff offered 23<br />
different themed days at Silo Park with attendance similar to 2016 with 951 c<strong>amp</strong>ers. There was a slight increase in<br />
adult sport attendance in 2017. Volleyball, softball and kickball at Village Greens Park during the summer months totaled<br />
79 teams or 2,280 participants as compared to 75 teams in 2016. Fall youth sports included: pee wee soccer and pee<br />
wee golf, youth flag football, indoor peewee basketball and youth basketball. Attendance remained steady in 2017 with<br />
107 participants. Staff continues to partner with Cherry Creek School District in the winter months allowing for gym<br />
space at C<strong>amp</strong>us Middle School. During the winter and spring months staff hosted youth programs to include: Game<br />
Nights, March Dodgeball Madness, Soccer and Basketball. Attendance increased by 30 participants due to the inaugural<br />
dodgeball tournament.<br />
Community event participation increased slightly in 2017 based on the popularity of the Egg Hunt and Fallfest. The Egg<br />
Hunt was moved in its second year over from William McKinley Carson Park to Westlands Park. Attendance jumped<br />
from 300 in 2016 to over 500 participants in 2017. Recreation staff partnered with the police department to host Metro<br />
Public Safety Day at City Hall in the spring. Over 18 agencies from the safety community were represented with over<br />
200 participants enjoying the event. “Tri R Village” Youth Triathlon celebrated its 10 year anniversary in 2017 with<br />
maximum attendance of 300 athletes. This event is cosponsored by the Greenwood Athletic and Tennis Club (GATC)<br />
and continues to provide both a healthy event and strong relationship building with GATC staff members. Greenwood<br />
Village Day continues to be the most popular special event in the Village with over 6,000 residents enjoying a fun-filled<br />
day followed by a beautiful fireworks display. Arapahoe County continues to provide a donation of $3,000 towards the<br />
fireworks.<br />
In 2017, a tennis court at Orchard Hills Park was striped to include both tennis court boundaries and pickle ball<br />
boundaries. Staff taught a pickle ball clinic with six residents in attendance. Staff will continue to look at additional<br />
opportunities, such as pickleball clinics and tournaments as the need arises.<br />
Senior fitness equipment was also added to Curtis Park that provided an additional opportunity for the senior population.<br />
Senior programming attendance has increased slightly with the Focus 50+ group. The Harmonikats performed at<br />
Brookdale Senior Living Center and the Curtis Dancers performed their “Age of Music” at Aspen Academy in 2017.<br />
Average senior attendance increased to 32 active seniors every Monday in 2017 compared to 19 in 2016.<br />
In 2017, staff worked with all departments in the Village and created a new process for special event permitting. Civic<br />
Plus, the Village website, was used to create a more efficient and transparent process for permit applicants. There were<br />
16 special event permit requests in 2017.<br />
Goals/Objectives<br />
In <strong>2018</strong>, staff will continue to evaluate programming and make necessary changes based upon popularity, trends and<br />
evaluations. Staff will research new ideas for one-day events as well as opportunities that enhance community<br />
relationships.<br />
112
RECREATION<br />
Outcome Measures<br />
Adult Programs:<br />
Percent of respondents rating the personal enjoyment received from<br />
sports sessions as Good or Excellent as measured by the department<br />
Survey.<br />
Community Events:<br />
Percent of respondents rating the personal enjoyment received from<br />
community events as Good or Excellent as measured by the department<br />
Survey.<br />
Percent of respondents rating their participation at events enhanced their<br />
sense of community as Good or Excellent as measured by the<br />
department Survey.<br />
Youth Programs:<br />
Percent of respondents rating the personal enjoyment received from<br />
programs as Good or Excellent as measured by the department Survey.<br />
Percent of respondents who indicate their skill development has<br />
improved to Good or Excellent as measured by the department Survey.<br />
2015<br />
Actual<br />
2016<br />
Actual<br />
2017<br />
Estimate<br />
<strong>2018</strong><br />
Target<br />
100 100 100 100<br />
100 100 100 100<br />
100 100 100 100<br />
100 100 100 100<br />
100 100 100 100<br />
Service Level Indicators<br />
2015<br />
Actual<br />
2016<br />
Actual<br />
2017<br />
Estimate<br />
Number of season long field permits issued. 60 65 56<br />
Number of youth sports sessions. 44 45 43<br />
Attendance at youth sport events. 1,395 1,229 1,748<br />
Number of adult sport sessions. 6 6 6<br />
Attendance at adult sport sessions. 1,604 1,123 993<br />
Number of participants on youth sport waiting lists. 75 140 206<br />
Number of participants on adult sport waiting lists. 0 0 0<br />
Number of youth sport classes cancelled due to lack of attendance. 1 0 0<br />
Number of adult sport classes cancelled due to lack of attendance. 0 0 0<br />
Attendance at community events (estimate). 8,630 8,945 8,975<br />
Recreation Reimbursement Program:<br />
Number/percent of households participating.<br />
1,450/ 1,458/ 1,475/<br />
23% 23% 23%<br />
Number/percent reaching $500 maximum. 815/56% 829/57% 785/53%<br />
Average reimbursement per participating household. $375 $375 $350<br />
GATC membership/classes dollar amount/percent of total<br />
reimbursement.<br />
$400,000/<br />
73%<br />
$393,526<br />
72%<br />
$400,000<br />
73%<br />
113
RECREATION<br />
Expenditure Detail<br />
2016<br />
Audited<br />
Actuals<br />
2017<br />
Amended<br />
<strong>Budget</strong><br />
<strong>2018</strong><br />
<strong>Adopted</strong><br />
<strong>Budget</strong><br />
% Change<br />
Personnel<br />
Regular Wages $ 213,265 $ 194,948 $ 201,407 3.31%<br />
Seasonal/Temporary Wages 21,082 34,593 45,649 31.96%<br />
Longevity Service Award 2,635 2,695 2,755 2.23%<br />
Overtime Wages 35,122 37,100 37,100 0.00%<br />
Communication Allowance - - 420 100.00%<br />
Social Security 14,783 16,452 17,507 6.41%<br />
Medicare 3,457 3,848 4,095 6.42%<br />
Workers Compensation 7,199 8,620 9,053 5.02%<br />
Retirement Contributions 14,409 14,172 8,251 -41.78%<br />
Medical Insurance 29,857 26,384 28,891 9.50%<br />
Dental Insurance 1,392 1,310 1,310 0.00%<br />
Insurance Waivers 242 - - 0.00%<br />
Life/AD&D Insurance 774 706 656 -7.08%<br />
Disability Insurance 678 604 585 -3.15%<br />
Total Personnel 344,895 341,432 357,679 4.76%<br />
Purchased Services<br />
Contracted Services 94,913 102,476 101,006 -1.43%<br />
Catering/Dining Services 707 780 1,000 28.21%<br />
Telecommunication Services 1,477 1,968 1,200 -39.02%<br />
Advertising/Notification Services - 150 - -100.00%<br />
Printing/Publication Services 8,398 11,910 11,910 0.00%<br />
Training/Education 1,214 1,500 1,500 0.00%<br />
Dues/Memberships 929 697 697 0.00%<br />
Rentals/Leases 41,381 40,570 40,570 0.00%<br />
Total Purchased Services 149,019 160,051 157,883 -1.35%<br />
Supplies/Non-<strong>Capital</strong> Equipment<br />
Office Supplies 20 - - 0.00%<br />
<strong>Operating</strong> Supplies 84,024 93,604 95,404 1.92%<br />
Uniforms/Safety Equipment 302 797 797 0.00%<br />
Total Supplies/Non-<strong>Capital</strong> Equipment 84,346 94,401 96,201 1.91%<br />
Miscellaneous Expenditures<br />
Community Incentives 556,668 569,456 569,456 0.00%<br />
Total Miscellaneous Expenditures 556,668 569,456 569,456 0.00%<br />
Total Expenditures $ 1,134,928 $ 1,165,340 $ 1,181,219 1.36%<br />
114
RECREATION<br />
Variance Justification<br />
Personnel (+$11,476):<br />
<br />
<br />
Seasonal/Temporary Wages (+$11,056): Increase due to minimum wage going up from $9.30/hour to<br />
$10.20/hour.<br />
Communication Allowance (+420): Addition due to one Recreation Coordinator moving from City<br />
issued phone to allowance.<br />
Purchased Services (-$2,168):<br />
<br />
<br />
<br />
<br />
Contracted Services (-$1,470): Net decrease do to the transition from ASAP to CivicRec as the online<br />
registration program provider. Not only will the overall cost of services go down slightly, the cost of this<br />
service (- $5000) was moved from the Recreation Program budget to the STS budget. Part of this<br />
decrease was offset by an increase of $2,000 for lighting at the Mayor’s Holiday Lighting and an increase<br />
of $1,530 to cover South Metro Fire permit fees that had been waived in the past.<br />
Catering/Dining Services (+$220): Slight increase to accommodate increased participation in the<br />
Senior 50+ program from 19 participants each week to 32 participants.<br />
Telecommunication Services (-$768): Decrease through shift by one recreation coordinator moving to<br />
smart phone use and one to an allowance as opposed to each having tablets with data plans for remote<br />
access to online enrollment program.<br />
Advertising/Notification Service (-$150): Eliminated due to lack of need.<br />
Supplies/Non-<strong>Capital</strong> Equipment (+ $1,800):<br />
<br />
<strong>Operating</strong> Supplies (+$1,800): Increase due to $2/person increase in lunch budget for Fall Fest to<br />
maintain expected quality by attendees.<br />
115
CULTURAL ARTS<br />
Statement of Purpose<br />
The Cultural Arts Program contributes to personal development and personal enjoyment and fosters a sense of<br />
community.<br />
Description<br />
The Cultural Arts Program encourages the participation of residents in the arts through art exhibits, receptions and<br />
lectures, art education, youth and adult art classes and community events, primarily at the Curtis Center for the Arts.<br />
Staff works directly with the Greenwood Village Arts and Humanities Council (GVAHC) on fundraising events for the<br />
benefit of art programs and public art to enhance the Village’s cultural identity.<br />
Accomplishments<br />
It was an exciting year for the Greenwood Village Cultural Arts program and particularly for the Curtis Center for the<br />
Arts. The Curtis Center went through a major renovation in 2017. Most significantly two restrooms were added to the<br />
main floor. In addition, the restrooms on the lower lever were remodeled, a r<strong>amp</strong> replaced the stairs to the restrooms<br />
on the lower level, the front offices were re-configured, additional storage was added below the new restrooms on the<br />
main floor and the entire roof was replaced. The updates refreshed the overall look of the Center and will make it more<br />
customer friendly.<br />
Another big change for 2017 is that the Center is now open on Saturdays from 10 am – 4 pm. These expanded hours<br />
brought in new visitors that were not able to visit during the normal business hours of M-F 8:30 am - 4:30 pm.<br />
Additionally, being open on Saturdays has allowed the Center to expand class offerings by holding one-day workshops<br />
at a time it would normally be closed. The additional weekend hours has helped to expand student enrollment and<br />
attendees to the Center.<br />
Due to construction, the Curtis Center for the Arts only hosted five exhibits this year. The year kicked off with a take on<br />
modern western art with “New Frontier”. The exhibit garnered an excellent write up in the Denver Post. An artist talk<br />
with Maura Allen was also held as part of the exhibit. The Center celebrated Youth Art Month with its annual exhibit of<br />
work from area schools. Two receptions with approximately 500 people in attendance at each were held as part of the<br />
exhibit. In March the Center participated in the bi-annual Month of Photography that takes place around the Denver<br />
metro area. The Center hosted photographer Richard Peterson who displayed his recent work as well as his rock-n-roll<br />
portraits. Richard also held a talk about his work with 30 people in attendance. In May, the Center presented Continuum,<br />
an exhibit of local artists that often collaborate together. The exhibit featured the work of a Curtis instructor. The year<br />
closed out with the 34 th <strong>Annual</strong> All Colorado Exhibit that featured over 50 Colorado artists. In addition to these exhibits<br />
the Cultural Arts Program also hosted an exhibit at City Hall called “The Art of Lake of Fire”. The exhibit featured work<br />
that portrayed themes from the Village Read book, Lake of Fire.<br />
The Cultural Arts Program hosted several cultural events throughout the year. Most significant was the introduction of<br />
the Village Read. The Cultural Arts program partnered with the Arapahoe County Library District to encourage<br />
community members to read the same book and attend the many activities and events related to themes from the book.<br />
For this, the first year, “Lake of Fire” by Colorado author Mark Stevens was chosen as the Village Read book. Eleven<br />
events were held for the program and included guest speakers, writer’s workshops and book clubs. The program<br />
concluded with a concert at Curtis Park.<br />
For the second year in a row, the Cultural Arts Program hosted “Winter’s Glow”. The event featured ice carvers, fire<br />
dancers and light inspired vignettes. Added to the line-up this year were giant inflatable sculptures by local artist Nicole<br />
Bannowetz and a performance by sculpture Erik Reiger. Over 600 community members attended the event in 2017.<br />
Other events presented by the Cultural Arts Program included the annual concert in the park with the Colorado Honor<br />
Band and the Colorado Wind Ensemble. About 250 people were in attendance. The art program also hosted a book talk<br />
about Mindful Eating with author Lynn Rossy. 27 community members attended the talk at Keolbel Library. Also for the<br />
first time, the Cultural Arts Program partnered with the Recreation program and area restaurants to present “Party on<br />
the Plaza” a free concert at Village Center Station Plaza. The idea was to create a free event that would help draw<br />
people to the Village Center Station and encourage the use of the space as a community gathering spot. The event<br />
drew about 100 people. The program also assisted with other Village programming providing art projects at GV Day,<br />
116
CULTURAL ARTS<br />
Fall Fest and the Mayor’s Holiday Lighting. The program also coordinated the popular Art in the Park summer program.<br />
All Art in the Park programs were full with a waiting list for most of them.<br />
Also in 2017, the Cultural Arts Program partnered with The Museum of Outdoor Arts to bring additional sculptures to<br />
Westlands Park. The program presented the works of Colorado artists and father-son team Chuck and Collin Parson.<br />
The collaboration brought two works by Collin Parson and three works by Chuck Parson. The works will be on display<br />
at the park through the summer of <strong>2018</strong>. The hope is to continue this partnership and bring rotating sculptures to the<br />
park on an annual basis.<br />
Due to construction at the Curtis Center for the Arts several classes had to be cancelled. No classes were held at the<br />
Curtis from June until October. However due to being open on Saturdays the center offered some additional one day<br />
workshops including “Coffee and Canvas” sessions once a month, Silk Painting, Paper Collage and Pastels. In addition,<br />
the Center offered evening classes for youth. The program expanded its pee wee art offerings and most classes were<br />
full. In addition, the program partnered with Pop Culture Classroom to offer classes to teens. The classes focused on<br />
drawing super heroes and ‘manga”. While this is often a hard market to tap, the classes were very successful and most<br />
were to full capacity.<br />
Goals/Objectives<br />
In <strong>2018</strong>, staff will continue to expand class offerings on Saturdays during the times that the Center is open. As requested<br />
by our community members in the past, plans are to purchase a kiln in <strong>2018</strong> with SCFD funds which will greatly expand<br />
educational opportunities. Staff will also look for ways to expand cultural offerings to the Greenwood Village Community<br />
through special events. Due to their success, the Winter’s Glow event and the Village Read program will continue in<br />
<strong>2018</strong> and likely become annual programs. There are also plans in <strong>2018</strong> to continue the partnership with the Museum of<br />
Outdoor Arts and implement additional rotating public art in Westlands Park. $34,800 in SCFD grant funding has been<br />
awarded for use in <strong>2018</strong> to support cultural offerings to the community including concerts, performances, special events<br />
and lectures.<br />
Outcome Measures<br />
Youth Art Classes:<br />
Percent of respondents rating the personal enjoyment received from<br />
programs as Excellent or Good as measured by department survey.<br />
Percent of respondents who indicated their personal development<br />
received from programs as Excellent or Good as measured by<br />
department survey.<br />
Adult Art Classes:<br />
Percent of respondents rating the personal enjoyment received from<br />
classes as Excellent or Good measured by department survey.<br />
Percent of respondents who indicated their personal development<br />
received from programs as Excellent or Good as measured by<br />
department survey.<br />
Exhibits:<br />
Percent of respondents rating personal enjoyment received from<br />
programs as Good or Excellent as measured by department survey.<br />
Community Events:<br />
Percent of respondents who indicate their personal enjoyment received<br />
from community events as Excellent or Good as measured by<br />
department survey.<br />
Percent of respondents rating their participation in events enhanced<br />
their sense of community as Excellent or Good as measured by<br />
department survey.<br />
2015<br />
Actual<br />
2016<br />
Actual<br />
2017<br />
Estimate<br />
<strong>2018</strong><br />
Target<br />
100 100 100 100<br />
100 100 100 100<br />
95 95 95 95<br />
95 95 95 95<br />
100 100 100 100<br />
95 95 95 95<br />
95 95 95 95<br />
117
CULTURAL ARTS<br />
Service Level Indicators<br />
2015<br />
Actual<br />
2016<br />
Actual<br />
2017<br />
Estimate<br />
Number of adult art classes/activities. 73 58 39*<br />
Attendance at adult art classes/activities. 1,157** 1,190** 1,224**<br />
Number of adult art participants on the waiting list. 7 10 10<br />
Number of adult art classes cancelled due to lack of attendance. 4 4 4<br />
Number of youth art classes. 61 64 60<br />
Attendance at youth art classes. 1,067 1,036 771<br />
Number of youth art participants on the waiting list. 70 43<br />
129 (Art in<br />
the Park)<br />
Number of youth art classes cancelled due to lack of attendance. 0 1 5<br />
Number of adult art exhibits. 8 7 5<br />
Number of community events. 7 8 11<br />
Attendance at community events. 1,240 1,690 1,865<br />
Number of grants received. 1 1 1<br />
* Number of Classes down in 2017 due to the renovation of the Curtis Center for the Arts.<br />
**Senior activities are included in this number.<br />
118
CULTURAL ARTS<br />
Expenditure Detail<br />
2016<br />
Audited<br />
Actuals<br />
2017<br />
Amended<br />
<strong>Budget</strong><br />
<strong>2018</strong><br />
<strong>Adopted</strong><br />
<strong>Budget</strong><br />
% Change<br />
Personnel<br />
Regular Wages $ 79,064 $ 121,008 $ 145,950 20.61%<br />
Seasonal/Temporary Wages 57,871 63,132 63,732 0.95%<br />
Longevity Service Award 535 595 655 10.08%<br />
Overtime Wages 549 1,520 1,520 0.00%<br />
Communication Allowance 210 600 420 -30.00%<br />
Social Security 8,456 11,346 12,209 7.61%<br />
Medicare 1,978 2,653 2,855 7.61%<br />
Workers Compensation 174 302 308 1.99%<br />
Retirement Contributions 2,419 7,624 5,668 -25.66%<br />
Medical Insurance 11,722 20,799 31,064 49.35%<br />
Dental Insurance 642 1,064 1,759 65.32%<br />
Insurance Waivers 250 - - 0.00%<br />
Life/AD&D Insurance 160 437 475 8.70%<br />
Disability Insurance 219 375 424 13.07%<br />
Total Personnel 164,249 231,455 267,039 15.37%<br />
Purchased Services<br />
Professional Services 5,324 3,550 8,550 140.85%<br />
Contracted Services 40,233 55,205 47,929 -13.18%<br />
Catering/Dining Services 3,806 6,840 11,500 68.13%<br />
Telecommunication Services 335 600 432 -28.00%<br />
Postage/Shipping Services 6,262 9,800 11,200 14.29%<br />
Advertising/Notification Services 720 4,100 5,000 21.95%<br />
Printing/Publication Services 10,395 19,800 20,000 1.01%<br />
Training/Education - 1,375 1,500 9.09%<br />
Dues/Memberships 595 600 600 0.00%<br />
Mileage/Travel 130 300 300 0.00%<br />
Total Purchased Services 67,800 102,170 107,011 4.74%<br />
Supplies/Non-<strong>Capital</strong> Equipment<br />
Office Supplies 1,584 700 700 0.00%<br />
<strong>Operating</strong> Supplies 37,863 50,430 47,380 -6.05%<br />
Non-<strong>Capital</strong> Equipment 800 5,917 - -100.00%<br />
Uniforms/Safety Equipment - 390 400 2.56%<br />
Total Supplies/Non-<strong>Capital</strong> Equipment 40,247 57,437 48,480 -15.59%<br />
<strong>Capital</strong> Outlay<br />
<strong>Capital</strong> Equipment - - 6,000 100.00%<br />
Total <strong>Capital</strong> Outlay - - 6,000 100.00%<br />
Miscellaneous Expenditures<br />
Contributions/Donations 10,275 10,800 10,800 0.00%<br />
Total Miscellaneous Expenditures 10,275 10,800 10,800 0.00%<br />
Total Expenditures $ 282,571 $ 401,862 $ 439,330 9.32%<br />
119
CULTURAL ARTS<br />
Variance Justification<br />
Personnel (+$600):<br />
Seasonal/Temporary Wages (+$600): Increase due to the addition of a pottery instructor. The<br />
basement addition in 2017 allows for the addition of a kiln and pottery classes which has been a long<br />
time request from Curtis patrons.<br />
Purchased Services (+$4,838):<br />
<br />
<br />
<br />
<br />
<br />
<br />
<br />
<br />
Professional Services (+$5,000): Increase in the Arts and Humanities Council budget to cover<br />
installation costs related to rotating public art installations as their contribution to partnerships.<br />
Contracted Services (-$7,276): Decrease to reflect historic use of accounts. A portion of this amount<br />
was moved to Catering/Dining Services, Advertising/Notifications Services, and Printing/Publication<br />
Services to accurately reflect needed services to support Curtis Center programming.<br />
Catering/Dining Services (+$4,660): Increase due to shift of budget from contracted services to reflect<br />
historic use.<br />
Telecommunication Services (-$168): Decrease due to smartphone use as opposed to tablet for<br />
remote online registration access.<br />
Postage/Shipping Services (+$1,400): Increase to cover expanded mailing list based on requests from<br />
patrons to receive mailings throughout the year.<br />
Advertising/Notification Services (+$900): Increase due to shift of budget from contracted services to<br />
reflect historic use and future needs in marketing.<br />
Printing/Publication Services (+200): Increase due to shift of budget from contracted services to<br />
reflect historic use and future needs in marketing.<br />
Training/Education (+$125): Slight increase to allow for additional attendance by staff at a national<br />
conference that will be held locally in <strong>2018</strong>.<br />
Supplies/Non-<strong>Capital</strong> Equipment (-$8,957):<br />
<br />
<br />
<br />
<strong>Operating</strong> Supplies (-$3,050): Decrease to reflect shift from purchased and prepared food for<br />
receptions to be catered for a more professional outcome.<br />
Non-<strong>Capital</strong> Equipment (-$5,917): Moved to <strong>Capital</strong> Equipment due to nature of proposed purchase.<br />
Uniforms/Safety Equipment (+$10): Slight increase due to pricing increases.<br />
<br />
<strong>Capital</strong> Outlay (+$6,000): Increase for purchase of kiln out of SCFD grant funding.<br />
120
PARKS, TRAILS & OPEN SPACE<br />
Statement of Purpose<br />
The Parks, Trails and Open Space Program ensures high quality planning, design and construction of parks, trails and<br />
open spaces in the Village.<br />
Description<br />
The Parks, Trails and Open Space Program administers the goals and objectives of the City Council and the Parks,<br />
Trails and Recreation (PTR) Commission to provide personal enjoyment through the planning, design and<br />
construction of its parks, trails and open spaces.<br />
Accomplishments<br />
The construction of the Goldsmith Gulch Trail Extension and Caley Avenue Undercrossing project was completed as<br />
well as the design of the Goldsmith Gulch channel restoration. The design for Phase IV implementation of the Village<br />
Greens North Master Plan was completed to include an improved entry with shelters and a restroom. Field #11 at<br />
Village Greens Park was converted from a natural turf field to a synthetic. Outdoor musical instruments were installed<br />
at Westlands Park and Senior Outdoor Exercise Equipment at Curtis Park. The irrigation system in Orchard Hills Park<br />
was upgraded. The missing section of trail along the west edge of Monaco Park was constructed. The Running Fox<br />
Park pond was restored to provide an amenity for the area. The feasibility study was completed for the High Line<br />
Canal Stormwater Demonstration project.<br />
Goals/Objectives<br />
In <strong>2018</strong>, the construction of Phase IV of the Village Greens North Master Plan will be completed. The construction of<br />
the Goldsmith Gulch Channel Restoration will be completed between Caley Avenue and Fair Avenue. The Silo Park<br />
Playground will be updated with new equipment. The Greenwood Gulch Trail Crossing will be improved by an<br />
upgrade from a low flow crossing to a box culvert. Contingent on being able to secure grant funding, the High Line<br />
Canal Trailhead Restroom and the Castlewood Park Restrooms will be converted from port-a-lets to plumbed<br />
restrooms. Also contingent on grant funding, an addition to the Carson Skate Park to include street elements will be<br />
constructed.<br />
Outcome Measures<br />
Percent of respondents who rated the Village’s parks, trails and open<br />
spaces as excellent or good as measured by the Village Citizen Survey.<br />
Percent of respondents who rated the overall accessibility from their<br />
home to Village trails for travel or recreational opportunities as excellent<br />
or good as measured by the Village Citizen Survey.<br />
Percent of respondents who rated the Village’s parks and open spaces<br />
as providing amenities that support diverse recreational opportunities as<br />
excellent or good as measured by the department Survey.<br />
*Survey not conducted.<br />
2015<br />
Actual<br />
2016<br />
Actual<br />
2017<br />
Estimate<br />
<strong>2018</strong><br />
Target<br />
N/A* 95 N/A* 95<br />
N/A* 95 N/A* 95<br />
95 95 95 95<br />
Service Level Indicators<br />
2015<br />
Actual<br />
2016<br />
Actual<br />
2017<br />
Estimate<br />
Total number of single use park pavilion permits issued. 370 375 408<br />
‣ Issued to residents. 130 132 144<br />
‣ Issued to non-residents. 170 163 187<br />
‣ Issued to resident businesses. 70 80 77<br />
Total number of special occasion permits. 65 60 92<br />
Total acres of developed parks. 279.35 279.35 279.35<br />
Total acres of undeveloped parks/open spaces. 178 178 178<br />
Total miles of trails. 47 47 47<br />
Total number of Parks, Trails and Recreation Commission meetings. 12 9 9<br />
Total number of grants received. 4 3 3<br />
121
PARKS, TRAILS & OPEN SPACE<br />
Expenditure Detail<br />
2016<br />
Audited<br />
Actuals<br />
2017<br />
Amended<br />
<strong>Budget</strong><br />
<strong>2018</strong><br />
<strong>Adopted</strong><br />
<strong>Budget</strong><br />
% Change<br />
Personnel<br />
Regular Wages $ 129,664 $ 134,080 $ 140,553 4.83%<br />
Longevity Service Award 1,185 1,245 1,305 4.82%<br />
Overtime Wages 7,391 2,280 2,280 0.00%<br />
Clothing Allowance 200 300 300 0.00%<br />
Communication Allowance 420 420 420 0.00%<br />
Social Security 8,553 8,491 8,815 3.82%<br />
Medicare 2,000 1,985 2,062 3.88%<br />
Workers Compensation 1,957 2,356 2,462 4.50%<br />
Retirement Contributions 10,149 10,726 5,759 -46.31%<br />
Medical Insurance 16,110 15,214 16,687 9.68%<br />
Dental Insurance 818 818 1,636 100.00%<br />
Insurance Waivers 1,450 1,450 1,200 -17.24%<br />
Life/AD&D Insurance 497 485 458 -5.57%<br />
Disability Insurance 395 415 407 -1.93%<br />
Total Personnel 180,789 180,265 184,344 2.26%<br />
Purchased Services<br />
Professional Services 28,256 106,000 30,000 -71.70%<br />
Telecommunication Services - 856 720 -15.89%<br />
Printing/Publication Services 24 - - 0.00%<br />
Training/Education 150 960 960 0.00%<br />
Dues/Memberships 674 730 730 0.00%<br />
Total Purchased Services 29,104 108,546 32,410 -70.14%<br />
Supplies/Non-<strong>Capital</strong> Equipment<br />
Office Supplies 134 100 100 0.00%<br />
<strong>Operating</strong> Supplies 24 50 50 0.00%<br />
Uniforms/Safety Equipment 422 770 920 19.48%<br />
Total Supplies/Non-<strong>Capital</strong> Equipment 580 920 1,070 16.30%<br />
Total Expenditures $ 210,473 $ 289,731 $ 217,824 -24.82%<br />
Variance Justification<br />
Purchased Services (-$76,136):<br />
Professional Services (-$76,000): Decrease due to the elimination of one-time expenses in 2017.<br />
<br />
Telecommunication (-$136): Decrease due to optimization of mobile data use.<br />
Supplies/Non-<strong>Capital</strong> Equipment (+$150):<br />
<br />
Uniforms/Safety Equipment (+$150): Increase due to the cost increase for prescription safety<br />
glasses.<br />
122
PARKS & TRAILS MAINTENANCE<br />
Statement of Purpose<br />
The Parks and Trails Maintenance Program assures that developed parks, streetscapes, trails, and open spaces are<br />
safe, available, clean, and aesthetically pleasing.<br />
Description<br />
Parks and Trails Maintenance is responsible for 184 acres of open space, 279 acres of developed parks, 47 miles of<br />
trails, and 53 acres of streetscapes and floral beds.<br />
Accomplishments<br />
In 2017, developed parks and streetscape turf areas received once-a-week mowing during the growing season with the<br />
exception of the 14 multi-use athletic fields which were mowed twice-weekly. The synthetic field is maintained on a<br />
weekly basis. Substantial water savings were attained during the year due to best management practices of conserving<br />
and monitoring water use during periods of precipitation. Resurfacing of the tennis court in Hoffman Park was completed<br />
including Pickle Ball markings, improving both safety and playability. 72 new trees were planted Village-wide during<br />
2017, with 35 being planted by the crew and 37 by an outside contractor. 28 of those trees were planted in Orchard Hills<br />
Park as replacements to those removed by the water and sewer district. The Village’s ash trees continue to be<br />
monitored and evaluated for the emerald ash borer. No evidence of the ash borer has been observed thus far in the<br />
Village. The Village owned and maintained fence along the north side of East Chenango Avenue to Fulton Street was<br />
replaced. The two infields at Curtis Park were renovated. The fields had the ridge between the infield and outfield<br />
removed, they were laser graded and sod was installed where necessary. Also, at Curtis Park, concrete edging was<br />
installed around both the north and south mulch beds. A drain was installed at Westlands Park at the bottom of the<br />
south hill of the athletic fields to improve drainage. New art panels for the Curtis Arts and Humanities Center were<br />
acquired and modified to meet our display and maintenance needs. The lightning prediction system at Curtis Park was<br />
upgraded to the newest available technology.<br />
Goals/Objectives<br />
In <strong>2018</strong>, the Westlands Park playground railing is proposed for replacement. At Curtis Park and Village Greens Park,<br />
irrigation system upgrades will be made. Landscape improvements are proposed for the Southwest corner of Belleview<br />
Avenue and Clarkson Street.<br />
Outcome Measures<br />
2015<br />
Actual<br />
2016<br />
Actual<br />
2017<br />
Estimate<br />
Number of reported incidents or accidents due to unsafe conditions within<br />
the Parks System.<br />
1 0 0 0<br />
Percentage of respondents rating the appearance of streetscapes and<br />
medians as good to excellent.<br />
N/A* 95> N/A* 95><br />
Percentage of respondents rating the overall quality and appearance of<br />
the Parks, Trails, and Open Space as good to excellent.<br />
N/A* 95> N/A* 95><br />
Percentage of time athletic fields are available to permitted users. 100 100 100 100<br />
*Survey not conducted.<br />
<strong>2018</strong><br />
Target<br />
123
PARKS & TRAILS MAINTENANCE<br />
Expenditure Detail – Developed Parks<br />
2016<br />
Audited<br />
Actuals<br />
2017<br />
Amended<br />
<strong>Budget</strong><br />
<strong>2018</strong><br />
<strong>Adopted</strong><br />
<strong>Budget</strong><br />
% Change<br />
Personnel<br />
Regular Wages $ 1,003,016 $ 1,132,594 $ 1,165,770 2.93%<br />
Seasonal/Temporary Wages 77,795 76,000 77,280 1.68%<br />
Longevity Service Award 12,305 15,235 15,380 0.95%<br />
Overtime Wages 28,313 14,744 18,240 23.71%<br />
Clothing Allowance 3,900 4,400 4,400 0.00%<br />
Communication Allowance 1,320 1,440 2,040 41.67%<br />
Social Security 69,028 74,681 76,130 1.94%<br />
Medicare 16,102 16,695 17,024 1.97%<br />
Workers Compensation 32,641 39,736 39,516 -0.55%<br />
Retirement Contributions 69,470 82,633 41,516 -49.76%<br />
Medical Insurance 187,257 208,277 227,479 9.22%<br />
Dental Insurance 9,144 10,904 10,298 -5.56%<br />
Insurance Waivers 2,171 1,200 2,900 141.67%<br />
Life/AD&D Insurance 3,785 4,105 3,803 -7.36%<br />
Disability Insurance 3,099 3,510 3,380 -3.70%<br />
Total Personnel 1,519,346 1,686,154 1,705,156 1.13%<br />
Purchased Services<br />
Catering/Dining Services 162 - - 0.00%<br />
Repair/Maintenance Services 170,305 163,895 160,400 -2.13%<br />
Disposal/Recycling Services 3,290 400 400 0.00%<br />
Telecommunication Services 4,314 3,072 5,662 84.31%<br />
Training/Education 17,824 17,795 18,195 2.25%<br />
Dues/Memberships 1,906 3,355 3,137 -6.50%<br />
Mileage/Travel 354 - - 0.00%<br />
Rentals/Leases 749 1,500 1,500 0.00%<br />
Total Purchased Services 198,904 190,017 189,294 -0.38%<br />
Supplies/Non-<strong>Capital</strong> Equipment<br />
Office Supplies 1,358 1,150 1,150 0.00%<br />
<strong>Operating</strong> Supplies 138,318 171,157 166,057 -2.98%<br />
Non-<strong>Capital</strong> Equipment 618 - - 0.00%<br />
Uniforms/Safety Equipment 14,877 18,879 20,629 9.27%<br />
Gas/Electricity 76,665 69,000 80,000 15.94%<br />
Water/Sewer 295,648 400,000 312,000 -22.00%<br />
Total Supplies/Non-<strong>Capital</strong> Equipment 527,484 660,186 579,836 -12.17%<br />
Total Expenditures $ 2,245,734 $ 2,536,357 $ 2,474,286 -2.45%<br />
124
PARKS & TRAILS MAINTENANCE<br />
Variance Justification<br />
Personnel (+$4,776):<br />
<br />
<br />
Seasonal/Temporary Wages (+$1,280): Increase to reflect average hourly rate up from $11.00/ to<br />
$11.50/hour.<br />
Overtime Wages (+$3,496): Increase to accommodate historic need to respond to after hour needs.<br />
Purchased Services (-$723):<br />
<br />
<br />
<br />
<br />
Repair/Maintenance Services (-$3,495): Decrease due to removal of one-time repairs in previous year.<br />
Telecommunication Services (+$2,590): Increase due to addition of crew tablets to allow for utilization<br />
of asset management program for timely response to service requests and work orders, and conduct<br />
inspections and asset updates.<br />
Training/Education (+$400): Increase to allow for pest control training for employee taking over duties<br />
due to shift of existing employee to Public Works.<br />
Dues/Memberships (-$218): Decrease due to savings recognized by utilizing organizational<br />
memberships as opposed to individual memberships.<br />
Supplies/Non-<strong>Capital</strong> Equipment (-$80,350):<br />
<br />
<br />
<br />
<br />
<strong>Operating</strong> Supplies (-$5,100): Decrease due to removal of one-time purchase in previous year.<br />
Uniforms/Safety Equipment (+$1,750): Increase to accommodate cost increase in prescription safety<br />
glasses budgeted every other year for necessary personnel.<br />
Gas/Electricity (+$11,000): Increase to reflect historic use plus predicted 4% increase by provider.<br />
Water/Sewer (-$88,000): Decrease to reflect historic use plus predicted 4% increase by providers.<br />
125
PARKS & TRAILS MAINTENANCE<br />
Expenditure Detail – Streetscapes, Medians & Trails<br />
2016<br />
Audited<br />
Actuals<br />
2017<br />
Amended<br />
<strong>Budget</strong><br />
<strong>2018</strong><br />
<strong>Adopted</strong><br />
<strong>Budget</strong><br />
% Change<br />
Personnel<br />
Regular Wages $ 397,078 $ 404,789 $ 328,951 -18.74%<br />
Longevity Service Award 7,875 8,175 6,960 -14.86%<br />
Overtime Wages 5,495 2,850 4,940 73.33%<br />
Clothing Allowance 1,400 1,400 1,200 -14.29%<br />
Social Security 25,907 25,118 20,337 -19.03%<br />
Medicare 6,059 5,123 4,002 -21.88%<br />
Workers Compensation 11,185 13,198 10,822 -18.00%<br />
Retirement Contributions 30,699 32,383 13,478 -58.38%<br />
Medical Insurance 81,135 76,683 72,713 -5.18%<br />
Dental Insurance 3,880 3,879 3,404 -12.25%<br />
Insurance Waivers 1,450 1,450 1,450 0.00%<br />
Life/AD&D Insurance 1,446 1,465 1,071 -26.89%<br />
Disability Insurance 1,220 1,255 955 -23.90%<br />
Total Personnel 574,829 577,768 470,283 -18.60%<br />
Purchased Services<br />
Professional Services 3,540 - - 0.00%<br />
Contracted Services 644,610 853,022 875,022 2.58%<br />
Catering/Dining Services 973 - - 0.00%<br />
Telecommunication Services 2,164 2,392 2,447 2.30%<br />
Training/Education 558 4,975 4,975 0.00%<br />
Dues/Memberships 375 - - 0.00%<br />
Mileage/Travel 128 - - 0.00%<br />
Rentals/Leases 49 1,200 4,200 250.00%<br />
Total Purchased Services 652,397 861,589 886,644 2.91%<br />
Supplies/Non-<strong>Capital</strong> Equipment<br />
Office Supplies 1,187 400 400 0.00%<br />
<strong>Operating</strong> Supplies 77,423 59,804 59,804 0.00%<br />
Non-<strong>Capital</strong> Equipment 2,908 12,550 9,550 -23.90%<br />
Uniforms/Safety Equipment 2,503 5,673 5,973 5.29%<br />
Total Supplies/Non-<strong>Capital</strong> Equipment 84,021 78,427 75,727 -3.44%<br />
Total Expenditures $ 1,311,247 $ 1,517,784 $ 1,432,654 -5.61%<br />
126
PARKS & TRAILS MAINTENANCE<br />
Variance Justification<br />
Personnel (+$2,090):<br />
<br />
Overtime Wages (+$2,090): Increase to accommodate historic need to respond to after hour needs.<br />
Purchased Services (+$25,055):<br />
<br />
<br />
<br />
Contracted Services (+$22,000): Increase for addition of Long Road landscaping addition.<br />
Telecommunication Services (+$55): Slight increase due to provider changes.<br />
Rentals/Leases (+$3,000): Increase to allow for more in-house projects to be completed as opposed to<br />
hiring a contractor.<br />
Supplies/Non-<strong>Capital</strong> Equipment (-$2,700):<br />
<br />
<br />
Non-<strong>Capital</strong> Equipment (-$3,000): Decrease due to removal of one-time purchase in previous year.<br />
Uniforms/Safety Equipment (+$300): Increase to accommodate cost increase in prescription safety<br />
glasses budgeted every other year for necessary personnel.<br />
127
PARKS & TRAILS MAINTENANCE<br />
Expenditure Detail – Open Space & Urban Forestry<br />
2016<br />
Audited<br />
Actuals<br />
2017<br />
Amended<br />
<strong>Budget</strong><br />
<strong>2018</strong><br />
<strong>Adopted</strong><br />
<strong>Budget</strong><br />
% Change<br />
Personnel<br />
Regular Wages $ 438,275 $ 476,619 $ 452,892 -4.98%<br />
Longevity Service Award 5,725 6,245 4,985 -20.18%<br />
Overtime Wages 4,926 3,230 4,940 52.94%<br />
Clothing Allowance 1,200 1,500 1,500 0.00%<br />
Communication Allowance 1,270 1,740 1,740 0.00%<br />
Social Security 27,731 29,855 27,919 -6.48%<br />
Medicare 6,037 4,065 5,307 30.55%<br />
Workers Compensation 13,037 15,508 14,731 -5.01%<br />
Retirement Contributions 31,489 36,939 16,690 -54.82%<br />
Medical Insurance 59,494 62,292 84,917 36.32%<br />
Dental Insurance 3,048 3,324 3,896 17.21%<br />
Insurance Waivers 2,288 2,650 1,450 -45.28%<br />
Life/AD&D Insurance 1,569 1,726 1,474 -14.60%<br />
Disability Insurance 1,339 1,477 1,315 -10.97%<br />
Total Personnel 597,428 647,170 623,756 -3.62%<br />
Purchased Services<br />
Professional Services 310 - - 0.00%<br />
Contracted Services 48,922 91,075 91,075 0.00%<br />
Disposal/Recycling Services - 990 990 0.00%<br />
Telecommunication Services 214 856 888 3.74%<br />
Training/Education 5,331 4,300 4,300 0.00%<br />
Dues/Memberships 223 415 415 0.00%<br />
Rentals/Leases - 2,500 2,500 0.00%<br />
Total Purchased Services 55,000 100,136 100,168 0.03%<br />
Supplies/Non-<strong>Capital</strong> Equipment<br />
Office Supplies 186 200 200 0.00%<br />
<strong>Operating</strong> Supplies 39,466 42,600 42,600 0.00%<br />
Non-<strong>Capital</strong> Equipment 1,314 1,500 1,500 0.00%<br />
Uniforms/Safety Equipment 3,261 5,395 5,695 5.56%<br />
Total Supplies/Non-<strong>Capital</strong> Equipment 44,227 49,695 49,995 0.60%<br />
Total Expenditures $ 696,655 $ 797,001 $ 773,919 -2.90%<br />
Variance Justification<br />
Personnel (+$1,710):<br />
<br />
Overtime Wages (+$1,710): Increase to accommodate historic need to respond to after hour needs.<br />
Purchased Services (+$32):<br />
<br />
Telecommunication Services (+$32): Slight increase due to provider changes.<br />
Supplies/Non-<strong>Capital</strong> Equipment (+$300):<br />
<br />
Uniforms/Safety Equipment (+$300): Increase to accommodate cost increase in prescription safety<br />
glasses budgeted every other year for necessary personnel.<br />
128
PARKS & TRAILS MAINTENANCE<br />
Expenditure Detail – Small Engine Equipment<br />
2016<br />
Audited<br />
Actuals<br />
2017<br />
Amended<br />
<strong>Budget</strong><br />
<strong>2018</strong><br />
<strong>Adopted</strong><br />
<strong>Budget</strong><br />
% Change<br />
Purchased Services<br />
Repair/Maintenance Services 6,721 10,750 10,750 0.00%<br />
Training/Education 6,040 6,010 6,510 8.32%<br />
Total Purchased Services 12,761 16,760 17,260 2.98%<br />
Supplies/Non-<strong>Capital</strong> Equipment<br />
<strong>Operating</strong> Supplies 51,867 56,375 56,375 0.00%<br />
Non-<strong>Capital</strong> Equipment 39,097 10,535 18,595 76.51%<br />
Uniforms/Safety Equipment 462 900 900 0.00%<br />
Total Supplies/Non-<strong>Capital</strong> Equipment 91,426 67,810 75,870 11.89%<br />
<strong>Capital</strong> Outlay<br />
<strong>Capital</strong> Equipment 168,495 163,785 166,775 1.83%<br />
Total <strong>Capital</strong> Outlay 168,495 163,785 166,775 1.83%<br />
Total Expenditures $ 272,682 $ 248,355 $ 259,905 4.65%<br />
Variance Justification<br />
Purchased Services (+$500):<br />
<br />
Training/Education (+$500): Increase to allow for new Parks Manager to attend the Green Industry<br />
and Equipment Expo.<br />
Supplies/Non-<strong>Capital</strong> Equipment (+$8,060):<br />
<br />
Non-<strong>Capital</strong> Equipment (+$8,060): This program will vary from year-to-year as it relates to the<br />
replacement plan for smaller Village equipment which considers utilization, repair needs, and reliability.<br />
Includes such items as line trimmers, backpack blowers, chainsaws, edgers, snow blowers, and<br />
aerators.<br />
<strong>Capital</strong> Outlay (+$2,990):<br />
<br />
<strong>Capital</strong> Equipment (+$2,990): This program will vary from year-to-year as it relates to the replacement<br />
plan for Village equipment which considers utilization, repair needs, and reliability. Includes such items<br />
as bluegrass mowers, open space tractor with mowing deck, vibrating aerator attachment, and broom<br />
attachments.<br />
129
PARKS & TRAILS MAINTENANCE<br />
Expenditure Detail – Parks & Trails Snow Removal<br />
2016<br />
Audited<br />
Actuals<br />
2017<br />
Amended<br />
<strong>Budget</strong><br />
<strong>2018</strong><br />
<strong>Adopted</strong><br />
<strong>Budget</strong><br />
% Change<br />
Purchased Services<br />
Contracted Services 12,226 10,175 12,175 19.66%<br />
Repair/Maintenance Services - - 1,500 100.00%<br />
Training/Education 305 1,400 1,400 0.00%<br />
Total Purchased Services 12,531 11,575 15,075 30.24%<br />
Supplies/Non-<strong>Capital</strong> Equipment<br />
<strong>Operating</strong> Supplies 13,416 20,260 20,260 0.00%<br />
Non-<strong>Capital</strong> Equipment - 1,600 1,600 0.00%<br />
Uniforms/Safety Equipment 360 2,000 2,600 30.00%<br />
Total Supplies/Non-<strong>Capital</strong> Equipment 13,776 23,860 24,460 2.51%<br />
Total Expenditures $ 26,307 $ 35,435 $ 39,535 11.57%<br />
Variance Justification<br />
Purchased Services (+$3,500):<br />
<br />
<br />
Contracted Services (+$2,000): Increase to reflect historic reimbursement payment to Goldsmith Gulch<br />
Metro District for the Village’s contribution toward sidewalk plowing in the Tech Center.<br />
Repair/Maintenance Services (+$1,500): Increase to cover expense to have outside source switch the<br />
mowing deck to the wing plow on roadside tractor.<br />
Supplies/Non-<strong>Capital</strong> Equipment (+$600):<br />
<br />
Uniforms/Safety Equipment (+$600): Increase to cover cost of cold weather boots for trails snow and<br />
ice removal crew. <strong>Budget</strong>ed at 4 every year for replacement out of 15 people total.<br />
130
POLICE<br />
Statement of Purpose<br />
The purpose of the Police Department is to ensure a safe and secure community.<br />
Description<br />
The Police Department is comprised of four programs, Administration, Patrol Operations, Technical Support Services<br />
and Special Operations.<br />
The purpose of the Administration Program is to ensure high quality program outcomes of the overall Police<br />
Department while supporting the victims of crime.<br />
The purpose of the Patrol Operations Program, comprised of the uniformed Patrol services, is responsible for<br />
identifying and resolving immediate Public Safety concerns and the primary handling of calls and needs for any police<br />
service.<br />
The Technical Support Services Program is responsible for the 911 Center, Records, Grant Management and<br />
collateral assignments with Emergency Management and Response.<br />
The Special Operations Program, which includes School Safety, Traffic Safety, Investigations, Code Enforcement,<br />
Forensics and Training/Development is responsible for creating safe environments in our schools, on our roadways,<br />
solving criminal cases, crime scene and evidence processing and development and training of all personnel.<br />
131
POLICE<br />
Organizational Chart<br />
Chief of Police<br />
Management<br />
Analyst<br />
Victim Assistance<br />
Coordinator (0.75)<br />
Support<br />
Technician (1)<br />
Patrol Operations<br />
Commander<br />
Technical Support<br />
Commander<br />
Special<br />
Operations<br />
Commander<br />
Patrol Sergeant<br />
(6)<br />
911 Supervisor (2)<br />
School Resource<br />
Sergeant<br />
Traffic Unit<br />
Sergeant<br />
Patrol Corporal (6)<br />
911 Technicians<br />
(11)<br />
School Resource<br />
Officers (4)<br />
Traffic Officers (4)<br />
Police Officer (30)<br />
Records/Grants<br />
Supervisor<br />
Detective<br />
Sergeant<br />
Support Sergeant<br />
Support<br />
Technician (3)<br />
Detectives (6)<br />
Code Enforcement<br />
(2)<br />
CSI/Evidence (2)<br />
Impact Officer (2)<br />
Training/<br />
Recruitment<br />
Coordinator<br />
Court Marshall<br />
(0.40)<br />
132
POLICE<br />
Personnel & Financial Summary<br />
2016<br />
Audited<br />
Actuals<br />
2017<br />
Amended<br />
<strong>Budget</strong><br />
<strong>2018</strong><br />
<strong>Adopted</strong><br />
<strong>Budget</strong><br />
% Change<br />
Staff - Full Time Equivalency (FTE): 91.15 91.15 91.15 0.00%<br />
Expenditures By Category:<br />
Personnel $ 9,251,573 $ 9,661,881 $ 9,804,981 1.48%<br />
Purchased Services 585,345 750,537 886,166 18.07%<br />
Supplies/Non-<strong>Capital</strong> Equipment 447,584 394,652 248,909 -36.93%<br />
<strong>Capital</strong> Outlay 113,624 211,344 - -100.00%<br />
Total Expenditures $ 10,398,126 $ 11,018,414 $ 10,940,056 -0.71%<br />
Expenditures By Division:<br />
Administration $ 850,437 $ 1,109,893 $ 944,128 -14.94%<br />
Support Services 1,733,912 1,856,690 1,712,545 -7.76%<br />
Patrol Services 6,712,822 6,960,207 7,046,346 1.24%<br />
Detective Services 1,100,955 1,091,624 1,237,037 13.32%<br />
Total Expenditures $ 10,398,126 $ 11,018,414 $ 10,940,056 -0.71%<br />
Expenditures & Full-Time Equivalency<br />
Expenditures<br />
$11,100,000<br />
$11,000,000<br />
$10,900,000<br />
$10,800,000<br />
$10,700,000<br />
$10,600,000<br />
$10,500,000<br />
$10,400,000<br />
$10,300,000<br />
$10,200,000<br />
$10,100,000<br />
$10,000,000<br />
2016<br />
Audited<br />
Actuals<br />
2017<br />
Amended<br />
<strong>Budget</strong><br />
<strong>2018</strong><br />
<strong>Adopted</strong><br />
<strong>Budget</strong><br />
100.00<br />
90.00<br />
80.00<br />
70.00<br />
60.00<br />
50.00<br />
40.00<br />
30.00<br />
20.00<br />
10.00<br />
-<br />
Full-Time Equivalent (FTE)<br />
Total Expenditures<br />
Staff - Full Time Equivalency (FTE):<br />
133
POLICE<br />
Explanation of <strong>Budget</strong> Variances<br />
In <strong>2018</strong>, the organizational leadership of the Police Department will undergo structural changes. The changes will both<br />
enhance accountability among personnel and significantly reduce liability. The first change will convert six Police<br />
Officer positions to six Police Corporal positions. A Corporal will be assigned to each patrol team, eliminating the<br />
existing disparate and unstructured lead officer role and enhance consistency in team leadership and structure. The<br />
conversion will result in additional personnel costs of $28,243, as well as corresponding reduction in rate/shift<br />
differential costs of $10,000 via the elimination of the lead officer role. Additionally, the Department intends to convert<br />
an existing vacant Commander position to an additional Police Sergeant position. This new Sergeant position will<br />
absorb many of the collateral support roles that most of the Sergeants are currently assigned. The change will<br />
increase operational efficiencies by consolidating duties, thus allowing Sergeants to focus on the leadership of their<br />
teams in the field. There change will result in salary cost savings of $16,820, resulting in an overall net impact of<br />
$1,423. These organizational changes will enhance, evenly balance and elevate Commanders’ responsibilities by<br />
placing an emphasis on leadership and emergency management preparedness.<br />
An additional change to the <strong>2018</strong> budget includes an increase of $117,400 associated with the installation of an<br />
additional photo red light camera at the intersection of S. Dayton Street and E. Belleview Avenue. The additional costs<br />
will be offset via collections as provided for under the City’s zero-cost agreement with the service provider.<br />
134
POLICE<br />
Expenditure Detail<br />
2016<br />
Audited<br />
Actuals<br />
2017<br />
Amended<br />
<strong>Budget</strong><br />
<strong>2018</strong><br />
<strong>Adopted</strong><br />
<strong>Budget</strong><br />
% Change<br />
Personnel<br />
Regular Wages $ 6,316,969 $ 6,535,475 $ 6,921,503 5.91%<br />
Longevity Service Award 57,611 63,361 63,026 -0.53%<br />
Rate/Shift Differential 25,369 33,000 23,000 -30.30%<br />
Extra Duty Assignment 400,114 464,200 464,200 0.00%<br />
Overtime Wages 246,326 267,500 253,000 -5.42%<br />
Clothing Allowance 6,550 6,550 9,000 37.40%<br />
Cleaning Allowance 32,402 33,000 33,500 1.52%<br />
Communication Allowance 840 840 1,680 100.00%<br />
Social Security 82,804 106,054 104,177 -1.77%<br />
Medicare 97,368 104,091 108,562 4.30%<br />
Workers Compensation 147,206 180,713 188,927 4.55%<br />
FPPA Death & Disability 95,013 95,422 107,036 12.17%<br />
Retirement Contributions 782,993 812,575 442,922 -45.49%<br />
Medical Insurance 853,867 850,120 974,709 14.66%<br />
Dental Insurance 42,218 44,447 46,752 5.19%<br />
Insurance Waivers 21,797 20,750 20,500 -1.20%<br />
Life/AD&D Insurance 22,652 23,577 22,466 -4.71%<br />
Disability Insurance 19,474 20,206 20,021 -0.92%<br />
Total Personnel 9,251,573 9,661,881 9,804,981 1.48%<br />
Purchased Services<br />
Professional Services 390,618 490,968 608,378 23.91%<br />
Contracted Services - 3,840 6,300 64.06%<br />
Catering/Dining Services 3,014 7,950 8,350 5.03%<br />
Repair/Maintenance Services 3,166 19,100 23,037 20.61%<br />
Telecommunication Services 27,894 67,325 81,580 21.17%<br />
Postage/Shipping Services 516 650 650 0.00%<br />
Printing/Publication Services 469 2,450 2,450 0.00%<br />
Training/Education 135,871 133,480 128,830 -3.48%<br />
Dues/Memberships 22,860 22,724 24,141 6.24%<br />
Mileage/Travel 831 300 700 133.33%<br />
Miscellaneous Services 106 1,750 1,750 0.00%<br />
Total Purchased Services 585,345 750,537 886,166 18.07%<br />
Supplies/Non-<strong>Capital</strong> Equipment<br />
Office Supplies 6,294 3,880 3,915 0.90%<br />
<strong>Operating</strong> Supplies 37,135 70,733 32,988 -53.36%<br />
Non-<strong>Capital</strong> Equipment 261,336 227,889 109,256 -52.06%<br />
Uniforms/Safety Equipment 142,819 92,150 102,750 11.50%<br />
Total Supplies/Non-<strong>Capital</strong> Equipment 447,584 394,652 248,909 -36.93%<br />
<strong>Capital</strong> Outlay<br />
<strong>Capital</strong> Equipment 113,624 211,344 - -100.00%<br />
Total <strong>Capital</strong> Outlay 113,624 211,344 - -100.00%<br />
Total Expenditures $ 10,398,126 $ 11,018,414 $ 10,940,056 -0.71%<br />
135
ADMINISTRATION<br />
Statement of Purpose<br />
The purpose of the Police Administration is to assure high quality program outcomes for the entire Police Department.<br />
Description<br />
The function of the Police Administration Program area is to assure all program outcomes and activities of the entire<br />
Police Department, foster a safe and secure community and to provide assistance to victims of crime. The primary<br />
activities of Police Administration is the coordination of functions including the leadership, management, planning,<br />
directing and evaluation of all law enforcement and Public Safety services. Activities include the management and<br />
leadership of personnel; the preparation and management of the Police Department’s budget; enhancing community<br />
relations, assisting crime victims, maintaining an effective intergovernmental liaison program; and providing statistical<br />
data, and analysis, for use in the strategic deployment of resources within the department and community. The<br />
program area includes the Chief of Police, Management Analyst, Victim Assistance, and administrative support staff.<br />
Direct leadership and management are provided to the Police Administration, Patrol Operations, Special Operations<br />
and the Technical Support Services Programs.<br />
Accomplishments<br />
In 2017, strong emphasis continued to be placed on the prevention of crime and injury traffic accidents in known<br />
occurrence areas. We believe focused deployment strategies strongly correlate to improving overall community and<br />
traffic flow safety in the Village. We are leading the way in creating traffic safety strategies as evidenced by another<br />
record low number of serious injury traffic accidents this year. The command level leadership of our agency continues<br />
to improve its cohesive leadership of, and within, the Department as evidenced by expanded use of intelligence led<br />
policing and strategic deployment efforts. The Department’s partnership with the Cherry Creek School District and<br />
other surrounding law enforcement agencies to implement a Standard Response Protocol has been transformational<br />
and continues to evolve towards a completion date in 2017. We also began an outreach plan to partner with other<br />
community businesses, and schools, to connect and create relationships that foster enhanced officer safety and<br />
community relations with collaborative training on responding to critical situations. The I-25 fuel truck crash and<br />
explosion is a testament of the Police Department leading other City departments in coming together to efficiently<br />
address and defuse a large-scale emergency. The concert season at Fiddler’s Green Amphitheater was safe, with<br />
minimal issues, across a high number of concert events. Our integration of current technologies, such as the<br />
automated electronic police records request system, continues to improve our operating effectiveness and accelerate<br />
efficiencies in our relationships with citizens.<br />
Goals/Objectives<br />
In <strong>2018</strong>, the Police Department will set forth strategies that will guide long-term plans by establishing what we do, how<br />
we do it, and how we measure our performance with modified and measurable goals. We will continue to train and<br />
focus on the Standard Response Protocol and deployment procedures to remain proficient and prepared to respond<br />
and expand our use of the Strategic Intelligence Deployment Accountability Planning principles. This will encompass<br />
the newly adopted 2017 emergency operations manual and expanded security training with neighboring law<br />
enforcement agencies, Cherry Creek School District, and other business partners within our community. A priority will<br />
be placed on equipping officers with the best technology and equipment to ensure the safety and security of the<br />
Village and our employees. We will enter into a partnership with a new, and Arapahoe County commonly used, Law<br />
Enforcement Computer Aided Dispatch system within our 911 Center and then enhance it by integrating a new and<br />
compatible Records Management System. We will implement additional photo red light technology to prevent turning<br />
accidents at a large intersection, as approved by Council, and transition to the next level of eCitation hardware and<br />
software with our Municipal Court. The second phase of transitioning to what our next fleet Mobile Data Terminals will<br />
also be achieved and smartphone technology will be implemented widely across the Department.<br />
Our core mission is to protect the people, property, environment, culture, and economy of Greenwood Village from<br />
criminal acts, man-made hazards and/or natural disasters. The personnel changes made will be implemented, trained<br />
for and completed with a high certainty of increased accountability and a reduction in departmental liability. Our<br />
agency is constantly striving to improve the level of service, reduce response times for service to the Village and<br />
improve the efficiency and effectiveness of departmental operations. Maintaining a high police presence in our<br />
neighborhoods and a low response time on calls for service, especially priority one calls for service, and creating safe<br />
environments for people in all events will remain among our top priorities.<br />
136
ADMINISTRATION<br />
Outcome Measures<br />
2015<br />
Actual<br />
2016<br />
Actual<br />
2017<br />
Estimate<br />
<strong>2018</strong><br />
Target<br />
Percent of respondents rating overall service as Good or Excellent as<br />
measured by the Village Citizen Survey.<br />
NA 90 NA 90<br />
Percent of performance expectations achieved by department programs. 97 97 97 97<br />
* Survey not conducted.<br />
Expenditure Detail<br />
2016<br />
Audited<br />
Actuals<br />
2017<br />
Amended<br />
<strong>Budget</strong><br />
<strong>2018</strong><br />
<strong>Adopted</strong><br />
<strong>Budget</strong><br />
% Change<br />
Personnel<br />
Regular Wages $ 315,133 $ 320,847 $ 279,571 -12.86%<br />
Longevity Service Award 3,415 3,655 2,425 -33.65%<br />
Extra Duty Assignment 2,839 4,200 4,200 0.00%<br />
Overtime Wages 2,000 - - 0.00%<br />
Clothing Allowance 700 700 1,000 42.86%<br />
Cleaning Allowance 500 500 500 0.00%<br />
Communication Allowance - - 420 100.00%<br />
Social Security 11,224 11,097 8,136 -26.68%<br />
Medicare 4,519 4,656 4,107 -11.79%<br />
Workers Compensation 3,749 4,618 4,870 5.46%<br />
FPPA Death & Disability 3,603 3,724 3,903 4.81%<br />
Retirement Contributions 32,867 34,262 16,069 -53.10%<br />
Medical Insurance 49,047 46,360 39,476 -14.85%<br />
Dental Insurance 2,357 2,357 1,882 -20.15%<br />
Life/AD&D Insurance 1,291 1,160 909 -21.64%<br />
Disability Insurance 951 995 811 -18.49%<br />
Total Personnel 434,195 439,131 368,279 -16.13%<br />
Purchased Services<br />
Professional Services 353,484 335,724 446,319 32.94%<br />
Contracted Services - 2,400 5,300 120.83%<br />
Catering/Dining Services 1,459 5,950 6,350 6.72%<br />
Telecommunication Services 1,377 67,325 81,244 20.67%<br />
Postage/Shipping Services 516 650 650 0.00%<br />
Training/Education 675 - - 0.00%<br />
Dues/Memberships 22,785 22,724 24,141 6.24%<br />
Mileage/Travel 439 200 200 0.00%<br />
Total Purchased Services 380,735 434,973 564,204 29.71%<br />
Supplies/Non-<strong>Capital</strong> Equipment<br />
Office Supplies 5,825 3,585 3,620 0.98%<br />
<strong>Operating</strong> Supplies 6,068 52,525 7,025 -86.63%<br />
Uniforms/Safety Equipment 640 1,000 1,000 0.00%<br />
Total Supplies/Non-<strong>Capital</strong> Equipment 12,533 57,110 11,645 -79.61%<br />
<strong>Capital</strong> Outlay<br />
<strong>Capital</strong> Equipment 22,974 178,679 - -100.00%<br />
Total <strong>Capital</strong> Outlay 22,974 178,679 - -100.00%<br />
Total Expenditures $ 850,437 $ 1,109,893 $ 944,128 -14.94%<br />
137
ADMINISTRATION<br />
Variance Justification<br />
Purchased Services (+129,231):<br />
<br />
<br />
<br />
<br />
<br />
Contracted Services (+2,900): Camera and video monitoring service for City Hall and Evidence<br />
Facility.<br />
Professional Services (+110,595): Additional photo red light to be installed at S. Dayton St. and<br />
Belleview Ave. Arapahoe/Douglas Hazardous Material Response Team – all agencies within the two<br />
counties must pay for this service.<br />
Telecommunications Services (+$13,919): An analysis of city data was completed, resulting in an<br />
overall cost savings.<br />
Dues/Memberships (+1,417): Added several new agency memberships and an increase in existing<br />
membership fees.<br />
Catering/Dining Services (+400): Increase is due to additional Citizen Academy participants.<br />
Supplies/Non-<strong>Capital</strong> Equipment (-$45,465):<br />
<br />
<br />
Office Supplies (+35): One additional Colorado Revised Statute book.<br />
<strong>Operating</strong> Supplies (-$45,500): The decrease is a result of one-time expenditures through the<br />
Forfeiture Fund.<br />
<br />
<strong>Capital</strong> Outlay (-$178,679): The decrease is a result of one-time expenditures through the Forfeiture Fund.<br />
138
SUPPORT SERVICES<br />
Statement of Purpose<br />
The purpose of the Support Services Program is to support the core functions of the Police Department by handling all<br />
incoming telephone calls and routing police personnel to calls for service, entering data from police reports into the<br />
Records Management System, seeking unique funding mechanisms for organizational projects and equipment by<br />
seeking grants, and the recruitment, training and development of our employees. All of this will augment community<br />
connectivity to a highly professional set of police services.<br />
Description<br />
Support Services consists of the Records, Grant Management, Recruiting and Training, Policy Development and<br />
Accreditation units, Police Department lobby services, as well as the 9-1-1 Center.<br />
Accomplishments<br />
In 2017, the Support Service team was responsible for the implementation and solution development of many new<br />
technologies and system process improvements. The Police Department will complete the final third phase of<br />
implementation and activation of the new Motorola APX6000 portable radios. This has enhanced the quality and<br />
speed of radio transmissions as well as improved officer safety. The Police Department has helped improve the CAD<br />
and RMS systems for all Arapahoe County law enforcement agencies. In collaboration with the Arapahoe County<br />
E911 Authority and all county Law Enforcement partners, the Police Department has invested significant resources<br />
this year for a planned transition to the Tritech CAD/RMS platform in early <strong>2018</strong>. This project will streamline how law<br />
enforcement information is received, stored, and disseminated to all law enforcement partners across Arapahoe<br />
County. The records and administrative lobby personnel were integrated into a Police Operations Support Technician<br />
concept. This provides a direct and immediate point of contact for all services requests in the Police lobby. The Police<br />
Operations Support Technician unit launched the GovQA web based records release program that has improved<br />
customer access to police records. <strong>Annual</strong> training has been broadened through the launch of regular training<br />
assignments through the Smart Force web application. This provides consistent delivery of program based police<br />
training while on site and on shift.<br />
Goals/Objectives<br />
In <strong>2018</strong>, Support Services will continue to provide the highest level of support to the police department through the<br />
constant review and development of law enforcement best practices and the development of our employees.<br />
Policy development will continue with consistent review for effectiveness in line with our accreditation and best<br />
practices and the delivery of realistic, on-going and validated training for our employees. The 911 Center will utilize<br />
the new Tritech CAD/RMS system to receive, streamline and direct police resources to calls for service. The POST<br />
team will continue to adapt to the quality control role now provided to our electronic records implementation within the<br />
new system while also serving our community in a timely manner for records requests. Grant Management will focus<br />
on maintaining all reporting mechanisms and the application of appropriate usage of funding and continually seeking<br />
future grant funding processes. Training and Recruitment will maintain a vigilant focus on seeking out quality training<br />
and hiring the right people who are dedicated to our values of building relationships.<br />
Conversely, the number of calls dispatched by the 9-1-1 Center increased from approximately 88,000 in 2016 to<br />
approximately 90,000 in 2017. This increase call volume is attributed to the continued population growth experienced<br />
throughout the Denver-metro area. Although the police department continues to experience a significant increase in<br />
calls for service, the average response time from when the call is received in the 911 Center to the time an officer<br />
arrives on scene has remained relatively stable at less than 4 ½ minutes. The Support Service Program will continue<br />
to collaborate with the Patrol Services Program in <strong>2018</strong> to ensure the average response time remains at or below the<br />
4 ½ minute mark.<br />
139
SUPPORT SERVICES<br />
Outcome Measures<br />
911 Center: Average response time to priority one calls (time of call<br />
received to officer arrival).<br />
Training and Development: Average number of training hours for<br />
officers.<br />
2015<br />
Actual<br />
2016<br />
Actual<br />
2017<br />
Estimate<br />
<strong>2018</strong><br />
Target<br />
4:20 4:20 4:30 4:30<br />
192 192 195 195<br />
Service Level Indicators<br />
2015<br />
Actual<br />
2016<br />
Actual<br />
2017<br />
Estimate<br />
Number of reports processed. 7,707 7,273 9,600<br />
Grant dollars awarded. $69,570 $143,000 $50,000<br />
Total Training Hours. 14,850 13,584 16,851<br />
Total Average Training Hours per Officer. 209 212 195<br />
Total Average Training Hours per Civilian. 39 32 30<br />
Number of calls dispatched. 64,000 88,000 90,000<br />
140
SUPPORT SERVICES<br />
Expenditure Detail<br />
2016<br />
Audited<br />
Actuals<br />
2017<br />
Amended<br />
<strong>Budget</strong><br />
<strong>2018</strong><br />
<strong>Adopted</strong><br />
<strong>Budget</strong><br />
% Change<br />
Personnel<br />
Regular Wages $ 994,869 $ 1,003,476 $ 1,014,971 1.15%<br />
Longevity Service Award 7,460 9,445 8,145 -13.76%<br />
Rate/Shift Differential 214 3,000 3,000 0.00%<br />
Extra Duty Assignment 7,791 - - 0.00%<br />
Overtime Wages 11,417 15,000 15,000 0.00%<br />
Clothing Allowance 700 - - 0.00%<br />
Cleaning Allowance 500 500 500 0.00%<br />
Communication Allowance 840 840 840 0.00%<br />
Social Security 55,344 60,553 56,163 -7.25%<br />
Medicare 14,444 14,557 14,643 0.59%<br />
Workers Compensation 3,895 2,187 4,375 100.05%<br />
FPPA Death & Disability 1,267 747 2,759 269.34%<br />
Retirement Contributions 73,898 68,787 38,487 -44.05%<br />
Medical Insurance 148,061 171,049 169,971 -0.63%<br />
Dental Insurance 6,928 8,627 8,152 -5.51%<br />
Insurance Waivers 5,438 4,350 5,550 27.59%<br />
Life/AD&D Insurance 3,608 3,633 3,308 -8.95%<br />
Disability Insurance 3,086 3,110 2,944 -5.34%<br />
Total Personnel 1,339,760 1,369,861 1,348,808 -1.54%<br />
Purchased Services<br />
Professional Services 13,953 122,524 123,124 0.49%<br />
Catering/Dining Services 1,012 2,000 2,000 0.00%<br />
Repair/Maintenance Services 2,258 16,000 19,937 24.61%<br />
Telecommunication Services 629 - - 0.00%<br />
Training/Education 132,197 128,400 122,250 -4.79%<br />
Dues/Memberships 75 - - 0.00%<br />
Mileage/Travel 12 100 500 400.00%<br />
Miscellaneous Services - 1,000 1,000 0.00%<br />
Total Purchased Services 150,136 270,024 268,811 -0.45%<br />
Supplies/Non-<strong>Capital</strong> Equipment<br />
<strong>Operating</strong> Supplies 2,783 7,825 7,825 0.00%<br />
Non-<strong>Capital</strong> Equipment 241,127 207,980 86,101 -58.60%<br />
Uniforms/Safety Equipment 106 1,000 1,000 0.00%<br />
Total Supplies/Non-<strong>Capital</strong> Equipment 244,016 216,805 94,926 -56.22%<br />
Total Expenditures $ 1,733,912 $ 1,856,690 $ 1,712,545 -7.76%<br />
141
SUPPORT SERVICES<br />
Variance Justification<br />
Purchased Services (-$1,213):<br />
<br />
Professional Services (+$600): Notary certification: Notary certification for all civilian PD personnel.<br />
Repair/Maintenance Services (+$3,937): Handheld radio repair / maintenance. <strong>Annual</strong> service<br />
agreement maintenance cost that covers all parts and labor for the 84 hand held radios. Increase<br />
reflects actual cost rather than estimated cost in 2017.<br />
<br />
<br />
Training/Education (-$6,150): Senior Management Institute for Police (-$9,250): Final command staff<br />
member attended SMIP in 2017. Recruitment advertisement (+$1,000): One time purchase of<br />
customized banner and tent for recruitment and public outreach activities. Recruitment marketing<br />
supplies (+$1,000): Recurring purchase of marketing giveaways for job applicants and fees for<br />
recruitment coordinator to attend job fairs. Supervisor/trainer development (+$1,100): Purchase of<br />
Human Synergistic assessment tools and associated food/refreshment costs for sergeant and trainer<br />
development classes.<br />
Mileage/Travel (+$400): Training/Recruitment Coordinator travel expenses. Increased by $400 to<br />
reimburse the training and recruitment coordinator for incurred travel expenses.<br />
Supplies/Non-<strong>Capital</strong> Equipment (-$121,879):<br />
Non-<strong>Capital</strong> Equipment (-$123,000)<br />
• Radio Replacement Program: program completed in 2017.<br />
• Firearms Supplies (+$1,650): Range hearing protection replacement program was completed<br />
in 2017 (-$2,250). Purchase of two 40mm less lethal launchers for patrol team use (+$3,900).<br />
• Taser (-$529): Taser replacement program: The new Taser X2 platform will replace the<br />
former X26 models over a 5-year project. The <strong>2018</strong> budget number is lower than the annual<br />
replacement cost for the old X26 weapons.<br />
142
PATROL SERVICES<br />
Statement of Purpose<br />
The purpose of the Patrol Services Program is to proactively prevent, respond to and resolve public safety concerns,<br />
code/wildlife enforcement issues, and other community problems.<br />
Description<br />
Patrol Services, to include Special Operations, provides uniformed community patrol to neighborhood and business<br />
areas in the Village and works to improve the partnership between the community and the department. Traffic Safety<br />
Officers provide increased traffic safety and enforcement to high traffic and accident locations. School Resource Officers<br />
provide a police presence to promote safe environments in all Village schools, both public and private. The Community<br />
Liaison Officer provides connectivity with the community to all public safety services. The Code Enforcement Officers<br />
mainly resolve domestic animal and wildlife issues. Within this program, we also maintain an Emergency Response<br />
Team which is fully functional, trained and equipped to a very high readiness level for a variety of high liability and low<br />
frequency situations. Emergency Management and Special Events are an important responsibility, due to the unique<br />
composition of the Village, a large <strong>amp</strong>hitheater and multiple popular public events throughout the year.<br />
Accomplishments<br />
In 2017, the Police Department’s focus was to provide directed patrol policing efforts in locations where a higher amount<br />
of crime, calls for police service and higher levels of traffic accidents/incidents were identified. Our purpose was to<br />
address/resolve those incidents and to prevent future incidents from occurring. An analysis of criminal activity and<br />
accidents/incidents identified the I-25 corridor being responsible for a large percentage of the crime and traffic<br />
accidents/incidents occurring in the Village. Consequently, the department committed more resources to the busy<br />
corridor and is targeting the specific time frames when the crime and accidents/incidents are occurring, with the specific<br />
intent to further reduce these numbers. These deployments are strategic in nature and designed to keep dedicated<br />
patrols in their respective neighborhoods and provide more resources when and where they are needed most to prevent<br />
crime and traffic related issues. By augmenting neighborhood patrols and focused enforcement efforts, the Impact<br />
Team, Traffic Safety Unit, School Resource Unit and the Community Liaison Officer are continually seeking to improve<br />
relationships. An ex<strong>amp</strong>le of this is our partnership with the hotel and department store managers in efforts to address<br />
criminal issues revolving around narcotics and thefts. Many other serious crimes stem from these issues, and officers<br />
have had a significant impact in addressing concerns by focusing on the root causes that lead to these crimes. Creating<br />
partnerships with business managers and working together to suppress or eliminate crimes has increased our patrol<br />
efforts along the Arapahoe Road and I-25 corridor.<br />
Goals/Objectives<br />
In <strong>2018</strong>, Patrol Services will continue to focus resources along the I-25 corridor and residential areas throughout the<br />
Village. The department will continue to analyze crime data patterns and focus prevention efforts on the root causes of<br />
crime and traffic accidents. Areas impacted by crime will be identified and officers will work with victims, businesses,<br />
and residents to reduce the opportunity for criminals to commit crime. Clear goals will be set to be able to measure our<br />
progress in key statistical areas. Traffic Safety Officers will continue to work with the district officers to reduce accidents<br />
through education and enforcement. We partner and work with Village traffic engineers to address problem locations<br />
through re-engineering. The impact Officer will continue to work to identify pattern crimes and partner with patrol to<br />
better deploy and direct resources in reducing or eliminating community concerns. School Resource and Community<br />
Liaison Officers will work to develop programs aligned with community safety needs, enhance existing programs and<br />
expand community partnerships to resolve safety concerns in and around Village schools.<br />
143
PATROL SERVICES<br />
Outcome Measures<br />
2015<br />
Actual<br />
2016<br />
Actual<br />
2017<br />
Estimate<br />
<strong>2018</strong><br />
Target<br />
Number of deaths resulting from crime. 0 0 0 0<br />
Number of crimes against property. 861 912 1,064 946<br />
Number of crimes against persons. 138 127 108 124<br />
Number of injury traffic accidents. 47 33 22 19<br />
Number of non-injury accidents. 1,427 1,292 1,608 1,450<br />
Number of fatality traffic accidents. 0 0 0 0<br />
Service Level Indicators<br />
2015<br />
Actual<br />
2016<br />
Actual<br />
2017<br />
Estimate<br />
Number of Priority 1 calls. 375 343 348<br />
Number of case reports. 5,100 4,811 6,820<br />
Number of calls for service (incidents)*. N/A 87,990 88,000<br />
Number of proactive patrols. 25,063 30,940 31,000<br />
Number of foot patrols*. N/A 5,466 4,000<br />
Number of crime prevention notices*. N/A 1,224 2,260<br />
Number of total arrests. 1,304 1,448 1,100<br />
Number of DUI arrests. 162 120 106<br />
*Not tracked prior to 2016.<br />
144
PATROL SERVICES<br />
Expenditure Detail<br />
2016<br />
Audited<br />
Actuals<br />
2017<br />
Amended<br />
<strong>Budget</strong><br />
<strong>2018</strong><br />
<strong>Adopted</strong><br />
<strong>Budget</strong><br />
% Change<br />
Personnel<br />
Regular Wages $ 4,319,767 $ 4,465,853 $ 4,730,192 5.92%<br />
Longevity Service Award 38,000 41,460 43,190 4.17%<br />
Rate/Shift Differential 21,988 30,000 20,000 -33.33%<br />
Extra Duty Assignment 365,923 460,000 460,000 0.00%<br />
Overtime Wages 215,042 213,000 213,000 0.00%<br />
Clothing Allowance 1,400 950 - -100.00%<br />
Cleaning Allowance 27,941 28,000 28,500 1.79%<br />
Communication Allowance - - 420 100.00%<br />
Social Security 9,589 25,323 28,248 11.55%<br />
Medicare 68,103 73,638 76,670 4.12%<br />
Workers Compensation 123,805 153,327 156,687 2.19%<br />
FPPA Death & Disability 81,921 80,122 88,830 10.87%<br />
Retirement Contributions 590,634 615,014 331,005 -46.18%<br />
Medical Insurance 562,102 526,599 631,809 19.98%<br />
Dental Insurance 27,806 27,992 30,429 8.71%<br />
Insurance Waivers 14,251 14,950 13,500 -9.70%<br />
Life/AD&D Insurance 15,137 16,086 15,328 -4.71%<br />
Disability Insurance 13,333 13,791 13,664 -0.92%<br />
Total Personnel 6,496,742 6,786,105 6,881,472 1.41%<br />
Purchased Services<br />
Professional Services 14,666 20,000 24,125 20.63%<br />
Catering/Dining Services 308 - - 0.00%<br />
Repair/Maintenance Services 790 2,700 2,700 0.00%<br />
Telecommunication Services 20,010 - 336 100.00%<br />
Printing/Publication Services 469 2,450 2,450 0.00%<br />
Training/Education 2,999 5,080 6,580 29.53%<br />
Mileage/Travel 380 - - 0.00%<br />
Total Purchased Services 39,622 30,230 36,191 19.72%<br />
Supplies/Non-<strong>Capital</strong> Equipment<br />
Office Supplies 450 - - 0.00%<br />
<strong>Operating</strong> Supplies 3,829 3,648 8,278 126.92%<br />
Non-<strong>Capital</strong> Equipment 17,023 18,909 22,155 17.17%<br />
Uniforms/Safety Equipment 140,343 88,650 98,250 10.83%<br />
Total Supplies/Non-<strong>Capital</strong> Equipment 161,645 111,207 128,683 15.71%<br />
<strong>Capital</strong> Outlay<br />
<strong>Capital</strong> Equipment 14,813 32,665 - -100.00%<br />
Total <strong>Capital</strong> Outlay 14,813 32,665 - -100.00%<br />
Total Expenditures $ 6,712,822 $ 6,960,207 $ 7,046,346 1.24%<br />
145
PATROL SERVICES<br />
Variance Justification<br />
<br />
Personnel (+95,367): The categories which are directly controlled at the department level are overtime, extra<br />
duty, rate/shift differential and allowances. Changes to these categories are discussed below.<br />
<br />
Rate/Shift Differential (-$10,000): Shift differential pay for lead officer was taken out due to proposal of<br />
6 Corporal Positions.<br />
Purchased Services (+$5,961):<br />
Professional Services (+$4,125):<br />
• (+$1,500): Homeless C<strong>amp</strong> Clean-Ups-Contracted services.<br />
• (+$125): Software Time Management Scheduling System (Signup Genesis)- Scheduling off<br />
duty, extra duty and overtime assignments.<br />
• (+$2,500): Forensic Vehicle Data Downloads-Contracted Services.<br />
<br />
<br />
Telecommunication Services (+$336): Voiance is an interpretation service that will replace language<br />
line (no longer paid for by E911 Authority). Voiance charges a flat fee of $0.70 per minute of interpretation<br />
services. Estimated recurring cost of $336 accounts for 8 hours of Voiance service annually.<br />
Training and Education (+$1,500): Community and Law Enforcement Group Meetings – Cost of<br />
supplies ($1,500) from expanding community based programs to build community partnerships.<br />
Supplies/Non-<strong>Capital</strong> Equipment (+$17,476):<br />
Non-<strong>Capital</strong> Equipment (+$3,246):<br />
• (+$500): AED and first aid accessories and supplies cost increase in <strong>2018</strong> to replace and/or<br />
purchase new supplies.<br />
• (-$1,760): Purchase two AED’s (down 1 from 2017).<br />
• (+$6,515): Purchase of one True Cam Multifunctional Laser.<br />
Uniforms Safety and Equipment (+$9,600):<br />
• (-$2,000): Project code removed for officer transfer from patrol to recruitment training<br />
coordinator, and one officer vacancy.<br />
• (+$9,000): 13 scheduled patrol replacements of ballistic vests.<br />
• (+$800): Scheduled replacement of two police motorcycle helmets.<br />
• (+$800): Scheduled replacement of two pairs of police motorcycle boots.<br />
• (+$4,700): These kits are used to reverse the dangerous effects of drug related overdoses. 60<br />
new kits will need to be purchased for <strong>2018</strong> to replace the expired kits in stock.<br />
146
DETECTIVE SERVICES<br />
Statement of Purpose<br />
The purpose of Detective Services Program is to solve cases and provide services to victims of crime. Detective<br />
Services includes; the Detective Unit, Crime Lab, and the Evidence & Property Unit.<br />
Description<br />
The primary function of Detective Services is to solve cases by conducting investigative follow-up, initiating criminal<br />
investigations, conducting crime scene and laboratory forensics needs and capacities, and the formal filing of criminal<br />
charges against suspects. In addition, this program collects, preserves, processes and disposes of all evidence and<br />
property.<br />
Accomplishments<br />
In 2017, the Detective Unit continued to utilize Tyler Technology for Case Management as their sole management<br />
system. As a result of this technology piece changeover, the service level indicators have been amended to reflect<br />
areas that can be measured and are important to resolving cases and restoring victims of crime. Detectives have<br />
continued to focus on their two-pronged approach to proactively solve crimes, which includes collaborating with Patrol<br />
Services and crime victims to expedite information related to identifying property type and descriptions of stolen<br />
property as well as utilizing training and equipment to improve Detectives’ ability to conduct covert operations and<br />
investigate crimes. The Detective unit also relies heavily on the use of data through our Strategic Intelligence<br />
Deployment & Accountability Plan (SIDAP) to help strategize on how to solve crimes as well as being proactive, when<br />
the information leads them in that direction. Detectives proactively seek partnerships with others from neighboring<br />
agencies in order to help identify patterns, crime trends and identification of suspects.<br />
Goals/Objectives<br />
In <strong>2018</strong>, Detectives will continue to work with our community as well as our neighboring law enforcement agencies to<br />
solve crimes. Relationships are critically important to our overall mission as a unit. The department will continue to<br />
benefit from one of our detectives continuing to gain additional training, experience and acquisition of electronic<br />
forensic equipment from the United States Secret Service due to our commitment and partnership with them. The<br />
cases impacted involve anything from ATM t<strong>amp</strong>ering to assisting with other agencies homicide cases. Detectives<br />
will continue to focus on technology that is rapidly developed and utilizing that to help us towards our end goals.<br />
Outcome Measures<br />
2015<br />
Actual<br />
2016<br />
Actual<br />
2017<br />
Estimate<br />
<strong>2018</strong><br />
Target<br />
Overall Investigations Unit Resolution (Cleared by Arrest/Warrant and<br />
any Exceptional Clearance).<br />
60% 50% 35% 50%<br />
Residential:<br />
Number of residential crimes against property cleared. 50% 45% 50% 50%<br />
Number of residential crimes against person cleared. 75% 100% 90% 90%<br />
Commercial:<br />
Number of commercial crimes against property cleared. 40% 40% 50% 50%<br />
Number of commercial crimes against persons cleared. 85% 80% 80% 85%<br />
Number of All Electronic/Cyber Crimes Resolved. 20% 50% 60% 60%<br />
Service Level Indicators<br />
2015<br />
Actual<br />
2016<br />
Actual<br />
2017<br />
Estimate<br />
Cases Investigated. 661 624 390<br />
Cases Presented for Prosecution. 169 162 122<br />
147
DETECTIVE SERVICES<br />
Expenditure Detail<br />
2016<br />
Audited<br />
Actuals<br />
2017<br />
Amended<br />
<strong>Budget</strong><br />
<strong>2018</strong><br />
<strong>Adopted</strong><br />
<strong>Budget</strong><br />
% Change<br />
Personnel<br />
Regular Wages $ 687,200 $ 745,299 $ 896,769 20.32%<br />
Longevity Service Award 8,736 8,801 9,266 5.28%<br />
Rate/Shift Differential 3,167 - - 0.00%<br />
Extra Duty Assignment 23,561 - - 0.00%<br />
Overtime Wages 17,867 39,500 25,000 -36.71%<br />
Clothing Allowance 3,750 4,900 8,000 63.27%<br />
Cleaning Allowance 3,461 4,000 4,000 0.00%<br />
Social Security 6,647 9,081 11,630 28.07%<br />
Medicare 10,302 11,240 13,142 16.92%<br />
Workers Compensation 15,757 20,581 22,995 11.73%<br />
FPPA Death & Disability 8,222 10,829 11,544 6.60%<br />
Retirement Contributions 85,594 94,512 57,361 -39.31%<br />
Medical Insurance 94,657 106,112 133,453 25.77%<br />
Dental Insurance 5,127 5,471 6,289 14.95%<br />
Insurance Waivers 2,108 1,450 1,450 0.00%<br />
Life/AD&D Insurance 2,616 2,698 2,921 8.27%<br />
Disability Insurance 2,104 2,310 2,602 12.64%<br />
Total Personnel 980,876 1,066,784 1,206,422 13.09%<br />
Purchased Services<br />
Professional Services 8,515 12,720 14,810 16.43%<br />
Contracted Services - 1,440 1,000 -30.56%<br />
Catering/Dining Services 235 - - 0.00%<br />
Repair/Maintenance Services 118 400 400 0.00%<br />
Telecommunication Services 5,878 - - 0.00%<br />
Miscellaneous Services 106 750 750 0.00%<br />
Total Purchased Services 14,852 15,310 16,960 10.78%<br />
Supplies/Non-<strong>Capital</strong> Equipment<br />
Office Supplies 19 295 295 0.00%<br />
<strong>Operating</strong> Supplies 24,455 6,735 9,860 46.40%<br />
Non-<strong>Capital</strong> Equipment 3,186 1,000 1,000 0.00%<br />
Uniforms/Safety Equipment 1,730 1,500 2,500 66.67%<br />
Total Supplies/Non-<strong>Capital</strong> Equipment 29,390 9,530 13,655 43.28%<br />
<strong>Capital</strong> Outlay<br />
<strong>Capital</strong> Equipment 75,837 - - 0.00%<br />
Total <strong>Capital</strong> Outlay 75,837 - - 0.00%<br />
Total Expenditures $ 1,100,955 $ 1,091,624 $ 1,237,037 13.32%<br />
148
DETECTIVE SERVICES<br />
Variance Justification<br />
<br />
Personnel (+$139,638): The categories which are directly controlled at the department level are overtime,<br />
extra duty, rate/shift differential and allowances. Changes to these categories are discussed below.<br />
<br />
<br />
Overtime Wages (-$14,500): Decrease due to previous years’ average amount of overtime paid to<br />
detectives for call outs, case investigations, etc.; this amount was decreased to reflect those averages.<br />
Clothing Allowance (+$3,100): Increase due to cost of living increases, as it relates to professional<br />
clothing approved for detective wear. This amount covers nine employees within this division.<br />
Purchased Services (+$1,650):<br />
<br />
<br />
Professional Services (+$2,090): Increase due to additional SANE (sex assault nurse examiners) kits<br />
as well as technology purchases that have not been previously budgeted for (i.e. flash drives for<br />
electronic evidence, etc.).<br />
Contracted Services (-$440): The alarm monitoring fee, which was previously budgeted for and under<br />
this section, in the amount of $1,440, has been moved to a different section; however, there is a new<br />
line item of $1,000 which will cover the drug burn fee for drug disposition.<br />
Supplies/Non-<strong>Capital</strong> Equipment (+$4,125):<br />
<br />
<br />
<strong>Operating</strong> Supplies (+$3,125): Increase due to identifying various lab items that have both increased<br />
in cost as well as equipment that is needed to serve the needs of booking in property & evidence.<br />
Uniforms/Safety Equipment (+$1,000): Increase due to needed cold weather gear for the two CSI’s.<br />
149
150
PUBLIC WORKS<br />
Statement of Purpose<br />
The Public Works Department assures safe, clean, functional, aesthetically pleasing, and environmentally wellmaintained<br />
Village transportation system and drainage ways; and safe, appropriate, and reliable vehicles for<br />
organizational operations.<br />
Description<br />
The Public Works Department is comprised of six primary service areas: Administration, Environmental Services, Fleet<br />
Services, Road Services, Snow and Ice Control, and Transportation Services.<br />
Administration assures high quality department outcomes.<br />
Environmental Services focuses on the protection of the natural environment through managing the functionality of<br />
public drainage ways, cleanliness of the 224 lane miles of paved roadways, reliable consolidated single-family<br />
residential trash and recycling, household hazardous waste removal, and large item pick up.<br />
Transportation Services focuses on the safety and mobility of the public while traveling in the Village. Responsibilities<br />
include the operation and maintenance of 48 traffic signals, over 4,000 street signs, over 200 miles of striping and 225<br />
crosswalks. This area also monitors and evaluates traffic conditions to initiate steps to improve safety and mobility<br />
within the Village, including working closely with adjacent communities to promote regional traffic solutions.<br />
Snow and Ice Control assures roadways are safe and accessible during and after snow events.<br />
Roads Services is responsible for assuring a safe, available and smooth network of 224 lane miles of roadway<br />
throughout the Village. In addition, the service area manages the availability of the Right-of-Way (ROW) for utilities by<br />
overseeing non-Village construction activities through the issuance and administration of ROW permits.<br />
Fleet Services focuses on assuring that the 254 pieces of vehicles/equipment that the Village utilizes daily in carrying<br />
out services to the community, including police and snow and ice control, are appropriate, safe, and reliable.<br />
In addition to oversight of operations and maintenance of the primary service areas, the Public Works Department<br />
Managers are also responsible for managing Village capital projects related to Streets & Transportation, Buildings,<br />
Drainage, and other miscellaneous projects within the <strong>Capital</strong> <strong>Improvement</strong> Program. The CIP budget for these projects<br />
in <strong>2018</strong> is approximately $16.39 million, with a significant portion associated with the Phase 2 improvements for the<br />
Maintenance Facility. Managing capital projects entails determining project feasibility, developing project scope,<br />
facilitating public involvement, allocation of funding, preparing project proposals, managing the bid process, project<br />
scheduling, real-property acquisition, site preparation, design and construction management, and assuring the<br />
completed projects meet intended outcomes.<br />
151
PUBLIC WORKS<br />
Organizational Chart<br />
Director of Public Works<br />
Management Analyst<br />
Transportation Manager<br />
Roads Manager<br />
Environment Manager<br />
Fleet Manager<br />
Administrative<br />
Supervisor<br />
Transportation Planner<br />
Construction Contract<br />
Supervisor<br />
Project Manager II<br />
Mechanic/Service<br />
Technician (4)<br />
Administrative Assistant<br />
(2.5)<br />
Traffic Systems<br />
Coordinator<br />
ROW<br />
Coordinator<br />
Project Manager I<br />
Fleet Parts Coordinator<br />
Project Manager II<br />
Inspector (3)<br />
Supervisors (2)<br />
Traffic Inspector<br />
Supervisor<br />
Maintenance Worker (7)<br />
Traffic Signal Technician<br />
Maintenance Worker (3)<br />
Inspector (2)<br />
Supervisor<br />
Maintenance Worker (3)<br />
152
PUBLIC WORKS<br />
Personnel & Financial Summary<br />
2016<br />
Audited<br />
Actuals<br />
2017<br />
Amended<br />
<strong>Budget</strong><br />
<strong>2018</strong><br />
<strong>Adopted</strong><br />
<strong>Budget</strong><br />
% Change<br />
Staff - Full Time Equivalency (FTE): 45.50 45.50 45.50 0.00%<br />
Expenditures By Category:<br />
Personnel $ 3,798,611 $ 4,003,614 $ 4,066,498 1.57%<br />
Purchased Services 1,535,856 1,859,801 1,615,502 -13.14%<br />
Supplies/Non-<strong>Capital</strong> Equipment 1,159,232 1,264,864 1,320,064 4.36%<br />
<strong>Capital</strong> Outlay 1,449,146 1,356,250 1,547,223 14.08%<br />
Total Expenditures $ 7,942,845 $ 8,484,529 $ 8,549,287 0.76%<br />
Expenditures By Division:<br />
Administration $ 454,393 $ 516,444 $ 486,931 -5.71%<br />
Environmental Services 2,173,240 2,289,866 2,313,849 1.05%<br />
Transportation 1,439,090 1,796,702 1,727,081 -3.87%<br />
Snow & Ice Control 243,972 330,888 322,981 -2.39%<br />
Roads 900,513 940,339 1,062,842 13.03%<br />
Fleet Management 2,731,637 2,610,290 2,635,603 0.97%<br />
Total Expenditures $ 7,942,845 $ 8,484,529 $ 8,549,287 0.76%<br />
Expenditures & Full-Time Equivalency<br />
Expenditures<br />
$8,600,000<br />
$8,500,000<br />
$8,400,000<br />
$8,300,000<br />
$8,200,000<br />
$8,100,000<br />
$8,000,000<br />
$7,900,000<br />
$7,800,000<br />
$7,700,000<br />
$7,600,000<br />
2016<br />
Audited<br />
Actuals<br />
2017<br />
Amended<br />
<strong>Budget</strong><br />
<strong>2018</strong><br />
<strong>Adopted</strong><br />
<strong>Budget</strong><br />
50.00<br />
45.00<br />
40.00<br />
35.00<br />
30.00<br />
25.00<br />
20.00<br />
15.00<br />
10.00<br />
5.00<br />
-<br />
Full-Time Equivalent (FTE)<br />
Total Expenditures<br />
Staff - Full Time Equivalency (FTE):<br />
Explanation of <strong>Budget</strong> Variances<br />
Significant changes in the <strong>2018</strong> budget include variances in departmental programs associated with one-time costs.<br />
Purchased Services shows a reduction due to the update of the Transportation Plan in 2017 (-$247,000); however, a<br />
study of Orchard Road between Quebec Street and I-25 is included in the <strong>2018</strong> budget (+$50,000). Telecommunication<br />
Services are based on the new vendor plan and employee devices, and results in an overall decrease in the department.<br />
With regional efforts to share traffic data, a firewall and associated services is proposed for <strong>2018</strong> for the Village’s traffic<br />
system network. Non-<strong>Capital</strong> Equipment sees an increase for <strong>2018</strong> and is primarily due to the replacement of 27 mobile<br />
radios for Public Works. Changes in <strong>Capital</strong> Outlay are attributable to the replacement of Village vehicles and equipment,<br />
which varies from year to year based on utilization, repair needs, and down time.<br />
153
PUBLIC WORKS<br />
Expenditure Detail<br />
2016<br />
Audited<br />
Actuals<br />
2017<br />
Amended<br />
<strong>Budget</strong><br />
<strong>2018</strong><br />
<strong>Adopted</strong><br />
<strong>Budget</strong><br />
% Change<br />
Personnel<br />
Regular Wages $ 2,775,733 $ 2,880,986 $ 2,999,065 4.10%<br />
Longevity Service Award 32,419 32,933 34,483 4.71%<br />
Overtime Wages 68,757 114,195 109,890 -3.77%<br />
Clothing Allowance 5,425 5,550 5,650 1.80%<br />
Communication Allowance 5,720 6,780 5,460 -19.47%<br />
Vehicle Allowance 3,600 3,600 3,600 0.00%<br />
Social Security 171,297 182,154 188,941 3.73%<br />
Medicare 40,570 40,336 41,789 3.60%<br />
Workers Compensation 51,284 64,457 68,673 6.54%<br />
Retirement Contributions 192,449 200,587 110,365 -44.98%<br />
Medical Insurance 406,795 424,979 448,856 5.62%<br />
Dental Insurance 19,294 21,431 22,329 4.19%<br />
Insurance Waivers 6,554 6,275 8,925 42.23%<br />
Life/AD&D Insurance 10,222 10,419 9,773 -6.20%<br />
Disability Insurance 8,492 8,932 8,699 -2.61%<br />
Total Personnel 3,798,611 4,003,614 4,066,498 1.57%<br />
Purchased Services<br />
Professional Services 36,366 337,500 131,500 -61.04%<br />
Contracted Services 39,204 41,314 35,957 -12.97%<br />
Catering/Dining Services 869 1,000 1,500 50.00%<br />
Repair/Maintenance Services 591,872 588,882 555,150 -5.73%<br />
Disposal/Recycling Services 809,321 802,813 811,603 1.09%<br />
Telecommunication Services 5,793 12,752 11,592 -9.10%<br />
Postage/Shipping Services 7 - - 0.00%<br />
Training/Education 32,434 47,385 45,010 -5.01%<br />
Dues/Memberships 5,346 9,085 9,340 2.81%<br />
Mileage/Travel 329 - - 0.00%<br />
Rentals/Leases 14,315 19,070 13,850 -27.37%<br />
Total Purchased Services 1,535,856 1,859,801 1,615,502 -13.14%<br />
Supplies/Non-<strong>Capital</strong> Equipment<br />
Office Supplies 6,671 500 500 0.00%<br />
<strong>Operating</strong> Supplies 600,812 688,819 678,244 -1.54%<br />
Non-<strong>Capital</strong> Equipment 121,350 42,185 127,010 201.08%<br />
Uniforms/Safety Equipment 16,053 22,350 20,700 -7.38%<br />
Gas/Electricity 234,528 255,000 255,000 0.00%<br />
Water/Sewer 6,880 5,910 6,010 1.69%<br />
Fuel/Propane 172,938 250,100 232,600 -7.00%<br />
Total Supplies/Non-<strong>Capital</strong> Equipment 1,159,232 1,264,864 1,320,064 4.36%<br />
<strong>Capital</strong> Outlay<br />
<strong>Capital</strong> Equipment 1,449,146 1,356,250 1,547,223 14.08%<br />
Total <strong>Capital</strong> Outlay 1,449,146 1,356,250 1,547,223 14.08%<br />
Total Expenditures $ 7,942,845 $ 8,484,529 $ 8,549,287 0.76%<br />
154
ADMINISTRATION<br />
Statement of Purpose<br />
The Administration Program assures high quality department outcomes.<br />
Description<br />
The Administration Program is responsible for assuring the overall effectiveness of department programs. This is<br />
achieved through establishing and monitoring performance expectations, employee training and development, and<br />
identifying opportunities for improved service delivery. Additionally, Administration is the first point of contact for<br />
residents, businesses and other departments and agencies. The program manages the administrative functions of the<br />
department including invoice processing, Large Item Pick Up (LIPU) scheduling and coordination, trash and recycling<br />
service calls, departmental communications, bid process administration, fleet work order administration, and Right-of-<br />
Way permit processing.<br />
Accomplishments<br />
In 2017, Administration in partnership with STS implemented an enterprise asset management system, with service<br />
request management and work management functionality. This included providing structure to the GIS data layers, and<br />
establishing work flows for the system. Implementation of all service request and work order templates will continue in<br />
<strong>2018</strong>. Administration is now handling the day-to-day oversight of the residential trash and recycling contract including<br />
resolution of service concerns with the contracted provider.<br />
In public policy matters, Administration facilitated the discussion with City Council for the creation of policy and<br />
procedures for the transfer of private residential roads.<br />
Goals/Objectives<br />
In <strong>2018</strong>, the Administration Program plans to complete the following:<br />
Implement Phase 2 of the asset management system to include templates to support work flows for<br />
departmental operations.<br />
Complete the design of Phase 2 for the Maintenance Facility <strong>Improvement</strong>s and commence construction.<br />
Lead departmental activities for the organizational planning effort to align activities and initiatives to<br />
organizational outcomes.<br />
Outcome Measures<br />
2015 2016 2017 <strong>2018</strong><br />
Actual Actual Estimate Target<br />
Percent of departmental objectives achieved. 85 71 80 100<br />
Service Level Indicators<br />
2015<br />
Actual<br />
2016<br />
Actual<br />
2017<br />
Estimate<br />
Number of Large-Item-Pick-Up requests taken. 3,202 4,550 4,800<br />
Number of Roads service calls taken. 116 89 100<br />
Number of Transportation Services calls taken. 97 98 110<br />
Number of Trash and Recycling calls taken. 182 198 250<br />
Number of Electronic and Appliance Waste calls taken. 425 534 600<br />
Number of Environmental Services calls taken. 54 55 55<br />
Number of Parks, Trails & Recreation calls taken. 148 180 180<br />
Number of other Village department calls taken. 170 205 230<br />
Number of Fleet work orders entered. 881 845 860<br />
Number of Right-of-Way permits processed. 224 220 225<br />
Number of invoices processed. 3,799 4,050 3,800<br />
Number of GV website Report-A-Concern request taken. 83 83 85<br />
155
ADMINISTRATION<br />
Expenditure Detail<br />
2016<br />
Audited<br />
Actuals<br />
2017<br />
Amended<br />
<strong>Budget</strong><br />
<strong>2018</strong><br />
<strong>Adopted</strong><br />
<strong>Budget</strong><br />
% Change<br />
Personnel<br />
Regular Wages $ 338,569 $ 374,222 $ 376,822 0.69%<br />
Longevity Service Award 1,944 1,783 1,863 4.49%<br />
Overtime Wages 388 1,520 760 -50.00%<br />
Communication Allowance 420 840 420 -50.00%<br />
Vehicle Allowance 3,600 3,600 3,600 0.00%<br />
Social Security 18,939 21,044 21,556 2.43%<br />
Medicare 4,894 5,419 5,487 1.25%<br />
Workers Compensation 455 494 499 1.01%<br />
Retirement Contributions 20,785 23,991 13,087 -45.45%<br />
Medical Insurance 42,896 51,227 39,476 -22.94%<br />
Dental Insurance 2,090 2,700 1,882 -30.30%<br />
Insurance Waivers 2,054 2,175 3,625 66.67%<br />
Life/AD&D Insurance 1,337 1,354 1,225 -9.53%<br />
Disability Insurance 1,036 1,160 1,094 -5.69%<br />
Total Personnel 439,407 491,529 471,396 -4.10%<br />
Purchased Services<br />
Catering/Dining Services 181 500 1,000 100.00%<br />
Telecommunication Services - 7,200 600 -91.67%<br />
Training/Education 5,231 12,150 9,650 -20.58%<br />
Dues/Memberships 1,820 2,315 1,535 -33.69%<br />
Total Purchased Services 7,232 22,165 12,785 -42.32%<br />
Supplies/Non-<strong>Capital</strong> Equipment<br />
Office Supplies 5,392 500 500 0.00%<br />
<strong>Operating</strong> Supplies 2,331 2,150 2,150 0.00%<br />
Uniforms/Safety Equipment 31 100 100 0.00%<br />
Total Supplies/Non-<strong>Capital</strong> Equipment 7,754 2,750 2,750 0.00%<br />
Total Expenditures $ 454,393 $ 516,444 $ 486,931 -5.71%<br />
156
ADMINISTRATION<br />
Variance Justification<br />
<br />
Personnel (-$20,133): The categories that are directly controlled at the department level are overtime and<br />
communication allowance.<br />
<br />
<br />
Overtime (-$760): Reduction is based on evaluation of need over the last few years.<br />
Communication Allowance (-$420): Changes in this line item are based on updated costs for cell<br />
phones and whether the employee chooses a City-issued device or a stipend.<br />
Purchased Services (-$9,380):<br />
<br />
<br />
<br />
<br />
Catering/Dining Services (+$500): The increase is due to adding a coffee cart for staff on the morning<br />
of the Public Works/Park Maintenance Day event.<br />
Telecommunications Services (-$6,600): Changes in this line item are based on updated costs for cell<br />
phones and whether the employee chooses a City-issued device or a stipend. In addition, for the<br />
Administration program, mobile device service was budgeted in the program in 2017 for the asset<br />
management system. These costs have now been allocated to the programs that will use the devices.<br />
Training/Education (-$2,500): Reduction based on one-time training associated with the asset<br />
management system.<br />
Dues/Membership (-$780): This decrease is due to the reduction in membership fees for International<br />
City Managers Association for the Director, and eliminating membership to American Society of Civil<br />
Engineers.<br />
157
ENVIRONMENTAL SERVICES<br />
Statement of Purpose<br />
The Environmental Services Program assures proper conveyance of storm water, management of single family solid<br />
waste, and protection of air and water quality.<br />
Description<br />
The Environmental Services Program is responsible for managing approximately 49 miles of storm sewer pipe, 11 wet<br />
ponds, 26 water quality facilities, seven miles of master drainage ways, and the Colorado Discharge Permit System<br />
(CDPS) Municipal Separate Storm Sewer System (MS4) permit. The program is also responsible for the concrete<br />
replacement program. The Sweeping Program assures that the 224 lane miles of paved roadways are swept in<br />
compliance with Village requirements. The program is also responsible for the residential trash and recycling program,<br />
large item pick-up, and household hazardous waste services.<br />
Accomplishments<br />
In 2017, the program completed construction of the Westlands Park (Parkside Pond) outlet repairs, the emergency<br />
sinkhole repair at Syracuse and Greenwood Plaza Boulevard, and continued maintenance activities at Greenwood<br />
Gulch from Holly to the Highline Canal. Dissolution of the Greenwood Village Sewer General <strong>Improvement</strong> District No.<br />
1 (GID) was finalized, with all GID assets and maintenance responsibilities being transferred to Southgate Sanitation<br />
District. Staff oversaw the undergrounding of utilities along Orchard Road in partnership with Centennial, and formalized<br />
the scope of the Cherry Creek Village North utility undergrounding project. Design of the Goldsmith Gulch – Orchard<br />
Road at Silo Park Culvert Replacement Project commenced, and design for Greenwood Gulch – Holly to High Line<br />
Canal Drainage <strong>Improvement</strong> Project, and the Bridgewater Ponds <strong>Improvement</strong> Projects were completed. Design of<br />
the Belleview Avenue and Clarkson Street Drainage <strong>Improvement</strong>s Project was also completed after a delay due to<br />
utility conflicts. Due to CDOT permitting requirements, construction of the project will be delayed until <strong>2018</strong>. Staff<br />
continued to implement changes associated with the new MS4 permit and implemented the first phase of a new asset<br />
management system for Public Works and Parks, Trails and Recreation. Staff continued to evaluate the benefits of the<br />
automatic vehicle locating system for sweeping operations. The Goldsmith Gulch Master Drainage Plan and Flood<br />
Hazard Area Delineation (FHAD) Update was started during 2017, in partnership with the Urban Drainage & Flood<br />
Control District UDFCD).<br />
Goals/Objectives<br />
In <strong>2018</strong>, the program plans to complete the following:<br />
Construction of the Greenwood Gulch – Holly to High Line Canal Drainage <strong>Improvement</strong>s (in partnership with<br />
UDFCD). This includes removal and replacement of the low-flow trail crossing located near the midpoint of<br />
Greenwood Gulch between Holly and the High Line Canal and reestablishing the low-flow channel through the<br />
reach.<br />
Complete design of Goldsmith Gulch – Orchard Road at Silo Park Culvert Replacement Project (in partnership<br />
with UDFCD). The project will improve drainage under Orchard Road to prevent overtopping in extreme<br />
weather events.<br />
Construction of the Bridgewater Ponds <strong>Improvement</strong> Project. The project will increase the conveyance of the<br />
channel between the two ponds, remove two buildings from the floodplain, and provide water quality facilities<br />
for a portion of the Arapahoe and I-25 construction project.<br />
Construction of the Belleview Avenue and Clarkson Street Drainage <strong>Improvement</strong>s.<br />
Completion of the Goldsmith Gulch Master Drainage Plan and FHAD Update (in partnership with UDFCD).<br />
158
ENVIRONMENTAL SERVICES<br />
Outcome Measures<br />
2015<br />
Actual<br />
2016<br />
Actual<br />
2017<br />
Estimate<br />
<strong>2018</strong><br />
Target<br />
Number of property damage incidents due to Village drainage systems. 0 0 0 0<br />
Percent of respondents who rated the cleanliness of Village creeks,<br />
streams and drainage ways as Good or Excellent as measured by Citizen N/A 90 N/A 90<br />
Survey.<br />
Percent of CDPS compliance requirements met. 100 100 100 100<br />
Number of accidents or claims due to roadway debris. 0 0 0 0<br />
Percent of respondents rating Household Hazardous Waste Pickup as<br />
Good to Excellent as measured by survey cards.<br />
95 95 95 95<br />
Service Level Indicators<br />
2015<br />
Actual<br />
2016<br />
Actual<br />
2017<br />
Estimate<br />
Number of Large Item Pick Ups Completed. 3,074 3,754 3,300<br />
Volume of Debris Collected (Cubic Yards). 2,737 3,229 4,000<br />
Volume of Wood Recycling (Cubic Yards). 4,693 4,467 3,000<br />
Miles of streets swept.* 6,601 7,216 6,500<br />
Debris picked up during street sweeping (Cubic Yards). 1,371 1,485 1,300<br />
*2017 data adjusted per global positioning satellite data versus odometer readings used in prior years.<br />
159
ENVIRONMENTAL SERVICES<br />
Expenditure Detail<br />
2016<br />
Audited<br />
Actuals<br />
2017<br />
Amended<br />
<strong>Budget</strong><br />
<strong>2018</strong><br />
<strong>Adopted</strong><br />
<strong>Budget</strong><br />
% Change<br />
Personnel<br />
Regular Wages $ 866,553 $ 906,339 $ 969,462 6.96%<br />
Longevity Service Award 14,285 14,950 15,165 1.44%<br />
Overtime Wages 10,329 9,935 9,935 0.00%<br />
Clothing Allowance 2,500 2,400 2,400 0.00%<br />
Communication Allowance 1,740 2,160 1,560 -27.78%<br />
Social Security 54,206 56,680 60,212 6.23%<br />
Medicare 12,677 12,076 12,890 6.74%<br />
Workers Compensation 19,892 26,130 27,468 5.12%<br />
Retirement Contributions 62,737 65,076 36,509 -43.90%<br />
Medical Insurance 132,515 138,975 153,147 10.20%<br />
Dental Insurance 6,087 6,974 7,317 4.92%<br />
Insurance Waivers 2,900 2,900 2,900 0.00%<br />
Life/AD&D Insurance 3,218 3,279 3,163 -3.54%<br />
Disability Insurance 2,667 2,809 2,812 0.11%<br />
Total Personnel 1,192,306 1,250,683 1,304,940 4.34%<br />
Purchased Services<br />
Professional Services 9,206 41,500 21,500 -48.19%<br />
Contracted Services 28,882 26,570 21,213 -20.16%<br />
Repair/Maintenance Services 66,173 67,120 64,650 -3.68%<br />
Disposal/Recycling Services 807,976 801,713 810,503 1.10%<br />
Telecommunication Services 2,175 1,536 4,224 175.00%<br />
Training/Education 9,065 10,750 10,500 -2.33%<br />
Dues/Memberships 1,344 2,000 2,000 0.00%<br />
Rentals/Leases 8,290 11,220 5,850 -47.86%<br />
Total Purchased Services 933,111 962,409 940,440 -2.28%<br />
Supplies/Non-<strong>Capital</strong> Equipment<br />
<strong>Operating</strong> Supplies 7,239 60,379 51,974 -13.92%<br />
Non-<strong>Capital</strong> Equipment 27,257 3,135 3,135 0.00%<br />
Uniforms/Safety Equipment 6,447 7,350 7,350 0.00%<br />
Water/Sewer 6,880 5,910 6,010 1.69%<br />
Total Supplies/Non-<strong>Capital</strong> Equipment 47,823 76,774 68,469 -10.82%<br />
Total Expenditures $ 2,173,240 $ 2,289,866 $ 2,313,849 1.05%<br />
160
ENVIRONMENTAL SERVICES<br />
Variance Justification<br />
<br />
Personnel (+$54,257): The categories that are directly controlled at the department level are overtime and<br />
communication allowance.<br />
<br />
Communication Allowance (-$600): Changes in this line item are based on updated costs for cell<br />
phones and whether the employee chooses a City-issued device or a stipend.<br />
Purchased Services (-$21,969):<br />
<br />
<br />
<br />
<br />
<br />
<br />
Professional Services (-$20,000): The 2017 budget included a one-time, $20,000 line item for the<br />
Goldsmith Gulch Master Drainage Plan and FHAD update.<br />
Contracted Services (-$5,357): <strong>Budget</strong> change is based on an audit of existing facilities and charged<br />
contracted rates for cleaning of maintenance facility sand/oil separators.<br />
Repair Maintenance Services (-$2,470): <strong>Budget</strong> change is based on an audit of existing facilities and<br />
charged contracted rates for cleaning of inlet filter baskets.<br />
Disposal/Recycling Services (+$8,790): Increase of $5,000 for unwanted appliances based on vendor<br />
change and increase of fees by $5 per pickup and increase of $3,000 for maintenance facility debris<br />
disposal based on 3 year average of actual expenditures.<br />
Telecommunication Services (+$2,688): Increase is due to allocation of costs to program area from<br />
Administration, including data plan for crew tablet for work order system.<br />
Rentals/Leases (-$5,370): Decrease of $9,720 for removal of mini-excavator rental due to purchase of<br />
similar equipment. Includes increase of $1,500 for rental compactors based on current weekly rate,<br />
inclusion of $2,000 for trench shoring rental, and gas cylinder rental that was previously in the<br />
Transportation program.<br />
Supplies/Non-<strong>Capital</strong> Equipment (-$8,305):<br />
<br />
<strong>Operating</strong> Supplies (-$8,405): <strong>Budget</strong> for consumables for in-house drainage projects reduced based<br />
on three year average of actual expenditures.<br />
161
TRANSPORTATION<br />
Statement of Purpose<br />
The Transportation Services Program assures a safe, efficient, predictable and reliable movement of traffic in support<br />
of the adopted Transportation Plan.<br />
Description<br />
The Transportation Services Program is responsible for managing the transportation systems throughout the Village.<br />
The program evaluates long range transportation planning in collaboration with various departments and agencies with<br />
a focus on development of multi-modal transportation systems. The program operates and maintains the traffic control<br />
devices, including 48 traffic signals and just over 4,000 signs throughout the Village. The program also maintains the<br />
pavement markings on the 224 paved lane miles. Additionally, the program manages <strong>Capital</strong> <strong>Improvement</strong> Program<br />
projects and participates in the review of new developments.<br />
Accomplishments<br />
In 2017, the program continued to participate in the I-25/Arapahoe Interchange project including the completion of the<br />
roadway construction. The management of the traffic signals was a key factor to maintaining traffic flow during the<br />
disruptive construction. Staff worked with Centennial and CDOT to implement traffic signal timing changes along<br />
Arapahoe Road six times as construction phasing shifted over the course of the project. The program provided the day<br />
to day coordination of the public improvements being built as part of the Village Center DTC development project. 2017<br />
continued the sign replacement program based on Federal traffic safety requirements, and will also assure visibility and<br />
a well-maintained appearance. Over 500 signs were replaced from Monaco Street to I-25 and from Belleview Avenue<br />
to Peakview Avenue. The decorative entrance light CIP project at Dayton Street and Dayton Court was completed inhouse.<br />
New street lights were installed at the intersection of Belleview Avenue and Dayton Street to improve visibility<br />
at night. The program managed the design and construction of a new northbound right turn lane at Belleview Avenue<br />
and Holly Street. This project improves the quality of life for residents by improving the accessibility of the intersection.<br />
The focus was continued on improving the appearance of the traffic signals by updating the lighted street name panels<br />
and replacing faded components. The Transportation Plan and Belleview Avenue/I-25 Environmental Assessment<br />
studies were initiated in 2017 and will continue into <strong>2018</strong>. Both of these projects will seek to engage the community to<br />
help provide long lasting solutions for the transportation system in Greenwood Village.<br />
Goals/Objectives<br />
In <strong>2018</strong>, the program plans to complete the following:<br />
Continue to lead the update of the Village Transportation Plan.<br />
Continue to lead the I-25/Belleview Interchange Environmental Assessment.<br />
Lead the design and construction of the extension of the eastbound left turn lanes at I-25 and Orchard Road.<br />
Complete a sidewalk connection from Yosemite Street to Willow Way just south of the Village Center.<br />
Complete the re-wiring of two traffic signals (DTC Boulevard/Park Terrace and Orchard Road/Greenwood Plaza<br />
Boulevard). Through the years, the wiring has become compromised and during weather events the signals<br />
go into flash frequently.<br />
Continue the sign replacement program to assure visibility and a well-maintained appearance. The<br />
replacement is expected to cover from Peakview Avenue to Arapahoe Road on the west side of I-25, which will<br />
complete the west side of I-25. The program will also move east of I-25 to include the area from Orchard Road<br />
to Costilla Avenue and extend to Dayton Street.<br />
The vehicle detection system was installed in 2009 and 2010 and improved the operations of the traffic signal<br />
system, especially during low volume periods. This system will need to be replaced to maintain the improved<br />
operations. <strong>2018</strong> will see the first year of a proactive replacement plan to replace the detection system at four<br />
intersections a year.<br />
As the traffic signal system expands to connect with regional partners (CDOT, surrounding local agencies) and<br />
provide data to external sources, the ITS network needs to be secured. Network security devices and<br />
configuration will occur in <strong>2018</strong>.<br />
162
TRANSPORTATION<br />
Outcome Measures<br />
2015<br />
Actual<br />
2016<br />
Actual<br />
2017<br />
Estimate<br />
Percent of signals in I-25 corridor area during peak periods operating at a<br />
delay of less than 56 seconds.<br />
74 83 1 80 80<br />
Percent of respondents rating efficiency of traffic signals at intersections<br />
as Good or Excellent as measured by Citizen Survey:<br />
During non-rush hour times. N/A * N/A 90<br />
During rush hour times. N/A * N/A 60<br />
1<br />
Orchard/Willow and Yosemite/Caley intersection improvements in 2016.<br />
* 2016 Citizen Survey not conducted.<br />
Service Level Indicators<br />
2015<br />
Actual<br />
2016<br />
Actual<br />
2017<br />
Estimate<br />
Number of signals in flash. 32 28 25<br />
Average time to repair signals (business hours). 0.5 Hours 0.5 Hours 0.5 Hours<br />
Average time to repair signals (after-hours). 2 Hours 1.5 Hours 1.6 Hours<br />
Vehicle detector failures. 4 8 16<br />
Pedestrian detector failures. 2 3 5<br />
New signs installed. 27 62 40<br />
Number of signs repaired. 95 80 20<br />
Number of signs replaced. 582 684 550<br />
Number of advertisement signs removed. 315 355 400<br />
<strong>2018</strong><br />
Target<br />
163
TRANSPORTATION<br />
Expenditure Detail<br />
2016<br />
Audited<br />
Actuals<br />
2017<br />
Amended<br />
<strong>Budget</strong><br />
<strong>2018</strong><br />
<strong>Adopted</strong><br />
<strong>Budget</strong><br />
% Change<br />
Personnel<br />
Regular Wages $ 584,369 $ 630,620 $ 624,763 -0.93%<br />
Longevity Service Award 5,315 5,685 6,045 6.33%<br />
Overtime Wages 3,492 4,760 4,760 0.00%<br />
Clothing Allowance 1,325 1,600 1,300 -18.75%<br />
Communication Allowance 1,535 1,800 1,440 -20.00%<br />
Social Security 36,222 38,959 38,586 -0.96%<br />
Medicare 8,471 9,113 9,024 -0.98%<br />
Workers Compensation 10,936 14,530 13,780 -5.16%<br />
Retirement Contributions 35,146 41,877 22,784 -45.59%<br />
Medical Insurance 88,055 98,200 90,004 -8.35%<br />
Dental Insurance 4,606 5,092 5,075 -0.33%<br />
Insurance Waivers 1,600 1,200 2,400 100.00%<br />
Life/AD&D Insurance 2,039 2,279 2,034 -10.75%<br />
Disability Insurance 1,789 1,955 1,812 -7.31%<br />
Total Personnel 784,900 857,670 823,807 -3.95%<br />
Purchased Services<br />
Professional Services 14,660 260,000 99,000 -61.92%<br />
Contracted Services 345 - - 0.00%<br />
Repair/Maintenance Services 229,870 238,500 248,000 3.98%<br />
Telecommunication Services 2,307 1,712 3,096 80.84%<br />
Training/Education 7,993 8,000 8,000 0.00%<br />
Dues/Memberships 804 2,045 2,430 18.83%<br />
Mileage/Travel 6 - - 0.00%<br />
Rentals/Leases 1,025 850 - -100.00%<br />
Total Purchased Services 257,010 511,107 360,526 -29.46%<br />
Supplies/Non-<strong>Capital</strong> Equipment<br />
<strong>Operating</strong> Supplies 158,424 160,350 160,350 0.00%<br />
Non-<strong>Capital</strong> Equipment 1,665 8,575 2,175 -74.64%<br />
Uniforms/Safety Equipment 2,563 4,000 4,000 0.00%<br />
Gas/Electricity 234,528 255,000 255,000 0.00%<br />
Total Supplies/Non-<strong>Capital</strong> Equipment 397,180 427,925 421,525 -1.50%<br />
<strong>Capital</strong> Outlay<br />
<strong>Capital</strong> Equipment - - 121,223 100.00%<br />
Total <strong>Capital</strong> Outlay - - 121,223 100.00%<br />
Total Expenditures $ 1,439,090 $ 1,796,702 $ 1,727,081 -3.87%<br />
164
TRANSPORTATION<br />
Variance Justification<br />
<br />
Personnel (-$33,863): The categories that are directly controlled at the department level are overtime and<br />
communication allowance.<br />
<br />
Communication Allowance (-$360): Changes in this line item are based on updated costs for cell<br />
phones and whether the employee chooses a City-issued device or a stipend.<br />
Purchased Services (-$150,581):<br />
<br />
<br />
<br />
<br />
<br />
Professional Services (-$161,000): Reduction is associated with the Transportation Plan update that<br />
was budgeted in 2017 for $247,000. Account includes an annual recurring cost of $15,000 for structural<br />
analysis of traffic signal poles, a one-time cost of $50,000 for an Orchard Road Concept study from I-25<br />
to Quebec, and a one-time cost of $24,000 to install a firewall for the ITS network.<br />
Repair Maintenance Services (+$9,500): <strong>Budget</strong> increased due to increase in services provided over<br />
the past two years for graffiti removal services to remove graffiti from Village infrastructure and Utility<br />
Notification Center (UNCC) locate fees associated with locating our traffic signal and ITS network.<br />
Telecommunication Services (+$1,384): Increase is due to allocation of costs to program area from<br />
Administration, including data plan for crew tablet for work order system.<br />
Dues/Memberships (+$385): Funding added for thee Maintenance Workers to have membership in the<br />
International Municipal Signal Association (IMSA) which offers training and various resources for traffic<br />
control devices.<br />
Rentals/Leases (-$850): This budget is for gas cylinders for welding and was previously spread among<br />
programs. For <strong>2018</strong> the budget is shifted to Environmental Services so all funding can be tracked in<br />
one place.<br />
Supplies/Non-<strong>Capital</strong> Equipment (-$6,400):<br />
<br />
Non-<strong>Capital</strong> Equipment (-$6,400): <strong>Budget</strong> reduced due to one-time purchases in 2017 for a portable<br />
generator and inverter for the traffic signal technician truck.<br />
<strong>Capital</strong> Outlay (+$121,223):<br />
<br />
<strong>Capital</strong> Equipment (+$121,223): Increase is due to one-time cost to install switch and firewall for the<br />
Village’s traffic system network ($36,083), and the start of an annual vehicle detection system<br />
replacement program for the 48 traffic signals ($85,140). The annual program will replace the vehicle<br />
detection at 4 intersections per year.<br />
165
SNOW & ICE CONTROL<br />
Statement of Purpose<br />
The Snow and Ice Control Program assures roadways are safe and accessible during and after snow events.<br />
Description<br />
Snow and Ice Control operations are implemented based on established roadway priorities. The program monitors<br />
weather conditions, including air and pavement temperature, type and rate of precipitation, and weather forecasts for<br />
the most effective and proactive utilization of resources, and alters operations as conditions change. The program<br />
typically utilizes multiple types of equipment, including twelve snow plow trucks for de-icing, snow plowing, and post<br />
storm operations.<br />
Accomplishments<br />
In 2017, over 25,000 miles were driven during snow and ice control operations over the Village’s roadways for the 20<br />
snow events. Operations utilized over 2,000 tons of de-icing/traction material. Ice removal in neighborhoods continued<br />
to be a proactive focus in 2017, minimizing the need to “bust” ice. The program continued to utilize an automated vehicle<br />
locating system to help manage the resources used during snow and ice events.<br />
Goals/Objectives<br />
In <strong>2018</strong>, the program plans to complete the following:<br />
Continue to monitor and evaluate training opportunities, material types, application rates, and utilization of<br />
resources.<br />
Continue the proactive focus on preventing ice formation in residential neighborhoods that jeopardizes safety<br />
by covering sidewalks or extending into a travel lane.<br />
The automated vehicle locating (AVL) system, acquired in fall 2016, for snow plowing operations will continue<br />
to be evaluated in <strong>2018</strong> to see if it is the best system for Village operations. The current system will remain in<br />
place through <strong>2018</strong>, but staff will consider if other systems can provide additional benefits.<br />
Outcome Measures<br />
Percent of respondents rating on how well the Village streets are cleared<br />
during a snowstorm as good to excellent as measured by Citizen Survey.<br />
* 2016 Citizen Survey not conducted.<br />
2015<br />
Actual<br />
2016<br />
Actual<br />
2017<br />
Estimate<br />
<strong>2018</strong><br />
Target<br />
N/A * N/A >90<br />
Service Level Indicators<br />
2015<br />
Actual<br />
2016<br />
Actual<br />
2017<br />
Estimate<br />
Number of storms. 26 15 20<br />
Tons of material used. 3,041 1,538 2,000<br />
Number of lane miles driven. 41,097 23,277 25,000<br />
Snowfall (inches). 92 71.1 60<br />
166
SNOW & ICE CONTROL<br />
Expenditure Detail<br />
2016<br />
Audited<br />
Actuals<br />
2017<br />
Amended<br />
<strong>Budget</strong><br />
<strong>2018</strong><br />
<strong>Adopted</strong><br />
<strong>Budget</strong><br />
% Change<br />
Personnel<br />
Overtime Wages 38,850 60,000 60,000 0.00%<br />
Social Security - 3,720 3,720 0.00%<br />
Medicare - 870 870 0.00%<br />
Workers Compensation 1,641 2,003 1,891 -5.59%<br />
Total Personnel 40,491 66,593 66,481 -0.17%<br />
Purchased Services<br />
Professional Services 4,500 5,000 5,000 0.00%<br />
Contracted Services 1,436 4,680 4,680 0.00%<br />
Catering/Dining Services 426 500 500 0.00%<br />
Repair/Maintenance Services 4,356 5,000 5,000 0.00%<br />
Training/Education 5,620 4,935 5,310 7.60%<br />
Total Purchased Services 16,338 20,115 20,490 1.86%<br />
Supplies/Non-<strong>Capital</strong> Equipment<br />
<strong>Operating</strong> Supplies 187,143 244,180 236,010 -3.35%<br />
Total Supplies/Non-<strong>Capital</strong> Equipment 187,143 244,180 236,010 -3.35%<br />
Total Expenditures $ 243,972 $ 330,888 $ 322,981 -2.39%<br />
Variance Justification<br />
Purchased Services (+$375):<br />
<br />
Training Education (+$375): Increase is associated with the annual American Public Works<br />
Association (APWA) Snow & Ice Conference in Loveland, CO.<br />
Supplies/Non-<strong>Capital</strong> Equipment (-$8,170):<br />
<br />
<strong>Operating</strong> Supplies (-$8,170): Amount of anti-icing material used was reduced based on last 4 year<br />
average.<br />
167
ROADS<br />
Statement of Purpose<br />
The Roads Services Program assures safe, available and well-maintained roadways and trails, and safe and efficient<br />
use of rights-of-way.<br />
Description<br />
The Roads Program is responsible for the quality of the 224 lane miles of pavement, 5 miles of gravel roads, 15 miles<br />
of asphalt trails along with the issuance and management of Right-of-Way (ROW) permits, inspection of new<br />
development construction, and management of <strong>Capital</strong> <strong>Improvement</strong> Program projects.<br />
Accomplishments<br />
In 2017, the program completed the Long Road Reconstruction Project and the Holly Street Intersection <strong>Improvement</strong><br />
Project. A variety of treatment strategies were applied to approximately 42.8 lane miles of pavement. These included<br />
2.0 lane miles of full depth reconstruction, 2.3 lane miles of rehabilitation, 11.2 lane miles of rejuvenator treatment and<br />
27.3 lane miles of crack sealing. 1,520 feet of trails were rehabilitated also. In conjunction with the Transportation<br />
Program, the rehabilitation of the Yosemite Bridge Vehicular Box Culvert and the Yosemite Bridge Rail Study were<br />
completed. Three test sections were placed on the gravel roads with two different mixes for in place evaluation to<br />
determine what mix will be used on the gravel road reconstruction to occur in <strong>2018</strong>. The design was completed for the<br />
reconstruction of 3 lane miles of the total 5 lane miles of gravel roads. Finally, the program managed the construction<br />
of utilities placed within the ROW through the issuance of approximately 225 ROW permits.<br />
Goals/Objectives<br />
In <strong>2018</strong>, the program plans to complete the following:<br />
The design phase for the reconstruction of the remaining 2 lane miles of gravel roads.<br />
The reconstruction of 3 lane miles of gravel roads.<br />
10.6 lane miles of rehabilitation/reconstruction.<br />
20.1 lane miles of preservation/rejuvenation.<br />
30 lane miles of crack sealing.<br />
3,800 feet of trail rehabilitation.<br />
Management of 225 ROW permits.<br />
Outcome Measures<br />
2015<br />
Actual<br />
2016<br />
Actual<br />
2017<br />
Estimate<br />
<strong>2018</strong><br />
Target<br />
Roadway Average Network Pavement Condition Index (PCI). 81 79 80 80<br />
Percent respondents that rated quality and smoothness of Village<br />
roadways as Good or Excellent as measured by Citizen Survey.<br />
N/A N/A N/A 85<br />
Service Level Indicators<br />
2015<br />
Actual<br />
2016<br />
Actual<br />
2017<br />
Estimate<br />
Lane miles of pavement rated for Paver database. 65 63 85<br />
Number of pavement failure repairs (potholes). 392 274 175<br />
Tons of crack seal/mastic placed. 3 1.5 4<br />
Number of concrete drainage pan failures repaired. 88 98 50<br />
Total number of ROW permits issued. 280 205 225<br />
ROW permit revenue. $139,742 $164,785 $77,500<br />
Number of Major ROW permits issued. 22 10 12<br />
Number of Minor ROW permits issued. 258 195 213<br />
168
ROADS<br />
Expenditure Detail<br />
2016<br />
Audited<br />
Actuals<br />
2017<br />
Amended<br />
<strong>Budget</strong><br />
<strong>2018</strong><br />
<strong>Adopted</strong><br />
<strong>Budget</strong><br />
% Change<br />
Personnel<br />
Regular Wages $ 605,670 $ 592,513 $ 703,768 18.78%<br />
Longevity Service Award 6,685 6,140 7,660 24.76%<br />
Overtime Wages 11,707 35,180 31,640 -10.06%<br />
Clothing Allowance 1,500 1,450 1,850 27.59%<br />
Communication Allowance 1,440 1,440 1,680 16.67%<br />
Social Security 38,250 38,541 44,908 16.52%<br />
Medicare 8,990 9,076 10,504 15.73%<br />
Workers Compensation 11,999 13,435 17,342 29.08%<br />
Retirement Contributions 49,123 45,885 27,422 -40.24%<br />
Medical Insurance 85,523 74,285 114,686 54.39%<br />
Dental Insurance 3,904 3,587 5,795 61.56%<br />
Life/AD&D Insurance 2,306 2,143 2,294 7.05%<br />
Disability Insurance 1,857 1,838 2,041 11.04%<br />
Total Personnel 828,954 825,513 971,590 17.70%<br />
Purchased Services<br />
Professional Services 8,000 31,000 6,000 -80.65%<br />
Contracted Services 7,380 7,480 7,480 0.00%<br />
Catering/Dining Services 262 - - 0.00%<br />
Repair/Maintenance Services 61 10,000 10,000 0.00%<br />
Telecommunication Services 413 1,536 2,712 76.56%<br />
Postage/Shipping Services 7 - - 0.00%<br />
Training/Education 4,475 10,300 10,300 0.00%<br />
Dues/Memberships 556 1,850 2,150 16.22%<br />
Mileage/Travel 323 - - 0.00%<br />
Rentals/Leases 3,788 6,000 6,000 0.00%<br />
Total Purchased Services 25,265 68,166 44,642 -34.51%<br />
Supplies/Non-<strong>Capital</strong> Equipment<br />
Office Supplies 1,136 - - 0.00%<br />
<strong>Operating</strong> Supplies 37,101 42,310 42,310 0.00%<br />
Non-<strong>Capital</strong> Equipment 5,475 - - 0.00%<br />
Uniforms/Safety Equipment 2,582 4,350 4,300 -1.15%<br />
Total Supplies/Non-<strong>Capital</strong> Equipment 46,294 46,660 46,610 -0.11%<br />
Total Expenditures $ 900,513 $ 940,339 $ 1,062,842 13.03%<br />
169
ROADS<br />
Variance Justification<br />
<br />
Personnel (+$146,077): The categories that are directly controlled at the department level are overtime and<br />
communication allowance.<br />
<br />
<br />
Overtime Wages (-$3,540): Overtime amount is based on estimated overtime required for <strong>2018</strong> project<br />
workload, Long Road and Holly Street CIP’s in 2017 required more overtime.<br />
Communication Allowance (+$240): Changes in this line item are based on updated costs for cell<br />
phones and whether the employee chooses a City-issued device or a stipend.<br />
Purchased Services (-$23,524):<br />
<br />
<br />
<br />
Professional Services (-$25,000): The reduction is based on removing the Yosemite Bridge Rail Study<br />
which was a one-time expense.<br />
Telecommunication Services (+$1,176): Increase is due to allocation of costs to program area from<br />
Administration, including data plan for crew tablet for work order system.<br />
Dues/Membership (+$300): The increase is to become member with American Concrete Institute,<br />
which will result in discounted rates for webinars and literature.<br />
170
FLEET MANAGEMENT<br />
Statement of Purpose<br />
The Fleet Management Program assures the availability of safe, reliable, and appropriate vehicles and equipment in a<br />
manner that contributes to successful Village outcomes.<br />
Description<br />
Fleet Management is responsible for maintaining 254 vehicles and equipment for all Village departments.<br />
Accomplishments<br />
In 2017, Fleet Management continued to provide a preventative maintenance and safety inspection program on all<br />
vehicles and equipment. Fleet Management developed a new replacement plan utilizing “best management” practices.<br />
The new plan evaluates vehicles and equipment using several criteria, which include use, condition, maintenance costs,<br />
downtime, age, and utilization. Fleet Management replaced one Police Admin vehicle, replaced one crime scene Police<br />
utility vehicle, added an additional Detective vehicle, replaced two vehicles in the Environment program, replaced four<br />
vehicles in the Developed Parks program, replaced one vehicle in the Streetscapes program, and replaced three<br />
vehicles in the Snow and Ice program. Staff evaluated the replacement of the backhoe loader and based on needs,<br />
this was changed to a compact mini excavator. This will reduce the rental expenditures in <strong>2018</strong> in Environmental<br />
Services. Also, Fleet replaced one vehicle in the Roads program, and replaced the large item pick up grapple truck.<br />
In 2017, Fleet and Shared Technologies staff completed the evaluation of a new Fleet Management Software system<br />
which is included in the Shared Technologies Services <strong>2018</strong> budget. Fleet Services replaced twenty portable radios in<br />
Public Works based on recommendations from the Police Department and Arapahoe County Sheriff’s Office and added<br />
two new mobile radios to the Patch Box truck and Tanker truck. During the year, two patrol vehicles were damaged<br />
beyond repair and replaced.<br />
Goals/Objectives<br />
In <strong>2018</strong>, Fleet Management plans to complete the following:<br />
Implement new Fleet Management software and associated data conversion.<br />
Continue to provide preventative maintenance and safety inspections on all vehicles and equipment.<br />
Continue to refine and collaborate with other departments on vehicle replacement criteria. Specifically to<br />
incorporate a reliability factor.<br />
As part of the <strong>2018</strong> replacement plan:<br />
o Installation of a 400 gallon diesel exhaust fluid dispenser to the fuel island.<br />
o Replace nine vehicles in the Parks, Trails and Recreation program.<br />
o Replace one vehicle in the Community Development program.<br />
o Replace one vehicle in the Fleet program.<br />
o Replace two vehicles in the Environmental program.<br />
o Replace two vehicles in the Snow and Ice program.<br />
o Replace one vehicle in the Traffic program.<br />
o Replace seven units in the Police Department.<br />
o Replace 27 mobile radios in Public Works vehicles.<br />
Outcome Measures<br />
2015<br />
Actual<br />
2016<br />
Actual<br />
2017<br />
Estimate<br />
<strong>2018</strong><br />
Target<br />
Number of accidents attributable to maintenance. 0 0 0 0<br />
Percent of time vehicles available for use as measured by Fleet<br />
Management system.<br />
97 97 96 >96%<br />
Percent of respondents rating Fleet Management as Good or Excellent<br />
as measured by Department Survey.<br />
97 96 99 >98%<br />
171
FLEET MANAGEMENT<br />
Service Level Indicators<br />
2015<br />
Actual<br />
2016<br />
Actual<br />
2017<br />
Estimate<br />
Number of vehicles in the fleet. 141 141 148<br />
Number of equipment pieces in the fleet (loaders, trailers, backhoes,<br />
tractors).<br />
108 108 106<br />
Tech hours working on equipment. 4,026 5,321 5,925<br />
Number of work orders (repairs). 939 887 950<br />
Out-sourced repair and maintenance expenditures. $158,790 $219,000 $275,500<br />
Preventative Maintenance. 354 282 295<br />
Non-Preventative Maintenance. 585 605 655<br />
Expenditure Detail<br />
2016<br />
Audited<br />
Actuals<br />
2017<br />
Amended<br />
<strong>Budget</strong><br />
<strong>2018</strong><br />
<strong>Adopted</strong><br />
<strong>Budget</strong><br />
% Change<br />
Personnel<br />
Regular Wages $ 380,572 $ 377,292 $ 324,250 -14.06%<br />
Longevity Service Award 4,190 4,375 3,750 -14.29%<br />
Overtime Wages 3,991 2,800 2,795 -0.18%<br />
Clothing Allowance 100 100 100 0.00%<br />
Communication Allowance 585 540 360 -33.33%<br />
Social Security 23,680 23,210 19,959 -14.01%<br />
Medicare 5,538 3,782 3,014 -20.31%<br />
Workers Compensation 6,361 7,865 7,693 -2.19%<br />
Retirement Contributions 24,658 23,758 10,563 -55.54%<br />
Medical Insurance 57,806 62,292 51,543 -17.26%<br />
Dental Insurance 2,607 3,078 2,260 -26.58%<br />
Life/AD&D Insurance 1,322 1,364 1,057 -22.51%<br />
Disability Insurance 1,143 1,170 940 -19.66%<br />
Total Personnel 512,553 511,626 428,284 -16.29%<br />
Purchased Services<br />
Contracted Services 1,161 2,584 2,584 0.00%<br />
Repair/Maintenance Services 291,412 268,262 227,500 -15.19%<br />
Disposal/Recycling Services 1,345 1,100 1,100 0.00%<br />
Telecommunication Services 898 768 960 25.00%<br />
Training/Education 50 1,250 1,250 0.00%<br />
Dues/Memberships 822 875 1,225 40.00%<br />
Rentals/Leases 1,212 1,000 2,000 100.00%<br />
Total Purchased Services 296,900 275,839 236,619 -14.22%<br />
Supplies/Non-<strong>Capital</strong> Equipment<br />
Office Supplies 143 - - 0.00%<br />
<strong>Operating</strong> Supplies 208,574 179,450 185,450 3.34%<br />
Non-<strong>Capital</strong> Equipment 86,953 30,475 121,700 299.34%<br />
Uniforms/Safety Equipment 4,430 6,550 4,950 -24.43%<br />
Fuel/Propane 172,938 250,100 232,600 -7.00%<br />
Total Supplies/Non-<strong>Capital</strong> Equipment 473,038 466,575 544,700 16.74%<br />
<strong>Capital</strong> Outlay<br />
<strong>Capital</strong> Equipment 1,449,146 1,356,250 1,426,000 5.14%<br />
Total <strong>Capital</strong> Outlay 1,449,146 1,356,250 1,426,000 5.14%<br />
Total Expenditures $ 2,731,637 $ 2,610,290 $ 2,635,603 0.97%<br />
172
FLEET MANAGEMENT<br />
Variance Justification<br />
<br />
Personnel (-$83,342): The categories that are directly controlled at the department level are overtime and<br />
communication allowance.<br />
<br />
Communication Allowance (-$180): Changes in this line item are based on updated costs for cell<br />
phones and whether the employee chooses a City-issued device or a stipend.<br />
Purchased Services (-$39,220):<br />
<br />
<br />
<br />
Repair/Maintenance Services: (-$40,762): The variance is due to a $43,000 decrease in outsourced<br />
repair services of vehicles associated with phase two of a three phase project to repaint vehicles. A<br />
decrease of $2,600 in car wash services based on previous actual expenditures, and an increase of<br />
$10,000 in outsourced repairs to Village equipment. The variance is also attributable to the elimination<br />
of $6,126 for one-time Police gun rack modifications.<br />
Telecommunications Services (+$192): Changes in this line item are based on updated costs for cell<br />
phones and whether the employee chooses a City-issued device or a stipend.<br />
Rentals/Leases (+$1,000): The increase is due to the increased cost of van rentals for the Police<br />
Department youth academy.<br />
Supplies/Non-<strong>Capital</strong> Equipment (+$78,125):<br />
<br />
<br />
<br />
<strong>Operating</strong> Supplies (+$6,000): The increase is due to $5,000 in general increases in costs for support<br />
parts that are no longer under warranty, and moving $1,000 from uniforms/safety equipment to operating<br />
supplies for fender covers and shop towels.<br />
Non-<strong>Capital</strong> Equipment (+$91,225): The variance is due to a one-time cost for Public Works<br />
department 27 vehicle replacement radios at $94,500. The one time purchase of a battery tester costing<br />
$3,500. And the reduction of a one-time 2017 purchase of tool carts costing $8,275.<br />
Uniforms/Safety Equipment (-$1,600): The variance is due to a decrease in the cost of employee<br />
uniforms and moving $1,000 to operating supplies for fender covers and shop towels.<br />
Fuel/Propane (-$17,500): In 2017, fuel was budgeted at $2.25 per gallon for 110,000 gallons. In <strong>2018</strong>,<br />
the program reduced the number to $2.00 per gallon for 110,000 gallons to reflect the fuel costs based<br />
on historical expenditures.<br />
<strong>Capital</strong> Outlay (+$69,750):<br />
<br />
<strong>Capital</strong> Equipment (+$69,750): The variance is associated with replacement of Village vehicles and<br />
equipment. This varies year to year based on replacement criteria. For <strong>2018</strong> and in addition to the vehicle<br />
replacements, $45,000 was added for a new Diesel Exhaust Fluid Dispenser at the fuel island.<br />
173
174
SEWER GENERAL IMPROVEMENT DISTRICT #1 FUND FINANCIAL SUMMARY<br />
2016<br />
Audited<br />
Actuals<br />
2017<br />
Amended<br />
<strong>Budget</strong><br />
<strong>2018</strong><br />
<strong>Adopted</strong><br />
<strong>Budget</strong><br />
% Change<br />
Revenue:<br />
Taxes & Assessments $ 99,662 $ - $ - 0.00%<br />
Investment Earnings 4,647 - - 0.00%<br />
Total Revenue 104,309 - - 0.00%<br />
Expenditures:<br />
Purchased Services 2,346 1,270,414 - -100.00%<br />
Supplies/Non-<strong>Capital</strong> Equipment 13,944 - - 0.00%<br />
Total Expenditures 16,290 1,270,414 - -100.00%<br />
Excess/(Deficiency) of Revenues<br />
Over Expenditures 88,019 (1,270,414) - -100.00%<br />
Net Change In Fund Balance: 88,019 (1,270,414) - -100.00%<br />
Cumulative Fund Balance<br />
Beginning Fund Balance 1,182,395 1,270,414 - -100.00%<br />
Ending Fund Balance 1,270,414 - - 0.00%<br />
Less Restrictions, Commitments, & Assignments:<br />
SGID #1 Restriction 1,270,414 - - 0.00%<br />
Unassigned Fund Balance $ - $ - $ - 0.00%<br />
Note: In February 2017, the City dissolved the Sewer General <strong>Improvement</strong> District and transferred all assets and<br />
operations to the Southgate Sanitation District.<br />
175
176
CAPITAL PROJECTS FUND FINANCIAL SUMMARY<br />
2016<br />
Audited<br />
Actuals<br />
2017<br />
Amended<br />
<strong>Budget</strong><br />
<strong>2018</strong><br />
<strong>Adopted</strong><br />
<strong>Budget</strong><br />
% Change<br />
Revenue:<br />
Taxes & Assessments $ 5,183,460 $ 5,038,000 $ 4,511,521 -10.45%<br />
Intergovernmental 3,903,987 1,969,473 2,320,000 17.80%<br />
Investment Earnings 71,160 120,000 250,000 108.33%<br />
Total Revenue 9,158,607 7,127,473 7,081,521 -0.64%<br />
Expenditures:<br />
Purchased Services 786 1,000 800 -20.00%<br />
<strong>Capital</strong> Outlay 8,961,766 21,660,769 17,190,000 -20.64%<br />
Miscellaneous Expenditures 1,018,097 - 147,630 100.00%<br />
Total Expenditures 9,980,649 21,661,769 17,338,430 -19.96%<br />
Excess/(Deficiency) of Revenues<br />
Over Expenditures (822,042) (14,534,296) (10,256,909) -29.43%<br />
Other Financing Sources/(Uses):<br />
Transfers In/(Out) 5,065,277 5,382,645 4,742,119 -11.90%<br />
Insurance Recovery 332,793 162,646 - -100.00%<br />
Total Other Financing Sources/(Uses) 5,398,070 5,545,291 4,742,119 -14.48%<br />
Net Change In Fund Balance: 4,576,028 (8,989,005) (5,514,790) -38.65%<br />
Cumulative Fund Balance<br />
Beginning Fund Balance 16,874,019 21,450,047 12,461,042 -41.91%<br />
Ending Fund Balance 21,450,047 12,461,042 6,946,252 -44.26%<br />
Less Restrictions, Commitments, & Assignments:<br />
Open Space Tax Restriction 1,637,387 202,534 602,534 197.50%<br />
Lottery Proceeds Restriction 272,451 108,563 253,563 133.56%<br />
<strong>Capital</strong> Project Commitment 11,576,245 1,607,181 3,420,021 112.80%<br />
Open Space Acquisition Assignment 391,334 491,334 591,334 20.35%<br />
Maintenance Facility Phase II Assignment 5,825,000 7,825,000 - -100.00%<br />
Development Rebate Assignment 1,747,630 2,226,430 2,078,800 -6.63%<br />
Unassigned Fund Balance $ - $ - $ - 0.00%<br />
177
CAPITAL PROJECTS FUND FINANCIAL SUMMARY<br />
Revenues, Expenditures & Fund Balance<br />
$25,000,000<br />
$20,000,000<br />
$15,000,000<br />
$10,000,000<br />
$5,000,000<br />
$-<br />
2016<br />
Audited<br />
Actuals<br />
2017<br />
Amended<br />
<strong>Budget</strong><br />
<strong>2018</strong><br />
<strong>Adopted</strong><br />
<strong>Budget</strong><br />
Total Revenue Total Expenditures Ending Fund Balance<br />
Total Revenue by Category<br />
Intergovernmental<br />
33%<br />
Taxes &<br />
Assessments<br />
64%<br />
Investment Earnings<br />
3%<br />
Total Expenditures by Category<br />
<strong>Capital</strong> Outlay<br />
99%<br />
Miscellaneous<br />
Expenditures<br />
1%<br />
Purchased Services<br />
0%<br />
178
CAPITAL PROJECTS FUND REVENUE DETAIL<br />
2016<br />
Audited<br />
Actuals<br />
2017<br />
Amended<br />
<strong>Budget</strong><br />
<strong>2018</strong><br />
<strong>Adopted</strong><br />
<strong>Budget</strong><br />
% Change<br />
Taxes & Assessments<br />
Building Materials Use Tax $ 3,124,856 $ 2,949,000 $ 2,418,000 -18.01%<br />
Occupational Privilege Tax 1,949,501 1,990,000 2,000,000 0.50%<br />
Special Assessments 78,633 74,000 68,521 -7.40%<br />
Audit & Compliance 30,470 25,000 25,000 0.00%<br />
Total Taxes & Assessments 5,183,460 5,038,000 4,511,521 -10.45%<br />
Intergovernmental<br />
Open Space Tax 371,862 381,000 400,000 4.99%<br />
Lottery Proceeds 158,549 174,000 145,000 -16.67%<br />
Road & Bridge Tax 321,232 331,000 330,000 -0.30%<br />
Motor Vehicle Registration 59,780 61,000 60,000 -1.64%<br />
Highway Users Tax 545,202 566,000 550,000 -2.83%<br />
Intergovernmental Agreements 158,997 147,831 475,000 221.31%<br />
Grant Proceeds 2,288,365 308,642 360,000 16.64%<br />
Total Intergovernmental 3,903,987 1,969,473 2,320,000 17.80%<br />
Investment Earnings<br />
Investment Earnings 71,160 120,000 250,000 108.33%<br />
Total Investment Earnings 71,160 120,000 250,000 108.33%<br />
Total Revenues $ 9,158,607 $ 7,127,473 $ 7,081,521 -0.64%<br />
179
CAPITAL PROJECTS FUND EXPENDITURE DETAIL<br />
2016<br />
Audited<br />
Actuals<br />
2017<br />
Amended<br />
<strong>Budget</strong><br />
<strong>2018</strong><br />
<strong>Adopted</strong><br />
<strong>Budget</strong><br />
% Change<br />
Purchased Services<br />
Contracted Services $ 786 $ 1,000 $ 800 -20.00%<br />
Total Purchased Services 786 1,000 800 -20.00%<br />
<strong>Capital</strong> Outlay<br />
<strong>Capital</strong> <strong>Improvement</strong> Projects 8,961,766 21,660,769 17,190,000 -20.64%<br />
Total <strong>Capital</strong> Outlay 8,961,766 21,660,769 17,190,000 -20.64%<br />
Miscellaneous Expenditures<br />
Development Rebates 1,018,097 - 147,630 100.00%<br />
Total Miscellaneous Expenditures 1,018,097 - 147,630 100.00%<br />
Total Expenditures $ 9,980,649 $ 21,661,769 $ 17,338,430 -19.96%<br />
180
CAPITAL IMPROVEMENT PROGRAM<br />
Introduction<br />
The City of Greenwood Village’s <strong>Capital</strong> <strong>Improvement</strong> Program (CIP) identifies and provides a summary of all planned<br />
capital projects and corresponding funding sources for the ensuing five-year period. The <strong>2018</strong> budget includes $17.2<br />
million in capital improvement projects. In order to be included in the CIP, a project must meet the following<br />
requirements:<br />
Total costs of the project are expected to meet or exceed $5,000.<br />
The resulting project will have a useful life of more than one year.<br />
The project will result in the creation of a new asset or significantly extend the useful life, value, and/or operational<br />
capacity of an existing asset.<br />
<strong>Capital</strong> improvement projects are funded through a variety of<br />
sources including the use of restricted, committed, and assigned<br />
revenues, debt financing, grant awards, intergovernmental<br />
agreement proceeds and surplus operating revenues. All available<br />
current and estimated future resources were considered when<br />
identifying planned capital improvements. The forecasted costs of<br />
each capital project meet, but do not exceed, the limitations of the<br />
identified funding sources.<br />
The following pages provide a summary of the capital improvement<br />
plan, a listing of capital projects, and lastly individual project<br />
worksheets. The project worksheets describe the project and<br />
identify all costs associated with the project including any<br />
anticipated ongoing operating costs.<br />
Operational & Maintenance Impacts<br />
Costs related to a capital project that might have an impact on current and/or future operating budgets include additional<br />
staff, maintenance, or contractor operations. The City assesses the expected operational impact of each capital<br />
improvement project. Such assessments are established via the following key and are included in the individual project<br />
details provided in this document.<br />
Positive – The project will either generate some revenue to offset expenses or actually reduce continued operating<br />
costs.<br />
Negligible – The impact on operating expenditures is considered immaterial. It will generate less than $5,000 annually<br />
in increased operating expenditures. Ongoing operations and maintenance can be managed with existing resources.<br />
Slight – The impact on operating expenditures will fall between $5,001 and $20,000 annually. Additional overtime,<br />
seasonal staff, purchased services, and/or equipment upgrades may be required to operate and maintain the capital<br />
assets once completed.<br />
Moderate – The impact on operating expenditures will fall between $20,001 and $50,000 annually. An additional staff<br />
member and/or a piece of equipment may be required to operate and maintain the resulting capital asset.<br />
High – The impact on operating expenditures will exceed $50,000 annually. Additional staff, large equipment, and/or<br />
purchased services may be required to operate and maintain the resulting capital asset.<br />
181
FIVE-YEAR CAPITAL PROJECT SUMMARY<br />
2017<br />
Amended<br />
<strong>Budget</strong><br />
<strong>2018</strong><br />
<strong>Adopted</strong><br />
<strong>Budget</strong><br />
2019<br />
Forecast<br />
2020<br />
Forecast<br />
2021<br />
Forecast<br />
2022<br />
Forecast<br />
Building Projects:<br />
Maintenance Facility Redesign/Construction Phase 1 46,233 - - - - -<br />
Curtis Arts & Humanities Center Restroom Addition 506,180 - - - - -<br />
Police Department Front Counter Renovations 200,000 - - - - -<br />
Maintenance Facility Redesign/Construction Phase 2 650,000 7,825,000 - - - -<br />
Total Building Projects 1,402,413 7,825,000 - - - -<br />
Streets and Transportation Projects:<br />
Arapahoe Road/I-25 Interchange 2,533,334 - - - - -<br />
Yosemite Box Culvert Headwall Repair 124,375 - - - - -<br />
Belleview/Steele Traffic Signal 200,000 - - - - -<br />
Orchard/Quebec Traffic Signal Repair 162,646 - - - - -<br />
Belleview/Holly NB Right Turn Lane 188,121 275,000 - - - -<br />
Belleview/Dayton Streetlights 75,000 - - - - -<br />
Belleview Corridor <strong>Improvement</strong>s EA 250,000 - - - - -<br />
Yosemite/Fair Traffic Signal 50,000 450,000 - - - -<br />
Arapahoe Road Median <strong>Improvement</strong>s at I-25 - 600,000 - - - -<br />
Ulster Circle East Sidewalk - 100,000 - - - -<br />
Orchard @ I-25 Left Turn Lane Extension - 675,000 - - - -<br />
Yosemite/Caley West Bound Right Extension - 75,000 350,000 - - -<br />
Yosemite Street Sidewalk Between Willow & Yosemite - 85,000 - - - -<br />
Arapahoe Station and Peakview Avenue <strong>Improvement</strong>s - 100,000 1,800,000 - - -<br />
Village Center Back of Curb <strong>Improvement</strong>s - - - - 1,000,000 -<br />
Pavement/Concrete Rehabilitation Program 9,488,832 4,480,000 4,704,000 4,939,000 5,186,000 5,445,000<br />
Trail Rehabilitation Program 250,000 325,000 200,000 200,000 200,000 200,000<br />
Concrete Replacement Program 100,000 100,000 100,000 100,000 100,000 100,000<br />
Total Streets and Transportation Projects 13,422,308 7,265,000 7,154,000 5,239,000 6,486,000 5,745,000<br />
Drainage Projects:<br />
Bridgewater Ponds <strong>Improvement</strong> 653,822 - - - - -<br />
Drainage System <strong>Improvement</strong>s 98,128 - - - - -<br />
Belleview/Clarkson Drainage <strong>Improvement</strong>s 87,665 - - - - -<br />
Goldsmith Gulch - Orchard at Silo Park 25,000 - - 1,200,000 - -<br />
Parkside Pond Inlet Replacement 255,057 - - - - -<br />
Greenwood Gulch Drainage <strong>Improvement</strong>s - 1,300,000 - - - -<br />
Total Drainage Projects 1,119,672 1,300,000 - 1,200,000 - -<br />
182
FIVE-YEAR CAPITAL PROJECT SUMMARY<br />
2017<br />
Amended<br />
<strong>Budget</strong><br />
<strong>2018</strong><br />
<strong>Adopted</strong><br />
<strong>Budget</strong><br />
2019<br />
Forecast<br />
2020<br />
Forecast<br />
2021<br />
Forecast<br />
2022<br />
Forecast<br />
Recreation Projects:<br />
Westlands Park Water Supply 33,832 - - - - -<br />
Goldsmith Gulch Trail Extension 184,581 - - - - -<br />
Marjorie Perry Nature Preserve Outlet Box 16,000 - - - - -<br />
Dayton Well <strong>Improvement</strong>s 581,742 - - - - -<br />
High Line Trail Crossing 31,542 - - - - -<br />
Village Greens North Phase IV 1,204,825 - - - - -<br />
Goldsmith Gulch Restoration 2,597,249 - - - - -<br />
Senior Equipment - Curtis Center 85,000 - - - - -<br />
Musical Instruments - Westlands Park 50,000 - - - - -<br />
Running Fox Pond Restoration 50,000 - - - - -<br />
Orchard Hills Park Irrigation Upgrade 58,784 - - - - -<br />
Monaco Trail Extension 35,000 - - - - -<br />
Greenwood Gulch Trail Crossing 250,000 - - - - -<br />
Goldsmith Gulch - Huntington 100,000 - 750,000 - - -<br />
Tommy Davis Phase II 100,000 - 990,000 - - -<br />
Silo Park Playgound Update 250,000 - - - - -<br />
High Line Canal Trailhead - Belleview 50,000 - - - - -<br />
High Line Canal Orchard Trailhead Restrooms 17,821 210,000 - - - -<br />
High Line Canal Stormwater Demonstration - 150,000 - - - -<br />
Castlewood Park Restrooms - 210,000 - - - -<br />
Skate Park Addition - 130,000 - - - -<br />
Belleview Avenue Median <strong>Improvement</strong>s - 100,000 2,500,000 - - -<br />
Huntington Caley Master Plan Final Implementation - - 150,000 2,500,000 - -<br />
Village Greens North Park Phase V - - - 150,000 1,000,000 -<br />
Total Recreation Projects 5,696,376 800,000 4,390,000 2,650,000 1,000,000 -<br />
Miscellaneous Projects:<br />
Dayton Street/Dayton Court Entrance Lights 20,000 - - - - -<br />
Total Miscellaneous Projects 20,000 - - - - -<br />
$ 21,660,769 $ 17,190,000 $ 11,544,000 $ 9,089,000 $ 7,486,000 $ 5,745,000<br />
183
184<br />
PROJECT DETAILS
185<br />
PROJECT DETAILS
186<br />
PROJECT DETAILS
187<br />
PROJECT DETAILS
188<br />
PROJECT DETAILS
189<br />
PROJECT DETAILS
190<br />
PROJECT DETAILS
191<br />
PROJECT DETAILS
192<br />
PROJECT DETAILS
193<br />
PROJECT DETAILS
194<br />
PROJECT DETAILS
195<br />
PROJECT DETAILS
196<br />
PROJECT DETAILS
197<br />
PROJECT DETAILS
198<br />
PROJECT DETAILS
199<br />
PROJECT DETAILS
200<br />
PROJECT DETAILS
201<br />
PROJECT DETAILS
202<br />
PROJECT DETAILS
203<br />
PROJECT DETAILS
204<br />
PROJECT DETAILS
205<br />
PROJECT DETAILS
206<br />
PROJECT DETAILS
PROJECT DETAILS<br />
Project Name:<br />
Category:<br />
District:<br />
O & M Impact:<br />
Drainage System <strong>Improvement</strong>s<br />
Drainage<br />
City-Wide<br />
Negligible<br />
<strong>2018</strong>-2022 <strong>Capital</strong> <strong>Improvement</strong> Program<br />
Project Description<br />
Remaining funds are for the sinkhole repair at Syracuse south of Greenwood Plaza Boulevard (project substantially complete), additional consulting services through<br />
the Urban Drainage and Flood Control District (UDFCD) on the Greenwood Gulch - Holly to Pedestrian Crossing (in progress), and outfall cleaning along Greenwood<br />
Gulch (in progress).<br />
Various<br />
Project Location<br />
Financial Summary<br />
Prior<br />
Funding<br />
<strong>2018</strong><br />
<strong>Budget</strong><br />
2019<br />
Forecast<br />
2020<br />
Forecast<br />
2021<br />
Forecast<br />
2022<br />
Forecast Total<br />
Expenditures:<br />
Construction $ 665,434 $ - $ - $ - $ - $ - $ 665,434<br />
Total $ 665,434 $ - $ - $ - $ - $ - $ 665,434<br />
Funding Sources:<br />
City Resources $ 665,434 $ - $ - $ - $ - $ - $ 665,434<br />
Total $ 665,434 $ - $ - $ - $ - $ - $ 665,434<br />
207
208<br />
PROJECT DETAILS
209<br />
PROJECT DETAILS
210<br />
PROJECT DETAILS
211<br />
PROJECT DETAILS
212<br />
PROJECT DETAILS
213<br />
PROJECT DETAILS
214<br />
PROJECT DETAILS
215<br />
PROJECT DETAILS
216<br />
PROJECT DETAILS
217<br />
PROJECT DETAILS
218<br />
PROJECT DETAILS
219<br />
PROJECT DETAILS
220<br />
PROJECT DETAILS
221<br />
PROJECT DETAILS
222<br />
PROJECT DETAILS
223<br />
PROJECT DETAILS
224<br />
PROJECT DETAILS
225<br />
PROJECT DETAILS
226<br />
PROJECT DETAILS
227<br />
PROJECT DETAILS
228<br />
PROJECT DETAILS
229<br />
PROJECT DETAILS
230<br />
PROJECT DETAILS
231<br />
PROJECT DETAILS
232<br />
PROJECT DETAILS
233<br />
PROJECT DETAILS
234<br />
PROJECT DETAILS
235<br />
PROJECT DETAILS
236<br />
PROJECT DETAILS
LONG-RANGE FINANCIAL PLANNING<br />
Overview<br />
Although the City legally appropriates its budget on an annual basis, the process includes discussions regarding multiyear<br />
financial planning based on the City’s Comprehensive Plan, Transportation Plan, Master Regional Drainage Plan,<br />
individual Park Development Master Plans, and <strong>Capital</strong> <strong>Improvement</strong> Plan. Such plans assess the City of Greenwood<br />
Village’s short and long-term infrastructure needs and strategic priorities. Where appropriate, the recommendations and<br />
initiatives provided in these plans have been incorporated into the planning and development of the annual budget and<br />
long-range financial forecasts.<br />
The purpose of the long-range financial outlook is two-fold. First, it provides a forward-looking view of the operating and<br />
capital improvement budgets, allowing City officials and others to evaluate the long-term sustainability of the<br />
organization. In addition, it provides a starting point for future decision-making regarding the budget by identifying the<br />
balance between potential spending needs and the projected revenue outlook, making it a key tool for financial planning.<br />
The tables attached to this document are updated each year as the revenue and spending outlook becomes clearer.<br />
The City uses this information as part of a package of tools that:<br />
<br />
<br />
<br />
<br />
<br />
Identify preliminary spending priorities for future years;<br />
Incorporate necessary budget adjustments into the long-range financial projections;<br />
Ensure that both additions and reductions to the budget are sustainable;<br />
Maintain options to deal with unexpected contingencies; and<br />
Continue advance planning to anticipate factors affecting revenues and service needs.<br />
Assumptions<br />
The five-year projections provided in these financial outlook scenarios reflect numerous assumptions related to<br />
revenues and expenditures in <strong>2018</strong> and beyond. These assumptions represent a reasonable starting point for estimating<br />
the long-term financial status of the City. However, it is important to note that the assumptions and resulting projections<br />
will change over time. Even relatively minor changes in key variables can cause a significant change in the long-term<br />
outlook. For ex<strong>amp</strong>le, a 1% change in revenue for any given year could change the projections for that year and all<br />
future years by approximately $500,000. All estimates included in this document are based on data available at the<br />
time of development. Experience shows that significant changes in the estimates are likely as revenue and expenditure<br />
assumptions change over time.<br />
237
GENERAL FUND LONG-RANGE FINANCIAL PLAN<br />
2017<br />
Amended<br />
<strong>Budget</strong><br />
<strong>2018</strong><br />
<strong>Adopted</strong><br />
<strong>Budget</strong><br />
2019<br />
Forecast<br />
2020<br />
Forecast<br />
2021<br />
Forecast<br />
2022<br />
Forecast<br />
Revenue:<br />
Taxes & Assessments $ 34,641,000 $ 35,110,000 $ 35,975,300 $ 36,862,778 $ 37,773,004 $ 38,706,564<br />
Intergovernmental 821,886 735,028 735,741 736,458 737,178 737,901<br />
Licenses & Permits 1,755,000 1,701,000 1,709,505 1,718,052 1,726,643 1,735,276<br />
Charges & Fees 3,039,000 2,898,955 2,918,870 2,938,970 2,959,256 2,979,730<br />
Fines & Forfeitures 1,087,000 1,020,000 1,022,850 1,025,714 1,028,593 1,031,486<br />
Investment Earnings 171,000 250,000 262,500 275,625 289,406 303,876<br />
Miscellaneous Revenue 8,000 16,500 16,500 16,500 16,500 16,500<br />
Total Revenue 41,522,886 41,731,483 42,641,266 43,574,097 44,530,580 45,511,333<br />
Expenditures:<br />
Personnel 23,760,018 24,057,465 25,422,596 26,001,377 26,595,746 27,206,214<br />
Purchased Services 7,230,108 6,842,533 6,893,853 6,945,558 6,997,650 7,050,132<br />
Supplies/Non-<strong>Capital</strong> Equipment 3,246,037 3,129,034 3,152,503 3,176,147 3,199,969 3,223,969<br />
<strong>Capital</strong> Outlay 2,050,279 2,423,597 2,484,187 2,546,292 2,609,949 2,675,198<br />
Debt Service 31,522 13,135 13,135 13,135 13,135 13,135<br />
Miscellaneous Expenditures 580,256 598,600 865,727 588,830 593,165 597,533<br />
Total Expenditures 36,898,220 37,064,364 38,832,001 39,271,339 40,009,614 40,766,181<br />
Excess/(Deficiency) of Revenues<br />
Over Expenditures 4,624,666 4,667,119 3,809,265 4,302,758 4,520,966 4,745,152<br />
Other Financing Sources/(Uses):<br />
Transfers In/(Out) (5,382,645) (4,742,119) (3,885,390) (4,380,025) (4,599,392) (4,824,754)<br />
Sale of <strong>Capital</strong> Assets 50,000 75,000 76,125 77,267 78,426 79,602<br />
Total Other Financing Sources/(Uses) (5,332,645) (4,667,119) (3,809,265) (4,302,758) (4,520,966) (4,745,152)<br />
Net Change In Fund Balance: (707,979) - - - - -<br />
Cumulative Fund Balance<br />
Beginning Fund Balance 25,674,077 24,966,098 24,966,098 24,966,098 24,966,098 24,966,098<br />
Ending Fund Balance 24,966,098 24,966,098 24,966,098 24,966,098 24,966,098 24,966,098<br />
Less Restrictions, Commitments, & Assignments:<br />
3% TABOR Emergency Restriction 1,459,511 1,464,390 1,495,358 1,503,259 1,533,404 1,557,581<br />
Arts/Humanities Council Restriction 81,219 81,219 81,219 81,219 81,219 81,219<br />
25% <strong>Operating</strong> Reserve Assignment 9,224,555 9,266,091 9,708,000 9,817,835 10,002,404 10,191,545<br />
Development Rebate Assignment 299,544 281,200 - - - -<br />
Unassigned Fund Balance $ 13,901,269 $ 13,873,198 $ 13,681,521 $ 13,563,785 $ 13,349,071 $ 13,135,753<br />
238
CAPITAL PROJECTS FUND LONG-RANGE FINANCIAL PLAN<br />
2017<br />
Amended<br />
<strong>Budget</strong><br />
<strong>2018</strong><br />
<strong>Adopted</strong><br />
<strong>Budget</strong><br />
2019<br />
Forecast<br />
2020<br />
Forecast<br />
2021<br />
Forecast<br />
2022<br />
Forecast<br />
Revenue:<br />
Taxes & Assessments $ 5,038,000 $ 4,511,521 $ 4,529,518 $ 4,542,767 $ 4,561,373 $ 4,555,784<br />
Intergovernmental 1,969,473 2,320,000 2,411,975 1,716,128 1,732,114 1,548,390<br />
Investment Earnings 120,000 250,000 262,500 275,625 289,406 303,876<br />
Total Revenue 7,127,473 7,081,521 7,203,993 6,534,520 6,582,893 6,408,050<br />
Expenditures:<br />
Purchased Services 1,000 800 700 600 500 400<br />
<strong>Capital</strong> Outlay 21,660,769 17,190,000 11,544,000 9,089,000 7,486,000 5,745,000<br />
Miscellaneous Expenditures - 147,630 2,078,800 - - -<br />
Total Expenditures 21,661,769 17,338,430 13,623,500 9,089,600 7,486,500 5,745,400<br />
Excess/(Deficiency) of Revenues<br />
Over Expenditures (14,534,296) (10,256,909) (6,419,507) (2,555,080) (903,607) 662,650<br />
Other Financing Sources/(Uses):<br />
Transfers In/(Out) 5,382,645 4,742,119 3,885,390 4,380,025 4,599,392 4,824,754<br />
Insurance Recovery 162,646 - - - - -<br />
Total Other Financing Sources/(Uses) 5,545,291 4,742,119 3,885,390 4,380,025 4,599,392 4,824,754<br />
Net Change In Fund Balance: (8,989,005) (5,514,790) (2,534,117) 1,824,945 3,695,785 5,487,404<br />
Cumulative Fund Balance<br />
Beginning Fund Balance 21,450,047 12,461,042 6,946,252 4,412,135 6,237,080 9,932,865<br />
Ending Fund Balance 12,461,042 6,946,252 4,412,135 6,237,080 9,932,865 15,420,269<br />
Less Restrictions, Commitments, & Assignments:<br />
Open Space Tax Restriction 202,534 602,534 43,304 363,554 41,310 482,835<br />
Lottery Proceeds Restriction 108,563 253,563 3,518 99,972 158 148,080<br />
<strong>Capital</strong> Project Commitment 1,607,181 3,420,021 3,673,979 4,982,220 9,000,063 13,798,020<br />
Open Space Acquisition Assignment 491,334 591,334 691,334 791,334 891,334 991,334<br />
Maintenance Facility Phase II Assignment 7,825,000 - - - - -<br />
Development Rebate Assignment 2,226,430 2,078,800 - - - -<br />
Unassigned Fund Balance $ - $ - $ - $ - $ - $ -<br />
239
PERSONNEL SUMMARY<br />
Full-Time Equivalency<br />
2016<br />
Audited<br />
Actuals<br />
2017<br />
<strong>Adopted</strong><br />
<strong>Budget</strong><br />
<strong>2018</strong><br />
<strong>Adopted</strong><br />
<strong>Budget</strong><br />
Increase/<br />
(Decrease)<br />
2017-<strong>2018</strong><br />
Department/Position<br />
Mayor & City Council<br />
Mayor 1.00 1.00 1.00 -<br />
Council Members 8.00 8.00 8.00 -<br />
Total 9.00 9.00 9.00 -<br />
City Management<br />
City Manager 1.00 1.00 1.00 -<br />
Assistant to the City Manager 1.00 1.00 1.00 -<br />
Communications Officer 1.00 1.00 1.00 -<br />
Executive Assistant 1.00 1.00 1.00 -<br />
Total 4.00 4.00 4.00 -<br />
City Attorney<br />
City Attorney 1.00 1.00 1.00 -<br />
Assistant City Attorney 1.00 1.00 1.00 -<br />
Total 2.00 2.00 2.00 -<br />
Municipal Judge<br />
Municipal Judge 1.00 1.00 1.00 -<br />
Total 1.00 1.00 1.00 -<br />
Administrative Services<br />
Director of Administrative Services 1.00 1.00 1.00 -<br />
Chief Technology Officer 1.00 1.00 1.00 -<br />
City Clerk 1.00 1.00 1.00 -<br />
Court Administrator 1.00 1.00 1.00 -<br />
Human Resources/Risk Manager 1.00 1.00 1.00 -<br />
Data Services Supervisor 1.00 1.00 1.00 -<br />
ERP Systems Analyst 1.00 1.00 1.00 -<br />
Human Resources Analyst 1.00 1.00 1.00 -<br />
Technology Operations Supervisor 1.00 1.00 1.00 -<br />
GIS Coordinator 1.00 1.00 1.00 -<br />
Service Desk Analyst 1.00 1.00 1.00 -<br />
Service Desk Technician 1.00 1.00 1.00 -<br />
Administrative Assistant 3.00 3.00 3.00 -<br />
Court Clerk 2.00 2.00 2.00 -<br />
Deputy City Clerk 1.00 1.00 1.00 -<br />
Licensing Specialist 1.00 1.00 1.00 -<br />
Online Services Analyst 1.00 1.00 1.00 -<br />
Total 20.00 20.00 20.00 -<br />
Finance<br />
Director of Finance 1.00 1.00 1.00 -<br />
Accounting Manager 1.00 1.00 1.00 -<br />
Revenue Manager 1.00 1.00 1.00 -<br />
Senior Accountant 1.00 1.00 1.00 -<br />
Senior Tax Auditor 1.00 1.00 1.00 -<br />
Accountant 1.00 1.00 1.00 -<br />
Tax Auditor 4.00 4.00 4.00 -<br />
Accounting Technician 2.00 2.00 2.00 -<br />
Administrative Assistant 1.00 1.00 1.00 -<br />
Payroll Specialist 1.00 1.00 1.00 -<br />
Tax Technician 2.00 2.00 2.00 -<br />
Total 16.00 16.00 16.00 -<br />
240
PERSONNEL SUMMARY<br />
2016<br />
Audited<br />
Actuals<br />
2017<br />
<strong>Adopted</strong><br />
<strong>Budget</strong><br />
<strong>2018</strong><br />
<strong>Adopted</strong><br />
<strong>Budget</strong><br />
Increase/<br />
(Decrease)<br />
2017-<strong>2018</strong><br />
Department/Position<br />
Community Development<br />
Director of Community Development 1.00 1.00 1.00 -<br />
Chief Building Official 1.00 1.00 1.00 -<br />
Planning Manager 1.00 1.00 1.00 -<br />
Senior Planner 1.00 1.00 1.00 -<br />
Community Development Engineer 1.00 1.00 1.00 -<br />
Planner I/II 2.00 2.00 2.00 -<br />
Electrical Inspector /Plans Examiner 1.00 1.00 1.00 -<br />
Combination Building Inspector 2.00 2.00 2.00 -<br />
Building Services Supervisor 1.00 1.00 1.00 -<br />
Neighborhood Services Officer/Stormwater Insp 1.00 1.00 1.00 -<br />
Planning Technician 1.00 1.00 1.00 -<br />
Plans Examiner 1.00 1.00 1.00 -<br />
Maintenance Facility Technician 1.00 1.00 1.00 -<br />
Facilities Service Worker 5.00 5.00 6.00 1.00<br />
Administrative Assistant 2.50 2.50 2.50 -<br />
Administrative Supervisor 1.00 1.00 1.00 -<br />
Total 23.50 23.50 24.50 1.00<br />
Parks, Trails & Recreation<br />
Director of Parks, Trails & Recreation 1.00 1.00 1.00 -<br />
Cultural Arts Coordinator 1.00 1.00 1.00 -<br />
Parks Manager 1.00 1.00 1.00 -<br />
Recreation Manager 1.00 1.00 1.00 -<br />
Parks Supervisor 5.00 5.00 5.00 -<br />
Parks Project Manager 1.00 1.00 1.00 -<br />
Recreation Coordinator 2.00 2.00 2.00 -<br />
Assistant Cultural Arts Coordinator 1.00 1.00 1.00 -<br />
Parks Inspector 1.00 1.00 1.00 -<br />
Administrative Assistant 1.00 1.00 1.00 -<br />
Inspector/Maintenance Worker 1.00 1.00 1.00 -<br />
Maintenance Mechanic 2.00 2.00 2.00 -<br />
Maintenance Worker I/II 26.00 26.00 26.00 -<br />
Prop Design and Construction Technician 1.00 1.00 1.00 -<br />
Administrative Supervisor 1.00 1.00 1.00 -<br />
Seasonal Positions 6.06 6.06 6.06 -<br />
Total 52.06 52.06 52.06 -<br />
Police<br />
Chief of Police 1.00 1.00 1.00 -<br />
Police Management Analyst 1.00 1.00 1.00 -<br />
9-1-1 Supervisor 2.00 2.00 2.00 -<br />
Code Enforcement Officer 2.00 2.00 2.00 -<br />
Police Operations Support Supervisor 1.00 1.00 1.00 -<br />
Senior Criminalist 1.00 1.00 1.00 -<br />
Criminalist 1.00 1.00 1.00 -<br />
Police Recruitment/Training Coordinator 1.00 1.00 1.00 -<br />
Victim Assistance Coordinator 0.75 0.75 0.75 -<br />
9-1-1 Technician 11.00 11.00 11.00 -<br />
Administrative Assistant 2.00 - - -<br />
Police Operations Support Technician 2.00 4.00 4.00 -<br />
Police Commander 4.00 4.00 3.00 (1.00)<br />
Police Sergeant 9.00 9.00 10.00 1.00<br />
Police Detective 6.00 6.00 6.00 -<br />
Police Corporal - - 6.00 6.00<br />
Police Officer 46.00 46.00 40.00 (6.00)<br />
Municipal Court Marshall 0.40 0.40 0.40 -<br />
Total 91.15 91.15 91.15 -<br />
241
PERSONNEL SUMMARY<br />
2016<br />
Audited<br />
Actuals<br />
2017<br />
<strong>Adopted</strong><br />
<strong>Budget</strong><br />
<strong>2018</strong><br />
<strong>Adopted</strong><br />
<strong>Budget</strong><br />
Increase/<br />
(Decrease)<br />
2017-<strong>2018</strong><br />
Department/Position<br />
Public Works<br />
Director of Public Works 1.00 1.00 1.00 -<br />
Engineering & Operations Administrator - 1.00 1.00 -<br />
Program Manager 4.00 3.00 3.00 -<br />
Program Supervisor 4.00 4.00 4.00 -<br />
Construction Contract Supervisor 1.00 1.00 1.00 -<br />
Project Manager I/II 3.00 3.00 3.00 -<br />
Traffic Systems Coordinator 1.00 1.00 1.00 -<br />
Management Analyst 1.00 1.00 1.00 -<br />
Transportation Planner 1.00 1.00 1.00 -<br />
Engineering Inspector 6.00 6.00 6.00 -<br />
Traffic Signal Technician 1.00 1.00 1.00 -<br />
Right-of-Way Permit Coordinator 1.00 1.00 1.00 -<br />
Administrative Assistant 2.50 2.50 2.50 -<br />
Administrative Supervisor 1.00 1.00 1.00 -<br />
Maintenance Worker I/II 13.00 13.00 13.00 -<br />
Mechanic/Service Technician 4.00 4.00 4.00 -<br />
Parts Coordinator 1.00 1.00 1.00 -<br />
Total 45.50 45.50 45.50 -<br />
Organization-Wide Total 264.21 264.21 265.21 1.00<br />
242
FINANCIAL POLICIES<br />
The City of Greenwood Village financial policies set forth the basic framework for the overall financial management of<br />
the Village. These policies assist in the decision-making process of the City Council and provide guidelines for<br />
evaluating both current activities and proposals for future programs.<br />
General Policies<br />
<br />
<br />
<br />
<br />
<br />
Prepare an annual operating and capital budget, submit it to Council for approval, and publicly issue a budget<br />
document.<br />
Identify costs and funding sources before recommending approval of capital and operating budgets.<br />
Provide for sound financial planning and adequate working capital in all funds.<br />
Take measures to protect against catastrophic losses through a combination of insurance and cash reserves.<br />
View the budget as a dynamic rather than static plan which requires periodic adjustment as circumstances change.<br />
Approval of City Council is required for increases in total fund budgets and uses of contingency appropriations.<br />
<strong>Operating</strong> <strong>Budget</strong> Policies<br />
<br />
<br />
<br />
Pay for all current year operating expenses with current year revenues.<br />
Establish and monitor performance indicators and productivity indicators associated with operating expenses.<br />
Attempt to maintain and improve present service levels for all services.<br />
<strong>Capital</strong> <strong>Budget</strong> Policies<br />
<br />
<br />
Update capital expenditure projections for the budget year plus five years.<br />
Evaluate the relative merit of each capital project according to Council’s goals and priorities.<br />
Revenue Management Policies<br />
<br />
<br />
<br />
<br />
Impose taxes, fees, and rates at appropriate levels to fund their intended purposes.<br />
Estimate annual revenues using an objective, analytical process.<br />
Update revenue projections for the budget year plus four years.<br />
Review new sources of revenue to fund operating and capital costs consistent with Council’s goals and priorities.<br />
Investment Management Policies<br />
<br />
<br />
<br />
<br />
<br />
<br />
Schedule disbursements, collection, and deposit of all funds to insure cash availability.<br />
Deposit funds only in financial institutions which are insured by the Federal Deposit Insurance Corporation or are<br />
approved for full collateralization by the public deposit protection act or other State Statutes and government<br />
backed securities.<br />
Use pooled cash from all legally permitted funds for investment purposes.<br />
Maximize the investment rate of return.<br />
Adhere to lawful investments with safety of the principal as the dominant requirement, followed by sufficient<br />
liquidity to meet operating requirements, and then yield.<br />
Place custody of the Village’s investment securities with a third-party financial institution for the purpose of<br />
safekeeping of securities.<br />
Debt Management Policies<br />
<br />
<br />
<br />
<br />
<br />
Confine long-term borrowing to major capital improvements that cannot be financed from current revenues.<br />
Repay debt within the expected useful life of the project or sooner.<br />
Not use long-term debt for operating expenses.<br />
Issue debt which is relative to payback ability. Borrowing must not overburden future taxpayers.<br />
Review debt at least annually for repayment or refinance opportunities. A repayment strategy shall be a part of<br />
all recommended bond issues.<br />
243
FINANCIAL POLICIES<br />
Procurement Policies<br />
Obtain the highest quality in supplies and contractual services at the least expense to the City.<br />
Discourage uniform bidding and endeavor to obtain as open competition as possible.<br />
Acquire the highest quality product and service for the City.<br />
Utilize vendors which are competent, consistent, reliable, and timely.<br />
Accounting, Auditing & Reporting Policies<br />
The Village’s managerial staff is responsible for establishing and maintaining an internal control structure. This structure<br />
is designed to ensure that Village assets are protected from loss, theft, or misuse.<br />
<br />
<br />
<br />
<br />
<br />
<br />
<br />
Provide regular information concerning cash position and investment performance through its accounting system.<br />
Establish and maintain a high degree of accounting competency. Financial accounting and reporting shall be<br />
done in accordance with methods prescribed by the Governmental Accounting Standards Board and the<br />
Government Finance Officers Association, or their equivalents.<br />
Present quarterly and annual reports to City Council summarizing financial activity for all governmental funds.<br />
Maintain financial systems to monitor expenditures, revenues, and performance of all municipal programs on an<br />
ongoing basis.<br />
Provide full disclosure in annual financial statements and bond representations.<br />
Use an independent public accounting firm to perform an annual audit.<br />
Publicly issue a Comprehensive <strong>Annual</strong> Financial Report.<br />
Fund Accounting<br />
Fund accounting is used throughout the Village, for both budgeting and the recording of financial transactions. Under<br />
this system money is segregated into separate accounts, rather than being held in one central account. Each fund has<br />
been established for a specific purpose, and is somewhat like a separate bank account.<br />
Fund Types<br />
The Village currently uses only two types of governmental funds, the General Fund and a <strong>Capital</strong> Projects Fund.<br />
The General Fund includes the majority of Village services. Parks, Trails and Recreation; Community<br />
Development; Police; Public Works; Administrative Services; Finance; Mayor and Council; City Attorney; City<br />
Management; and Municipal Judge are included. Sales tax, use tax, property tax, user fees, fines, permits,<br />
licenses, intergovernmental revenue, investment income, internal transfers, and various other revenues are the<br />
sources of General Fund revenues.<br />
The <strong>Capital</strong> Project Fund is used to account for the financing of long-term capital improvements for the Village.<br />
Interfund Transfers<br />
The City of Greenwood Village’s transfers are considered operating transfers. This represents the transfer from one<br />
fund to another fund for operational purposes without the expectation of any support services in return. Also, this type<br />
of transfer includes the transfer from one fund to another fund for the purpose of capital outlays.<br />
<strong>Budget</strong><br />
A balanced budget is defined as a budget in which expenditures and provisions of contingencies in the budget do not<br />
exceed the total estimated available resources.<br />
244
FINANCIAL POLICIES<br />
<strong>Budget</strong> Amendments<br />
Expenditures may not exceed the amounts appropriated in any given year. The Village, however, may need to amend<br />
the budget during the course of the year. In order to enact any of the following, the amendment must be publicized and<br />
the resolution/ordinance must be adopted at a public meeting by a majority vote of the City Council.<br />
<br />
<br />
<br />
<br />
Carryover Encumbrances and Projects. If a department has open purchase orders or uncompleted projects at<br />
the end of a fiscal year, those appropriations can be carried over to the next year to cover the actual expenses<br />
when they occur. This carryover must be approved by City Council through a budget amendment.<br />
Prior Year Reserves or Uses of Fund Balance. Uses of prior years’ fund balances may be needed to adjust<br />
appropriations due to unanticipated costs which were not budgeted.<br />
Departmental and Inter-Fund Transfers. If necessary, the Village may transfer appropriated monies between<br />
departments, within a fund, or from one fund to another fund.<br />
Contingencies. For emergencies that could not have been reasonably foreseen at the time of the budget adoption,<br />
such as revenue shortfall or unanticipated expenses, the City Council can authorize a portion of the reserve for<br />
contingencies to be spent in that year.<br />
245
GLOSSARY OF TERMS<br />
Acronyms<br />
CAFR:<br />
CIP:<br />
FTE:<br />
GAAP:<br />
GFOA:<br />
GASB:<br />
TABOR:<br />
Comprehensive <strong>Annual</strong> Financial Report<br />
<strong>Capital</strong> <strong>Improvement</strong> Program<br />
Full-Time Equivalent/Equivalency<br />
Generally Accepted Accounting Principles<br />
Government Finance Officers Association<br />
Governmental Accounting Standards Board<br />
Taxpayer’s Bill of Rights<br />
Definitions<br />
Accrual Basis<br />
Accounting Period<br />
Accounting System<br />
Accounts Payable<br />
Accounts Receivable<br />
Accrual Basis of Accounting<br />
Accumulated Depreciation<br />
Activity<br />
Ad Valorem Taxes<br />
Amortization<br />
Appropriation<br />
Assessed Valuation<br />
Asset<br />
A basis of accounting in which transactions are recognized at the time they<br />
are incurred, as opposed to when cash is received or spent.<br />
A period at the end of which and for which financial statements are prepared.<br />
The total structure of records and procedures which discover, record, classify,<br />
summarize, and report information on the financial position and results of<br />
operations of a government or any of its funds, balanced account groups, or<br />
organizational components.<br />
Amounts owed to persons or organizations for goods and services received<br />
by the City but not yet paid for.<br />
Amounts owed from persons or organizations for goods and services<br />
furnished by the City but not yet paid for.<br />
The method of accounting under which revenues are recorded when they are<br />
earned and become measurable (whether or not cash is received at that time)<br />
and expenditures are recorded when goods and services are received<br />
(whether or not cash disbursements are made at that time).<br />
Accumulated costs associated with the expiration of the estimated service life<br />
of capital assets.<br />
Departmental efforts which contribute to the achievement of a specific set of<br />
program objectives; the smallest unit of the program budget.<br />
Commonly referred to as property taxes, are levied on both real and personal<br />
property according to the property’s valuation and the tax rate.<br />
The reduction of debt by payments of principal and interest sufficient to retire<br />
the debt by maturity.<br />
A legal authorization to incur obligations and to make expenditures for specific<br />
purposes.<br />
The valuation set upon real estate and certain personal property by the County<br />
Assessor as a basis for levying property taxes.<br />
Resources owned or held by a government which have monetary value.<br />
246
GLOSSARY OF TERMS<br />
Audit<br />
Available Fund Balance<br />
Balanced <strong>Budget</strong><br />
<strong>Budget</strong><br />
<strong>Budget</strong>ary Basis<br />
<strong>Budget</strong> Calendar<br />
<strong>Budget</strong>ary Control<br />
<strong>Capital</strong> Assets<br />
<strong>Capital</strong> <strong>Budget</strong><br />
<strong>Capital</strong> <strong>Improvement</strong>s<br />
<strong>Capital</strong> <strong>Improvement</strong>s Program<br />
<strong>Capital</strong> Outlay<br />
<strong>Capital</strong> Project<br />
Certificates of Participation<br />
Contingency<br />
A comprehensive examination of the manner in which the government’s<br />
resources were utilized. A financial audit is a review of the accounting system<br />
and financial information to determine how government funds were spent and<br />
whether expenditures complied with the legislative body’s appropriations. A<br />
performance audit consists of a review of how well the government met its<br />
stated goals.<br />
This refers to the funds remaining from the prior year which are available for<br />
appropriation and expenditure in the current year.<br />
A balanced budget is defined as a budget in which proposed expenditures and<br />
provisions of contingencies in the budget do not exceed the total estimated<br />
revenues including surpluses from prior years.<br />
A plan of financial activity for a specified period of time indicating all planned<br />
revenues and expenses for the budget period.<br />
This refers to the basis of accounting used to estimate financing sources and<br />
uses in the budget. This generally takes one of three forms: GAAP, cash, or<br />
modified accrual.<br />
The schedule of key dates which a government follows in the preparation and<br />
adoption of the budget.<br />
The control or management of a government in accordance with the approved<br />
budget for the purpose of keeping expenditures within the limitations of<br />
available appropriations and resources.<br />
Assets of long-term character that are intended to continue to be held or used,<br />
such as land, buildings, machinery, furniture, and other equipment.<br />
The appropriation of bonds or operating revenue for improvements to facilities<br />
and other infrastructure.<br />
Expenditures related to the acquisition, expansion or rehabilitation of an<br />
element of the government’s physical plant; sometimes referred to as<br />
infrastructure.<br />
A plan for capital outlay to be incurred each year over a fixed number of years<br />
to meet capital needs arising from the government’s long-term needs.<br />
<strong>Capital</strong> assets which have a value of $5,000 or more and have a useful<br />
economic lifetime of more than one year.<br />
Major construction, acquisition, or renovation activities which add value to a<br />
government’s physical assets or significantly increase their useful life. Also<br />
called capital improvements.<br />
Long-term assignments of interest in rights to receive payments pursuant to a<br />
lease purchase agreement between a financing authority and a governmental<br />
entity.<br />
A budgetary reserve set aside for emergencies or unforeseen expenditures<br />
not otherwise budgeted.<br />
247
GLOSSARY OF TERMS<br />
Contractual Services<br />
Debt Service<br />
Department<br />
Development-Related Fees<br />
Disbursement<br />
Employee Benefits<br />
Encumbrance<br />
Expenditure<br />
Expense<br />
Fiscal Policy<br />
Fiscal Year<br />
Full-time Equivalent Position<br />
Fund<br />
Fund Balance<br />
GAAP<br />
Infrastructure<br />
Interfund Transfers<br />
Services rendered to a government by private firms, individuals, or other<br />
governmental agencies. Ex<strong>amp</strong>les include utilities, rent, maintenance<br />
agreements, and professional consulting services.<br />
The cost of paying principal and interest on borrowed money according to a<br />
predetermined payment schedule.<br />
The basic organizational unit of government which is functionally unique in its<br />
delivery of services.<br />
Fees and charges generated by building, development and growth in a<br />
community. Included are building and street permits, development review<br />
fees, and zoning, platting, and subdivision fees.<br />
The expenditures of monies from an account.<br />
Contributions made by a government to meet commitments or obligations for<br />
employee fringe benefits. Included are the government’s share of costs for<br />
Social Security and the various pension, medical, and life insurance plans.<br />
The commitment of appropriated funds to purchase an item or service. To<br />
encumber funds means to set aside or commit.<br />
The payment of cash on the transfer of property or services for the purpose of<br />
acquiring an asset, service or settling a loss.<br />
Charges incurred (whether paid immediately or unpaid) for operations,<br />
maintenance, interest or other charges.<br />
A government’s policies with respect to revenues, spending, and debt<br />
management as these relate to government services, programs and capital<br />
investments. Fiscal policy provides an agreed-upon set of principles for the<br />
planning and programming of government budgets and their funding.<br />
A twelve-month period designated as the operating year for accounting and<br />
budgeting purposes in an organization.<br />
A part-time position converted to the decimal equivalent of a full-time position<br />
based on 2080 hours per year. For ex<strong>amp</strong>le, a part-time administrative<br />
assistant working 20 hours per week would be the equivalent to 0.5 of a fulltime<br />
position.<br />
A fiscal entity with revenues and expenses which are segregated for the<br />
purpose of carrying out a specific purpose or activity.<br />
Net position of a governmental fund (difference between assets, liabilities,<br />
deferred outflows of resources, and deferred inflows of resources).<br />
Generally Accepted Accounting Principles – Uniform minimum standards for<br />
financial accounting and recording, encompassing the conventions, rules, and<br />
procedures that define accepted accounting principles.<br />
The physical assets of a government (e.g., streets, water, sewer, public<br />
buildings, and parks).<br />
The movement of monies between funds of the same governmental entity.<br />
248
GLOSSARY OF TERMS<br />
Intergovernmental Revenue<br />
Levy<br />
Long-term Debt<br />
Mill<br />
Net <strong>Budget</strong><br />
Objective<br />
Obligations<br />
<strong>Operating</strong> Revenue<br />
<strong>Operating</strong> Expenses<br />
Performance <strong>Budget</strong><br />
Performance Indicators<br />
Performance Measure<br />
Personal Services<br />
Program<br />
Program <strong>Budget</strong><br />
Resolution<br />
Resources<br />
Revenue<br />
Funds received from federal, state, and other local government sources in the<br />
form of grants, shared revenues, and payments in lieu of taxes.<br />
To impose taxes for the support of government activities.<br />
Debt with a maturity of more than one year after the date of issuance.<br />
The property tax rate which is based on the valuation of property. A tax rate<br />
of one mill produces one dollar of taxes on each $1,000 of assessed property<br />
valuation.<br />
The legally adopted budget less all interfund transfers and interdepartmental<br />
charges.<br />
Something to be accomplished in specific, well-defined, and measurable<br />
terms and that is achievable within a specific time frame.<br />
Amounts which a government may be legally required to meet out of its<br />
resources. They include not only actual liabilities, but also encumbrances not<br />
yet paid.<br />
Funds that the government receives as income to pay for ongoing operations.<br />
It includes such items as taxes, fees from specific services, interest earnings,<br />
and grant revenues. <strong>Operating</strong> revenues are used to pay for day-to-day<br />
services.<br />
The cost for personnel, materials and equipment required for a department to<br />
function.<br />
A budget wherein expenditures are based primarily upon measurable<br />
performance of activities and work programs.<br />
Specific quantitative and qualitative measures of work performed as an<br />
objective of specific departments or programs.<br />
Data collected to determine how effective or efficient a program is in achieving<br />
its objectives.<br />
Expenditures for salaries, wages, and fringe benefits of a government’s<br />
employees.<br />
A group of related activities performed by one or more organizational units for<br />
the purpose of accomplishing a function for which the government is<br />
responsible.<br />
A budget which allocates money to the functions or activities of a government<br />
rather than to specific items of cost or to specific departments.<br />
A special or temporary order of a legislative body; an order of a legislative<br />
body requiring less legal formality than an ordinance or statute.<br />
Total amounts available for appropriation including estimated revenues, fund<br />
transfers, and beginning balances.<br />
Sources of income, financing the operations of government.<br />
249
GLOSSARY OF TERMS<br />
Service Level<br />
Source of Revenue<br />
Supplemental Appropriation<br />
Supplemental Requests<br />
Taxes<br />
Transfers In/Out<br />
Unencumbered Balance<br />
Unassigned Fund Balance<br />
Services or products which comprise actual or expected output of a given<br />
program. Focus is on results, not measures of workload.<br />
Revenues are classified according to their source or point of origin.<br />
An additional appropriation made by the governing body after the budget year<br />
has started.<br />
Programs and services which departments would like to have added (in priority<br />
order) over their target budget, or if revenue received is greater than<br />
anticipated.<br />
Compulsory charges levied by a government for the purpose of financing<br />
services performed for the common benefit of the people. This term does not<br />
include specific charges made against particular persons or property for<br />
current or permanent benefit, such as special assessments.<br />
Amounts transferred from one fund to another to assist in financing the<br />
services for the recipient fund.<br />
The amount of an appropriation that is neither expended nor encumbered. It<br />
is essentially the amount of money still available for future purposes.<br />
The portion of a fund’s balance that is not restricted for a specific purpose and<br />
is available for general appropriation.<br />
250
251
252
253
254