BB-Sothebys-AW-SF-Report-2017-R8

You also want an ePaper? Increase the reach of your titles
YUMPU automatically turns print PDFs into web optimized ePapers that Google loves.
APPLEGARTH<br />
+ WARRIN<br />
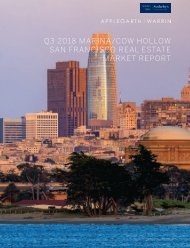
SAN FRANCISCO<br />
M A R K E T R E P O R T 2 0 1 7<br />
M A R I N A / C O W H O L L O W
San Francisco residential real estate had another record-setting year in <strong>2017</strong>.<br />
The median sales price in the city rose 4.6% to $1,250,000. In District 7<br />
(Marina, Cow Hollow, Pacific/Presidio Heights), the median sales price stayed<br />
mostly flat after a big runup in 2016, declining just $5000 to $1,855,000.<br />
That is still $255,000 higher than the city’s second most expensive district<br />
(Noe Valley and surrounds).<br />
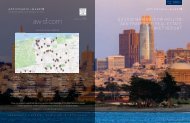
Homes sold much more quickly in <strong>2017</strong> and an increasing number were sold<br />
off-market. 33 homes were sold off-market in <strong>2017</strong> in District 7, representing<br />
15% of all homes sold. The Marina was one of the hottest areas in the city,<br />
with 71% of homes selling for over the asking price. The average sales price<br />
in the Marina is now $2,028,000, while Cow Hollow is at $2,573,000.<br />
The Applegarth+Warrin team was the #1 Sales Team<br />
at Golden Gate Sotheby’s in <strong>2017</strong>, with over $100 Million in sales.<br />
APPLEGARTH + WARRIN<br />
PAUL WARRIN<br />
415.407.8019<br />
paul@aw-sf.com<br />
Max Applegarth<br />
HOME IN THE CITY BEAUTIFUL
<strong>2017</strong> MARINA SIGNIFICANT SALES<br />
Previous Sales Annual<br />
Address Sales Price Sales Date BR/BA Sq Foot DOM Price Year Apprecia1on<br />
Single Family Homes<br />
3551 Scott $6,595,000 8-Nov 4240 0<br />
290 Avila $5,800,000 26-May 5/4.5 4306 0 $3,430,000 2014 24.0%<br />
196 Avila $4,995,000 19-Oct 3/3.5 3231 9 $3,680,100 2014 10.6%<br />
3239 Webster $4,400,000 14-Jul 3/3.5 2720 7 $2,175,000 2005 8.2%<br />
2328 N. Point $3,925,000 31-Oct 2950 0 $2,100,000 2014 26.1%<br />
2161 N. Point $3,800,000 8-Jun 4/4 3106 16 $710,000 1994 19.0%<br />
3724 Divisadero $3,700,000 24-May 3/2 2090 0 $1,495,000 2002 9.8%<br />
3518 Webster $3,610,000 11-May 4/3 2060 16 $2,700,000 2016 30.6%<br />
2034 Beach $3,600,000 15-Jun 4/3 2225 19 $975,000 2000 16.0%<br />
3235 Webster $3,375,000 18-Oct 3/2 2460 34 $1,994,000 2010 9.6%<br />
3157 Baker $3,260,000 10-Feb 5/3.5 3646 105 $2,425,500 2015 17.1%<br />
77 Toledo $3,150,000 16-Jul 3/3 1800 0 $1,867,500 2007 6.5%<br />
235 Mallorca $3,000,000 15-May 3/3 2253 0 $1,350,000 2013 30.2%<br />
3258 Lyon $2,910,000 2-May 3/3 2078 23 $1,500,000 2004 7.1%<br />
2028 Jefferson $2,807,000 27-Jul 3/2.5 2106 50 $275,000 1978 23.3%<br />
3166 Baker $2,800,000 14-Apr 3/3.5 2010 57 $1,500,000 2004 6.7%<br />
51 Avila $2,750,000 25-Jul 3/2.25 2143 14<br />
53 Rico $2,750,000 10-Aug 3/1.5 1880 9<br />
3645 Scott $2,650,000 10-Oct 3/2 1518 0 $875,000 1999 10.9%<br />
3742 Divisadero $2,625,000 12-May 3/2 2300 11<br />
33 Capra $2,605,000 13-Oct 3/2.5 2110 18<br />
3627 Divisadero $2,490,000 3-Nov 2/2 1725 13<br />
3621 Scott $2,450,000 28-Jul 2/2 1496 3 $1,925,000 2007 2.8%<br />
3107 Franklin $2,180,000 17-May 3/2 2145 10 $865,000 1999 8.5%<br />
Condos<br />
1661 Beach $3,400,000 31-Oct 3/4 2810 4<br />
3532 Webster $3,300,000 31-Aug 3/4 2876 49<br />
1962 Jefferson $3,220,000 26-May 3.5/4 2495 0 $1,945,000 2008 7.5%<br />
2330 Francisco $2,875,000 24-Feb 2.5/3 2200 0 $2,500,100 2014 6.0%<br />
1754 Bay $2,850,000 22-Sep 3.5/5 2529 7<br />
1456 Chestnut #3 $2,800,000 12-Dec 2/3 1551 38 $2,300,000 2013 4.6%<br />
1431 Jefferson $2,080,000 30-May 2/2 1801 22 $1,628,000 2012 6.0%<br />
1330 Chestnut $2,025,000 30-Aug 2.5/3 1644 19 $1,565,000 2013 6.7%<br />
TICs<br />
3032 Franklin $2,400,000 16-Feb 2.5/3 1894 0 $2,200,000 2012 1.9%<br />
3236 Divisadero $2,291,000 28-Feb 2.5/3 1900 14<br />
<strong>2017</strong> COW HOLLOW SIGNIFICANT SALES<br />
Previous Sales Annual<br />
Address Sales Price Sales Date BR/BA Sq Foot DOM Price Year Apprecia1on<br />
Single Family Homes<br />
2528 Union $12,000,000 7-Sep 4/5.5 6000 102 $4,200,000 2013 47.6%<br />
2636 Union $9,285,000 30-Oct 5/4.5 5710 53 $700,000 1985 37.7%<br />
2741 Greenwich $7,500,000 28-Apr 5/4.5 5682 58 $3,075,000 2014 48.3%<br />
2652 Chestnut $7,000,000 6-Jun 5/6 4870 123 $7,025,000 2014 -0.1%<br />
2440 Filbert $6,350,000 10-Apr 4/3.5 3305 10 $3,375,000 2009 11.3%<br />
3041 Divisadero $5,740,000 6-Oct 5/3.5 2 $2,700,000 2009 13.3%<br />
2572 Greenwich $4,998,000 30-May 4/4 4221 66 $2,700,000 2003 6.3%<br />
2555 Filbert $4,995,000 15-Dec 4/3.5 3836 65 $3,850,000 2012 5.7%<br />
2750 Lyon $4,990,000 15-May 4/3.5 3100 3 $3,850,000 2012 6.4%<br />
2850 Filbert $4,695,000 24-Oct 4/3.5 2778 0 $4,200,000 2014 3.4%<br />
2830 Filbert $3,875,000 7-Jul 4/3.5 2700 123<br />
2919 Fillmore $3,600,000 30-Jan 6/3.5 2650 113 $1,785,000 2016 1109.2%<br />
1627 Greenwich $3,500,000 20-Sep 3/3.5 10 $2,295,000 2012 9.9%<br />
2961 Broderick $3,450,000 27-Nov 3/2.5 0 $3,275,000 2016 3.8%<br />
2637 Union $3,210,000 27-Apr 3/2 2540 22<br />
2717 Baker $2,450,000 26-Dec 2/2 1540 13 $956,000 1998 7.8%<br />
11 Imperial $2,244,000 17-Jul 3/1.5 1620 10 $1,340,000 2010 9.5%<br />
2621 Lombard $1,500,000 27-Nov 3/1.5 2222 55 $760,000 2010 13.0%<br />
Condos<br />
1662 Union $3,225,000 28-Jul 3/3 53 $2,400,000 2013 8.4%<br />
3038 Steiner $2,750,000 7-Jul 2.5/3 11 $2,015,000 2013 9.0%<br />
2756 Baker $2,650,000 31-Aug 2.5/2 1678 10 $1,100,000 2011 22.5%<br />
2929 Fillmore $2,350,000 1-Dec 2/3 2008 7 $1,465,000 2012 10.9%<br />
1501 Greenwich $2,150,000 13-Apr 2.5/3 1642 10 $1,815,000 2008 2.1%<br />
2829 Laguna $2,125,000 21-Jul 2/3 1465 7 $1,170,000 2004 6.3%<br />
2828 Pierce $2,000,000 21-Dec 2/3 43 $1,725,000 2015 5.7%<br />
2827 Pierce $1,990,000 15-Feb 3/3 1886 15 $1,035,000 2001 5.9%<br />
2368 Union $1,875,000 17-Feb 3/3 1950 0 $1,262,000 2012 10.5%<br />
2743 Gough $1,810,000 11-Jul 2/3 1520 5 $1,310,000 2013 9.0%<br />
2839 Pierce $1,779,000 2-Feb 2/2 1225 8 $432,000 1996 15.3%<br />
2816 Baker $1,750,000 6-Jun 2/2 1460 12 $605,000 1998 9.9%<br />
2856 Scott $1,515,000 31-Jan 1/1 1479 0 $800,000 2000 5.5%<br />
TICs<br />
2719 Franklin $2,685,000 22-Nov 3.5/4 34<br />
2721 Franklin $2,395,000 13-Nov 2.5/3 19<br />
2833 Webster #5 $1,580,000 6-Dec 2/3 1678 75 $690,000 2015 49.2%
<strong>2017</strong><br />
$6,595,000<br />
highest sale<br />
22<br />
<strong>SF</strong>Hs sold<br />
68<br />
Condos/TICs sold<br />
THE MARINA<br />
$1,906,589<br />
avg list price<br />
$2,027,894<br />
avg sale price<br />
1,683<br />
avg sq ft<br />
71%<br />
of homes sold for<br />
over asking price<br />
$1,205<br />
avg price sq ft<br />
26<br />
avg days on mkt
<strong>2017</strong><br />
$12,000,000<br />
highest sale<br />
18<br />
<strong>SF</strong>Hs sold<br />
41<br />
Condos/TICs sold<br />
$2,504,441<br />
avg list price<br />
COW HOLLOW<br />
$2,572,667<br />
avg sale price<br />
1,884<br />
avg sq ft<br />
$1,366<br />
avg price sq ft<br />
30<br />
avg days on mkt<br />
55%<br />
decrease in days on<br />
market from 2016
<strong>2017</strong><br />
$38,000,000<br />
highest sale<br />
57<br />
<strong>SF</strong>Hs sold<br />
PACIFIC HEIGHTS +<br />
PRESIDIO HEIGHTS<br />
204<br />
Condos/TICs sold<br />
$2,924,492<br />
avg list price<br />
$2,956,395<br />
avg sale price<br />
2,114<br />
avg sq ft<br />
6.3%<br />
over ask in October,<br />
the hottest month<br />
$1,398<br />
avg price sq ft<br />
33<br />
avg days on mkt
<strong>2017</strong><br />
$7,500,000<br />
highest sale<br />
12<br />
<strong>SF</strong>Hs sold<br />
93<br />
Condos/TICs sold<br />
$2,182,310<br />
avg list price<br />
RUSSIAN HILL<br />
$2,196,445<br />
avg sale price<br />
1,676<br />
avg sq ft<br />
$1,311<br />
avg price sq ft<br />
39<br />
avg days on mkt<br />
14%<br />
of all sales which<br />
occurred in March
A PPLEGARTH + WARRIN<br />
100 TIBURON BLVD, MILL VALLEY, CA 94941<br />
APPLEGARTH+WARRIN : THE #1 REAL ESTATE SALES TEAM FOR GOLDEN GATE SOTHEBY’S INTERNATIONAL REALTY IN <strong>2017</strong>