

NUTRIENT INTAKE

You also want an ePaper? Increase the reach of your titles
YUMPU automatically turns print PDFs into web optimized ePapers that Google loves.
20 EVA ROOS AND RITVA PRÄTTÄLÄ<br />
TABLE 5<br />
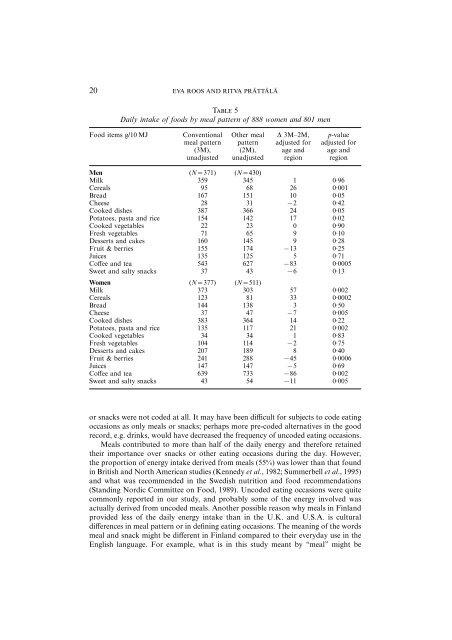
Daily intake of foods by meal pattern of 888 women and 801 men<br />
Food items g/10 MJ Conventional Other meal Δ 3M–2M, p-value<br />
meal pattern pattern adjusted for adjusted for<br />
(3M), (2M), age and age and<br />
unadjusted unadjusted region region<br />
Men (N=371) (N=430)<br />
Milk 359 345 1 0·96<br />
Cereals 95 68 26 0·001<br />
Bread 167 151 10 0·05<br />
Cheese 28 31 −2 0·42<br />
Cooked dishes 387 366 24 0·05<br />
Potatoes, pasta and rice 154 142 17 0·02<br />
Cooked vegetables 22 23 0 0·90<br />
Fresh vegetables 71 65 9 0·10<br />
Desserts and cakes 160 145 9 0·28<br />
Fruit & berries 155 174 −13 0·25<br />
Juices 135 125 5 0·71<br />
Coffee and tea 543 627 −83 0·0005<br />
Sweet and salty snacks 37 43 −6 0·13<br />
Women (N=377) (N=511)<br />
Milk 373 303 57 0·002<br />
Cereals 123 81 33 0·0002<br />
Bread 144 138 3 0·50<br />
Cheese 37 47 −7 0·005<br />
Cooked dishes 383 364 14 0·22<br />
Potatoes, pasta and rice 135 117 21 0·002<br />
Cooked vegetables 34 34 1 0·83<br />
Fresh vegetables 104 114 −2 0·75<br />
Desserts and cakes 207 189 8 0·40<br />
Fruit & berries 241 288 −45 0·0006<br />
Juices 147 147 −5 0·69<br />
Coffee and tea 639 733 −86 0·002<br />
Sweet and salty snacks 43 54 −11 0·005<br />
or snacks were not coded at all. It may have been difficult for subjects to code eating<br />
occasions as only meals or snacks; perhaps more pre-coded alternatives in the good<br />
record, e.g. drinks, would have decreased the frequency of uncoded eating occasions.<br />
Meals contributed to more than half of the daily energy and therefore retained<br />
their importance over snacks or other eating occasions during the day. However,<br />
the proportion of energy intake derived from meals (55%) was lower than that found<br />
in British and North American studies (Kennedy et al., 1982; Summerbell et al., 1995)<br />
and what was recommended in the Swedish nutrition and food recommendations<br />
(Standing Nordic Committee on Food, 1989). Uncoded eating occasions were quite<br />
commonly reported in our study, and probably some of the energy involved was<br />
actually derived from uncoded meals. Another possible reason why meals in Finland<br />
provided less of the daily energy intake than in the U.K. and U.S.A. is cultural<br />
differences in meal pattern or in defining eating occasions. The meaning of the words<br />
meal and snack might be different in Finland compared to their everyday use in the<br />
English language. For example, what is in this study meant by ‘‘meal’’ might be