

NUTRIENT INTAKE

Create successful ePaper yourself
Turn your PDF publications into a flip-book with our unique Google optimized e-Paper software.
16 EVA ROOS AND RITVA PRÄTTÄLÄ<br />
600<br />
Energy derived from fat kjoule/hour<br />
500<br />
400<br />
300<br />
200<br />
100<br />
0<br />
0 2 4 6 8 10 12 14 16 18 20 22 24<br />
Time<br />
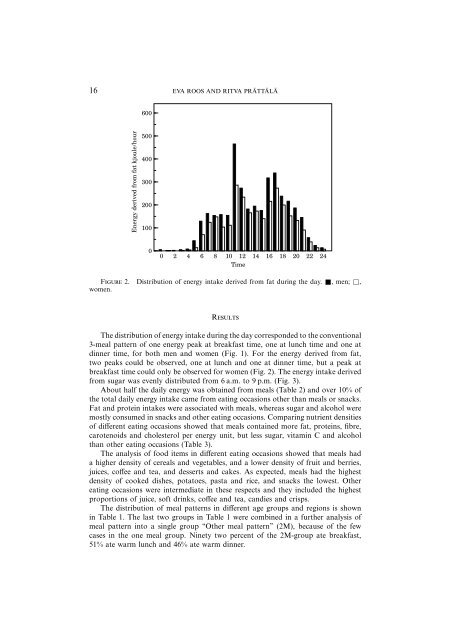
FIGURE 2. Distribution of energy intake derived from fat during the day. Ε, men; Φ,<br />
women.<br />
RESULTS<br />
The distribution of energy intake during the day corresponded to the conventional<br />
3-meal pattern of one energy peak at breakfast time, one at lunch time and one at<br />
dinner time, for both men and women (Fig. 1). For the energy derived from fat,<br />
two peaks could be observed, one at lunch and one at dinner time, but a peak at<br />
breakfast time could only be observed for women (Fig. 2). The energy intake derived<br />
from sugar was evenly distributed from 6 a.m. to 9 p.m. (Fig. 3).<br />
About half the daily energy was obtained from meals (Table 2) and over 10% of<br />
the total daily energy intake came from eating occasions other than meals or snacks.<br />
Fat and protein intakes were associated with meals, whereas sugar and alcohol were<br />
mostly consumed in snacks and other eating occasions. Comparing nutrient densities<br />
of different eating occasions showed that meals contained more fat, proteins, fibre,<br />
carotenoids and cholesterol per energy unit, but less sugar, vitamin C and alcohol<br />
than other eating occasions (Table 3).<br />
The analysis of food items in different eating occasions showed that meals had<br />
a higher density of cereals and vegetables, and a lower density of fruit and berries,<br />
juices, coffee and tea, and desserts and cakes. As expected, meals had the highest<br />
density of cooked dishes, potatoes, pasta and rice, and snacks the lowest. Other<br />
eating occasions were intermediate in these respects and they included the highest<br />
proportions of juice, soft drinks, coffee and tea, candies and crisps.<br />
The distribution of meal patterns in different age groups and regions is shown<br />
in Table 1. The last two groups in Table 1 were combined in a further analysis of<br />
meal pattern into a single group ‘‘Other meal pattern’’ (2M), because of the few<br />
cases in the one meal group. Ninety two percent of the 2M-group ate breakfast,<br />
51% ate warm lunch and 46% ate warm dinner.