

Concentrated Poverty
Concentrated Poverty
Concentrated Poverty

Create successful ePaper yourself
Turn your PDF publications into a flip-book with our unique Google optimized e-Paper software.
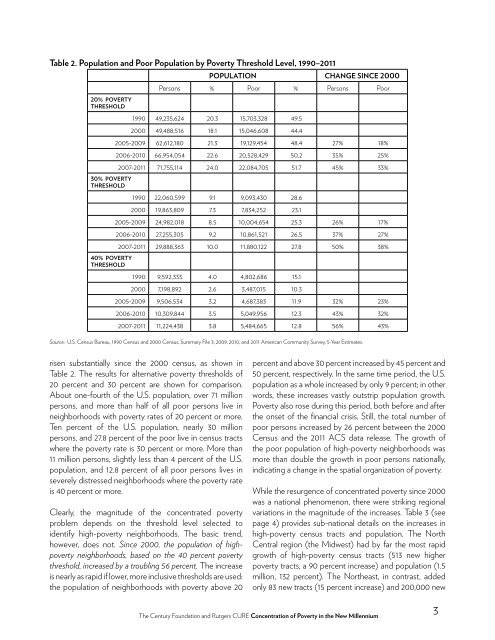
Table 2. Population and Poor Population by <strong>Poverty</strong> Threshold Level, 1990–2011<br />
POPULATION CHANGE SINCE 2000<br />
Persons % Poor % Persons Poor<br />
20% POVERTY<br />
THRESHOLD<br />
30% POVERTY<br />
THRESHOLD<br />
40% POVERTY<br />
THRESHOLD<br />
1990 49,235,624 20.3 15,703,328 49.5<br />
2000 49,488,516 18.1 15,046,608 44.4<br />
2005-2009 62,612,180 21.3 19,129,454 48.4 27% 18%<br />
2006-2010 66,954,054 22.6 20,528,429 50.2 35% 25%<br />
2007-2011 71,755,114 24.0 22,084,705 51.7 45% 33%<br />
1990 22,060,599 9.1 9,093,430 28.6<br />
2000 19,863,809 7.3 7,834,252 23.1<br />
2005-2009 24,982,018 8.5 10,004,654 25.3 26% 17%<br />
2006-2010 27,255,305 9.2 10,861,521 26.5 37% 27%<br />
2007-2011 29,888,363 10.0 11,880,122 27.8 50% 38%<br />
1990 9,592,333 4.0 4,802,686 15.1<br />
2000 7,198,892 2.6 3,487,015 10.3<br />
2005-2009 9,506,534 3.2 4,687,383 11.9 32% 23%<br />
2006-2010 10,309,844 3.5 5,049,956 12.3 43% 32%<br />
2007-2011 11,224,438 3.8 5,484,665 12.8 56% 43%<br />
Source: U.S. Census Bureau, 1990 Census and 2000 Census, Summary File 3; 2009, 2010, and 2011 American Community Survey, 5-Year Estimates.<br />
risen substantially since the 2000 census, as shown in<br />
Table 2. The results for alternative poverty thresholds of<br />
20 percent and 30 percent are shown for comparison.<br />
About one-fourth of the U.S. population, over 71 million<br />
persons, and more than half of all poor persons live in<br />
neighborhoods with poverty rates of 20 percent or more.<br />
Ten percent of the U.S. population, nearly 30 million<br />
persons, and 27.8 percent of the poor live in census tracts<br />
where the poverty rate is 30 percent or more. More than<br />
11 million persons, slightly less than 4 percent of the U.S.<br />
population, and 12.8 percent of all poor persons lives in<br />
severely distressed neighborhoods where the poverty rate<br />
is 40 percent or more.<br />
Clearly, the magnitude of the concentrated poverty<br />
problem depends on the threshold level selected to<br />
identify high-poverty neighborhoods. The basic trend,<br />
however, does not. Since 2000, the population of highpoverty<br />
neighborhoods, based on the 40 percent poverty<br />
threshold, increased by a troubling 56 percent. The increase<br />
is nearly as rapid if lower, more inclusive thresholds are used:<br />
the population of neighborhoods with poverty above 20<br />
percent and above 30 percent increased by 45 percent and<br />
50 percent, respectively. In the same time period, the U.S.<br />
population as a whole increased by only 9 percent; in other<br />
words, these increases vastly outstrip population growth.<br />
<strong>Poverty</strong> also rose during this period, both before and after<br />
the onset of the financial crisis. Still, the total number of<br />
poor persons increased by 26 percent between the 2000<br />
Census and the 2011 ACS data release. The growth of<br />
the poor population of high-poverty neighborhoods was<br />
more than double the growth in poor persons nationally,<br />
indicating a change in the spatial organization of poverty.<br />
While the resurgence of concentrated poverty since 2000<br />
was a national phenomenon, there were striking regional<br />
variations in the magnitude of the increases. Table 3 (see<br />
page 4) provides sub-national details on the increases in<br />
high-poverty census tracts and population. The North<br />
Central region (the Midwest) had by far the most rapid<br />
growth of high-poverty census tracts (513 new higher<br />
poverty tracts, a 90 percent increase) and population (1.5<br />
million, 132 percent). The Northeast, in contrast, added<br />
only 83 new tracts (15 percent increase) and 200,000 new<br />
The Century Foundation and Rutgers CURE Concentration of <strong>Poverty</strong> in the New Millennium<br />
3


