12th Carl Zeiss sponsored workshop on ... - Institut Fresnel
12th Carl Zeiss sponsored workshop on ... - Institut Fresnel
12th Carl Zeiss sponsored workshop on ... - Institut Fresnel

Create successful ePaper yourself
Turn your PDF publications into a flip-book with our unique Google optimized e-Paper software.
NEAR-FIELD FCS: DRIVING BIOLOGY BEYOND THE DIFFRACTION LIMIT<br />
Winckler P, Jaffiol R, Plain J and Royer P<br />
Université de Technologie de Troyes, <strong>Institut</strong> Charles Delaunay FRE CNRS 2848,<br />
Laboratoire de Nanotechnologie et d’Instrumentati<strong>on</strong> Optique, LRC CEA,<br />
12 rue Marie Curie, BP2060, 10010 Troyes cedex, France<br />
c<strong>on</strong>tact: rodolphe.jaffiol@utt.fr<br />
For single molecule detecti<strong>on</strong> in soluti<strong>on</strong>, the issue is to get the probability of finding molecule<br />
in the observati<strong>on</strong> volume significantly inferior to unity. This can be achieved through<br />
diluting the dye of interest or limiting the detecti<strong>on</strong> to a very small volume. Classical fluorescence<br />
correlati<strong>on</strong> spectrosocpy (FCS), based <strong>on</strong> c<strong>on</strong>focal detecti<strong>on</strong>, presents two important<br />
limitati<strong>on</strong>s for in vivo studies. First, its requires to work with a nanomolar c<strong>on</strong>centrati<strong>on</strong> of<br />
molecules, very far from the biologically relevant c<strong>on</strong>centrati<strong>on</strong> (i.e µM, or higher). On the<br />
other hand, the background signal such as autofluorescence, is still often important. In order<br />
to overcome the limitati<strong>on</strong>s of classical FCS, we propose a new approach to reduce the detecti<strong>on</strong><br />
volume based <strong>on</strong> a n<strong>on</strong> radiative energy transfer. We present two applicati<strong>on</strong>s of our<br />
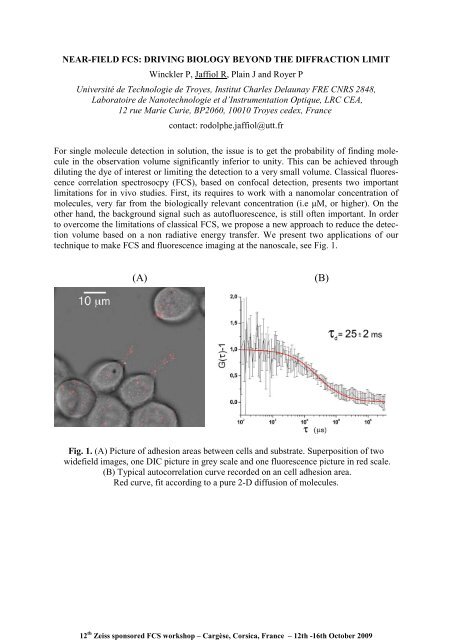
technique to make FCS and fluorescence imaging at the nanoscale, see Fig. 1.<br />
(A)<br />
(B)<br />
Fig. 1. (A) Picture of adhesi<strong>on</strong> areas between cells and substrate. Superpositi<strong>on</strong> of two<br />
widefield images, <strong>on</strong>e DIC picture in grey scale and <strong>on</strong>e fluorescence picture in red scale.<br />
(B) Typical autocorrelati<strong>on</strong> curve recorded <strong>on</strong> an cell adhesi<strong>on</strong> area.<br />
Red curve, fit according to a pure 2-D diffusi<strong>on</strong> of molecules.<br />
12 th <str<strong>on</strong>g>Zeiss</str<strong>on</strong>g> <str<strong>on</strong>g>sp<strong>on</strong>sored</str<strong>on</strong>g> FCS <str<strong>on</strong>g>workshop</str<strong>on</strong>g> – Cargèse, Corsica, France – <str<strong>on</strong>g>12th</str<strong>on</strong>g> -16th October 2009