Markets, Facts, Figures! Market Analysis 2018

Create successful ePaper yourself
Turn your PDF publications into a flip-book with our unique Google optimized e-Paper software.
15 15<br />
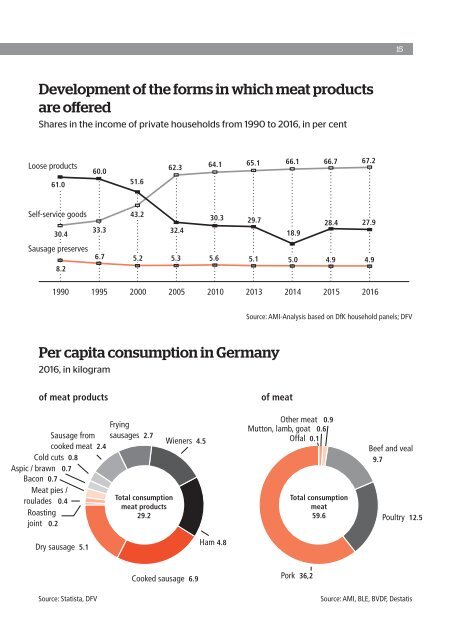
Development of the forms in which meat products<br />
are offered<br />
Shares in the income of private households from 1990 to 2016, in per cent<br />
Loose products<br />
61.0<br />
60.0<br />
51.6<br />
62.3<br />
64.1 65.1 66.1 66.7 67.2<br />
Self-service goods<br />
30.4<br />
Sausage preserves<br />
8.2<br />
33.3<br />
43.2<br />
30.3 29.7<br />
28.4 27.9<br />
32.4<br />
18.9<br />
6.7 5.2 5.3 5.6 5.1 5.0 4.9 4.9<br />
1990 1995 2000 2005 2010 2013 2014 2015 2016<br />
Source: AMI-<strong>Analysis</strong> based on DfK household panels; DFV<br />
Per capita consumption in Germany<br />
2016, in kilogram<br />
of meat products<br />
Sausage from<br />
cooked meat 2.4<br />
Cold cuts 0.8<br />
Aspic / brawn 0.7<br />
Bacon 0.7<br />
Meat pies /<br />
roulades 0.4<br />
Roasting<br />
joint 0.2<br />
Frying<br />
sausages 2.7<br />
Total consumption<br />
meat products<br />
29.2<br />
Wieners 4.5<br />
of meat<br />
Other meat 0.9<br />
Mutton, lamb, goat 0.6<br />
Offal 0.1<br />
Total consumption<br />
meat<br />
59.6<br />
Beef and veal<br />
9.7<br />
Poultry 12.5<br />
Dry sausage 5.1<br />
Ham 4.8<br />
Cooked sausage 6.9<br />
Pork 36,2<br />
Source: Statista, DFV<br />
Source: AMI, BLE, BVDF, Destatis