Identification of specificity and promiscuity of PDZ domain ...
Identification of specificity and promiscuity of PDZ domain ...
Identification of specificity and promiscuity of PDZ domain ...

You also want an ePaper? Increase the reach of your titles
YUMPU automatically turns print PDFs into web optimized ePapers that Google loves.
proteins<br />
STRUCTURE O FUNCTION O BIOINFORMATICS<br />
<strong>Identification</strong> <strong>of</strong> <strong>specificity</strong> <strong>and</strong> <strong>promiscuity</strong> <strong>of</strong><br />
<strong>PDZ</strong> <strong>domain</strong> interactions through their<br />
dynamic behavior<br />
Z. Nevin Gerek, 1,2 Ozlem Keskin, 3 <strong>and</strong> S. Banu Ozkan 1,2 *<br />
ABSTRACT<br />
<strong>PDZ</strong> <strong>domain</strong>s (<strong>PDZ</strong>s), the most common interaction<br />
<strong>domain</strong> proteins, play critical roles in<br />
many cellular processes. <strong>PDZ</strong>s perform their job<br />
by binding specific protein partners. However,<br />
they are very promiscuous, binding to more<br />
than one protein, yet selective at the same time.<br />
We examined the binding related dynamics <strong>of</strong><br />
various <strong>PDZ</strong>s to have insight about their <strong>specificity</strong><br />
<strong>and</strong> <strong>promiscuity</strong>. We used full atomic normal<br />
mode analysis <strong>and</strong> a modified coarsegrained<br />
elastic network model to compute the<br />
binding related dynamics. In the latter model,<br />
we introduced <strong>specificity</strong> for each single parameter<br />
constant <strong>and</strong> included the solvation effect<br />
implicitly. The modified model, referred to as<br />
specific-Gaussian Network Model (s-GNM),<br />
highlights some interesting differences in the<br />
conformational changes <strong>of</strong> <strong>PDZ</strong>s upon binding<br />
to Class I or Class II type peptides. By clustering<br />
the residue fluctuation pr<strong>of</strong>iles <strong>of</strong> <strong>PDZ</strong>s, we<br />
have shown: (i) binding selectivities can be<br />
discriminated from their dynamics, <strong>and</strong> (ii) the<br />
dynamics <strong>of</strong> different structural regions play<br />
critical roles for Class I <strong>and</strong> Class II <strong>specificity</strong>.<br />
s-GNM is further tested on a dual-specific <strong>PDZ</strong><br />
which showed only Class I <strong>specificity</strong> when a<br />
point mutation exists on the bA-bB loop. We<br />
observe that the binding dynamics change consistently<br />
in the mutated <strong>and</strong> wild type structures.<br />
In addition, we found that the binding<br />
induced fluctuation pr<strong>of</strong>iles can be used to discriminate<br />
the binding selectivity <strong>of</strong> homolog<br />
structures. These results indicate that s-GNM<br />
can be a powerful method to study the changes<br />
in binding selectivities for mutant or homolog<br />
<strong>PDZ</strong>s.<br />
Proteins 2009; 77:796–811.<br />
VC 2009 Wiley-Liss, Inc.<br />
Key words: binding; elastic network model;<br />
<strong>PDZ</strong> <strong>domain</strong>; dynamics; selectivity.<br />
1<br />
Center for Biological Physics, Arizona State University, Tempe, Arizona<br />
2<br />
Department <strong>of</strong> Physics, Arizona State University, Tempe, Arizona<br />
3<br />
Department <strong>of</strong> Chemical <strong>and</strong> Biological Engineering, Koc University, Istanbul, Turkey<br />
INTRODUCTION<br />
Protein–protein interactions are the key elements in organizing<br />
functional protein complexes <strong>and</strong> controlling cellular activities.<br />
Among the many protein–protein interaction <strong>domain</strong>s, <strong>PDZ</strong> <strong>domain</strong>s<br />
(<strong>PDZ</strong>s) are one <strong>of</strong> the most commonly found in organisms from<br />
bacteria to humans. 1,2 By binding to the specific peptide sequence<br />
motif <strong>of</strong> the target proteins, <strong>PDZ</strong>s assist in assembling these proteins<br />
into supramolecular complexes. One important characteristic <strong>of</strong><br />
<strong>PDZ</strong>s is that they are very promiscuous, that is, they can bind to<br />
more than one target sequence motif. 2–4 Yet they are also specific,<br />
discriminating which sequence motif to bind. The increase in<br />
number <strong>of</strong> experimental studies related to <strong>PDZ</strong> <strong>domain</strong> mediated<br />
protein–protein interactions 3,5–20 creates a need for theoretical<br />
models that provide quantitative <strong>and</strong> biologically relevant underst<strong>and</strong>ing<br />
to the experimental observations as discussed below. Quantitative<br />
underst<strong>and</strong>ing <strong>of</strong> the principles that underlies <strong>promiscuity</strong><br />
<strong>and</strong> selectivity <strong>of</strong> <strong>PDZ</strong> <strong>domain</strong>s will shed light into the recognition<br />
<strong>and</strong> binding mechanisms.<br />
Structural basis <strong>of</strong> <strong>PDZ</strong> binding <strong>and</strong> <strong>specificity</strong><br />
All <strong>PDZ</strong>s have similar overall secondary <strong>and</strong> tertiary structures<br />
with an average backbone root mean square deviation <strong>of</strong> around 1.4<br />
A ˚ . 21 The common structure <strong>of</strong> <strong>PDZ</strong> <strong>domain</strong> comprises six b-str<strong>and</strong>s<br />
(bA-bF) <strong>and</strong> two a-helices (aA <strong>and</strong> aB), which fold in an overall<br />
six-str<strong>and</strong>ed b s<strong>and</strong>wich [Fig. 1(A)]. They typically recognize specific<br />
amino acids in the C-terminal end <strong>of</strong> peptide motifs or target proteins.<br />
In addition to binding to carboxyl peptides, <strong>PDZ</strong>s can interact<br />
with internal peptide motifs <strong>of</strong> target proteins, with another <strong>PDZ</strong><br />
<strong>domain</strong> 1–3 <strong>and</strong> even with lipids. 22,23 The phenomenon <strong>of</strong> binding<br />
to the C-terminal end <strong>of</strong> peptide motifs is known as the classical or<br />
canonical binding mode. C-terminal peptides bind as an antiparallel<br />
b-str<strong>and</strong> in a groove between the bB str<strong>and</strong> <strong>and</strong> the aB helix, in<br />
essence extending the b-sheet. The conserved sequence Gly-Leu-Gly-<br />
Additional Supporting Information may be found in the online version <strong>of</strong> this article.<br />
*Correspondence to: S. Banu Ozkan, Arizona State University, Department <strong>of</strong> Physics, P.O. Box<br />
871504, Tempe, AZ 85287-1504. E-mail: Banu.Ozkan@asu.edu<br />
Received 8 January 2009; Revised 6 May 2009; Accepted 25 May 2009<br />
Published online 2 June 2009 in Wiley InterScience (www.interscience.wiley.com).<br />
DOI: 10.1002/prot.22492<br />
796 PROTEINS VC 2009 WILEY-LISS, INC.
Leu (or Phe) between bA-bB loop <strong>and</strong> aB helix is<br />
directly involved in peptide recognition <strong>and</strong> binding<br />
[Fig. 1(B)].<br />
<strong>PDZ</strong>s have been generally categorized into three different<br />
classes based on the last four residues at the sequence<br />
<strong>of</strong> the C-terminal peptide. 25 Class I <strong>PDZ</strong>s bind to a Cterminal<br />
motif with the sequence [Ser/Thr-X-F-COOH],<br />
Class II <strong>PDZ</strong>s prefer the sequence [F-X-F-COOH], <strong>and</strong><br />
Class III types interact with the sequence [Asp/Glu-X-F-<br />
COOH], where X is any amino acid <strong>and</strong> F is any hydrophobic<br />
amino acid. All classes have a preference for a<br />
hydrophobic residue at the very C-terminal (p 0) position.<br />
In contrast to serine or threonine residues at p22 position<br />
in Class I, Class II <strong>PDZ</strong>s prefer bulky hydrophobic<br />
residues [Fig. 1(C)]. However, several <strong>PDZ</strong>-mediated<br />
interactions do not conform to these three major canonical<br />
types <strong>of</strong> recognition <strong>and</strong> new classes are introduced<br />
to account for them. 26 Consequently, it has been also<br />
shown that the classification based on the chemical<br />
properties <strong>of</strong> residues at the p 0 <strong>and</strong> p 22 positions within<br />
these C-terminal targets fail to predict the <strong>specificity</strong> <strong>of</strong><br />
binding. 27,28<br />
As a result, a very interesting <strong>and</strong> challenging problem<br />
comes up: what makes <strong>PDZ</strong>s both promiscuous <strong>and</strong><br />
selective when they share similar primary <strong>and</strong> tertiary<br />
structures <strong>and</strong> have a conserved binding site 25 ?<br />
Moreover, the residues interacting with the C-terminal<br />
peptide are mostly conserved. Therefore, the key<br />
questions remaining to be understood are: what is the<br />
underlying mechanism that determines the interaction<br />
with specific peptide sequences <strong>and</strong> how can we predict<br />
the binding selectivities <strong>of</strong> <strong>PDZ</strong> <strong>domain</strong>s-C-terminal<br />
peptide interactions?<br />
Dynamics <strong>of</strong> <strong>PDZ</strong> Domain Interactions<br />
Figure 1<br />
Representative structure <strong>of</strong> a <strong>PDZ</strong> <strong>domain</strong> (PSD-95) in complex with its target peptide (PDB ID: 1BE9). (A) The common structure <strong>of</strong> <strong>PDZ</strong> <strong>domain</strong>s<br />
contains six b str<strong>and</strong>s (green) <strong>and</strong> two a-helices (red) with the peptide (in stick form). <strong>PDZ</strong> <strong>domain</strong> specifically recognizes short C-terminal peptide<br />
motifs that bind in an extended groove between second a-helix (aB) <strong>and</strong> the second b-str<strong>and</strong> (bB) <strong>and</strong> (B) the interactions <strong>of</strong> the peptide with the<br />
aB helix <strong>and</strong> GLGF segment <strong>of</strong> the bA-bB loop (C) Details <strong>of</strong> the binding region. Structural figures were produced with PyMOL. 24<br />
Role <strong>of</strong> dynamics in <strong>PDZ</strong>s<br />
Experimental 29 <strong>and</strong> computational studies 30–39 have<br />
shown that the dynamics <strong>of</strong> <strong>PDZ</strong>s must play a crucial role<br />
toward their binding selectivity. Basdevant et al. 30 analyzed<br />
12 different <strong>PDZ</strong> <strong>domain</strong> complexes using molecular<br />
dynamics simulations to identify the sources <strong>of</strong> selectivity<br />
<strong>and</strong> <strong>promiscuity</strong> underlying their interactions. They found<br />
that <strong>PDZ</strong> interactions favor nonpolar binding contributions<br />
when compared with electrostatic ones. Another<br />
computational study <strong>of</strong> three different <strong>PDZ</strong>s (hPTP1E,<br />
ZASP, <strong>and</strong> PSD 95) demonstrated that a single or at most a<br />
couple <strong>of</strong> low-frequency collective <strong>domain</strong> movements<br />
captures the deformation associated with the binding <strong>of</strong> a<br />
peptide. 32 From an evolutionary approach, it has been<br />
shown that <strong>PDZ</strong>s use minor conformational changes to<br />
propagate signals from one to functionally important distant<br />
sites through allosteric regulation. 21 In addition, an<br />
experimental study <strong>of</strong> hPTP1E indicated the existence <strong>of</strong> a<br />
network <strong>of</strong> residues that has a dynamic response to a lig<strong>and</strong><br />
binding. 29 Recently, Dhulesia et al. 33 extended this study<br />
using constrained molecular dynamics simulations <strong>and</strong><br />
provided a detailed characterization <strong>of</strong> the relation between<br />
structural <strong>and</strong> dynamical changes upon binding <strong>and</strong> identified<br />
the most connected residues based on a structural<br />
network. All these studies have shown that characterization<br />
<strong>of</strong> <strong>PDZ</strong> <strong>domain</strong> dynamics can provide insights to the<br />
relationship between their <strong>promiscuity</strong> <strong>and</strong> selectivity.<br />
In this study, we investigate how the dynamics <strong>of</strong><br />
unbound states <strong>of</strong> <strong>PDZ</strong>s contribute to the binding<br />
selectivity. Recent NMR dynamic studies suggest that (a)<br />
the bound conformation is already present among the<br />
conformational sub-states <strong>of</strong> the protein before a lig<strong>and</strong><br />
PROTEINS 797
inds 40 <strong>and</strong> (b) the stabilization <strong>of</strong> pre-existing<br />
conformations might be the fundamental paradigm for<br />
lig<strong>and</strong> binding. 40–42 Thus, the binding induced dynamics<br />
<strong>of</strong> unbound states can provide insights about binding<br />
selectivities <strong>of</strong> <strong>PDZ</strong>s.<br />
We use full atomic normal mode analysis (NMA) <strong>and</strong> a<br />
coarse-grained elastic network models (ENM) to compute<br />
the residue fluctuations <strong>of</strong> a large set <strong>of</strong> <strong>PDZ</strong>s. Elastic network<br />
models have been effectively used to underst<strong>and</strong> the<br />
fluctuation dynamics <strong>of</strong> proteins for a decade. 43–53 In<br />
addition, elastic network models have also shown that it is<br />
possible to obtain the lig<strong>and</strong>-induced conformational<br />
changes based on one single slowest fluctuation pr<strong>of</strong>ile or<br />
a combination <strong>of</strong> some, or all fluctuation pr<strong>of</strong>iles <strong>of</strong> an<br />
unbound conformation. 54–60<br />
In ENMs, the folded structure <strong>of</strong> a protein is assumed<br />
to be a three-dimensional elastic network subject to a<br />
uniform, single-parameter harmonic potential between<br />
all residue pairs, bonded or nonbonded, located within a<br />
certain cut<strong>of</strong>f distance. If the fluctuations are assumed to<br />
be isotropic with no directional preference, the model is<br />
referred to as the Gaussian Network Model (GNM). 44,45<br />
In this model, high frequency modes give kinetically important<br />
residues (i.e., residues important for folding <strong>and</strong><br />
binding), 59,61–64 whereas low frequency modes give the<br />
global motions <strong>of</strong> the proteins which are known to be<br />
important for the protein function. 44<br />
GNM is simply an effective model to elucidate the<br />
collective motions <strong>of</strong> proteins based on the structural<br />
topology; however, it lacks <strong>specificity</strong>, which is important<br />
to predict binding selectivity differences within the same<br />
protein family. Therefore, we modified GNM so that it<br />
takes into account the solvent interactions <strong>and</strong> residue<br />
interaction <strong>specificity</strong>. The extended model, called the specific<br />
Gaussian Network Model (s-GNM), is tested on a set<br />
<strong>of</strong> <strong>PDZ</strong>s to predict the classification <strong>and</strong> the binding <strong>specificity</strong><br />
based on the collective fluctuations near the native<br />
or equilibrium state. We further compare it with full<br />
atomic NMA, Anisotropic Network Model (ANM) <strong>and</strong><br />
GNM. We observe that all-atom NMA calculations are<br />
consistent with the coarse-grained s-GNM results. Thus,<br />
the remarkable agreement between the two methods<br />
allows us to use s-GNM satisfactorily in further analyses.<br />
The intrinsic fluctuations <strong>of</strong> a set <strong>of</strong> unbound Class I<br />
<strong>and</strong> II <strong>PDZ</strong>s are compared with their lig<strong>and</strong> induced<br />
experimental conformational changes. By clustering the<br />
fluctuation pr<strong>of</strong>iles <strong>of</strong> Class I <strong>and</strong> Class II type <strong>PDZ</strong>s, we<br />
also analyze the dynamics that induces Class I <strong>and</strong> Class II<br />
specificities. Our results show that the binding <strong>specificity</strong><br />
<strong>of</strong> <strong>PDZ</strong>s can be related to their dynamics 30–33,37,39 <strong>and</strong><br />
the mobility <strong>of</strong> different structural regions play important<br />
roles for binding to Class I <strong>and</strong> Class II peptides. In addition,<br />
we observe that changes in binding selectivity upon<br />
mutation can also be captured by the fluctuation pr<strong>of</strong>iles<br />
obtained by s-GNM. We have also investigated how<br />
s-GNM discriminates the binding selectivity when it is<br />
798 PROTEINS<br />
Z.N. Gerek et al.<br />
applied to homology models <strong>and</strong> found that the binding<br />
induced fluctuation pr<strong>of</strong>iles <strong>of</strong> homolog models can be<br />
used to discriminate their binding selectivity.<br />
MATERIAL AND METHODS<br />
The set <strong>of</strong> <strong>PDZ</strong> <strong>domain</strong> structures analyzed in this<br />
study is listed in Table I. The bound (closed) <strong>and</strong><br />
unbound (open) structures <strong>of</strong> <strong>PDZ</strong>s, obtained from the<br />
Protein Data Bank (PDB), 67 are listed in the first<br />
column. The second column displays the names <strong>of</strong> the<br />
corresponding proteins. The sequences <strong>of</strong> the binding<br />
peptides, the class <strong>of</strong> <strong>PDZ</strong> <strong>domain</strong> according to their<br />
binding <strong>specificity</strong> <strong>and</strong> the backbone root-mean square<br />
deviation (RMSD) between unbound-bound structures<br />
are listed in the following columns <strong>of</strong> the table. In this<br />
study, we focus on the most canonical classification <strong>of</strong><br />
Class I <strong>and</strong> Class II type <strong>of</strong> interactions due to the fact<br />
that we can find many Class I <strong>and</strong> Class II type <strong>PDZ</strong>s<br />
whose experimental structures are available. On the other<br />
h<strong>and</strong>, there are only a few Class III <strong>PDZ</strong>s; <strong>and</strong> it is hard<br />
to draw conclusions from such scarce data.<br />
Table I<br />
List <strong>of</strong> <strong>PDZ</strong> Domain Proteins Analyzed<br />
Name <strong>of</strong> the<br />
protein<br />
Peptide<br />
sequence<br />
<strong>PDZ</strong><br />
class<br />
RMSD<br />
(Š) a<br />
PDB code<br />
(unbound–bound)<br />
1g9o–1gq4 NHERF-<strong>PDZ</strong>1 -NDSLL I 1.51<br />
1g9o–1gq5 NHERF-<strong>PDZ</strong>1 -EDSFL I 1.94<br />
1g9o–1i92 NHERF-<strong>PDZ</strong>1 -QDTRL I 1.98<br />
1bfe–1be9 PSD-95-<strong>PDZ</strong>3 -KQTSV I 0.77<br />
1q3o–1q3p Shank -EAQTRL I 0.91<br />
1n7e–1n7f GRIP-<strong>PDZ</strong>6 -ATVRTYSC II 0.58<br />
1nte–1obx Syntenin-<strong>PDZ</strong>2 -(ETLE)DSVF I 0.48<br />
1nte–1oby Syntenin-<strong>PDZ</strong>2 -TNEFYA II 0.42<br />
2h3l–1n7t b<br />
Erbin -TGWETWV I 1.59<br />
2h3l–1mfg Erbin -EYLGLDVPV II 0.59<br />
1z86 b –2pdz b<br />
a1-Syntrophin -GVKESLV I 2.50<br />
1t2m b –2ain b<br />
AF-6 -LFSTEV I 1.49<br />
2ego–2egn Tamalin -SSSSL I 3.25<br />
1u37–1u38 X11/Mint -PVYI III 1.60<br />
1gm1 b –1vj6 b<br />
PTP-BL-<strong>PDZ</strong>2 -KRHSGSYLVTSV I 1.77<br />
2awx–2aww SAP97 -ATGL I 3.51<br />
3pdz b –1d5g b<br />
hPTP1E-<strong>PDZ</strong>2 -EQVSAV I 2.14<br />
2ev8 b –2ejy b<br />
(only unbound)<br />
Erythrocycte<br />
p55<br />
-RKEYCI II 2.54<br />
1kwa b<br />
hCASK -EYYV<br />
-EFYA<br />
II –<br />
2fe5 b<br />
DLG-<strong>PDZ</strong>2 -ETDV I –<br />
2f5y b<br />
RGS3 -YYKV II –<br />
1x45 b,c<br />
X11-M1 -GEPL III –<br />
2yt7 b,c<br />
(only bound)<br />
X11-M3 -GEPL III –<br />
2gzv PICK1 -YYKV II –<br />
a<br />
Backbone root-mean square deviation (RMSD) between unbound-bound structures<br />
based on the a carbons.<br />
b,<br />
Structures solved by NMR.<br />
c<br />
The bound structures <strong>of</strong> these proteins are not available but there are experimental<br />
studies <strong>of</strong> peptide sequences that bind to hCASK, 8 DLG-<strong>PDZ</strong>2, 25 RGS3, 65<br />
X11-M1, 66 <strong>and</strong> X11-M3. 66
Full atomic normal mode analysis<br />
In this study, the VIBRAN module in the CHARMM<br />
simulation program 68 is used to calculate the normal<br />
modes <strong>of</strong> the structures. The full atomic Hessian matrix<br />
<strong>of</strong> each structure is generated with the all-atom<br />
CHARMM22 force field. The solvent effect is introduced<br />
into NMA using a distance-dependent dielectric factor<br />
(RDIE) with eps 5 4r or effective energy function 1<br />
(eef1.1). 69 The mass weighted Hessian matrix is diagonalized<br />
using the DIAG module implemented in<br />
CHARMM. The structure is relaxed by energy minimization,<br />
including 10,000 steepest descent minimization<br />
steps followed by 10,000 steps <strong>of</strong> adapted basis Newton-<br />
Raphson (ABNR) minimization algorithm 70 with<br />
gradually decreasing harmonic constraints. This is<br />
followed by 20,000 steps <strong>of</strong> ABNR minimization algorithm<br />
until an energy gradient reached a value <strong>of</strong><br />
10 210 kcal/mole A ˚ . There are no modes with negative<br />
eigenvalues <strong>and</strong> six modes with near-zero frequency.<br />
Anisotropic network model (ANM)<br />
ANM is an extension <strong>of</strong> the original Gaussian network<br />
model (GNM) that incorporates the anisotropic fluctuations<br />
<strong>of</strong> a protein’s residues. 43 It is equivalent to a NMA<br />
with an elastic network model at the C a level <strong>and</strong> the<br />
Hessian is based on a harmonic potential form. 71 ANM<br />
provides information on the directions <strong>of</strong> fluctuations.<br />
The detailed theory <strong>of</strong> the ANM can be found in Atilgan<br />
et al. 43 Here, we used a cut<strong>of</strong>f value <strong>of</strong> 10 A ˚ .<br />
Specific-Gaussian network model (s-GNM)<br />
The details <strong>of</strong> Gaussian network model (GNM) have been<br />
given in different references. 44,45,72 In the model, each residue<br />
is represented with its a-carbon atom. The topology <strong>of</strong><br />
the network <strong>of</strong> N residues is defined by the adjacency or<br />
Kirchh<strong>of</strong>f matrix, the elements <strong>of</strong> which are given by,<br />
Cij ¼<br />
8<br />
><<br />
>:<br />
1; if i 6¼ j <strong>and</strong> Rij rc<br />
P<br />
0;<br />
Cij;<br />
if i 6¼ j<br />
if i ¼ j<br />
<strong>and</strong> Rij > rc<br />
j;j6¼i<br />
ð1Þ<br />
where rc is the cut-<strong>of</strong>f distance <strong>and</strong> Rij is the distance<br />
between ith <strong>and</strong> jth a-carbons. Because GNM (i) assigns a<br />
uniform strength for each interaction without considering<br />
the <strong>specificity</strong> <strong>and</strong> (ii) treats deeply buried residues <strong>and</strong><br />
those exposed to the solvent equally, it is nonspecific to<br />
protein amino acid sequence <strong>and</strong> solvent effects. In this<br />
study, we modify GNM by introducing <strong>specificity</strong> to predict<br />
the binding mechanism more precisely. How well<br />
GNM predicts the features <strong>of</strong> collective protein motion is<br />
usually measured by the comparison <strong>of</strong> the fluctuation pr<strong>of</strong>iles<br />
obtained by GNM with experimental crystallographic<br />
B-factors <strong>and</strong> NMR relaxation data. Recent work shows<br />
that GNM yields a correlation <strong>of</strong> 0.59 with crystallographic<br />
Dynamics <strong>of</strong> <strong>PDZ</strong> Domain Interactions<br />
B-factors 73 <strong>and</strong> higher correlation (0.75) with NMR data.<br />
However, the correlation decreases drastically for the structures<br />
with a large difference between the number <strong>of</strong> buried<br />
<strong>and</strong> solvent exposed residues. 48 In the case <strong>of</strong> <strong>PDZ</strong>s, the<br />
correlation between the fluctuation pr<strong>of</strong>iles computed by<br />
GNM <strong>and</strong> experimental data is low (average correlation<br />
coefficient <strong>of</strong> 0.52; <strong>and</strong> even as low as 0.17 in some <strong>PDZ</strong>s).<br />
To modify GNM, first, we introduce an additional term<br />
(i.e., additional node in the interaction network) that will<br />
take into account solvent interactions based on average solvent<br />
accessibility <strong>of</strong> each residue. In the original matrix, the<br />
nodes are connected with springs, if the pairs <strong>of</strong> residues<br />
are located within an interaction range, or cut<strong>of</strong>f distance.<br />
In the modified version <strong>of</strong> GNM, called specific GNM (s-<br />
GNM), there are N 1 1 nodes for a protein <strong>of</strong> N amino<br />
acids. This extra node denotes the solvent interaction <strong>of</strong><br />
each node (i.e., each amino acid), <strong>and</strong> the strength <strong>of</strong> the<br />
spring that connects the (N 1 1)th node with rest <strong>of</strong> the<br />
nodes are determined based on the solvent accessible surface<br />
area <strong>of</strong> the amino acid. Accessible surface area values<br />
are determined using Surface Racer program 74 with a<br />
probe radius <strong>of</strong> 1.4 A ˚ , corresponding to the size <strong>of</strong> a water<br />
molecule. They are normalized by the total accessible surface<br />
area <strong>of</strong> the protein. The contribution <strong>of</strong> the solvation<br />
interactions is controlled with an adjustable parameter a.<br />
The value <strong>of</strong> a is obtained by optimizing the correlation<br />
between the experimental (i.e., the fluctuations in different<br />
models <strong>of</strong> NMR structures or B-factors in X-ray structures)<br />
<strong>and</strong> the theoretical fluctuation pr<strong>of</strong>iles. The range<br />
<strong>of</strong> the optimized a parameter has been found between<br />
0.003 for X-ray structures <strong>and</strong> 0.001 for NMR structures.<br />
Second, we adjust the pairwise residue interaction<br />
strength specific to type <strong>of</strong> interaction using statistical<br />
contact potentials (Miyazawa <strong>and</strong> Jernigan 75 or Thomas<br />
<strong>and</strong> Dill 76 statistical potentials). In a recent study, Phillips<br />
<strong>and</strong> coworkers 48 introduced the chemical network<br />
model (CNM) where residue interactions are divided<br />
into bonded <strong>and</strong> nonbonded types. Similarly, to assign<br />
specific interaction strength parameters for the springs,<br />
we also define two different spring constants in the residue<br />
interaction network for bonded <strong>and</strong> nonbonded<br />
interactions, g b <strong>and</strong> g nb, respectively.<br />
Cij ¼<br />
8<br />
><<br />
>:<br />
gb; if ij bonded <strong>and</strong> Rij rc<br />
gnb; if ij nonbonded <strong>and</strong> Rij rc<br />
P<br />
0;<br />
Cij;<br />
if i 6¼ j <strong>and</strong> Rij > rc<br />
if i ¼ j<br />
j;j6¼i<br />
ð2Þ<br />
The strength parameter <strong>of</strong> nonbonded interactions is<br />
further adjusted based on the inter-residue interaction<br />
potentials <strong>of</strong> Miyazawa <strong>and</strong> Jernigan 75 or Thomas <strong>and</strong><br />
Dill. 76 In this study, we tested our model using both the<br />
Miyazawa-Jernigan <strong>and</strong> the Thomas-Dill knowledge-based<br />
potentials. Although there are differences in developing<br />
PROTEINS 799
these two statistical potentials, our results do not change<br />
with the choice <strong>of</strong> the statistical potential. The results<br />
using the Thomas-Dill potentials are reported here.<br />
The statistical inter-residue interaction potential<br />
between the ith <strong>and</strong> jth nonbonded residues, eij, is incorporated<br />
in a discretized way:<br />
8<br />
><<br />
gnb ¼<br />
>:<br />
1:5 g nb; 2:0 < eij < 0:6<br />
g nb; 0:6 < eij < 0:01<br />
0:5 g nb; 0:01 < eij < 0:01<br />
0; eij > 0:01<br />
ð3Þ<br />
The optimal cut<strong>of</strong>f distance is taken as 7.5 A ˚ . The<br />
spring constant <strong>of</strong> the bonded part (gb) is taken as 1.<br />
For the nonbonded part (gnb), 0.1 is found as the optimized<br />
value by maximizing the correlation between the<br />
computed fluctuations <strong>and</strong> experimental crystallographic<br />
B-factors. The residue fluctuations determined by the statistical<br />
mechanical average <strong>of</strong> overall fluctuations are<br />
obtained from the inverse <strong>of</strong> the Kirchh<strong>of</strong>f matrix.<br />
The temperature factor (B-factor) <strong>of</strong> any residue can<br />
be expressed in terms <strong>of</strong> a weighted sum <strong>of</strong> the meansquare<br />
fluctuations driven by all modes as<br />
Bi ¼ 8p2<br />
3<br />
ðDRiÞ 2 ¼ 8p 2 kBT C 1<br />
ii<br />
ð4Þ<br />
Both original GNM <strong>and</strong> s-GNM are written in python.<br />
In s-GNM, the scipy optimization module (Powell’s<br />
method) is used for minimizing the difference between<br />
theoretical mean-square fluctuation <strong>and</strong> experimental<br />
B-factors. The experimental B-factors <strong>of</strong> the X-ray structures<br />
<strong>and</strong> variations in residue positions between NMR<br />
models are compared with the residue fluctuations predicted<br />
by the GNM <strong>and</strong> s-GNM. For some <strong>PDZ</strong>s, the<br />
agreement between the fluctuation pr<strong>of</strong>iles obtained by<br />
s-GNM <strong>and</strong> experimental data is significantly better<br />
when it is compared with GNM results (see Table II, columns<br />
4 <strong>and</strong> 5). Correlations <strong>of</strong> 0.60, 0.73, <strong>and</strong> 0.56 are<br />
obtained from s-GNM for Na1/H1 exchanger regulatory<br />
factor (NHERF), Shank, <strong>and</strong> Erbin, respectively, whereas<br />
GNM provides correlation coefficients <strong>of</strong> 0.45, 0.73, <strong>and</strong><br />
0.17. Overall, the s-GNM increases the correlation (0.58)<br />
but not significantly when compared with that <strong>of</strong> GNM<br />
(0.52). We observe that if the correlation coefficient<br />
obtained by GNM is greater than 0.6, s-GNM does not<br />
improve the correlation. However, it gives statistically<br />
significant higher correlation coefficients for the rest.<br />
(We obtain a P value <strong>of</strong> 0.026 for a paired one-tailed<br />
t-test). The effects <strong>of</strong> the crystal environment in B-factors<br />
have been shown. 48,57,80–82 We also include crystal<br />
effect following the procedure <strong>of</strong> Kondrashov et al. 48<br />
where the crystal contacts are taken into account by<br />
adding interactions between residues involved in crystal<br />
Table II<br />
Selected Modes Based on s-GNM, GNM, <strong>and</strong> NMA Methods <strong>and</strong> Comparison with Theoretical <strong>and</strong> Experimental Displacements Between<br />
Unbound <strong>and</strong> Bound Structures <strong>and</strong> Correlation with B-factors (RB-factor) <strong>of</strong> the X-ray Structures <strong>and</strong> Variations in Residue Positions<br />
Between NMR Models<br />
PDB code<br />
(unbound)<br />
Resolution<br />
(Š)<br />
Name <strong>of</strong><br />
the protein<br />
R B-factor s-GNM GNM NMA ANM<br />
GNM s-GNM Mode R Mode R Mode R Mode R<br />
1g9o 1.50 NHERF 0.45 0.60 1–4 0.64 1–4 0.57 1–9 0.32 1–10 0.33<br />
1bfe 2.30 PSD-95 0.21 0.41 1–6 0.68 1–4 0.47 1–5 0.20 1–6 0.29<br />
1q3o 1.80 Shank 0.73 0.73 1–7 0.47 1–2 0.61 1–2 0.11 1–7 0.61<br />
1n7e 1.50 GRIP 0.54 0.60 1–3 0.56 1–4 0.49 1–3 0.22 1–2 0.59<br />
1nte 1.24 Syntenin-I 0.49 0.55 1–3 0.54 1–2 0.36 1–6 0.65 1–2 0.67<br />
Syntenin-II a<br />
1–3 0.64 1–2 0.57 1–6 0.52 1–2 0.65<br />
2h3l 1.00 Erbin-I 0.17 0.56 1–2 0.60 1–6 0.46 1–10 0.62 1–4 0.53<br />
Erbin-II a<br />
1–2 0.12 2 0.33 a<br />
1–4 0.31 1–5 0.03<br />
1z86 NMR a1-Syntrophin 0.71 0.55 1–2 0.63 1–2 0.41 1–7 0.15 1–3 0.54<br />
1t2m NMR AF6 0.44 0.48 1–2 0.82 1–2 0.46 1–9 0.40 1–3 0.49<br />
2ego 1.80 Tamalin 0.65 0.65 1–10 0.56 1–7 0.46 1–4 0.09 1–4 0.52<br />
1u37 NMR X11/Mint 0.63 0.55 1–3 0.53 1–2 0.58 1–4 0.37 1–5 0.38<br />
1gm1 b<br />
NMR PTP-BL 0.53 0.55 1–2 0.59 1–2 0.44 – – 1–8 0.49<br />
2awx 1.80 SAP97 0.67 0.70 1–10 0.45 1–8 0.35 1–10 0.45 1–4 0.43<br />
3pdz NMR hPTP1E 0.83 0.76 1–5 0.57 1–6 0.43 1–8 0.37 1–8 0.40<br />
2ev8 NMR p55 0.45 0.40 1–6 0.52 1–2 0.59 1–7 0.60 1–6 0.59<br />
1kwa c<br />
1.93 hCASK 0.12 0.54 1–3 – – – – – – –<br />
2fe5 c<br />
1.10 DLG-<strong>PDZ</strong>2 0.81 0.84 1–3 – – – – – – –<br />
2f5y c<br />
2.39 RGS3 0.38 0.46 1–16 – – – – – –<br />
1x45 c<br />
NMR X11-M1 0.47 0.47 1–5 – – – – – – –<br />
2yt7 c<br />
NMR X11-M3 0.59 0.61 1–7 – – – – – – –<br />
AVG 0.52 0.58 0.56 0.48 0.36 0.47<br />
a Proteins that bind to Class II type peptides.<br />
b The structure did not converge in the minimization step <strong>of</strong> NMA.<br />
c The bound structures <strong>of</strong> these proteins are not available.<br />
800 PROTEINS<br />
Z.N. Gerek et al.
contacts (for results, see Table SIII in Supporting Information).<br />
For our data set, the average correlation<br />
between thermal fluctuations <strong>and</strong> B-factors does not significantly<br />
change, when we include crystal environment<br />
(i.e., with the s-GNM, the overall average correlation <strong>of</strong><br />
the B-factors is 0.59, whereas correlation is 0.56 with the<br />
inclusion <strong>of</strong> crystal contacts). We also note that s-GNM<br />
is observed not to improve the correlation coefficients<br />
significantly for the NMR structures.<br />
In s-GNM, the motions along different modes are<br />
obtained from eigenvalue decomposition (G 5 ULU 21 )<br />
<strong>of</strong> the Kirchh<strong>of</strong>f matrix. U is the orthonormal matrix <strong>of</strong><br />
eigenvectors (uk) <strong>of</strong>G, <strong>and</strong> L is the diagonal matrix <strong>of</strong><br />
the eigenvalues (kk), 1 k N 1 1(N modes for N<br />
residues in the protein <strong>and</strong> one for the solvent). The<br />
eigenvalues kk <strong>and</strong> the eigenvectors uk <strong>of</strong> G yield the frequencies<br />
<strong>and</strong> shapes <strong>of</strong> the N modes <strong>of</strong> motion (1 k<br />
N) controlling the dynamics <strong>of</strong> the system. 44 The fluctuation<br />
<strong>of</strong> residue i from its equilibrium position along the<br />
kth principal coordinate can be described with the ith<br />
element <strong>of</strong> (uk)i <strong>of</strong> the kth eigenvector. The mean-square<br />
fluctuation <strong>of</strong> residue i can be written as a weighted sum<br />
<strong>of</strong> the square fluctuations driven by all modes as<br />
DR 2 i<br />
¼ X<br />
k<br />
DR 2 i k<br />
¼ 3kBT X<br />
k<br />
k 1 2<br />
k ðukÞi ð5Þ<br />
Displacements along the most cooperative global<br />
modes <strong>of</strong> motion predicted by the model enable us to<br />
underst<strong>and</strong> how fluctuations concert at the opposite or<br />
same directions as also shown in an elastic network analysis<br />
<strong>of</strong> Tobi <strong>and</strong> Bahar. 59<br />
Comparison <strong>of</strong> theoretical residue<br />
fluctuations with experimental lig<strong>and</strong>induced<br />
conformational changes<br />
To find the binding induced fluctuations, we focus on<br />
the contribution <strong>of</strong> each mode, weighted by the inverse<br />
<strong>of</strong> the corresponding eigenvalue. 83 The issue <strong>of</strong> how<br />
many modes will contribute to the binding dynamics is<br />
addressed by evaluating the distribution <strong>of</strong> mode frequencies<br />
(eigenvalues). A subset <strong>of</strong> modes whose eigenvalues<br />
are dispersed from those <strong>of</strong> the other modes is<br />
identified following the procedure also used in the study<br />
<strong>of</strong> Isin et al. 84 In this approach, first, the histogram <strong>of</strong><br />
the eigenvalues is generated then the bin size is computed<br />
based on the highest dispersion in eigenvalue spectrum<br />
(i.e., the first gap in the eigenvalue spectrum).<br />
Eigenvalues corresponding to the first bin are used along<br />
with their eigenmodes to compute the weighted sum <strong>of</strong><br />
the square fluctuations obtained by Eq. (5). The number<br />
<strong>of</strong> modes used for each protein is listed in Table II. The<br />
fluctuation pr<strong>of</strong>iles are also compared with the experimental<br />
conformational changes upon binding.<br />
Experimental conformational changes (residue displacements)<br />
are found by superimposing the a-carbons<br />
Dynamics <strong>of</strong> <strong>PDZ</strong> Domain Interactions<br />
<strong>of</strong> the unbound <strong>and</strong> bound structures <strong>and</strong> calculating the<br />
difference between two conformations as<br />
DR ¼ RU RB ð6Þ<br />
where R U <strong>and</strong> R B are the crystallographic coordinates<br />
<strong>of</strong> the unbound <strong>and</strong> bound structures. These normalized<br />
vectors are compared with normalized residue<br />
fluctuations.<br />
Computation <strong>of</strong> global motions related to<br />
binding <strong>specificity</strong><br />
NMA-based methods have proven to be useful for<br />
identifying the common <strong>and</strong> distinctive structural <strong>and</strong><br />
dynamic features <strong>of</strong> the globin heme binding family, 85<br />
protein superfamilies, 86 protease families, 87 <strong>and</strong><br />
enzymes. 88 With a similar methodology, we use s-GNM<br />
for obtaining the common fluctuation pr<strong>of</strong>iles for different<br />
classes <strong>of</strong> <strong>PDZ</strong>s. Because all <strong>PDZ</strong>s have different<br />
sequence sizes, in order to compare their dynamics, we<br />
first need to find the common regions among the <strong>PDZ</strong><br />
proteins. Multiple sequence alignments are performed on<br />
the segments <strong>of</strong> the <strong>PDZ</strong>s that are critical for binding:<br />
bA-bB loop, bB str<strong>and</strong>, bB-bC loop, bC str<strong>and</strong>, <strong>and</strong> aB<br />
helix. Figure S1 in Supporting Information gives the<br />
aligned residues <strong>of</strong> all <strong>PDZ</strong>s (results <strong>of</strong> the multiple<br />
sequence alignments) as obtained using ClustalW for all<br />
<strong>PDZ</strong> <strong>domain</strong>s. 89,90 Second, we form a sub-root-meansquare<br />
fluctuation-matrix restricted to common residues,<br />
obtained from multiple sequence alignment. The meansquare<br />
fluctuation values corresponding to the consecutive<br />
aligned residues are extracted using a set <strong>of</strong> collective<br />
modes as explained above [See Eq. (5)]. In this submatrix<br />
(A), each row corresponds to an aligned residue<br />
<strong>and</strong> each column to a <strong>PDZ</strong> <strong>domain</strong> protein. This<br />
sub-matrix is formed for both Class I <strong>and</strong> Class II <strong>PDZ</strong><br />
<strong>domain</strong> proteins, separately.<br />
22<br />
3 2 3 2 3 2 3 3<br />
DR1 DR1 DR1 DR1<br />
66<br />
DR2 7 6 DR2 7 6 DR2 7 6 DR2 7 7<br />
66<br />
7 6 7 6 7 6 7 7<br />
A ¼ 66<br />
7 6 7 6 7 6 7 7<br />
66<br />
7 6 7 6 7 6 7 7<br />
44<br />
5 4 5 4 5 4 5 5 ð7Þ<br />
DRm<br />
1<br />
DRm<br />
2<br />
DRm<br />
n 1<br />
DRm<br />
where DRi (i 5 1,2...m) corresponds to the theoretical<br />
root mean square fluctuations <strong>of</strong> unbound structures<br />
from s-GNM, m being the number <strong>of</strong> aligned residues<br />
obtained from ungapped sequence alignments, <strong>and</strong> n representing<br />
the total number <strong>of</strong> <strong>PDZ</strong> <strong>domain</strong>s used for the<br />
computations.<br />
We then apply Singular Value Decomposition (SVD)<br />
to find the dominant dynamics pr<strong>of</strong>iles <strong>of</strong> Class I <strong>and</strong><br />
Class II proteins. The SVD approach has been used effectively<br />
to classify protein structures based on their amino<br />
acid composition 91 <strong>and</strong> to classify anticancer agents by<br />
examining their growth inhibitory potential values. 92<br />
n<br />
PROTEINS 801
SVD transforms the original data points into a new space<br />
with principal axes. The variance along the first axis is<br />
highest meaning that it captures the highest information<br />
<strong>of</strong> the original matrix. The original data points can be<br />
expressed as a linear combination <strong>of</strong> a few dominant<br />
principal components. Using the SVD method, A is<br />
decomposed into three matrices,<br />
A ¼ SwD T<br />
ð8Þ<br />
where S <strong>and</strong> D T , or D transposed, are left <strong>and</strong> right<br />
singular vectors (or principal axes), <strong>and</strong> w is a diagonal<br />
matrix <strong>of</strong> singular values. S is the orthonormal transformation<br />
matrix that defines the relationship between the<br />
original coordinate frame <strong>and</strong> the new SVD frame, D T<br />
is a matrix representing the new coordinates <strong>of</strong> the<br />
original data points in the new SVD space. S defines a<br />
common pattern <strong>of</strong> the collective fluctuations among<br />
<strong>PDZ</strong> <strong>domain</strong>s <strong>and</strong> each right principal axis indicates<br />
the distribution <strong>of</strong> proteins based on their dynamics<br />
pr<strong>of</strong>ile.<br />
Applying s-GNM to mutant proteins<br />
To underst<strong>and</strong> the effect <strong>of</strong> a mutation on the<br />
dynamics <strong>and</strong> consequently on the selectivity <strong>of</strong> <strong>PDZ</strong>s,<br />
a computational point mutation is introduced into the<br />
X-ray structure <strong>of</strong> the PICK1 (<strong>PDZ</strong> protein interacting<br />
with C kinase 1) via Swiss PDB Viewer. 93 Before applying<br />
the s-GNM method, the mutated structure is subjected<br />
to an energy minimization <strong>of</strong> 50 steepest descent<br />
iterations followed by 1000 conjugate gradient iterations<br />
using AMBER 96 force field 94,95 to relax the side<br />
chains. Then, the same procedure described above is<br />
followed for the mutated structure to find its dynamics<br />
pr<strong>of</strong>ile.<br />
Applying s-GNM to homology models<br />
In a frontier study <strong>of</strong> Stiffler et al., 77 85 <strong>PDZ</strong> <strong>domain</strong><br />
sequences (out <strong>of</strong> 157 mouse <strong>PDZ</strong>s) were found to bind<br />
to at least one peptide. We carefully look at the sequences<br />
<strong>of</strong> the 85 <strong>PDZ</strong> <strong>domain</strong>s <strong>and</strong> choose sequences that<br />
can bind either Class I or Class II peptides. The protein<br />
sequences are obtained from the SMART (Simple Modular<br />
Architecture Research Tool) database. 96 They are submitted<br />
to ‘‘The Structure Prediction Meta Server’’ 97,98<br />
with the option <strong>of</strong> an automated homology model program<br />
ESyPref3D. ESyPref3D is based on a strategy using<br />
neural networks to evaluate sequence alignments 99 <strong>and</strong><br />
uses the program MODELLER 100,101 to build the final<br />
structural model. Homology models are constructed with<br />
MODELLER with a minimal sequence similarity <strong>of</strong> 50%<br />
to the target <strong>and</strong> then s-GNM is applied to all<br />
structures.<br />
802 PROTEINS<br />
Z.N. Gerek et al.<br />
Applying linear discriminant analysis (LDA)<br />
for classification<br />
We apply linear discrimant analysis (LDA) to classify<br />
the <strong>PDZ</strong>s into three groups: Class I, Class II, <strong>and</strong> both<br />
Class I <strong>and</strong> Class II (i.e., dual <strong>specificity</strong>) by training<br />
with <strong>PDZ</strong>s <strong>of</strong> known classes. Linear Discriminant Analysis<br />
(LDA) has been utilized as an effective method <strong>of</strong><br />
choice when the data set is already clustered. LDA maximizes<br />
the ratio <strong>of</strong> between-class distance <strong>and</strong> minimizing<br />
the within-class distance in any particular data set. Then<br />
we predict the classes <strong>of</strong> mutated structures, which represent<br />
an independent test set. The classify function in<br />
MATLAB is used in the analysis.<br />
RESULTS AND DISCUSSION<br />
Dominant modes <strong>of</strong> motions obtained from<br />
unbound conformation derive bound<br />
conformations<br />
We applied four different methods to a set that<br />
includes <strong>PDZ</strong>s having Class I, Class II, <strong>and</strong> both Class I<br />
<strong>and</strong> Class II (dual) type binding specificities. The results<br />
<strong>of</strong> (i) full atomic NMA with empirical force fields, (ii)<br />
Anisotropic Network Model (ANM), (iii) Gaussian<br />
Network Model (GNM), <strong>and</strong> (iv) specific-Gaussian<br />
Network Model (s-GNM) are compared <strong>and</strong> discussed in<br />
the following sections.<br />
Here, we have analyzed the collective motions <strong>of</strong> the<br />
unbound structures <strong>of</strong> <strong>PDZ</strong>s by the four aforementioned<br />
methods. We compared the collective (slowest) modes<br />
[see Methods <strong>and</strong> Eq. (5) for the selection <strong>of</strong> how many<br />
modes would contribute to the fluctuation dynamics]<br />
with the observed conformational changes by a specific<br />
peptide binding.<br />
Figure 2 presents the normalized fluctuation pr<strong>of</strong>iles<br />
obtained by the slowest modes <strong>of</strong> s-GNM, ANM, NMA,<br />
<strong>and</strong> GNM along with lig<strong>and</strong>-induced experimental conformational<br />
changes for PSD-95 <strong>and</strong> hPTP1E. The correlation<br />
coefficient for these cases can be found in Table II.<br />
It also shows the corresponding ribbon diagrams <strong>of</strong> these<br />
two proteins that are colored with respect to their fluctuation<br />
pr<strong>of</strong>iles from a spectrum <strong>of</strong> red (for the highest<br />
fluctuation) to yellow, green, cyan, <strong>and</strong> finally blue (the<br />
lowest fluctuation). There are five ribbon diagrams per<br />
each protein, which are colored with respect to the fluctuation<br />
pr<strong>of</strong>iles obtained from GNM, s-GNM, NMA,<br />
ANM, <strong>and</strong> the a-carbon displacement vector upon transition<br />
from unbound to bound form. The agreement<br />
between each fluctuation pr<strong>of</strong>ile <strong>and</strong> the conformational<br />
change upon binding shows that s-GNM results display<br />
comparable agreement with NMA <strong>and</strong> ANM results <strong>and</strong><br />
yet a much better correspondence with experimental<br />
changes when compared with GNM results. Table II lists<br />
the agreement with the experimental conformational<br />
change as correlation coefficients for each <strong>PDZ</strong> <strong>and</strong> the
number <strong>of</strong> modes used in NMA, ANM, GNM, <strong>and</strong><br />
s-GNM.<br />
In previous studies, it was shown that the slowest<br />
global modes are important to represent the lig<strong>and</strong>induced<br />
conformational changes in proteins. 56,59,60,102<br />
Likewise, our results show that the weighted average <strong>of</strong><br />
slowest modes can capture the binding induced conformational<br />
changes in this large set <strong>of</strong> <strong>PDZ</strong>s as also shown<br />
earlier for three <strong>PDZ</strong>s. 32 Especially, the conformational<br />
changes in peptide binding regions, that are very critical<br />
for binding <strong>specificity</strong>, have significant agreement with<br />
the fluctuation pr<strong>of</strong>ile obtained by s-GNM. Overall, the<br />
results have shown that the collective fluctuation pr<strong>of</strong>ile<br />
obtained by s-GNM can capture the binding induced<br />
Dynamics <strong>of</strong> <strong>PDZ</strong> Domain Interactions<br />
Figure 2<br />
The binding induced fluctuation pr<strong>of</strong>iles <strong>of</strong> (A) PSD-95 <strong>and</strong> (C) hPTP1E obtained by NMA, GNM, ANM, s-GNM, <strong>and</strong> the experimental a-carbon<br />
displacement vectors that show average residue displacement upon lig<strong>and</strong> binding along with the ribbon diagrams colored with respect to<br />
fluctuation pr<strong>of</strong>iles (B <strong>and</strong> D). The dashed curves are obtained from original GNM; blue, black, <strong>and</strong> green solid curves are the predictions <strong>of</strong> NMA,<br />
s-GNM, <strong>and</strong> ANM, <strong>and</strong> solid lines with data points represent the experimental Ca displacements upon binding. Theoretical curves predicted by<br />
NMA, ANM, s-GNM, <strong>and</strong> GNM are normalized to have the same area under the curve with the experimental one. The fluctuation pr<strong>of</strong>iles<br />
obtained by s-GNM agree better with experimental conformational change (correlation coefficients <strong>of</strong> 0.68 <strong>and</strong> 0.57, respectively for protein PSD-95<br />
<strong>and</strong> hPTP1E can be listed in Table II). There are five ribbon diagrams colored with respect to the fluctuation pr<strong>of</strong>iles obtained from GNM, s-GNM,<br />
NMA, ANM, <strong>and</strong> the a-carbon displacement vector upon transition from unbound to bound form. The corresponding ribbon diagrams are<br />
colored with respect to their fluctuation pr<strong>of</strong>iles from a spectrum <strong>of</strong> red (for the highest fluctuation) to yellow, green, <strong>and</strong> finally blue (the lowest<br />
fluctuation). The theoretical data obtained by s-GNM <strong>and</strong> NMA agree better with the experimental data when we compare the agreement<br />
between the fluctuation pr<strong>of</strong>ile from GNM <strong>and</strong> experimental displacement vector <strong>of</strong> PSD-95 <strong>and</strong> hPTP1E.<br />
conformational changes with an average correlation <strong>of</strong><br />
0.56 as opposed to 0.48, 0.36, <strong>and</strong> 0.47 for GNM, NMA,<br />
<strong>and</strong> ANM, respectively (see Table II). We have also determined<br />
the single eigenmode that gives the best correlation<br />
with the experimental conformational changes <strong>and</strong><br />
this analysis gives a similar qualitative picture as observed<br />
in Table II (See Table SI in Supporting Information).<br />
Common fluctuation pr<strong>of</strong>iles for Class I,<br />
Class II <strong>specificity</strong><br />
We have investigated the extent to which <strong>PDZ</strong><br />
<strong>domain</strong>s could be classified on the basis <strong>of</strong> their bindinginduced<br />
dynamics <strong>and</strong> global motions shared between<br />
PROTEINS 803
different members <strong>of</strong> <strong>PDZ</strong>s. Thus, we analyze the regions<br />
that undergo the highest conformational changes (i.e.,<br />
which residues exhibit high amplitude fluctuation upon<br />
binding) <strong>and</strong> see if there are patterns for those changes<br />
with respect to binding selectivity. First, using the slowest<br />
modes, we obtain the fluctuation pr<strong>of</strong>iles <strong>of</strong> all <strong>PDZ</strong>s<br />
listed in Table I with s-GNM. Second, we perform multiple<br />
sequence alignments using the sequence segments:<br />
bA-bB loop, bB str<strong>and</strong>, bB-bC loop, bC str<strong>and</strong>, <strong>and</strong> aB<br />
helix <strong>of</strong> <strong>PDZ</strong>s, which are observed to be in direct contact<br />
or in the nearby region <strong>of</strong> the peptides. The mean-square<br />
fluctuations corresponding to these ungapped regions <strong>of</strong><br />
aligned sequences are then collected <strong>and</strong> a representative<br />
matrix is built by the procedure described in the<br />
Methods section: the columns <strong>of</strong> this matrix represent<br />
different <strong>PDZ</strong> proteins, whereas the rows correspond to<br />
the common (sequentially aligned) residues. Therefore,<br />
the ijth element <strong>of</strong> the matrix defines the mean-square<br />
fluctuations <strong>of</strong> the ith residue in the jth protein. We<br />
construct two mean square fluctuation matrices for Class<br />
I <strong>and</strong> II proteins separately. Analysis <strong>of</strong> these two matrices<br />
can be used to obtain the common fluctuation pr<strong>of</strong>iles<br />
that are shared within the members <strong>of</strong> Class I <strong>and</strong><br />
Class II type <strong>PDZ</strong>s.<br />
In an attempt to find the common fluctuation pr<strong>of</strong>iles<br />
responsible for Class I <strong>and</strong> Class II type binding selectivity,<br />
we apply the SVD technique to the fluctuation matrices<br />
(see the Methods). An SVD transformation defines a<br />
new set <strong>of</strong> principal axes forming the SVD space, such<br />
that the original data is well represented as a linear combination<br />
<strong>of</strong> a few dominant SVD axes. Through singular<br />
value decomposition, right principal axes (d T ) provide<br />
the new SVD space <strong>and</strong> left principal axes (s) give the<br />
common characteristics <strong>of</strong> the fluctuation pr<strong>of</strong>iles. Figure<br />
3 displays the common pr<strong>of</strong>iles <strong>of</strong> Class I <strong>and</strong> Class II<br />
<strong>PDZ</strong> <strong>domain</strong>s in the first two principal SVD vectors (A)<br />
s1, <strong>and</strong> (B) s2. The first principal axis (s1) <strong>of</strong> Class I <strong>and</strong><br />
Class II <strong>PDZ</strong>s exhibits similar dynamics pr<strong>of</strong>iles <strong>and</strong> it<br />
shows the common fluctuation pr<strong>of</strong>iles <strong>of</strong> all <strong>PDZ</strong><br />
<strong>domain</strong>s due to the similarity <strong>of</strong> Class I <strong>and</strong> Class II<br />
structures <strong>and</strong> functions [see Fig. 3(A)]. The two b<br />
str<strong>and</strong>s (bB <strong>and</strong> bC) act as the least mobile regions in<br />
this mode. Apparently, this mode is not important for<br />
the selectivity <strong>of</strong> Class I versus Class II types.<br />
Interestingly, we observe differences in the fluctuation<br />
pr<strong>of</strong>iles <strong>of</strong> Class I <strong>and</strong> Class II types in the second principal<br />
axis (s2). The corresponding ribbon diagrams <strong>of</strong> Class<br />
I <strong>and</strong> Class II type <strong>PDZ</strong>s shown in Figure 3(B) highlight<br />
the regions that are critical for binding selectivity. The<br />
bA-bB loop <strong>and</strong> bB-bC loop exhibit high amplitude<br />
anti-correlated fluctuations in Class I <strong>PDZ</strong>s. In addition,<br />
both loops show similar mobility (same amplitude fluctuations).<br />
Thus, the dynamics <strong>of</strong> both loops are equally<br />
critical in Class I type peptide binding. The mutational<br />
studies on bA-bB loop <strong>and</strong> bB-bC loops have also indicated<br />
the importance <strong>of</strong> these two loops in Class I type<br />
804 PROTEINS<br />
Z.N. Gerek et al.<br />
binding. 29,103–110 In agreement with our findings, it<br />
has been shown that the binding affinity <strong>of</strong> PSD-95<br />
(Class I type <strong>PDZ</strong> <strong>domain</strong>) is reduced by introducing<br />
specific mutations at the bB-bC loop. 106,108 Another<br />
Class I type <strong>PDZ</strong> <strong>domain</strong> protein, hPTP1E also supports<br />
the importance <strong>of</strong> bB-bC loop for lig<strong>and</strong> binding. NMR<br />
experiments on the hPTP1E protein have pointed out<br />
that Asn27, Thr28, Arg31, <strong>and</strong> Gly34 in bB-bC loop<br />
have significant relaxation contribution from conformational<br />
exchange in the unbound form. 29 The importance<br />
<strong>of</strong> the carboxylate binding loop (bA-bB loop) has been<br />
discussed for a1-syntrophin 105 <strong>and</strong> synapse-associated<br />
protein-97 (SAP97) 110 that bind to Class I type peptides.<br />
The computational studies applied to Class I <strong>PDZ</strong>s<br />
showed that bA-bB loop <strong>and</strong> the aB-helix undergoes the<br />
largest deformations upon binding 32 <strong>and</strong> the region <strong>of</strong><br />
residue Val30, which is in the bB-bC loop <strong>and</strong> residues<br />
in the region between Val61 <strong>and</strong> Ala69 become more<br />
flexible upon binding. 33 On the other h<strong>and</strong>, bB-bC loop<br />
<strong>and</strong> aB-helix show high anti-correlated fluctuations in<br />
the case <strong>of</strong> Class II type <strong>PDZ</strong>s. The importance <strong>of</strong> the<br />
aB-helix in class II type binding is corroborated by<br />
mutational studies. Changing His71 to Leu in Erbin 111<br />
<strong>and</strong> Lys 83 to Val <strong>and</strong> His in PICK1 107 improve the<br />
binding to Class II type peptides. Furthermore, analysis<br />
displaying the cross-correlation maps <strong>of</strong> Class I <strong>and</strong> Class<br />
II <strong>PDZ</strong>s agrees with these findings (See Supporting<br />
Information Fig. S2 where dark blue represents the anti<br />
correlated motions).<br />
To underst<strong>and</strong> the organization <strong>and</strong> distribution <strong>of</strong><br />
<strong>PDZ</strong> selectivities at large, we map the fluctuation pr<strong>of</strong>iles<br />
<strong>of</strong> different <strong>PDZ</strong>s onto the first three principal axes <strong>of</strong><br />
SVD. In contrast to our previous analysis where we construct<br />
two matrices for Class I <strong>and</strong> II proteins separately,<br />
here we construct a single matrix including all <strong>PDZ</strong>s. As<br />
discussed above, columns <strong>of</strong> our original data matrix<br />
represents different types <strong>of</strong> <strong>PDZ</strong>s characterized by fluctuation<br />
pr<strong>of</strong>iles, thus each row represents the mean<br />
square fluctuation value <strong>of</strong> a sequentially aligned common<br />
residue. After decomposing the original matrix<br />
using SVD, the columns <strong>of</strong> the new matrix (D T ) are the<br />
same <strong>PDZ</strong> proteins expressed in the new SVD frame,<br />
which characterizes the similarities/differences between<br />
the proteins, based on their fluctuation pr<strong>of</strong>iles. In other<br />
words, when the fluctuation pr<strong>of</strong>ile matrix that includes<br />
the fluctuation pattern <strong>of</strong> various Class I <strong>and</strong> Class II<br />
type <strong>PDZ</strong> <strong>domain</strong>s are decomposed using SVD, the right<br />
principal axes (D T ) <strong>of</strong> the singular matrix shows the<br />
binding-induced fluctuations in the new SVD space for<br />
different <strong>PDZ</strong> <strong>domain</strong> proteins (See details in the Materials<br />
<strong>and</strong> Methods). The distributions <strong>of</strong> binding induced<br />
fluctuation pr<strong>of</strong>iles <strong>of</strong> unbound <strong>PDZ</strong> <strong>domain</strong>s (including<br />
all <strong>PDZ</strong>s: Class I, Class II, <strong>and</strong> dual <strong>specificity</strong> ones) are<br />
obtained from the SVD. They are projected into the<br />
space spanned by the first three principal axes <strong>of</strong> the<br />
SVD space (See Supporting Information Fig. S3). Con-
sistent with a recent experimental study, 77 we observe<br />
that the selectivity space is not discrete for Class I <strong>and</strong> II<br />
proteins but rather continuous.<br />
s-GNM analysis on homology models<br />
<strong>of</strong> <strong>PDZ</strong> <strong>domain</strong>s<br />
We further investigate how s-GNM discriminates the<br />
binding selectivity when it is applied to homology<br />
models. To investigate this, we start with <strong>PDZ</strong>s whose<br />
structures are not available, yet binding selectivities are<br />
studied by Stiffler et al. 77 The list <strong>of</strong> proteins modeled is<br />
given in Table III along with their sequence similarities<br />
with the known <strong>PDZ</strong> structures. As case studies, we display<br />
the color-coded homology structures <strong>of</strong> Class I in<br />
Figure 4(A) <strong>and</strong> Class II <strong>PDZ</strong>s in Figure 4(B). Here, red<br />
<strong>and</strong> blue distinguish the highest <strong>and</strong> lowest flexibility<br />
Dynamics <strong>of</strong> <strong>PDZ</strong> Domain Interactions<br />
Figure 3<br />
Common motion characteristics <strong>of</strong> Class I <strong>and</strong> Class II type <strong>PDZ</strong> <strong>domain</strong> interactions obtained by singular value decomposition <strong>of</strong> the fluctuation<br />
pr<strong>of</strong>ile matrix. (A) The shape <strong>of</strong> the corresponding representative first SVD vector for Class I type <strong>and</strong> Class II type <strong>PDZ</strong> <strong>domain</strong> proteins.<br />
Sequence alignment includes only bA-bB loop, bB str<strong>and</strong>, bB-bC loop, <strong>and</strong> aB helix that are crucial regions for peptide binding. The first SVD<br />
vector shows the common fluctuation <strong>of</strong> <strong>PDZ</strong> <strong>domain</strong>s irrespective <strong>of</strong> their binding <strong>specificity</strong>. Therefore, Class I type <strong>and</strong> Class II type <strong>PDZ</strong><br />
<strong>domain</strong> proteins show similar fluctuation pr<strong>of</strong>ile. (B) The second SVD vector shows different mobilities between the Class I <strong>and</strong> Class II type <strong>PDZ</strong><br />
<strong>domain</strong> proteins. The dynamics <strong>of</strong> bA-bB <strong>and</strong> bB-bC loops are more critical in Class I type binding interaction whereas bB-bC loop <strong>and</strong> aB-helix<br />
becomes critical in Class II type <strong>PDZ</strong> <strong>domain</strong> proteins.<br />
regions, respectively. The figures illustrate that the fluctuation<br />
pr<strong>of</strong>ile <strong>of</strong> Class I homolog structures exhibit the<br />
common binding induced fluctuation pr<strong>of</strong>ile <strong>of</strong> Class I<br />
type <strong>PDZ</strong>s where the bA-bB <strong>and</strong>bB-bC loops are the<br />
most mobile regions. Likewise, the high amplitude fluctuation<br />
pr<strong>of</strong>iles <strong>of</strong> aB-helix <strong>and</strong> bB-bC loop in Class II<br />
homolog proteins confirm that they also possess the<br />
common fluctuation characteristics <strong>of</strong> Class II type.<br />
Overall, these findings indicate that: (i) s-GNM can<br />
easily be applied to homology models (i.e., sequences<br />
with at least 50% sequence similarity to compute binding<br />
induced fluctuation pr<strong>of</strong>iles), <strong>and</strong> (ii) the binding<br />
induced fluctuation pr<strong>of</strong>iles <strong>of</strong> homolog models may be<br />
used to discriminate their binding selectivity. These<br />
results show the potential power <strong>of</strong> s-GNM. However,<br />
one should be careful with cases showing dual <strong>specificity</strong><br />
<strong>and</strong> low sequence similarity to a structural template.<br />
PROTEINS 805
Table III<br />
List <strong>of</strong> Homolog Structures Analyzed. The Number <strong>of</strong> Interactions with the Peptide was Determined Using Fluorescence Polarization (FP)<br />
Obtained from the Stiffler et al. 77 study<br />
Class Protein<br />
Number <strong>of</strong><br />
interactions<br />
Class I<br />
peptide<br />
s-GNM analysis on mutated proteins<br />
<strong>of</strong> <strong>PDZ</strong> <strong>domain</strong>s<br />
Class II<br />
peptide<br />
We further investigated our results by examining the<br />
dynamics <strong>of</strong> the wild type <strong>and</strong> mutant structures <strong>of</strong> PICK1.<br />
The binding characteristics <strong>of</strong> wild-type PICK1 <strong>and</strong> PICK1<br />
carrying various <strong>PDZ</strong> <strong>domain</strong> mutations have been reported<br />
previously; the wild type <strong>of</strong> PICK1 can bind both Class I<br />
(PKCa) <strong>and</strong> Class II (GluR2) type peptides. 107,109,112<br />
Staudinger et al. 109 mutated lysine 27 (K27) alone or<br />
together with aspartic acid 28 (D28) to alanine to test the<br />
importance <strong>of</strong> carboxylate-binding loop <strong>of</strong> PICK1. Mutation<br />
<strong>of</strong> K27 together with the nearby D28 completely<br />
disrupted interaction with both GluR2 <strong>and</strong> PKCa. Furthermore,<br />
the experimental study <strong>of</strong> Dev et al. 112 has shown<br />
that mutating lysine 27 to glutamic acid, a point mutation<br />
on the bA-bB loop, changes the binding selectivity <strong>of</strong><br />
PICK1 to exhibit only Class I behavior. Another mutation<br />
study that replaces the residue in aB helix (lysine 83 to<br />
histidine) by Madsen et al. 107 showed that the preference <strong>of</strong><br />
PICK1 reverts to that <strong>of</strong> a Class I motif.<br />
The wild type we studied is a crystal structure complex<br />
with Class II type peptide. We analyzed the dynamics <strong>of</strong><br />
this structure with s-GNM. Figure 5(A) shows the ribbon<br />
diagram <strong>of</strong> wild type PICK1 <strong>and</strong> is colored with respect<br />
to the fluctuation pr<strong>of</strong>ile using a spectrum <strong>of</strong> blue, green,<br />
orange, <strong>and</strong> red based on the increasing order <strong>of</strong> mobility.<br />
The most mobile region <strong>of</strong> wild type PICK1 is the<br />
bB-bC loop. This observation agrees with the dual binding<br />
<strong>specificity</strong> <strong>of</strong> PICK1 (i.e., both Class I <strong>and</strong> Class II<br />
Class III<br />
peptide<br />
Neither class I, class II<br />
or class III peptides<br />
Modeller best template %<br />
sequence similarity<br />
I Magi3-pdz5 25 25 65.8 1<br />
I b1-syntrophin 15 15 82.5 4<br />
I g2-syntrophin 4 4 55 2<br />
I Lrcc7 3 3 73.5 4<br />
I Shroom 3 3 58.7 2<br />
I SemCap3-<strong>PDZ</strong>1 7 7 96.6 2<br />
I Scrb1-<strong>PDZ</strong>2 3 3 92.8 1<br />
I Chapsyn110-<strong>PDZ</strong>2 18 18 98.8 1<br />
I Magi3-<strong>PDZ</strong>1 18 16 2 76.3 4<br />
I Cipp-<strong>PDZ</strong>8 10 8 1 1 97.5 3<br />
I Par6B 2 2 98.9 1<br />
I Magi2-<strong>PDZ</strong>5 2 2 98.9 4<br />
I Erbin-<strong>PDZ</strong>1 2 2 96.5 5<br />
I ZO2-<strong>PDZ</strong>1 a<br />
13 1 8 4 93 1<br />
I Interleukin16 5 4 1 52.4 5<br />
I Mals2 12 12 98.8 3<br />
II Tiam-1 b<br />
1 91 2<br />
II Pdzk3-<strong>PDZ</strong>2 2 2 54.2 2<br />
II Mupp1-<strong>PDZ</strong>11 2 1 1 95 4<br />
II Cipp-<strong>PDZ</strong>9 8 6 2 69.6 2<br />
We classified number <strong>of</strong> interactions as a Class I, Class II, Class III, <strong>and</strong> none <strong>of</strong> typical Class I, II, or III peptides.<br />
a In the study <strong>of</strong> Fujii et al., 78 ZO2-<strong>PDZ</strong>1 is defined as class I <strong>PDZ</strong> <strong>domain</strong>.<br />
b Tiam-1 was not included FP analysis in science paper but it is known that it binds to class II type peptides. 2,79<br />
806 PROTEINS<br />
Z.N. Gerek et al.<br />
type <strong>of</strong> binding) because the mobility <strong>of</strong> the bB- bC<br />
loop plays an important role in both classes. Interestingly,<br />
when we apply s-GNM to the point mutated<br />
(K27E <strong>and</strong> K83H) <strong>and</strong> energy-minimized structure, we<br />
observe the signatures <strong>of</strong> Class I type <strong>of</strong> binding dynamics,<br />
where both the bA-bB <strong>and</strong> bB-bC loops become<br />
equally mobile [See Fig. 5(B,C) for ribbon diagrams <strong>of</strong><br />
mutated structures (K27E) <strong>and</strong> (K83H), respectively]. We<br />
also applied linear discriminant analysis as explained in<br />
the following section to predict the mutant PICK1<br />
preference. The analysis predicts that the mutant PICK<br />
prefers Class I type <strong>of</strong> binding with a probability <strong>of</strong> 0.82.<br />
Linear discriminant analysis as a<br />
prediction tool<br />
s-GNM<br />
mode<br />
By linear discriminant analysis, we found that <strong>PDZ</strong>s<br />
showing Class I, Class II, <strong>and</strong> dual <strong>specificity</strong> (i.e., both<br />
Class I <strong>and</strong> Class II) can be predicted with an accuracy<br />
<strong>of</strong> 81% based on the fluctuation pr<strong>of</strong>iles. (We applied<br />
10-fold cross validation where 90% <strong>of</strong> the data was r<strong>and</strong>omly<br />
selected as training set <strong>and</strong> the leftover 10% was<br />
used as the test case to predict the binding specificities<br />
based on singular values <strong>of</strong> fluctuation pr<strong>of</strong>iles. The average<br />
<strong>of</strong> 10 trials with this approach gives an accuracy <strong>of</strong><br />
86%.) This prediction tool enables us to suggest mutations<br />
that could change a <strong>PDZ</strong> <strong>domain</strong> from Class I to<br />
Class II or vice versa. The histidine at the first residue <strong>of</strong><br />
the aB helix is a conserved residue in Class I <strong>PDZ</strong>
<strong>domain</strong>s <strong>and</strong> is thought to bind threonine or serine in<br />
the binding motif. 113 Agreed with this observation, this<br />
analysis has shown that mutation <strong>of</strong> the first residue in<br />
aB helix (Asp 25 to His) <strong>of</strong> Syntenin that has affinity for<br />
both classes could change its <strong>specificity</strong> to Class I type<br />
binding. We also tested various mutations in bA-bB loop<br />
(from residues 203 through 209) <strong>and</strong> our predictor tool<br />
did not change the <strong>specificity</strong> towards either Class I or<br />
Class II <strong>and</strong> it stays as dual <strong>specificity</strong>. Agreed with our<br />
prediction, Grootjans et al. 104 has also shown experimentally<br />
that K203A mutation in bA-bB loop decreases<br />
Dynamics <strong>of</strong> <strong>PDZ</strong> Domain Interactions<br />
Figure 4<br />
The ribbon diagrams <strong>of</strong> Class I (A) <strong>and</strong> Class II (B) homology models colored with respect to the fluctuation pr<strong>of</strong>iles obtained by s-GNM. The<br />
most mobile regions are red whereas the least mobile ones are shown in blue within a color spectrum <strong>of</strong> red, orange, yellow, green, cyan, <strong>and</strong> blue.<br />
The fluctuation pr<strong>of</strong>iles <strong>of</strong> Class I homolog structures exhibit the common binding induced fluctuation pr<strong>of</strong>ile <strong>of</strong> Class I type <strong>PDZ</strong> proteins where<br />
bA-bB <strong>and</strong> bB-bC loops are the most mobile regions. Likewise, the high amplitude fluctuation pr<strong>of</strong>iles <strong>of</strong> aB-helix <strong>and</strong> bB-bC loop in Class II<br />
homolog proteins confirm that they also exhibit the common fluctuation characteristics <strong>of</strong> Class II type <strong>PDZ</strong> <strong>domain</strong> proteins.<br />
the binding <strong>of</strong> Class II peptide preference but does not<br />
terminate the Class I type preference. They also studied<br />
the mutation <strong>of</strong> the first residue in aB helix <strong>and</strong><br />
observed that mutation abolishes the interaction between<br />
the protein <strong>and</strong> Class II type <strong>of</strong> peptide as we also<br />
predicted in our analysis. Furthermore, we investigated<br />
the binding selectivites <strong>of</strong> Tiam-1 (91% sequence similarity<br />
as a homolog structure) that binds to class II peptide<br />
when the first residue (Ser 64) in aB helix is mutated to<br />
His, <strong>and</strong> our prediction tool indicates that Mutant<br />
Tiam-1 might bind to both Class I <strong>and</strong> Class II type <strong>of</strong><br />
PROTEINS 807
Figure 5<br />
The comparison <strong>of</strong> the ribbon diagrams corresponding to fluctuation pr<strong>of</strong>iles <strong>of</strong> (A) wild type PICK1 (PDB: 2gzv), (B) mutated structure (K27E)<br />
<strong>of</strong> PICK1, <strong>and</strong> (C) mutated structure (K83H) <strong>of</strong> PICK1 colored with respect to their fluctuation pr<strong>of</strong>iles: The spectrum <strong>of</strong> dark blue, green, orange,<br />
<strong>and</strong> red in ribbon diagrams represents the increasing order <strong>of</strong> mobility. The most mobile region <strong>of</strong> wild type PICK1 is bB-bC loop, whereas both<br />
bA-bB loop <strong>and</strong> bB-bC loop become equally mobile in mutated structure <strong>of</strong> PICK1 which is a signature <strong>of</strong> Class I type binding dynamics.<br />
peptides. In summary, linear discriminant analysis gives<br />
us a new tool to make prediction about <strong>PDZ</strong>s’ binding<br />
specificities upon mutation.<br />
CONCLUSIONS<br />
The potential application range <strong>of</strong> our new elastic network<br />
model, s-GNM, with a set <strong>of</strong> <strong>PDZ</strong>s has been demonstrated<br />
in this work. We are able to determine fluctuation<br />
pr<strong>of</strong>iles responsible for binding to different type <strong>of</strong><br />
peptides with the new approach. Further, the general<br />
applicability <strong>of</strong> this method <strong>and</strong> the validity <strong>of</strong> optimized<br />
parameter sets are tested with a comprehensive data set<br />
including homology models <strong>of</strong> <strong>PDZ</strong>s.<br />
Using singular value decomposition method, we clustered<br />
the binding induced fluctuation pr<strong>of</strong>iles obtained<br />
from s-GNM analysis. Our results show that: (i) the dynamics<br />
<strong>of</strong> <strong>PDZ</strong>s play an important role in their binding selectivity<br />
as also shown by other studies, 30–33,37,39 (ii)<br />
using s-GNM, we identify the structural regions critical for<br />
binding <strong>of</strong> Class I <strong>and</strong> Class II peptides, (iii) s-GNM has<br />
potential to capture the changes in binding selectivity due<br />
808 PROTEINS<br />
Z.N. Gerek et al.<br />
to mutations as in the case <strong>of</strong> PICK1, where the comparison<br />
<strong>of</strong> the binding induced dynamics shows the shift from<br />
Class II to Class I type common fluctuation pr<strong>of</strong>ile upon<br />
mutations, in agreement with experimental observation,<br />
(iv) s-GNM can be easily <strong>and</strong> successfully applied to<br />
homology models <strong>of</strong> <strong>PDZ</strong>s. These are very important steps<br />
to develop a quantitative tool to alter the binding selectivity<br />
<strong>of</strong> <strong>PDZ</strong> <strong>domain</strong>s upon mutations <strong>and</strong> can be used to knock<br />
out <strong>PDZ</strong>-<strong>domain</strong> interactions for therapeutic interests.<br />
ACKNOWLEDGMENTS<br />
We gratefully acknowledge Dr. Kingshuk Ghosh, Dr.<br />
M. Scott Shell, Dr. Bosco Ho <strong>and</strong> Art Cerda for their valuable<br />
comments <strong>and</strong> ASU Fulton School <strong>of</strong> Engineering<br />
HPC for the computer time. O.K. is supported by<br />
TUBA-Distinguished Young Investigator Award.<br />
REFERENCES<br />
1. Fan JS, Zhang M. Signaling complex organization by <strong>PDZ</strong> <strong>domain</strong><br />
proteins. Neurosignals 2002;11:315–321.<br />
2. Nourry C, Grant SG, Borg JP. <strong>PDZ</strong> <strong>domain</strong> proteins: plug <strong>and</strong><br />
play! Sci STKE 2003;2003:RE7.
3. Hung AY, Sheng M. <strong>PDZ</strong> <strong>domain</strong>s: structural modules for protein<br />
complex assembly. J Biol Chem 2002;277:5699–5702.<br />
4. van Ham M, Hendriks W. <strong>PDZ</strong> <strong>domain</strong>s-glue <strong>and</strong> guide. Mol Biol<br />
Rep 2003;30:69–82.<br />
5. Appleton BA, Zhang Y, Wu P, Yin JP, Hunziker W, Skelton NJ,<br />
Sidhu SS, Wiesmann C. Comparative structural analysis <strong>of</strong> the<br />
Erbin <strong>PDZ</strong> <strong>domain</strong> <strong>and</strong> the first <strong>PDZ</strong> <strong>domain</strong> <strong>of</strong> ZO-1. Insights<br />
into determinants <strong>of</strong> <strong>PDZ</strong> <strong>domain</strong> <strong>specificity</strong>. J Biol Chem<br />
2006;281:22312–22320.<br />
6. Birrane G, Chung J, Ladias JA. Novel mode <strong>of</strong> lig<strong>and</strong> recognition<br />
by the Erbin <strong>PDZ</strong> <strong>domain</strong>. J Biol Chem 2003;278:1399–1402.<br />
7. Chen Q, Niu X, Xu Y, Wu J, Shi Y. Solution structure <strong>and</strong> backbone<br />
dynamics <strong>of</strong> the AF-6 <strong>PDZ</strong> <strong>domain</strong>/Bcr peptide complex.<br />
Protein Sci 2007;16:1053–1062.<br />
8. Daniels DL, Cohen AR, Anderson JM, Brunger AT. Crystal structure<br />
<strong>of</strong> the hCASK <strong>PDZ</strong> <strong>domain</strong> reveals the structural basis <strong>of</strong> class<br />
II <strong>PDZ</strong> <strong>domain</strong> target recognition. Nat Struct Biol 1998;5:317–325.<br />
9. Dev KK. <strong>PDZ</strong> <strong>domain</strong> protein-protein interactions: a case study<br />
with PICK1. Curr Top Med Chem 2007;7:3–20.<br />
10. Elkins JM, Papagrigoriou E, Berridge G, Yang X, Phillips C, Gileadi<br />
C, Savitsky P, Doyle DA. Structure <strong>of</strong> PICK1 <strong>and</strong> other <strong>PDZ</strong><br />
<strong>domain</strong>s obtained with the help <strong>of</strong> self-binding C-terminal<br />
extensions. Protein Sci 2007;16:683–694.<br />
11. Harris BZ, Lim WA. Mechanism <strong>and</strong> role <strong>of</strong> <strong>PDZ</strong> <strong>domain</strong>s in signaling<br />
complex assembly. J Cell Sci 2001;114(Part 18):3219–3231.<br />
12. Hillier BJ, Christopherson KS, Prehoda KE, Bredt DS, Lim WA.<br />
Unexpected modes <strong>of</strong> <strong>PDZ</strong> <strong>domain</strong> scaffolding revealed by structure<br />
<strong>of</strong> nNOS-syntrophin complex. Science 1999;284:812–815.<br />
13. Im YJ, Lee JH, Park SH, Park SJ, Rho SH, Kang GB, Kim E, Eom<br />
SH. Crystal structure <strong>of</strong> the Shank <strong>PDZ</strong>-lig<strong>and</strong> complex reveals a<br />
class I <strong>PDZ</strong> interaction <strong>and</strong> a novel <strong>PDZ</strong>-<strong>PDZ</strong> dimerization. J Biol<br />
Chem 2003;278:48099–48104.<br />
14. Im YJ, Park SH, Rho SH, Lee JH, Kang GB, Sheng M, Kim E,<br />
Eom SH. Crystal structure <strong>of</strong> GRIP1 <strong>PDZ</strong>6-peptide complex<br />
reveals the structural basis for class II <strong>PDZ</strong> target recognition <strong>and</strong><br />
<strong>PDZ</strong> <strong>domain</strong>-mediated multimerization. J Biol Chem 2003;278:<br />
8501–8507.<br />
15. Kang BS, Cooper DR, Devedjiev Y, Derewenda U, Derewenda ZS.<br />
Molecular roots <strong>of</strong> degenerate <strong>specificity</strong> in syntenin’s <strong>PDZ</strong>2<br />
<strong>domain</strong>: reassessment <strong>of</strong> the <strong>PDZ</strong> recognition paradigm. Structure<br />
2003;11:845–853.<br />
16. Karthikeyan S, Leung T, Birrane G, Webster G, Ladias JA. Crystal<br />
structure <strong>of</strong> the <strong>PDZ</strong>1 <strong>domain</strong> <strong>of</strong> human Na(1)/H(1) exchanger<br />
regulatory factor provides insights into the mechanism <strong>of</strong> carboxyl-terminal<br />
leucine recognition by class I <strong>PDZ</strong> <strong>domain</strong>s. J Mol<br />
Biol 2001;308:963–973.<br />
17. Karthikeyan S, Leung T, Ladias JA. Structural determinants <strong>of</strong> the<br />
Na1/H1 exchanger regulatory factor interaction with the beta 2<br />
adrenergic <strong>and</strong> platelet-derived growth factor receptors. J Biol<br />
Chem 2002;277:18973–18978.<br />
18. Laura RP, Witt AS, Held HA, Gerstner R, Deshayes K, Koehler MF,<br />
Kosik KS, Sidhu SS, Lasky LA. The Erbin <strong>PDZ</strong> <strong>domain</strong> binds with<br />
high affinity <strong>and</strong> <strong>specificity</strong> to the carboxyl termini <strong>of</strong> delta-catenin<br />
<strong>and</strong> ARVCF. J Biol Chem 2002;277:12906–12914.<br />
19. Sallee NA, Yeh BJ, Lim WA. Engineering modular protein interaction<br />
switches by sequence overlap. J Am Chem Soc 2007;129:4606–4611.<br />
20. Tochio H, Hung F, Li M, Bredt DS, Zhang M. Solution structure<br />
<strong>and</strong> backbone dynamics <strong>of</strong> the second <strong>PDZ</strong> <strong>domain</strong> <strong>of</strong> postsynaptic<br />
density-95. J Mol Biol 2000;295:225–237.<br />
21. Lockless SW, Ranganathan R. Evolutionarily conserved pathways <strong>of</strong><br />
energetic connectivity in protein families. Science 1999;286:295–<br />
299.<br />
22. Zimmermann P. The prevalence <strong>and</strong> significance <strong>of</strong> <strong>PDZ</strong> <strong>domain</strong>phophoinositide<br />
interactions. Biochim Biophys Acta 2006;1761:<br />
947–956.<br />
23. Zimmermann P, Meerschaert K, Reekmans G, Leenaerts I, Small<br />
JV, V<strong>and</strong>ekerckhove J, David G, Gettemans J. PIP2-<strong>PDZ</strong> <strong>domain</strong><br />
Dynamics <strong>of</strong> <strong>PDZ</strong> Domain Interactions<br />
binding controls the association <strong>of</strong> syntenin with the plasma membrane.<br />
Mol Cell 2002;9:1215–1225.<br />
24. DeLano WL. The PyMOL Molecular Graphics System. Palo Alto,<br />
CA: DeLano Scientific; 2002 (http://www.pymol.org).<br />
25. Songyang Z, Fanning AS, Fu C, Xu J, Marfatia SM, Chishti AH,<br />
Crompton A, Chan AC, Anderson JM, Cantley LC. Recognition <strong>of</strong><br />
unique carboxyl-terminal motifs by distinct <strong>PDZ</strong> <strong>domain</strong>s. Science<br />
1997;275:73–77.<br />
26. Bezprozvanny I, Maximov A. Classification <strong>of</strong> <strong>PDZ</strong> <strong>domain</strong>s. FEBS<br />
Lett 2001;509:457–462.<br />
27. Kurakin A, Swistowski A, Wu SC, Bredesen DE. The <strong>PDZ</strong> <strong>domain</strong><br />
as a complex adaptive system. Plos Comput Biol 2007;2:e953.<br />
28. Vaccaro P, Dente L. <strong>PDZ</strong> <strong>domain</strong>s: troubles in classification. FEBS<br />
Lett 2002;512:345–346.<br />
29. Fuentes EJ, Der CJ, Lee AL. Lig<strong>and</strong>-dependent dynamics <strong>and</strong> intramolecular<br />
signaling in a <strong>PDZ</strong> <strong>domain</strong>. J Mol Biol 2004;335:1105–<br />
1115.<br />
30. Basdevant N, Weinstein H, Ceruso M. Thermodynamic basis for<br />
<strong>promiscuity</strong> <strong>and</strong> selectivity in protein-protein interactions: <strong>PDZ</strong><br />
<strong>domain</strong>s, a case study. J Am Chem Soc 2006;128:12766–12777.<br />
31. Cecconi F, Rios PDL, Piazza F. Diffusion-limited unbinding <strong>of</strong><br />
small peptides from <strong>PDZ</strong> <strong>domain</strong>s. J Phys Chem B 2007;111:<br />
11057–11063.<br />
32. De Los Rios P, Cecconi F, Pretre A, Dietler G, Michielin O, Piazza<br />
F, Juanico B. Functional dynamics <strong>of</strong> <strong>PDZ</strong> binding <strong>domain</strong>s: a normal-mode<br />
analysis. Biophys J 2005;89:14–21.<br />
33. Dhulesia A, Gsponer J, Vendruscolo M. Mapping <strong>of</strong> two networks<br />
<strong>of</strong> residues that exhibit structural <strong>and</strong> dynamical changes upon<br />
binding in a <strong>PDZ</strong> <strong>domain</strong> protein. J Am Chem Soc 2008;130:<br />
8931–8939.<br />
34. Giallourakis C, Cao Z, Green T, Wachtel H, Xie X, Lopez-Illasaca<br />
M, Daly M, Rioux J, Xavier R. A molecular-properties-based<br />
approach to underst<strong>and</strong>ing <strong>PDZ</strong> <strong>domain</strong> proteins <strong>and</strong> <strong>PDZ</strong><br />
lig<strong>and</strong>s. Genome Res 2006;16:1056–1072.<br />
35. Kempkens O, Medina E, Fern<strong>and</strong>ez-Ballester G, Ozuyaman S, Le<br />
Bivic A, Serrano L, Knust E. Computer modelling in combination<br />
with in vitro studies reveals similar binding affinities <strong>of</strong> Drosophila<br />
Crumbs for the <strong>PDZ</strong> <strong>domain</strong>s <strong>of</strong> Stardust <strong>and</strong> DmPar-6. Eur J Cell<br />
Biol 2006;85:753–767.<br />
36. Niv MY, Weinstein H. A flexible docking procedure for the exploration<br />
<strong>of</strong> peptide binding selectivity to known structures <strong>and</strong> homology<br />
models <strong>of</strong> <strong>PDZ</strong> <strong>domain</strong>s. J Am Chem Soc 2005;127:14072–14079.<br />
37. Ota N, Agard DA. Intramolecular signaling pathways revealed by<br />
modeling anisotropic thermal diffusion. J Mol Biol 2005;351:345–<br />
354.<br />
38. Reina J, Lacroix E, Hobson SD, Fern<strong>and</strong>ez-Ballester G, Rybin V,<br />
Schwab MS, Serrano L, Gonzalez C. Computer-aided design <strong>of</strong> a<br />
<strong>PDZ</strong> <strong>domain</strong> to recognize new target sequences. Nat Struct Biol<br />
2002;9:621–627.<br />
39. Sharp K, Skinner JJ. Pump-probe molecular dynamics as a tool for<br />
studying protein motion <strong>and</strong> long range coupling. Proteins 2006;<br />
65:347–361.<br />
40. Tang C, Schwieters CD, Clore GM. Open-to-closed transition in<br />
apo maltose-binding protein observed by paramagnetic NMR.<br />
Nature 2007;449:1078–1082.<br />
41. Eisenmesser EZ, Millet O, Labeikovsky W, Korzhnev DM, Wolf-<br />
Watz M, Bosco DA, Skalicky JJ, Kay LE, Kern D. Intrinsic dynamics<br />
<strong>of</strong> an enzyme underlies catalysis. Nature 2005;438:117–121.<br />
42. Volkman BF, Lipson D, Wemmer DE, Kern D. Two-state allosteric<br />
behavior in a single-<strong>domain</strong> signaling protein. Science 2001;291:<br />
2429–2433.<br />
43. Atilgan AR, Durell SR, Jernigan RL, Demirel MC, Keskin O, Bahar<br />
I. Anisotropy <strong>of</strong> fluctuation dynamics <strong>of</strong> proteins with an elastic<br />
network model. Biophys J 2001;80:505–515.<br />
44. Bahar I, Atilgan AR, Demirel MC, Erman B. Vibrational dynamics<br />
<strong>of</strong> folded proteins: significance <strong>of</strong> slow <strong>and</strong> fast motions in relation<br />
to function <strong>and</strong> stability. Phys Rev Lett 1998;80:2733–2736.<br />
PROTEINS 809
45. Bahar I, Atilgan AR, Erman B. Direct evaluation <strong>of</strong> thermal fluctuations<br />
in proteins using a single-parameter harmonic potential.<br />
Fold Des 1997;2:173–181.<br />
46. Keskin O, Bahar I, Flatow D, Covell DG, Jernigan RL. Molecular<br />
mechanisms <strong>of</strong> chaperonin GroEL-GroES function. Biochemistry<br />
2002;41:491–501.<br />
47. Keskin O, Jernigan RL, Bahar I. Proteins with similar architecture<br />
exhibit similar large-scale dynamic behavior. Biophys J 2000;78:<br />
2093–2106.<br />
48. Kondrashov DA, Cui Q, Phillips GN, Jr. Optimization <strong>and</strong> evaluation<br />
<strong>of</strong> a coarse-grained model <strong>of</strong> protein motion using x-ray crystal<br />
data. Biophys J 2006;91:2760–2767.<br />
49. Rader AJ, Vlad DH, Bahar I. Maturation dynamics <strong>of</strong> bacteriophage<br />
HK97 capsid. Structure 2005;13:413–421.<br />
50. Sen TZ, Feng Y, Garcia JV, Kloczkowski A, Jernigan RL. The extent<br />
<strong>of</strong> cooperativity <strong>of</strong> protein motions observed with elastic network<br />
models is similar for atomic <strong>and</strong> coarser-grained models. J Chem<br />
Theory Comput 2006;2:696–704.<br />
51. Sen TZ, Jernigan RL. Optimizing cut<strong>of</strong>f distances <strong>and</strong> spring constants<br />
for the Gaussian Network Model <strong>of</strong> ATP-binding proteins.<br />
In: Cui IBaQ, editor. Normal mode analysis: theory <strong>and</strong> applications<br />
to biological <strong>and</strong> chemical systems. Boca Raton: Chapman<br />
<strong>and</strong> Hall/CRC; 2006. pp 171–186.<br />
52. Tama F, Brooks CL. The mechanism <strong>and</strong> pathway <strong>of</strong> pH induced<br />
swelling in cowpea chlorotic mottle virus. J Mol Biol 2002;318:<br />
733–747.<br />
53. Tama F, Brooks CL. Diversity <strong>and</strong> identity <strong>of</strong> mechanical properties<br />
<strong>of</strong> icosahedral viral capsids studied with elastic network normal<br />
mode analysis. J Mol Biol 2005;345:299–314.<br />
54. Delarue M, Sanejou<strong>and</strong> YH. Simplified normal mode analysis <strong>of</strong><br />
conformational transitions in DNA-dependent polymerases: the<br />
elastic network model. J Mol Biol 2002;320:1011–1024.<br />
55. Ikeguchi M, Ueno J, Sato M, Kidera A. Protein structural change<br />
upon lig<strong>and</strong> binding: linear response theory. Phys Rev Lett 2005;<br />
94:078102.<br />
56. Keskin O. Binding induced conformational changes <strong>of</strong> proteins<br />
correlate with their intrinsic fluctuations. BMC Struct Biol 2007;<br />
7:31.<br />
57. Kundu S, Jernigan RL. Molecular mechanism <strong>of</strong> <strong>domain</strong> swapping<br />
in proteins: an analysis <strong>of</strong> slower motions. Biophys J 2004;86:<br />
3846–3854.<br />
58. Tama F, Sanejou<strong>and</strong> YH. Conformational change <strong>of</strong> proteins arising<br />
from normal mode calculations. Protein Eng 2001;14:1–6.<br />
59. Tobi D, Bahar I. Structural changes involved in protein binding<br />
correlate with intrinsic motions <strong>of</strong> proteins in the unbound state.<br />
Proc Natl Acad Sci USA 2005;102:18908–18913.<br />
60. Zheng W, Brooks BR. Normal-modes-based prediction <strong>of</strong> protein<br />
conformational changes guided by distance constraints. Biophys J<br />
2005;88:3109–3117.<br />
61. Demirel MC, Atilgan AR, Jernigan RL, Erman B, Bahar I. <strong>Identification</strong><br />
<strong>of</strong> kinetically hot residues in proteins. Protein Sci 1998;<br />
7:2522–2532.<br />
62. Haliloglu T, Keskin O, Ma B, Nussinov R. How similar are protein<br />
folding <strong>and</strong> protein binding nuclei? Examination <strong>of</strong> vibrational<br />
motions <strong>of</strong> energy hot spots <strong>and</strong> conserved residues. Biophys J<br />
2005;88:1552–1559.<br />
63. Haliloglu T, Seyrek E, Erman B. Prediction <strong>of</strong> binding sites in<br />
receptor-lig<strong>and</strong> complexes with the Gaussian Network Model. Phys<br />
Rev Lett 2008;100:228102.<br />
64. Rader AJ, Anderson G, Isin B, Khorana HG, Bahar I, Klein-<br />
Seetharaman J. <strong>Identification</strong> <strong>of</strong> core amino acids stabilizing<br />
rhodopsin. Proc Natl Acad Sci USA 2004;101:7246–7251.<br />
65. Lu Q, Sun EE, Klein RS, Flanagan JG. Ephrin-B reverse signaling<br />
is mediated by a novel <strong>PDZ</strong>-RGS protein <strong>and</strong> selectively inhibits G<br />
protein-coupled chemoattraction. Cell 2001;105:69–79.<br />
66. Long JF, Feng W, Wang R, Chan LN, Ip FC, Xia J, Ip NY, Zhang<br />
M. Autoinhibition <strong>of</strong> X11/Mint scaffold proteins revealed by the<br />
810 PROTEINS<br />
Z.N. Gerek et al.<br />
closed conformation <strong>of</strong> the <strong>PDZ</strong> t<strong>and</strong>em. Nat Struct Mol Biol<br />
2005;12:722–728.<br />
67. Berman HM, Westbrook J, Feng Z, Gillil<strong>and</strong> G, Bhat TN, Weissig<br />
H, Shindyalov IN, Bourne PE. The protein data bank. Nucleic<br />
Acids Res 2000;28:235–242.<br />
68. Brooks BR, Bruccoleri RE, Olafson BD, States DJ, Swaminathan S,<br />
Karplus M. Charmm—a Program for macromolecular energy.<br />
Minimization, <strong>and</strong> dynamics calculations J Comput Chem<br />
1983;4:187–217.<br />
69. Masunov A, Lazaridis T. Potentials <strong>of</strong> mean force between ionizable<br />
amino acid side chains in water. J Am Chem Soc 2003;<br />
125:1722–1730.<br />
70. Brooks B, Karplus M. Harmonic dynamics <strong>of</strong> proteins: normal<br />
modes <strong>and</strong> fluctuations in bovine pancreatic trypsin inhibitor.<br />
Proc Natl Acad Sci USA 1983;80:6571–6575.<br />
71. Tirion MM. Large amplitude elastic motions in proteins from a<br />
single-parameter, atomic analysis. Phys Rev Lett 1996;77:1905–<br />
1908.<br />
72. Rader AJ, Chennubhotla C, Yang L-W, Bahar I. The Gaussian<br />
Network Model: theory <strong>and</strong> applications. In: Cui Q, Bahar I,<br />
editors. Normal mode analysis theory <strong>and</strong> applications to biological<br />
<strong>and</strong> chemical systems, Chapman <strong>and</strong> Hall/CRC Mathematical<br />
<strong>and</strong> Computational Biology Series, Taylor <strong>and</strong> Francis Group:<br />
Boca Raton; 2006. pp 41–64.<br />
73. Yang LW, Eyal E, Chennubhotla C, Jee J, Gronenborn AM, Bahar<br />
I. Insights into equilibrium dynamics <strong>of</strong> proteins from comparison<br />
<strong>of</strong> NMR <strong>and</strong> X-ray data with computational predictions. Structure<br />
2007;15:741–749.<br />
74. Tsodikov OV, Record MT, Jr, Sergeev YV. Novel computer program<br />
for fast exact calculation <strong>of</strong> accessible <strong>and</strong> molecular surface areas<br />
<strong>and</strong> average surface curvature. J Comput Chem 2002;23:600–609.<br />
75. Miyazawa S, Jernigan RL. Residue-residue potentials with a favorable<br />
contact pair term <strong>and</strong> an unfavorable high packing density<br />
term, for simulation <strong>and</strong> threading. J Mol Biol 1996;256:623–644.<br />
76. Thomas PD, Dill KA. An iterative method for extracting energylike<br />
quantities from protein structures. Proc Natl Acad Sci USA<br />
1996;93:11628–11633.<br />
77. Stiffler MA, Chen JR, Grantcharova VP, Lei Y, Fuchs D, Allen JE,<br />
Zaslavskaia LA, MacBeath G. <strong>PDZ</strong> <strong>domain</strong> binding selectivity is<br />
optimized across the mouse proteome. Science 2007;317:364–369.<br />
78. Fujii N, Shelat A, Hall RA, Guy RK. Design <strong>of</strong> a selective chemical<br />
probe for class I <strong>PDZ</strong> <strong>domain</strong>s. Bioorg Med Chem Lett 2007;<br />
17:546–548.<br />
79. Grootjans JJ, Zimmermann P, Reekmans G, Smets A, Degeest G,<br />
Durr J, David G. Syntenin, a <strong>PDZ</strong> protein that binds syndecan<br />
cytoplasmic <strong>domain</strong>s. Proc Natl Acad Sci USA 1997;94:13683–<br />
13688.<br />
80. Hinsen K. Structural flexibility in proteins: impact <strong>of</strong> the crystal<br />
environment. Bioinformatics 2008;24:521–528.<br />
81. Riccardi D, Cui Q, Phillips GN, Jr. Application <strong>of</strong> elastic network<br />
models to proteins in the crystalline state. Biophys J 2009;96:464–<br />
475.<br />
82. Soheilifard R, Makarov DE, Rodin GJ. Critical evaluation <strong>of</strong> simple<br />
network models <strong>of</strong> protein dynamics <strong>and</strong> their comparison with<br />
crystallographic B-factors. Phys Biol 2008;5:26008.<br />
83. Song G, Jernigan RL. vGNM: a better model for underst<strong>and</strong>ing the<br />
dynamics <strong>of</strong> proteins in crystals. J Mol Biol 2007;369:880–893.<br />
84. Isin B, Schulten K, Tajkhorshid E, Bahar I. Mechanism <strong>of</strong> signal<br />
propagation upon retinal isomerization: insights from molecular<br />
dynamics simulations <strong>of</strong> rhodopsin restrained by normal modes.<br />
Biophys J 2008;95:789–803.<br />
85. Maguid S, Fern<strong>and</strong>ez-Alberti S, Ferrelli L, Echave J. Exploring the<br />
common dynamics <strong>of</strong> homologous proteins. Application to the<br />
globin family. Biophys J 2005;89:3–13.<br />
86. Leo-Macias A, Lopez-Romero P, Lupyan D, Zerbino D, Ortiz AR.<br />
An analysis <strong>of</strong> core deformations in protein superfamilies. Biophys<br />
J 2005;88:1291–1299.
87. Chen SC, Bahar I. Mining frequent patterns in protein structures: a<br />
study <strong>of</strong> protease families. Bioinformatics 2004;20(Suppl 1):i77–i85.<br />
88. Yang LW, Bahar I. Coupling between catalytic site <strong>and</strong> collective<br />
dynamics: a requirement for mechanochemical activity <strong>of</strong> enzymes.<br />
Structure 2005;13:893–904.<br />
89. ClustalW, WWW Service at the European Bioinformatics (http://<br />
www.ebi.ac.uk/Tools/clustalw2).<br />
90. Thompson JD, Higgins DG, Gibson TJ. CLUSTAL W: improving<br />
the sensitivity <strong>of</strong> progressive multiple sequence alignment through<br />
sequence weighting, position-specific gap penalties <strong>and</strong> weight<br />
matrix choice. Nucleic Acids Res 1994;22:4673–4680.<br />
91. Bahar I, Atilgan AR, Jernigan RL, Erman B. Underst<strong>and</strong>ing the<br />
recognition <strong>of</strong> protein structural classes by amino acid composition.<br />
Proteins 1997;29:172–185.<br />
92. Keskin O, Bahar I, Jernigan RL, Beutler JA, Shoemaker RH, Sausville<br />
EA, Covell DG. Characterization <strong>of</strong> anticancer agents by their<br />
growth inhibitory activity <strong>and</strong> relationships to mechanism <strong>of</strong><br />
action <strong>and</strong> structure. Anticancer Drug Des 2000;15:79–98.<br />
93. Guex N, Peitsch MC. SWISS-MODEL <strong>and</strong> the Swiss-PdbViewer:<br />
an environment for comparative protein modeling. Electrophoresis<br />
1997;18:2714–2723.<br />
94. Case DA, Cheatham TE, III, Darden T, Gohlke H, Luo R, Merz KM,<br />
Jr, Onufriev A, Simmerling C, Wang B, Woods RJ. The amber biomolecular<br />
simulation programs. J Comput Chem 2005;26:1668–1688.<br />
95. Kollman PA, Dixon R, Cornell W, Vox T, Chipot C, Pohorille A.<br />
The development/application <strong>of</strong> a ‘‘Minimalist’’ organic/biochemical<br />
molecular mechanical force field using a combination <strong>of</strong> ab initio<br />
calculations <strong>and</strong> experimental data. In: van Gunsteren WF,<br />
Weiner PK, Wilkinson AJ, editors. Computer simulation <strong>of</strong> biomolecular<br />
systems theoretical <strong>and</strong> experimental applications. Boston:<br />
Kluwer; 1997. pp 83–96.<br />
96. Schultz J, Milpetz F, Bork P, Ponting CP. SMART, a simple modular<br />
architecture research tool: identification <strong>of</strong> signaling <strong>domain</strong>s.<br />
Proc Natl Acad Sci USA 1998;95:5857–5864.<br />
97. Bujnicki JM, El<strong>of</strong>sson A, Fischer D, Ryclewski L. Structure prediction<br />
meta server. Bioinformatics 2001;17:750–751.<br />
98. Ginalski K, El<strong>of</strong>sson A, Fischer D, Rychlewski L. 3D-Jury: a simple<br />
approach to improve protein structure predictions. Bioinformatics<br />
2003;19:1015–1018.<br />
99. Lambert C, Leonard N, De Bolle X, Depiereux E. ESyPred3D: prediction<br />
<strong>of</strong> proteins 3D structures. Bioinformatics 2002;18:1250–<br />
1256.<br />
100. Sali A, Blundell TL. Comparative protein modelling by satisfaction<br />
<strong>of</strong> spatial restraints. J Mol Biol 1993;234:779–815.<br />
Dynamics <strong>of</strong> <strong>PDZ</strong> Domain Interactions<br />
101. Shen MY, Sali A. Statistical potential for assessment <strong>and</strong> prediction<br />
<strong>of</strong> protein structures. Protein Sci 2006;15:2507–2524.<br />
102. Yang L, Song G, Jernigan RL. How well can we underst<strong>and</strong> largescale<br />
protein motions using normal modes <strong>of</strong> elastic network models?<br />
Biophys J 2007;93:920–929.<br />
103. Gianni S, Walma T, Arcovito A, Calosci N, Bellelli A, Engstrom A,<br />
Travaglini-Allocatelli C, Brunori M, Jemth P, Vuister GW. Demonstration<br />
<strong>of</strong> long-range interactions in a <strong>PDZ</strong> <strong>domain</strong> by NMR,<br />
kinetics, <strong>and</strong> protein engineering. Structure 2006;14:1801–1809.<br />
104. Grootjans JJ, Reekmans G, Ceulemans H, David G. Synteninsyndecan<br />
binding requires syndecan-synteny <strong>and</strong> the co-operation<br />
<strong>of</strong> both <strong>PDZ</strong> <strong>domain</strong>s <strong>of</strong> syntenin. J Biol Chem 2000;275:19933–<br />
19941.<br />
105. Harris BZ, Lau FW, Fujii N, Guy RK, Lim WA. Role <strong>of</strong> electrostatic<br />
interactions in <strong>PDZ</strong> <strong>domain</strong> lig<strong>and</strong> recognition. Biochemistry<br />
2003;42:2797–2805.<br />
106. Imamura F, Maeda S, Doi T, Fujiyoshi Y. Lig<strong>and</strong> binding <strong>of</strong> the<br />
second <strong>PDZ</strong> <strong>domain</strong> regulates clustering <strong>of</strong> PSD-95 with the Kv1.4<br />
potassium channel. J Biol Chem 2002;277:3640–3646.<br />
107. Madsen KL, Beuming T, Niv MY, Chang CW, Dev KK, Weinstein<br />
H, Gether U. Molecular determinants for the complex binding<br />
<strong>specificity</strong> <strong>of</strong> the <strong>PDZ</strong> <strong>domain</strong> in PICK1. J Biol Chem 2005;<br />
280:20539–20548.<br />
108. Nonaka M, Doi T, Fujiyoshi Y, Takemoto-Kimura S, Bito H. Essential<br />
contribution <strong>of</strong> the lig<strong>and</strong>-binding beta B/beta C loop <strong>of</strong><br />
<strong>PDZ</strong>1 <strong>and</strong> <strong>PDZ</strong>2 in the regulation <strong>of</strong> postsynaptic clustering, scaffolding,<br />
<strong>and</strong> localization <strong>of</strong> postsynaptic density-95. J Neurosci<br />
2006;26:763–774.<br />
109. Staudinger J, Lu J, Olson EN. Specific interaction <strong>of</strong> the <strong>PDZ</strong><br />
<strong>domain</strong> protein PICK1 with the COOH terminus <strong>of</strong> protein kinase<br />
C-alpha. J Biol Chem 1997;272:32019–32024.<br />
110. Wang L, Piserchio A, Mierke DF. Structural characterization <strong>of</strong> the<br />
intermolecular interactions <strong>of</strong> synapse-associated protein-97 with<br />
the NR2B subunit <strong>of</strong> N-methyl-D-aspartate receptors. J Biol Chem<br />
2005;280:26992–26996.<br />
111. Jaulin-Bastard F, Saito H, Le Bivic A, Ollendorff V, Marchetto S,<br />
Birnbaum D, Borg JP. The ERBB2/HER2 receptor differentially<br />
interacts with ERBIN <strong>and</strong> PICK1 PSD-95/DLG/ZO-1 <strong>domain</strong> proteins.<br />
J Biol Chem 2001;276:15256–15263.<br />
112. Dev KK, Nakanishi S, Henley JM. The <strong>PDZ</strong> <strong>domain</strong> <strong>of</strong> PICK1 differentially<br />
accepts protein kinase C-alpha <strong>and</strong> GluR2 as interacting<br />
lig<strong>and</strong>s. J Biol Chem 2004;279:41393–41397.<br />
113. Dev KK. Making protein interactions druggable: targeting <strong>PDZ</strong><br />
<strong>domain</strong>s. Nat Rev Drug Discov 2004;3:1047–1056.<br />
PROTEINS 811


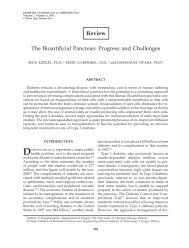
![]_[O](https://img.yumpu.com/10363126/1/190x138/-o.jpg?quality=85)