Rebirth of Water - 2017-2018
ACAP Saint John, Water Quality and Fish Communities Monitoring Report http://www.acapsj.org
ACAP Saint John, Water Quality and Fish Communities Monitoring Report
http://www.acapsj.org

You also want an ePaper? Increase the reach of your titles
YUMPU automatically turns print PDFs into web optimized ePapers that Google loves.
3.2 Hazen Creek <strong>Water</strong>shed<br />
3.2.1 <strong>Water</strong> Quality Monitoring<br />
The water quality <strong>of</strong> Hazen Creek was determined through monitoring a downstream site (site 6)<br />
and an upstream site (site 7) over six timepoints in the <strong>2017</strong> field season. The average from that<br />
sampling can be found in Table 3.2.3.A and the standard deviation in Table 3.2.3.B.<br />
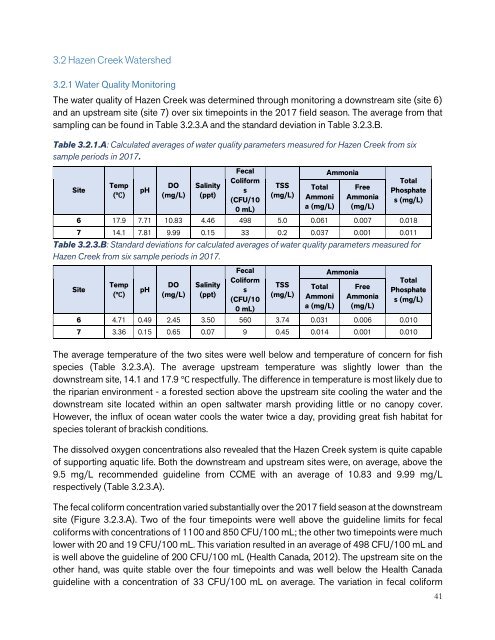
Table 3.2.1.A: Calculated averages <strong>of</strong> water quality parameters measured for Hazen Creek from six<br />
sample periods in <strong>2017</strong>.<br />
Site<br />
Temp<br />
(℃)<br />
pH<br />
DO<br />
(mg/L)<br />
Salinity<br />
(ppt)<br />
Fecal<br />
Coliform<br />
s<br />
(CFU/10<br />
0 mL)<br />
TSS<br />
(mg/L)<br />
Total<br />
Ammoni<br />
a (mg/L)<br />
Ammonia<br />
Free<br />
Ammonia<br />
(mg/L)<br />
Total<br />
Phosphate<br />
s (mg/L)<br />
6 17.9 7.71 10.83 4.46 498 5.0 0.061 0.007 0.018<br />
7 14.1 7.81 9.99 0.15 33 0.2 0.037 0.001 0.011<br />
Table 3.2.3.B: Standard deviations for calculated averages <strong>of</strong> water quality parameters measured for<br />
Hazen Creek from six sample periods in <strong>2017</strong>.<br />
Site<br />
Temp<br />
(℃)<br />
pH<br />
DO<br />
(mg/L)<br />
Salinity<br />
(ppt)<br />
Fecal<br />
Coliform<br />
s<br />
(CFU/10<br />
0 mL)<br />
TSS<br />
(mg/L)<br />
Total<br />
Ammoni<br />
a (mg/L)<br />
Ammonia<br />
Free<br />
Ammonia<br />
(mg/L)<br />
Total<br />
Phosphate<br />
s (mg/L)<br />
6 4.71 0.49 2.45 3.50 560 3.74 0.031 0.006 0.010<br />
7 3.36 0.15 0.65 0.07 9 0.45 0.014 0.001 0.010<br />
The average temperature <strong>of</strong> the two sites were well below and temperature <strong>of</strong> concern for fish<br />
species (Table 3.2.3.A). The average upstream temperature was slightly lower than the<br />
downstream site, 14.1 and 17.9 ℃ respectfully. The difference in temperature is most likely due to<br />
the riparian environment - a forested section above the upstream site cooling the water and the<br />
downstream site located within an open saltwater marsh providing little or no canopy cover.<br />
However, the influx <strong>of</strong> ocean water cools the water twice a day, providing great fish habitat for<br />
species tolerant <strong>of</strong> brackish conditions.<br />
The dissolved oxygen concentrations also revealed that the Hazen Creek system is quite capable<br />
<strong>of</strong> supporting aquatic life. Both the downstream and upstream sites were, on average, above the<br />
9.5 mg/L recommended guideline from CCME with an average <strong>of</strong> 10.83 and 9.99 mg/L<br />
respectively (Table 3.2.3.A).<br />
The fecal coliform concentration varied substantially over the <strong>2017</strong> field season at the downstream<br />
site (Figure 3.2.3.A). Two <strong>of</strong> the four timepoints were well above the guideline limits for fecal<br />
coliforms with concentrations <strong>of</strong> 1100 and 850 CFU/100 mL; the other two timepoints were much<br />
lower with 20 and 19 CFU/100 mL. This variation resulted in an average <strong>of</strong> 498 CFU/100 mL and<br />
is well above the guideline <strong>of</strong> 200 CFU/100 mL (Health Canada, 2012). The upstream site on the<br />
other hand, was quite stable over the four timepoints and was well below the Health Canada<br />
guideline with a concentration <strong>of</strong> 33 CFU/100 mL on average. The variation in fecal coliform<br />
41