Rebirth of Water - 2017-2018
ACAP Saint John, Water Quality and Fish Communities Monitoring Report http://www.acapsj.org
ACAP Saint John, Water Quality and Fish Communities Monitoring Report
http://www.acapsj.org

You also want an ePaper? Increase the reach of your titles
YUMPU automatically turns print PDFs into web optimized ePapers that Google loves.
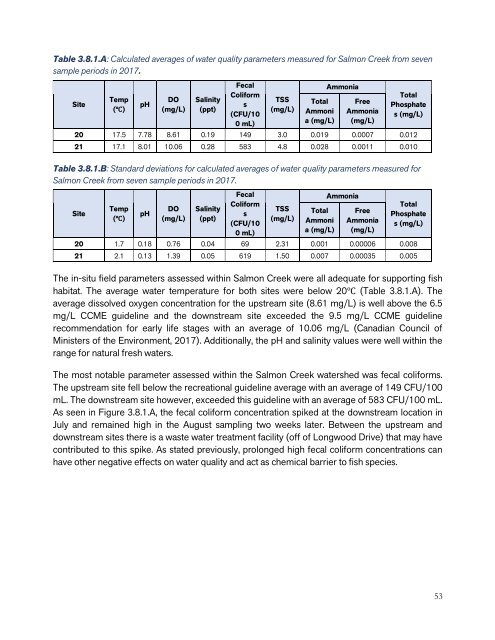
Table 3.8.1.A: Calculated averages <strong>of</strong> water quality parameters measured for Salmon Creek from seven<br />
sample periods in <strong>2017</strong>.<br />
Site<br />
Temp<br />
(℃)<br />
pH<br />
DO<br />
(mg/L)<br />
Salinity<br />
(ppt)<br />
Fecal<br />
Coliform<br />
s<br />
(CFU/10<br />
0 mL)<br />
TSS<br />
(mg/L)<br />
Total<br />
Ammoni<br />
a (mg/L)<br />
Ammonia<br />
Free<br />
Ammonia<br />
(mg/L)<br />
Total<br />
Phosphate<br />
s (mg/L)<br />
20 17.5 7.78 8.61 0.19 149 3.0 0.019 0.0007 0.012<br />
21 17.1 8.01 10.06 0.28 583 4.8 0.028 0.0011 0.010<br />
Table 3.8.1.B: Standard deviations for calculated averages <strong>of</strong> water quality parameters measured for<br />
Salmon Creek from seven sample periods in <strong>2017</strong>.<br />
Site<br />
Temp<br />
(℃)<br />
pH<br />
DO<br />
(mg/L)<br />
Salinity<br />
(ppt)<br />
Fecal<br />
Coliform<br />
s<br />
(CFU/10<br />
0 mL)<br />
TSS<br />
(mg/L)<br />
Total<br />
Ammoni<br />
a (mg/L)<br />
Ammonia<br />
Free<br />
Ammonia<br />
(mg/L)<br />
Total<br />
Phosphate<br />
s (mg/L)<br />
20 1.7 0.18 0.76 0.04 69 2.31 0.001 0.00006 0.008<br />
21 2.1 0.13 1.39 0.05 619 1.50 0.007 0.00035 0.005<br />
The in-situ field parameters assessed within Salmon Creek were all adequate for supporting fish<br />
habitat. The average water temperature for both sites were below 20℃ (Table 3.8.1.A). The<br />
average dissolved oxygen concentration for the upstream site (8.61 mg/L) is well above the 6.5<br />
mg/L CCME guideline and the downstream site exceeded the 9.5 mg/L CCME guideline<br />
recommendation for early life stages with an average <strong>of</strong> 10.06 mg/L (Canadian Council <strong>of</strong><br />
Ministers <strong>of</strong> the Environment, <strong>2017</strong>). Additionally, the pH and salinity values were well within the<br />
range for natural fresh waters.<br />
The most notable parameter assessed within the Salmon Creek watershed was fecal coliforms.<br />
The upstream site fell below the recreational guideline average with an average <strong>of</strong> 149 CFU/100<br />
mL. The downstream site however, exceeded this guideline with an average <strong>of</strong> 583 CFU/100 mL.<br />
As seen in Figure 3.8.1.A, the fecal coliform concentration spiked at the downstream location in<br />
July and remained high in the August sampling two weeks later. Between the upstream and<br />
downstream sites there is a waste water treatment facility (<strong>of</strong>f <strong>of</strong> Longwood Drive) that may have<br />
contributed to this spike. As stated previously, prolonged high fecal coliform concentrations can<br />
have other negative effects on water quality and act as chemical barrier to fish species.<br />
53