- Page 2 and 3:
Bioinformatics
- Page 4 and 5:
M ETHODS IN MOLECULAR BIOLOGY Bioi
- Page 6 and 7:
Preface Bioinformatics is the manag
- Page 8 and 9:
Contents Preface . . . . . . . . .
- Page 10 and 11:
Contributors FAISAL ABABNEH • Dep
- Page 12 and 13:
Contents of Volume II SECTION I: ST
- Page 14 and 15:
Managing Sequence Data Ilene Karsch
- Page 16 and 17:
2.2. The NCBI RefSeq Project Managi
- Page 18 and 19:
3.2. EST/STS/GSS 3.3. Mammalian Gen
- Page 20 and 21:
3.7. Third-Party Annotation Managin
- Page 22 and 23:
4. 4. Submission of of Sequence Dat
- Page 24 and 25:
6. The GenBank Sequence Record 6.1.
- Page 26 and 27:
7.1. Features and Sequence Managing
- Page 28 and 29:
Managing Sequence Data 17 first lev
- Page 30 and 31:
9. Pitfalls Pitfalls of an Archival
- Page 32 and 33:
10. Accessing Sequence Data Managin
- Page 34 and 35:
11. Conclusion 12. Notes Managing S
- Page 36 and 37:
Managing Sequence Data 25 by the se
- Page 38 and 39:
Acknowledgment References 1. Benson
- Page 40 and 41:
30 Scott and Hennig Large quantitie
- Page 42 and 43:
32 Scott and Hennig 2. Materials 2.
- Page 44 and 45:
34 Scott and Hennig 2.3. Anion-Exch
- Page 46 and 47:
36 Scott and Hennig 3.1.1. Large-Sc
- Page 48 and 49:
38 Scott and Hennig 3.2. NMR Resona
- Page 50 and 51:
40 Scott and Hennig Potentially, th
- Page 52 and 53:
42 Scott and Hennig qualitatively w
- Page 54 and 55:
44 Scott and Hennig 3.2.5. Residual
- Page 56 and 57:
46 Scott and Hennig 3.2.7. Base-to-
- Page 58 and 59:
48 Scott and Hennig Fig. 2.12. Sche
- Page 60 and 61:
50 Scott and Hennig 3.3.2. Molecula
- Page 62 and 63:
52 Scott and Hennig 5. In addition
- Page 64 and 65:
54 Scott and Hennig rapidly with th
- Page 66 and 67:
56 Scott and Hennig Acknowledgments
- Page 68 and 69:
58 Scott and Hennig structure eluci
- Page 70 and 71:
60 Scott and Hennig for correlating
- Page 72 and 73:
Chapter 3 Protein Structure Determi
- Page 74 and 75:
1.2.2. X-Ray Diffraction 1.2.3. X-R
- Page 76 and 77:
1.3. Structure Determination 1.3.1.
- Page 78 and 79:
1.3.2. Rotation Function 1.3.3. Tra
- Page 80 and 81:
1.4.1. Model Building Protein X-Ray
- Page 82 and 83:
3.2. Crystal Cryoprotection Protein
- Page 84 and 85:
Protein X-Ray Structure Determinati
- Page 86 and 87:
3.5. Molecular Replacement Protein
- Page 88 and 89:
3.6. Structure Refinement Protein X
- Page 90 and 91:
3.7. Model Building Protein X-Ray S
- Page 92 and 93:
4. Notes Protein X-Ray Structure De
- Page 94 and 95:
Protein X-Ray Structure Determinati
- Page 96 and 97:
References 1. Ducruix, A., Giegè,
- Page 98 and 99:
90 Durinck 1.2. Quality Assessment
- Page 100 and 101:
92 Durinck 1.5. Data Filtering 1.6.
- Page 102 and 103:
94 Durinck 2.1.2. Matrices 2.1.3. L
- Page 104 and 105:
96 Durinck 2.4.1. Affymetrix Experi
- Page 106 and 107:
98 Durinck >norm=gcrma(data) Comput
- Page 108 and 109:
100 Durinck 3.2. cDNA Microarray Da
- Page 110 and 111:
102 Durinck Fig. 4.5. Image of the
- Page 112 and 113:
104 Durinck 3.3. Detection of Diffe
- Page 114 and 115:
106 Durinck Fig. 4.8. Volcano plot,
- Page 116 and 117:
108 Durinck 4. Notes hg_u95av2”,v
- Page 118 and 119:
110 Durinck 5. Irizarry, R. A., Hob
- Page 120 and 121:
112 Harris 1.2. What Is an Ontology
- Page 122 and 123:
114 Harris 2.2.1. Groundwork 2.2.1.
- Page 124 and 125:
116 Harris 2.2.2. Ontology Construc
- Page 126 and 127:
118 Harris 2.2.3. Early Deployment
- Page 128 and 129:
120 Harris 3.1.4. Relationship Type
- Page 130 and 131:
122 Harris 5. Notes there is no sin
- Page 132 and 133:
124 Harris Genetics, Genomics, Prot
- Page 134 and 135:
126 Kawaji and Hayashizaki 2. Mater
- Page 136 and 137:
128 Kawaji and Hayashizaki 2.1.3. E
- Page 138 and 139:
130 Kawaji and Hayashizaki 2.2. Dat
- Page 140 and 141:
132 Kawaji and Hayashizaki 4. A gra
- Page 142 and 143:
134 Kawaji and Hayashizaki Export C
- Page 144 and 145:
136 Kawaji and Hayashizaki chr7: Us
- Page 146 and 147:
138 Kawaji and Hayashizaki Referenc
- Page 148 and 149:
Multiple Sequence Alignment Walter
- Page 150 and 151:
1.4. The Progressive Alignment Prot
- Page 152 and 153: 2.2. Unequal Sequence Lengths: Leng
- Page 154 and 155: Multiple Sequence Alignment 149 Tab
- Page 156 and 157: Multiple Sequence Alignment 151 par
- Page 158 and 159: 3.4. MAFFT Multiple Sequence Alignm
- Page 160 and 161: 3.6. SPEM 4. Notes Multiple Sequenc
- Page 162 and 163: Multiple Sequence Alignment 157 mul
- Page 164 and 165: References 1. Gribskov, M., McLachl
- Page 166 and 167: 34. Shi, J., Blundell, T. L., Mizug
- Page 168 and 169: 164 McHardy 2. Methods 2.1. Gene Fi
- Page 170 and 171: 166 McHardy Table 8.1. Publicly ava
- Page 172 and 173: 168 McHardy Fig. 8.2. Output of the
- Page 174 and 175: 170 McHardy 2.3. Gene Finding in Eu
- Page 176 and 177: 172 McHardy Known proteins Homology
- Page 178 and 179: 174 McHardy 3. Notes 1. The periodi
- Page 180 and 181: 176 McHardy specialization, and eff
- Page 182 and 183: Bioinformatics Detection of Alterna
- Page 184 and 185: 1.2. How to Detect Alternative Alte
- Page 186 and 187: Non-standard splice sites? (+) in m
- Page 188 and 189: 2.2. Completeness and Updating of P
- Page 190 and 191: 3. Methods 3.1. Pre-Processing Dete
- Page 192 and 193: 3.3. Alignment Filtering 3.4. Detec
- Page 194 and 195: Detection of Alternative Splicing 1
- Page 196 and 197: Detection of Alternative Splicing 1
- Page 198 and 199: 20. Mironov, A. A., Fickett, J. W.,
- Page 200 and 201: 124. Grasso, C., Quist, M., Ke, K.,
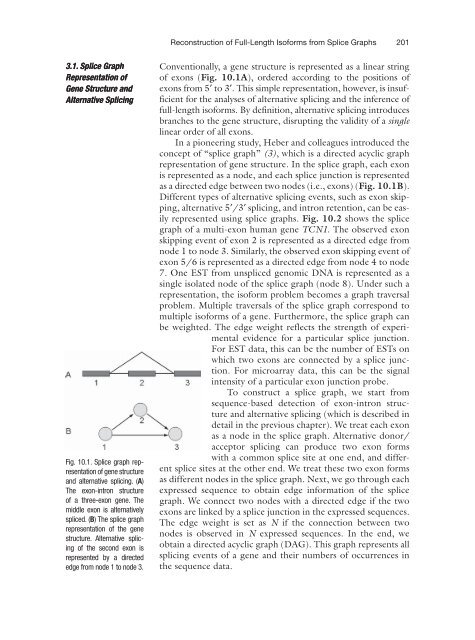
- Page 204 and 205: 202 Xing and Lee Fig. 10.2. Splice
- Page 206 and 207: 204 Xing and Lee 4. Web Resources a
- Page 208 and 209: Sequence Segmentation Jonathan M. K
- Page 210 and 211: 1.2. Change-Point Analysis Sequence
- Page 212 and 213: 2. Systems, Data, and Databases 3.
- Page 214 and 215: 3.2. Running changept Sequence Segm
- Page 216 and 217: Sequence Segmentation 215 -hp heati
- Page 218 and 219: 3.3. Assessing Convergence Sequence
- Page 220 and 221: 3.4. Determining Degree of Pooling
- Page 222 and 223: 3.6. Generating and Viewing Profile
- Page 224 and 225: Sequence Segmentation 223 segmentat
- Page 226 and 227: 3.8. Generating Segments Sequence S
- Page 228 and 229: Sequence Segmentation 227 to 10 lab
- Page 230 and 231: elements in vertebrate, insect, wor
- Page 232 and 233: 232 Bailey 2. Representing Sequence
- Page 234 and 235: 234 Bailey assumption implies that
- Page 236 and 237: 236 Bailey 3. General General Techn
- Page 238 and 239: 238 Bailey 4.1. Assemble: Select th
- Page 240 and 241: 240 Bailey 4.3. Discover: Run a Mot
- Page 242 and 243: 242 Bailey 4.4. Evaluate: Evaluate:
- Page 244 and 245: 244 Bailey generate) the random seq
- Page 246 and 247: 246 Bailey 5. Limitations of Motif
- Page 248 and 249: 248 Bailey References 1. Blais, A.,
- Page 250 and 251: 250 Bailey 40. La, D., Silver, M.,
- Page 252 and 253:
Modeling Sequence Evolution Pietro
- Page 254 and 255:
Fig. 13.1. Schematic description of
- Page 256 and 257:
3. DNA Substitution Models where di
- Page 258 and 259:
3.1. Modeling Rate Heterogeneity Al
- Page 260 and 261:
5. Amino Acid Mutation Models Model
- Page 262 and 263:
5.1. Generating Mutation Matrices M
- Page 264 and 265:
5.2. Amino Acid Models Incorporatin
- Page 266 and 267:
5.3. Amino Acid Models Incorporatin
- Page 268 and 269:
6. RNA Model of Evolution 7. Models
- Page 270 and 271:
8. Sub-Functionalization Model Mode
- Page 272 and 273:
11. Tests for Functional Divergence
- Page 274 and 275:
Modeling Sequence Evolution 277 of
- Page 276 and 277:
12.1. The Evolution of Introns Mode
- Page 278 and 279:
Fig. 13.6. Microsatellite length di
- Page 280 and 281:
References 1. Hein, J. (1994) TreeA
- Page 282 and 283:
59. von Mering, C., Krause, R., Sne
- Page 284 and 285:
288 Whelan 2. Underlying Principles
- Page 286 and 287:
290 Whelan 2.2. Why Estimating Tree
- Page 288 and 289:
292 Whelan 3.2. Refining the Tree E
- Page 290 and 291:
294 Whelan 3.3. Stopping Criteria t
- Page 292 and 293:
296 Whelan 4. Confidence Intervals
- Page 294 and 295:
298 Whelan 4.2. The Parametric Boot
- Page 296 and 297:
300 Whelan 4.3. Limitations of Curr
- Page 298 and 299:
302 Whelan 5.2. Sampling the Poster
- Page 300 and 301:
304 Whelan 5.4. The Specification o
- Page 302 and 303:
306 Whelan mutation. The replacemen
- Page 304 and 305:
308 Whelan 13. Chang, J. T. (1996)
- Page 306 and 307:
Detecting the Presence and Location
- Page 308 and 309:
Presence and Location of Selection
- Page 310 and 311:
Presence and Location of Selection
- Page 312 and 313:
Presence and Location of Selection
- Page 314 and 315:
2.3. Location of Diversifying Selec
- Page 316 and 317:
Presence and Location of Selection
- Page 318 and 319:
4. Correcting for Multiple Tests Pr
- Page 320 and 321:
5. Notes Presence and Location of S
- Page 322 and 323:
Presence and Location of Selection
- Page 324 and 325:
References 1. McDonald, J., Kreitma
- Page 326 and 327:
332 Jermiin et al. thought to have
- Page 328 and 329:
334 Jermiin et al. 2.1. Phylogeneti
- Page 330 and 331:
336 Jermiin et al. 2.2. Modeling th
- Page 332 and 333:
338 Jermiin et al. 3. Choosing a Su
- Page 334 and 335:
340 Jermiin et al. 3.3.1. 3.3.1. Ma
- Page 336 and 337:
342 Jermiin et al. 3.3.3. Matched-P
- Page 338 and 339:
344 Jermiin et al. obtained by usin
- Page 340 and 341:
346 Jermiin et al. Fig. 16.2. The t
- Page 342 and 343:
348 Jermiin et al. 3.4. Testing Tes
- Page 344 and 345:
350 Jermiin et al. (Fig. 16.4C). Th
- Page 346 and 347:
352 Jermiin et al. 3.5. Choosing a
- Page 348 and 349:
354 Jermiin et al. catering for som
- Page 350 and 351:
356 Jermiin et al. two time-reversi
- Page 352 and 353:
358 Jermiin et al. 4. Discussion 1.
- Page 354 and 355:
360 Jermiin et al. 3. Hardy, M. P.,
- Page 356 and 357:
362 Jermiin et al. 59. Azad, R. K.,
- Page 358 and 359:
364 Jermiin et al. 114. Shapiro, B.
- Page 360 and 361:
366 Catchen, Conery, and Postlethwa
- Page 362 and 363:
368 Catchen, Conery, and Postlethwa
- Page 364 and 365:
370 Catchen, Conery, and Postlethwa
- Page 366 and 367:
372 Catchen, Conery, and Postlethwa
- Page 368 and 369:
374 Catchen, Conery, and Postlethwa
- Page 370 and 371:
376 Catchen, Conery, and Postlethwa
- Page 372 and 373:
378 Catchen, Conery, and Postlethwa
- Page 374 and 375:
380 Catchen, Conery, and Postlethwa
- Page 376 and 377:
382 Catchen, Conery, and Postlethwa
- Page 378 and 379:
Genome Rearrangement by the Double
- Page 380 and 381:
1.2.2. DCJ Operation −3 −2 −5
- Page 382 and 383:
Genome Rearrangement 389 Fig. 18.4.
- Page 384 and 385:
Genome Rearrangement 391 Fig. 18.6.
- Page 386 and 387:
1.2.5. Distance Genome Rearrangemen
- Page 388 and 389:
1.3. DCJ on Circular and Linear Chr
- Page 390 and 391:
(A) (B) 1.3.4. Paths and Cycles 1.3
- Page 392 and 393:
1.4. DCJ on Circular and Linear Chr
- Page 394 and 395:
1.4.3. Paths and Cycles, Odd and Ev
- Page 396 and 397:
1.5. Linear Chromosomes with Restri
- Page 398 and 399:
3. Identify synteny blocks (LCBs) i
- Page 400 and 401:
3.2. Construction of a White Genome
- Page 402 and 403:
3.4. Construction of Adjacency Grap
- Page 404 and 405:
3.9. Sorting Without Linear Chromos
- Page 406 and 407:
Genome Rearrangement 413 Fig. 18.20
- Page 408 and 409:
Acknowledgments References 1. Nadea
- Page 410 and 411:
Inferring Ancestral Protein Interac
- Page 412 and 413:
2. Materials 2.1. Equipment 2.2. Ge
- Page 414 and 415:
Inferring Ancestral Protein Interac
- Page 416 and 417:
3.7. Visualization of Protein Inter
- Page 418 and 419:
Inferring Ancestral Protein Interac
- Page 420 and 421:
Inferring Ancestral Protein Interac
- Page 422 and 423:
Acknowledgments References 1. Uetz,
- Page 424 and 425:
Chapter 20 Computational Tools for
- Page 426 and 427:
2. Materials 2.1. Computer Requirem
- Page 428 and 429:
2.3.2. Data for Input to GRIMM and
- Page 430 and 431:
3. Methods 3.1. GRIMM-Synteny: Iden
- Page 432 and 433:
3.1.3. Forming Synteny Synteny Bloc
- Page 434 and 435:
3.1.4. GRIMM-Synteny: Usage and Opt
- Page 436 and 437:
3.1.5. Sample Run 1: Human-Mouse- R
- Page 438 and 439:
3.2. 3.2. GRIMM: Identifying Identi
- Page 440 and 441:
Analysis of Mammalian Genomes 447 G
- Page 442 and 443:
3.3.1. Input Format 3.3.2. Output:
- Page 444 and 445:
4. Notes Analysis of Mammalian Geno
- Page 446 and 447:
(A) File data/unsigned1.txt >genome
- Page 448 and 449:
11. Bourque, G., Zdobnov, E., Bork,
- Page 450 and 451:
458 Beiko and Ragan 2. Systems, Sys
- Page 452 and 453:
460 Beiko and Ragan 3. Methods 3.1.
- Page 454 and 455:
462 Beiko and Ragan 3.3. Phylogenet
- Page 456 and 457:
464 Beiko and Ragan 4. Notes A) B)
- Page 458 and 459:
466 Beiko and Ragan variability to
- Page 460 and 461:
468 Beiko and Ragan 8. Nelson, K. E
- Page 462 and 463:
Detecting Genetic Recombination Geo
- Page 464 and 465:
2. Materials 3. Methods Detecting R
- Page 466 and 467:
3.3. Creating the First Phylogeneti
- Page 468 and 469:
3.5. Refinement of the Sequence Set
- Page 470 and 471:
3.9. Systematic Removal of of Recom
- Page 472 and 473:
4. Notes Detecting Recombination 48
- Page 474 and 475:
References 1. Beiko, R. G., Ragan,
- Page 476 and 477:
486 Bunje and Wirth 2. Data and Mat
- Page 478 and 479:
488 Bunje and Wirth 2.3. Types of D
- Page 480 and 481:
490 Bunje and Wirth Table 23.1 List
- Page 482 and 483:
492 Bunje and Wirth and Phrap (4).
- Page 484 and 485:
494 Bunje and Wirth 3. Methods 3.1.
- Page 486 and 487:
496 Bunje and Wirth 3.2.2. Mismatch
- Page 488 and 489:
498 Bunje and Wirth Fig. 23.2. Exam
- Page 490 and 491:
500 Bunje and Wirth Fig. 23.4. The
- Page 492 and 493:
502 Bunje and Wirth 3.7.1. Direct E
- Page 494 and 495:
504 Bunje and Wirth Acknowledgments
- Page 496 and 497:
506 Bunje and Wirth 27. Wilson, G.
- Page 498 and 499:
508 Gramm, Nickelsen, and Tantau 1.
- Page 500 and 501:
510 Gramm, Nickelsen, and Tantau 1.
- Page 502 and 503:
512 Gramm, Nickelsen, and Tantau De
- Page 504 and 505:
514 Gramm, Nickelsen, and Tantau 2.
- Page 506 and 507:
516 Gramm, Nickelsen, and Tantau 3.
- Page 508 and 509:
518 Gramm, Nickelsen, and Tantau De
- Page 510 and 511:
520 Gramm, Nickelsen, and Tantau 4.
- Page 512 and 513:
522 Gramm, Nickelsen, and Tantau ho
- Page 514 and 515:
524 Gramm, Nickelsen, and Tantau Fi
- Page 516 and 517:
526 Gramm, Nickelsen, and Tantau ha
- Page 518 and 519:
528 Gramm, Nickelsen, and Tantau 7.
- Page 520 and 521:
530 Gramm, Nickelsen, and Tantau In
- Page 522 and 523:
532 Gramm, Nickelsen, and Tantau 8.
- Page 524 and 525:
534 Gramm, Nickelsen, and Tantau 31
- Page 526 and 527:
A Ababneh, F., ....................
- Page 528 and 529:
Dermitzakis, E. T., ...............
- Page 530 and 531:
events in chordate evolution and R3
- Page 532 and 533:
Li, W.-H., ........................
- Page 534 and 535:
Phosphorus-fitting of doublets from
- Page 536 and 537:
RSA Tools......... ................
- Page 538 and 539:
UPGMA, tree calculation ...........
- Page 540 and 541:
552 BIOINFORMATICS Index Bootstrap
- Page 542 and 543:
554 BIOINFORMATICS Index FFT-NS-1 a
- Page 544 and 545:
556 BIOINFORMATICS Index Jim Kent w
- Page 546 and 547:
558 BIOINFORMATICS Index O OBO-Edit
- Page 548 and 549:
560 BIOINFORMATICS Index Reference
- Page 550:
562 BIOINFORMATICS Index Variance S