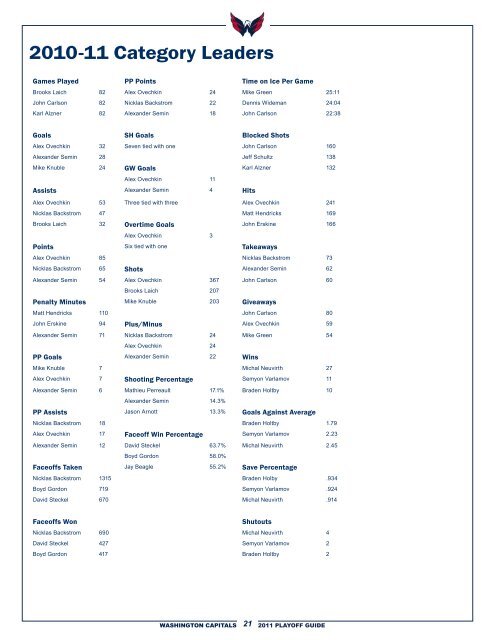
2010-11 Category Leaders Games Played PP Points Time on Ice Per Game Brooks Laich 82 Alex Ovechkin 24 Mike Green 25:11 John Carlson 82 Nicklas Backstrom 22 Dennis Wideman 24:04 Karl Alzner 82 Alexander Semin 18 John Carlson 22:38 Goals SH Goals Blocked Shots Alex Ovechkin 32 Seven tied with one John Carlson 160 Alexander Semin 28 Jeff Schultz 138 Mike Knuble 24 GW Goals Karl Alzner 132 Alex Ovechkin 11 Assists Alexander Semin 4 Hits Alex Ovechkin 53 Three tied with three Alex Ovechkin 241 Nicklas Backstrom 47 Matt Hendricks 169 Brooks Laich 32 Overtime Goals John Erskine 166 Alex Ovechkin 3 Points Six tied with one Takeaways Alex Ovechkin 85 Nicklas Backstrom 73 Nicklas Backstrom 65 Shots Alexander Semin 62 Alexander Semin 54 Alex Ovechkin 367 John Carlson 60 Brooks Laich 207 Penalty Minutes Mike Knuble 203 Giveaways Matt Hendricks 110 John Carlson 80 John Erskine 94 Plus/Minus Alex Ovechkin 59 Alexander Semin 71 Nicklas Backstrom 24 Mike Green 54 Alex Ovechkin 24 PP Goals Alexander Semin 22 Wins Mike Knuble 7 Michal Neuvirth 27 Alex Ovechkin 7 Shooting Percentage Semyon Varlamov 11 Alexander Semin 6 Mathieu Perreault 17.1% Braden Holtby 10 Alexander Semin 14.3% PP Assists Jason Arnott 13.3% Goals Against Average Nicklas Backstrom 18 Braden Holtby 1.79 Alex Ovechkin 17 Faceoff Win Percentage Semyon Varlamov 2.23 Alexander Semin 12 David Steckel 63.7% Michal Neuvirth 2.45 Boyd Gordon 58.0% Faceoffs Taken Jay Beagle 55.2% Save Percentage Nicklas Backstrom 1315 Braden Holby .934 Boyd Gordon 719 Semyon Varlamov .924 David Steckel 670 Michal Neuvirth .914 Faceoffs Won Shutouts Nicklas Backstrom 690 Michal Neuvirth 4 David Steckel 427 Semyon Varlamov 2 Boyd Gordon 417 Braden Holtby 2 21 WASHINGTON CAPITALS 2011 <strong>PLAYOFF</strong> <strong>GUIDE</strong>
2010-11 Game-by-Game Results # Date Team W-L-OT Record GF-GA Scorers W Goal PP PK SF-SA W-L Gltdr. Att. 1 10/8/2010 @ ATL L 0-1-0 2-4 21,22 9 0-3 3-3 31-31 50 / 30 15,596 2 10/9/2010 NJ W 1-1-0 7-2 74,14,8,25,8ps,21s,16p 8 1-5 4-4 29-33 30 / 30 18,398+ 3 10/11/2010 OTT W* 2-1-0 3-2 28,16,8 8 0-5 5-5 26-31 30 / 33 18,398+ 4 10/13/2010 NYI W 3-1-0 2-1 8,19p 19 1-4 3-3 26-24 30 / 35 18,398+ 5 10/16/2010 @NSH W* 4-1-0 3-2 28p,14,21p 21 2-5 6-6 34-39 30 / 39 16,144 6 10/19/2010 BOS L 4-2-0 1-3 90 17 0-4 4-4 36-21 30 / 30 18,398+ 7 10/21/2010 @BOS L 4-3-0 1-4 25 18 0-4 1-4 39-34 30 / 1 17,565+ 8 10/23/2010 ATL W* 5-3-0 4-3 28,28,28,14 14 0-3 5-6 44-32 30 / 50 18,398+ 9 10/27/2010 @CAR W 6-3-0 3-0 26,19,19se 26 0-3 5-5 33-29 30 / 30 18,680+ 10 10/28/2010 @MIN L 6-4-0 1-2 8 9 0-2 4-5 22-17 32 / 30 17,352 11 10/30/2010 @CGY W 7-4-0 7-2 19p,8p,8p,52,10,28,39ps 8 3-4 6-6 28-29 30 / 34 19,289+ 12 11/3/2010 TOR W** 8-4-0 5-4 52p,25,14,28p 8 2-4 3-4 30-28 30 / 50 18,398+ 13 11/5/2010 BOS W 9-4-0 5-3 89,52,28s,74,8e 74 0-3 1-3 39-18 70 / 40 18,398+ 14 11/7/2010 PHI W* 10-4-0 3-2 16,28p,52p 52 2-4 2-2 39-25 70 / 35 18,398+ 15 11/9/2010 @NYR W 11-4-0 5-3 21p,4,22,26,21e 26 1-4 3-4 24-28 30 / 30 18,200+ 16 11/11/2010 TB W 12-4-0 6-3 3,22,28p,28,8,28e 28 1-1 3-4 26-41 30 / 33 18,398+ 17 11/13/2010 @BUF O* 12-4-1 2-3 27,19 26 0-1 5-6 25-27 30 / 70 18,690+ 18 11/14/2010 ATL W 13-4-1 6-4 8,52p,28,26,4,39e 4 1-3 1-2 33-27 30 / 31 18,398+ 19 11/17/2010 BUF W 14-4-1 4-2 19p,10,39,28e 39 1-2 3-4 29-33 30 / 30 18,398+ 20 11/19/2010 @ATL L 14-5-1 0-5 21 0-3 0-2 29-36 31 / 70 11,115 21 11/20/2010 PHI O** 14-5-2 4-5 90,19p,25p,16p 48 3-7 8-9 37-35 33 / 30 18,398+ 22 11/22/2010 @NJ L 14-6-2 0-5 26 0-3 1-2 30-23 1 / 70 14,107 23 11/24/2010 @CAR W 15-6-2 3-2 19,19,21p 21 1-4 3-4 38-32 1 / 60 15,200 24 11/26/2010 TB W 16-6-2 6-0 74,4,28,28p,28p,3 74 2-4 5-5 29-17 1 / 41 18,398+ 25 11/28/2010 CAR W** 17-6-2 3-2 90,28 8 0-1 3-3 40-28 1 / 30 18,398+ 26 12/1/2010 @STL W 18-6-2 4-1 21p,15,19,19e 15 1-2 4-4 26-38 1 / 41 19,150+ 27 12/2/2010 @DAL L 18-7-2 1-2 22p 24 1-3 5-6 38-21 30 / 30 13,943 28 12/4/2010 ATL L 18-8-2 1-3 8 8 0-5 1-2 46-33 31 / 1 18,398+ 29 12/6/2010 TOR O** 18-8-3 5-4 85,22p,85,8 84 1-3 3-4 36-28 50 / 30 18,398+ 30 12/9/2010 FLA L 18-9-3 0-3 67 0-8 5-6 36-32 29 / 1 18,398+ 31 12/11/2010 COL L 18-10-3 2-3 22,26p 26 1-3 2-3 42-26 41 / 30 18,398+ 32 12/12/2010 @NYR L 18-11-3 0-7 8 0-4 2-3 31-20 30 / 1 18,200+ 33 12/15/2010 ANA O* 18-11-4 1-2 21 15 0-2 1-2 32-24 1 / 1 18,398+ 34 12/18/2010 @BOS L 18-12-4 2-3 10,27 26 0-1 0-0 41-21 30 / 30 17,565+ 35 12/19/2010 @OTT W 19-12-4 3-2 85,16,85p 85 1-6 5-5 34-26 30 / 30 19,516+ 36 12/21/2010 NJ W 20-12-4 5-1 63,83,25,74,22 83 0-5 3-4 28-36 30 / 30 18,398+ 37 12/23/2010 PIT O** 20-12-5 2-3 52p,22s 9 1-6 5-5 34-27 29 / 30 18,398+ 38 12/26/2010 @CAR W 21-12-5 3-2 85,39,8 8 0-2 4-4 30-35 1 / 30 10,477 39 12/28/2010 MTL W 22-12-5 3-0 83,52,8e 83 0-8 5-5 30-25 1 /31 18,398+ 40 1/1/2011 @PIT W 23-12-5 3-1 22p,16,16 16 1-2 4-4 32-33 1 / 29 68,111 41 1/4/2011 TB O* 23-12-6 0-1 26 0-3 3-3 34-38 31 / 1 18,398+ 42 1/8/2011 FLA W 24-12-6 3-2 16,52p,8 8 1-3 4-4 27-27 1 / 30 18,398+ 43 1/11/2011 @FLA O* 24-12-7 3-4 90,22,90 6 0-5 3-6 33-41 29 / 30 14,790 44 1/12/2011 @TB L 24-13-7 0-3 19 0-2 6-6 23-38 35 / 1 18,135 45 1/14/2011 VAN L 24-14-7 2-4 26,90 22 0-3 2-3 27-35 1 / 1 18,398+ 46 1/16/2011 OTT W 25-14-7 3-1 21,74p,25 74 1-2 2-2 26-23 30 / 30 18,398+ 47 1/18/2011 @PHI O* 25-14-8 2-3 22,8 41 0-0 1-1 25-30 35 / 1 19,824+ 48 1/20/2011 @NYI W 26-14-8 2-1 25,19 19 0-2 6-6 24-25 70 / 39 9,119 49 1/22/2011 @TOR W 27-14-8 4-1 8,8,26,8e 8 0-2 3-3 31-36 70 / 35 19,554+ 50 1/24/2011 NYR O** 27-14-9 1-2 26 42 0-2 2-2 23-29 43 / 70 18,398+ 51 1/26/2011 @ATL L 27-15-9 0-1 80 0-3 2-2 36-24 31 / 1 14,513 52 2/1/2011 MTL O** 27-15-10 2-3 85,22p 21 1-3 6-6 29-38 31 / 1 18,398+ 53 2/4/2011 @TB W 28-15-10 5-2 19,21,8p,19,25e 8 1-4 3-4 36-25 1 / 35 20,216+ 54 2/6/2011 PIT W 29-15-10 3-0 21,90s,22e 21 0-4 2-2 24-22 30 / 29 18,398+ 55 2/8/2011 SJ L 29-16-10 0-2 39 0-2 1-1 25-36 31 / 30 18,398+ 56 2/12/2011 LA L 29-17-10 1-4 8 12 0-4 1-1 23-28 45 / 1 18,398+ 57 2/14/2011 @PHX L 29-18-10 2-3 90,10 38 0-5 2-3 31-18 30 / 30 13,856 58 2/16/2011 @ANA W 30-18-10 7-6 8,21,39,28,22,28,28 28 0-2 1-2 31-21 30 / 31 15,579 59 2/17/2011 @SJ L 30-19-10 2-3 8p,19 15 1-1 1-2 25-28 31 / 30 17,562+ 60 2/20/2011 @BUF W 31-19-10 2-1 85,90p 90 1-5 1-2 39-29 1 / 30 18,690+ 61 2/21/2011 @PIT W 32-19-10 1-0 8p 8 1-3 3-3 24-39 30 / 29 18,263+ 62 2/25/2011 NYR L 32-20-10 0-6 44 0-5 2-4 35-28 30 / 30 18,398+ 63 2/26/2011 @NYI W 33-20-10 3-2 21,22,28 28 0-2 4-4 22-31 30 / 35 16,250+ 64 3/1/2011 NYI W* 34-20-10 2-1 21,8 8 0-2 4-4 42-29 30 / 52 18,398+ * Overtime ** Shootout s Shorthanded goal p Power-play goal ps Penality shot e Empty net goal + Sellout 22 WASHINGTON CAPITALS 2011 <strong>PLAYOFF</strong> <strong>GUIDE</strong>