Highlights of Ontario Results
Highlights of Ontario Results
Highlights of Ontario Results

Create successful ePaper yourself
Turn your PDF publications into a flip-book with our unique Google optimized e-Paper software.
Trends in International Mathematics<br />
and Science Study (TIMSS), 2011<br />
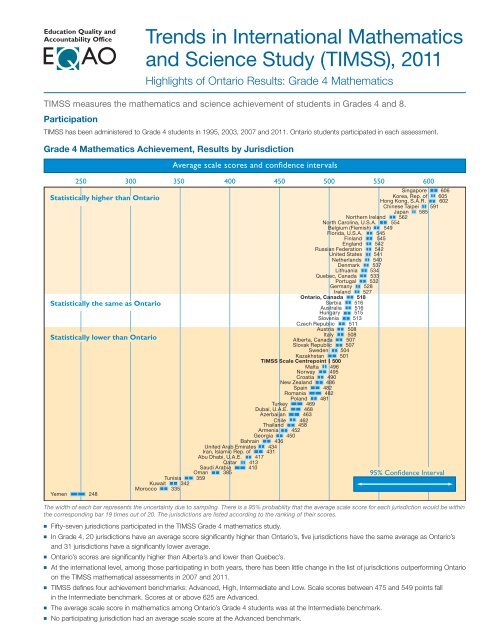
<strong>Highlights</strong> <strong>of</strong> <strong>Ontario</strong> <strong>Results</strong>: Grade 4 Mathematics<br />
TIMSS measures the mathematics and science achievement <strong>of</strong> students in Grades 4 and 8.<br />
Participation<br />
TIMSS has been administered to Grade 4 students in 1995, 2003, 2007 and 2011. <strong>Ontario</strong> students participated in each assessment.<br />
Grade 4 Mathematics Achievement, <strong>Results</strong> by Jurisdiction<br />
Yemen<br />
Average scale scores and con�dence intervals<br />
250 300 350 400 450 500 550 600<br />
Statistically higher than <strong>Ontario</strong><br />
Statistically the same as <strong>Ontario</strong><br />
Statistically lower than <strong>Ontario</strong><br />
248<br />
Tunisia<br />
Kuwait 342<br />
Morocco 335<br />
Singapore 606<br />
Korea, Rep. <strong>of</strong><br />
Hong Kong, S.A.R.<br />
605<br />
602<br />
Chinese Taipei 591<br />
Japan 585<br />
Northern Ireland 562<br />
North Carolina, U.S.A. 554<br />
Belgium (Flemish) 549<br />
Florida, U.S.A. 545<br />
Finland 545<br />
England 542<br />
Russian Federation<br />
United States<br />
542<br />
541<br />
Netherlands 540<br />
Denmark 537<br />
Lithuania 534<br />
Quebec, Canada 533<br />
Portugal<br />
Germany<br />
532<br />
528<br />
Ireland 527<br />
<strong>Ontario</strong>, Canada 518<br />
Serbia<br />
Australia<br />
Hungary<br />
516<br />
516<br />
515<br />
Slovenia 513<br />
Czech Republic 511<br />
Austria 508<br />
Italy<br />
Alberta, Canada<br />
Slovak Republic<br />
508<br />
507<br />
507<br />
Sweden 504<br />
Kazakhstan<br />
TIMSS Scale Centrepoint<br />
501<br />
500<br />
Malta<br />
Norway<br />
496<br />
495<br />
Croatia<br />
New Zealand<br />
490<br />
486<br />
Spain 482<br />
Romania 482<br />
Poland<br />
Turkey 469<br />
481<br />
Dubai, U.A.E.<br />
Azerbaijan<br />
468<br />
463<br />
Chile<br />
Thailand<br />
Armenia<br />
462<br />
458<br />
452<br />
Georgia 450<br />
Bahrain 436<br />
United Arab Emirates<br />
Iran, Islamic Rep. <strong>of</strong><br />
434<br />
431<br />
Abu Dhabi, U.A.E.<br />
Saudi Arabia<br />
95% Con�dence Interval<br />
Qatar<br />
417<br />
Oman 385<br />
359<br />
413<br />
410<br />
The width <strong>of</strong> each bar represents the uncertainty due to sampling. There is a 95% probability that the average scale score for each jurisdiction would be within<br />
the corresponding bar 19 times out <strong>of</strong> 20. The jurisdictions are listed according to the ranking <strong>of</strong> their scores.<br />
■ Fifty-seven jurisdictions participated in the TIMSS Grade 4 mathematics study.<br />
■ In Grade 4, 20 jurisdictions have an average score significantly higher than <strong>Ontario</strong>’s, five jurisdictions have the same average as <strong>Ontario</strong>’s<br />
and 31 jurisdictions have a significantly lower average.<br />
■ <strong>Ontario</strong>’s scores are significantly higher than Alberta’s and lower than Quebec’s.<br />
■ At the international level, among those participating in both years, there has been little change in the list <strong>of</strong> jurisdictions outperforming <strong>Ontario</strong><br />
on the TIMSS mathematical assessments in 2007 and 2011.<br />
■ TIMSS defines four achievement benchmarks: Advanced, High, Intermediate and Low. Scale scores between 475 and 549 points fall<br />
in the Intermediate benchmark. Scores at or above 625 are Advanced.<br />
■ The average scale score in mathematics among <strong>Ontario</strong>’s Grade 4 students was at the Intermediate benchmark.<br />
■ No participating jurisdiction had an average scale score at the Advanced benchmark.
Average Sc<br />
100<br />
Grade 4 Mathematics, Trends in Achievement (Canadian Provinces)<br />
0<br />
<strong>Ontario</strong> Alberta Quebec<br />
600<br />
Average Scale Score<br />
500<br />
400<br />
300<br />
200<br />
100<br />
0<br />
■ The average scale score for <strong>Ontario</strong>’s Grade 4 students has increased significantly, from 489 to 518, between 1995 and 2011 (a total <strong>of</strong> 29<br />
points), but there has been no significant change between 2003 and 2011.<br />
■ Alberta’s results have remained statistically unchanged and Quebec’s results have dropped significantly since 1995.<br />
Grade 4 Mathematics, Trends in Achievement (Percentages <strong>of</strong> Students Reaching or Exceeding the<br />
TIMSS Intermediate Benchmark)<br />
Percentage <strong>of</strong> Students (%)<br />
Percentage <strong>of</strong> Students (%)<br />
300<br />
200<br />
100<br />
80<br />
60<br />
40<br />
20<br />
0<br />
100<br />
80<br />
■ The percentage <strong>of</strong> <strong>Ontario</strong> 70% 71% 73%<br />
74%<br />
74%<br />
Grade 4 students achieving or exceeding 69% the TIMSS 70% Intermediate benchmark 69% has increased significantly, 1995 from<br />
59%<br />
59% to 73%, 60 between 1995 and 2011, but there has been no significant change between 2003 and 2011.<br />
2003<br />
■ In Quebec, the percentage <strong>of</strong> students reaching or exceeding the Intermediate benchmark has decreased significantly between 1995<br />
40<br />
n/a<br />
2007<br />
and 2011.<br />
20<br />
2011<br />
About TIMSS 0<br />
489<br />
<strong>Ontario</strong> Alberta Quebec<br />
■ TIMSS is coordinated by the International Association for the Evaluation <strong>of</strong> Educational Achievement (IEA).<br />
■ A total <strong>of</strong> 4570 Grade 4 students participated in <strong>Ontario</strong>.<br />
About EQAO: The Education Quality and Accountability Office (EQAO) acts as a catalyst for increasing the success <strong>of</strong><br />
<strong>Ontario</strong> students by measuring their achievement in reading, writing and mathematics against a common curriculum<br />
benchmark. As an independent provincial agency, EQAO plays a pivotal role by conducting province-wide tests at key<br />
points in every student’s primary, junior and secondary education and reporting the results. The objective and reliable facts<br />
obtained add to the current knowledge about student learning and are an important tool for improvement at the individual,<br />
school and provincial levels.<br />
TIMSS_48e_highlights_1212<br />
59%<br />
511 512 518<br />
523<br />
n/a<br />
n/a<br />
505 507<br />
<strong>Ontario</strong> Alberta Quebec<br />
70% 71% 73%<br />
74%<br />
n/a<br />
550<br />
87%<br />
506 519 533<br />
<strong>Ontario</strong> Alberta Quebec<br />
83%<br />
2007<br />
2011<br />
1995<br />
2003<br />
2007<br />
2011<br />
87%<br />
83%<br />
69% 70% 69%<br />
74%<br />
1995<br />
2003<br />
2007<br />
2011<br />
December 2012
■ Fifty-six jurisdictions participated in the TIMSS Grade 8 mathematics study.<br />
■ In Grade 8, 10 jurisdictions have an average score significantly higher than <strong>Ontario</strong>’s, 11 jurisdictions have the same average as <strong>Ontario</strong>’s<br />
and 34 jurisdictions have a significantly lower average.<br />
■ <strong>Ontario</strong> students performed as well as those in Alberta but not as well as those in Quebec.<br />
■ At the international level, among those participating in both years, there has been little change in the list <strong>of</strong> jurisdictions outperforming <strong>Ontario</strong><br />
on the TIMSS mathematical assessments in 2007 and 2011.<br />
Trends in International Mathematics<br />
and Science Study (TIMSS), 2011<br />
<strong>Highlights</strong> <strong>of</strong> <strong>Ontario</strong> <strong>Results</strong>: Grade 8 Mathematics<br />
TIMSS measures the mathematics and science achievement <strong>of</strong> students in Grades 4 and 8.<br />
Participation<br />
TIMSS has been administered to Grade 8 students in 1995, 1999, 2003, 2007 and 2011. <strong>Ontario</strong> students participated in each assessment.<br />
Grade 8 Mathematics Achievement, <strong>Results</strong> by Jurisdiction<br />
200 250 300 350 400 450 500 550 600<br />
Statistically higher than <strong>Ontario</strong><br />
Statistically the same as <strong>Ontario</strong><br />
Statistically lower than <strong>Ontario</strong><br />
The width <strong>of</strong> each bar represents the uncertainty due to sampling. There is a 95% probability that the average scale score for each jurisdiction would be within<br />
the corresponding bar 19 times out <strong>of</strong> 20. The jurisdictions are listed according to the ranking <strong>of</strong> their scores.<br />
■ TIMSS defines four achievement benchmarks: Advanced, High, Intermediate and Low. Scale scores between 475 and 549 points fall in the<br />
Intermediate benchmark. Scores at or above 625 are Advanced.<br />
Average scale scores and confidence intervals<br />
Korea 613<br />
Singapore<br />
Chinese Taipei<br />
Hong Kong, S.A.R. 586<br />
Japan 570<br />
611<br />
609<br />
Massachusetts, U.S.A.<br />
Minnesota, U.S.A. 545<br />
561<br />
Russian Federation 539<br />
North Carolina, U.S.A.<br />
Quebec, Canada<br />
537<br />
532<br />
Indiana, U.S.A. 522<br />
Colorado, U.S.A. 518<br />
Connecticut, U.S.A. 518<br />
Israel 516<br />
Finland<br />
Florida, U.S.A.<br />
514<br />
513<br />
<strong>Ontario</strong>, Canada<br />
United States<br />
England<br />
512<br />
509<br />
507<br />
Alberta, Canada<br />
Hungary<br />
Australia<br />
505<br />
505<br />
505<br />
Slovenia 505<br />
Lithuania 502<br />
TIMSS Scale Centrepoint<br />
Italy<br />
500<br />
498<br />
California, U.S.A. 493<br />
New Zealand 488<br />
Kazakhstan 487<br />
Sweden 484<br />
Ukraine 479<br />
Dubai, U.A.E. 478<br />
Norway 475<br />
Armenia 467<br />
Alabama, U.S.A. 466<br />
Romania 458<br />
United Arab Emirates 456<br />
Turkey 452<br />
Abu Dhabi, U.A.E. 449<br />
Lebanon 449<br />
Malaysia 440<br />
Georgia 431<br />
Thailand<br />
Macedonia, Rep. <strong>of</strong><br />
427<br />
426<br />
Tunisia 425<br />
Chile 416<br />
Iran, Islamic Rep. <strong>of</strong> 415<br />
Qatar 410<br />
Bahrain 409<br />
Jordan 406<br />
Palestinian National Authority 404<br />
Saudi Arabia 394<br />
Indonesia<br />
Syrian Arab Republic<br />
386<br />
380<br />
95% Confidence Interval<br />
Morocco 371<br />
Oman 366<br />
Ghana 331<br />
■ The average scale score in mathematics among <strong>Ontario</strong>’s Grade 8 students was at the Intermediate benchmark.<br />
■ No participating jurisdiction had an average scale score at the Advanced benchmark.
Average Sc<br />
100<br />
Grade 8 Mathematics, Trends in Achievement (Canadian Provinces)<br />
0<br />
600<br />
<strong>Ontario</strong> Alberta<br />
556<br />
Quebec<br />
566<br />
Average Scale Score<br />
500<br />
400<br />
300<br />
200<br />
100<br />
0<br />
■ The average scale score for <strong>Ontario</strong>’s Grade 8 students has increased significantly, from 501 to 512, between 1995 and 2011, but there has<br />
been a significant decline between 2003 and 2011.<br />
■ <strong>Results</strong> for Quebec and Alberta have declined significantly between 1995 and 2011.<br />
Grade 8 Mathematics, Trends in Achievement (Percentages <strong>of</strong> Students Reaching or Exceeding<br />
the TIMSS Intermediate Benchmark)<br />
Percentage <strong>of</strong> Students (%)<br />
Percentage <strong>of</strong> Students (%)<br />
300<br />
200<br />
100<br />
80<br />
60<br />
40<br />
20<br />
0<br />
100<br />
80<br />
72%<br />
■ The percentage <strong>of</strong> <strong>Ontario</strong> 65% Grade 8 students achieving or exceeding the TIMSS Intermediate benchmark has increased significantly, from<br />
65% to 71%, 60 between 1995 and 2011.<br />
75% 74%<br />
71%<br />
69%<br />
1995<br />
1999<br />
■ The percentage <strong>of</strong> <strong>Ontario</strong> Grade 8 students reaching or exceeding the Intermediate benchmark in 2011 is significantly larger than the<br />
40<br />
2003<br />
n/a n/a<br />
percentage in 1995, but it is significantly smaller than the percentage in 2003.<br />
■ <strong>Results</strong> for 20<br />
2007<br />
Alberta and Quebec have declined significantly since 1995.<br />
0<br />
2011<br />
<strong>Ontario</strong> Alberta Quebec<br />
About TIMSS<br />
501<br />
517 521 517 512<br />
■ TIMSS is coordinated by the International Association for the Evaluation <strong>of</strong> Educational Achievement (IEA).<br />
■ A total <strong>of</strong> 4756 Grade 8 students participated in <strong>Ontario</strong>.<br />
About EQAO: The Education Quality and Accountability Office (EQAO) acts as a catalyst for increasing the success <strong>of</strong><br />
<strong>Ontario</strong> students by measuring their achievement in reading, writing and mathematics against a common curriculum<br />
benchmark. As an independent provincial agency, EQAO plays a pivotal role by conducting province-wide tests at key<br />
points in every student’s primary, junior and secondary education and reporting the results. The objective and reliable facts<br />
obtained add to the current knowledge about student learning and are an important tool for improvement at the individual,<br />
school and provincial levels.<br />
TIMSS_48e_highlights_1212<br />
65%<br />
527<br />
531<br />
n/a n/a<br />
<strong>Ontario</strong> Alberta Quebec<br />
72% 75% 74%<br />
71%<br />
79% 81%<br />
79% 81%<br />
n/a n/a<br />
n/a<br />
<strong>Ontario</strong> Alberta Quebec<br />
n/a<br />
505<br />
69%<br />
90% 93%<br />
90% 93%<br />
543<br />
88%<br />
88%<br />
528 532<br />
78% 82%<br />
78% 82%<br />
2003<br />
2007<br />
2011<br />
1995<br />
1999<br />
2003<br />
2007<br />
2011<br />
1995<br />
1999<br />
2003<br />
2007<br />
2011<br />
December 2012
■ Fifty-seven jurisdictions participated in the TIMSS Grade 4 science study.<br />
■ In Grade 4, 10 jurisdictions have an average score significantly higher than <strong>Ontario</strong>’s, 13 jurisdictions have the same average as <strong>Ontario</strong>’s<br />
and 33 jurisdictions have a significantly lower average.<br />
■ Compared to students in the other participating Canadian provinces, <strong>Ontario</strong>’s students performed better than those in Quebec and less<br />
well than those in Alberta.<br />
Trends in International Mathematics<br />
and Science Study (TIMSS), 2011<br />
<strong>Highlights</strong> <strong>of</strong> <strong>Ontario</strong> <strong>Results</strong>: Grade 4 Science<br />
TIMSS measures the mathematics and science achievement <strong>of</strong> students in Grades 4 and 8.<br />
Participation<br />
TIMSS has been administered to Grade 4 students in 1995, 2003, 2007 and 2011. <strong>Ontario</strong> students participated in each assessment.<br />
Grade 4 Science Achievement, <strong>Results</strong> by Jurisdiction<br />
Average scale scores and confidence intervals<br />
200 250 300 350 400 450 500 550 600<br />
Statistically higher than <strong>Ontario</strong><br />
Statistically the same as <strong>Ontario</strong><br />
Statistically lower than <strong>Ontario</strong><br />
Yemen 209<br />
Morocco<br />
264<br />
Kuwait<br />
Tunisia<br />
*Although the mean score for North Carolina is higher than that for the Czech Republic, it is not significantly higher than the mean score for <strong>Ontario</strong>.<br />
Note: The width <strong>of</strong> each bar represents the uncertainty due to sampling. There is a 95% probability that the average scale score for each jurisdiction would<br />
be within the corresponding bar 19 times out <strong>of</strong> 20. The jurisdictions are listed according to the ranking <strong>of</strong> their scores.<br />
■ TIMSS defines four achievement benchmarks: Advanced, High, Intermediate and Low. Scale scores between 475 and 549 points fall<br />
in the Intermediate benchmark. Scores at or above 625 are Advanced.<br />
■ The average scale score in science among <strong>Ontario</strong>’s Grade 4 students was at the Intermediate benchmark.<br />
■ No participating jurisdiction had an average scale score at the Advanced benchmark.<br />
Korea, Rep. <strong>of</strong><br />
Singapore<br />
Finland 570<br />
Japan 559<br />
Russian Federation 552<br />
Chinese Taipei 552<br />
Florida, U.S.A. 545<br />
United States 544<br />
Alberta, Canada 541<br />
Czech Republic 536<br />
North Carolina, U.S.A.<br />
Hong Kong, S.A.R.<br />
Hungary<br />
538*<br />
535<br />
534<br />
Sweden<br />
Slovak Republic<br />
533<br />
532<br />
Austria<br />
Netherlands<br />
532<br />
531<br />
England 529<br />
<strong>Ontario</strong>, Canada 528<br />
Denmark<br />
Germany<br />
528<br />
528<br />
Italy<br />
Portugal<br />
524<br />
522<br />
Slovenia 520<br />
Northern Ireland<br />
Ireland<br />
Croatia<br />
Quebec, Canada<br />
Australia<br />
517<br />
516<br />
516<br />
516<br />
516<br />
Serbia<br />
Lithuania<br />
Belgium (Flemish)<br />
516<br />
515<br />
509<br />
Romania<br />
Spain<br />
505<br />
505<br />
Poland 505<br />
TIMSS Scale Centrepoint 500<br />
New Zealand 497<br />
Kazakhstan 495<br />
Norway 494<br />
Chile 480<br />
Thailand 472<br />
Turkey<br />
Dubai, U.A.E.<br />
Georgia<br />
Iran, Islamic Rep. <strong>of</strong><br />
463<br />
461<br />
455<br />
453<br />
Bahrain 449<br />
Malta 446<br />
Azerbaijan 438<br />
Saudi Arabia 429<br />
United Arab Emirates 428<br />
Armenia 416<br />
Abu Dhabi, U.A.E. 411<br />
Qatar 394<br />
Oman<br />
347<br />
346<br />
377<br />
95% Confidence Interval<br />
587<br />
583
Average Sc<br />
100<br />
Grade 4 Science, Trends in Achievement (Canadian Provinces)<br />
0<br />
600<br />
<strong>Ontario</strong><br />
555<br />
Alberta Quebec<br />
Average Scale Score<br />
500<br />
400<br />
300<br />
200<br />
100<br />
0<br />
■ In Grade 4, <strong>Ontario</strong> results have improved significantly between 1995 and 2011. The 2011 average scale score is significantly higher<br />
than in 1995, but significantly lower than in 2003.<br />
■ In Quebec, the average scale score is significantly lower than in 1995, but it has increased significantly since 2003.<br />
Grade 4 Science, Trends in Achievement (Percentages <strong>of</strong> Students Reaching or Exceeding<br />
the TIMSS Intermediate Benchmark)<br />
Percentage <strong>of</strong> Students (%)<br />
Percentage <strong>of</strong> Students (%)<br />
300<br />
200<br />
100<br />
80<br />
60<br />
40<br />
20<br />
0<br />
100<br />
80 71%<br />
74% 76%<br />
■ The percentage <strong>of</strong> <strong>Ontario</strong> Grade 4 students reaching the Intermediate benchmark has risen significantly, 66% from 71% in 1995 to 77% 1995 in 2011.<br />
■ <strong>Results</strong> for 60Alberta<br />
have remained relatively steady. The percentages for Quebec have fluctuated between a high <strong>of</strong> 77% in 1995 and 2003 a low<br />
<strong>of</strong> 66% in 2003.<br />
40<br />
n/a<br />
2007<br />
20<br />
2011<br />
About TIMSS<br />
0<br />
516<br />
■ TIMSS is coordinated by the International Association for the Evaluation <strong>of</strong> Educational Achievement (IEA).<br />
<strong>Ontario</strong> Alberta Quebec<br />
■ A total <strong>of</strong> 4570 Grade 4 students participated in <strong>Ontario</strong>.<br />
About EQAO: The Education Quality and Accountability Office (EQAO) acts as a catalyst for increasing the success <strong>of</strong><br />
<strong>Ontario</strong> students by measuring their achievement in reading, writing and mathematics against a common curriculum<br />
benchmark. As an independent provincial agency, EQAO plays a pivotal role by conducting province-wide tests at key<br />
points in every student’s primary, junior and secondary education and reporting the results. The objective and reliable facts<br />
obtained add to the current knowledge about student learning and are an important tool for improvement at the individual,<br />
school and provincial levels.<br />
TIMSS_48e_highlights_1212<br />
71%<br />
540 536<br />
543 541<br />
528 529<br />
n/a<br />
500 517 516<br />
<strong>Ontario</strong> Alberta Quebec<br />
81% 79% 77%<br />
81% 79% 77%<br />
84%<br />
84%<br />
n/a<br />
n/a<br />
82% 83%<br />
<strong>Ontario</strong> Alberta Quebec<br />
82% 83%<br />
77%<br />
77%<br />
66%<br />
74%<br />
76%<br />
2007<br />
2011<br />
1995<br />
2003<br />
2007<br />
2011<br />
1995<br />
2003<br />
2007<br />
2011<br />
December 2012
■ Fifty-six jurisdictions participated in the TIMSS Grade 8 science study.<br />
■ In Grade 8, 15 jurisdictions have an average score significantly higher than <strong>Ontario</strong>’s, eight jurisdictions have the same average as <strong>Ontario</strong>’s<br />
and 32 jurisdictions have a significantly lower average.<br />
Trends in International Mathematics<br />
and Science Study (TIMSS), 2011<br />
<strong>Highlights</strong> <strong>of</strong> <strong>Ontario</strong> <strong>Results</strong>: Grade 8 Science<br />
TIMSS measures the mathematics and science achievement <strong>of</strong> students in Grades 4 and 8.<br />
Participation<br />
TIMSS has been administered to Grade 8 students in 1995, 1999, 2003, 2007 and 2011. <strong>Ontario</strong> students participated in each assessment.<br />
Grade 8 Science Achievement, <strong>Results</strong> by Jurisdiction<br />
Average scale scores and con�dence intervals<br />
250 300 350 400 450 500 550 600<br />
Statistically higher than <strong>Ontario</strong><br />
Statistically the same as <strong>Ontario</strong><br />
Statistically lower than <strong>Ontario</strong><br />
Ghana<br />
306<br />
*Although the mean score for New Zealand is lower than that for Lithuania, it is not significantly lower than the mean score for <strong>Ontario</strong>.<br />
Note: The width <strong>of</strong> each bar represents the uncertainty due to sampling. There is a 95% probability that the average scale score for each jurisdiction would be<br />
within the corresponding bar 19 times out <strong>of</strong> 20. The jurisdictions are listed according to the ranking <strong>of</strong> their scores.<br />
■ <strong>Ontario</strong> students performed the same as those in Quebec and less well than those in Alberta.<br />
■ TIMSS defines four achievement benchmarks: Advanced, High, Intermediate and Low. Scale scores between 475 and 549 points fall<br />
in the Intermediate benchmark. Scores at or above 625 are Advanced.<br />
Singapore 590<br />
Massachusetts, U.S.A. 567<br />
Chinese Taipei 564<br />
Korea, Rep. <strong>of</strong> 560<br />
Japan 558<br />
Minnesota, U.S.A. 553<br />
Finland 552<br />
Alberta, Canada 546<br />
Slovenia 543<br />
Colorado, U.S.A. 542<br />
Russian Federation 542<br />
Hong Kong, S.A.R. 535<br />
England 533<br />
Indiana, U.S.A. 533<br />
Connecticut, U.S.A. 532<br />
North Carolina, U.S.A. 532<br />
Florida, U.S.A. 530<br />
United States 525<br />
Hungary 522<br />
<strong>Ontario</strong>, Canada 521<br />
Quebec, Canada 520<br />
Australia 519<br />
Israel 516<br />
New Zealand 512*<br />
Lithuania 514<br />
Sweden 509<br />
Italy 501<br />
Ukraine 501<br />
TIMSS Scale Centrepoint 500<br />
California, U.S.A. 499<br />
Norway 494<br />
Kazakhstan 490<br />
Alabama, U.S.A. 485<br />
Dubai, U.A.E. 485<br />
Turkey 483<br />
Iran, Islamic Rep. <strong>of</strong> 474<br />
Romania 465<br />
United Arab Emirates 465<br />
Abu Dhabi, U.A.E. 461<br />
Chile 461<br />
Bahrain 452<br />
Thailand 451<br />
Jordan 449<br />
Tunisia 439<br />
Armenia 437<br />
Saudi Arabia 436<br />
Malaysia 426<br />
Syrian Arab Republic 426<br />
Palestinian Nat’l Auth. 420<br />
Georgia 420<br />
Oman 420<br />
Qatar 419<br />
Macedonia, Rep. <strong>of</strong> 407<br />
Lebanon 406<br />
Indonesia 406<br />
Morocco 376<br />
■ The average scale score in science among <strong>Ontario</strong>’s Grade 8 students was at the Intermediate benchmark.<br />
■ No participating jurisdiction had an average scale score at the Advanced benchmark.<br />
95% Con�dence Interval
Average Sc<br />
Grade 8 Science Achievement, Trends in Achievement (Canadian Provinces)<br />
Average Scale Score<br />
600<br />
500<br />
400<br />
300<br />
200<br />
100<br />
0<br />
■ The average scale score for <strong>Ontario</strong>’s Grade 8 students has increased significantly, from 496 to 521, between 1995 and 2011, but there has<br />
been a significant decline between 2003 and 2011.<br />
■ The average for Quebec has increased significantly since 2007, and Alberta’s average has declined slightly, but not significantly, since 1995.<br />
Grade 8 Science, Trends in Achievement (Percentages <strong>of</strong> Students Reaching or Exceeding<br />
the TIMSS Intermediate Benchmark)<br />
Percentage <strong>of</strong> Students (%)<br />
Percentage <strong>of</strong> Students (%)<br />
300<br />
200<br />
100<br />
0<br />
100<br />
80<br />
60<br />
40<br />
20<br />
0<br />
100<br />
80<br />
72%<br />
76%<br />
■ In 2011, the percentage <strong>of</strong> Grade 8 students in <strong>Ontario</strong> reaching the Intermediate benchmark 69% is significantly 68% larger than that on the 1995 first<br />
61%<br />
administration, 60 in 1995.<br />
1999<br />
■ <strong>Results</strong> for Alberta have been steady, at around 85%.<br />
40<br />
n/a n/a<br />
2003<br />
■ <strong>Results</strong> for Quebec have been variable over time; they fell significantly from 2003 to 2007, but increased significantly from 2007 to 2011,<br />
even if they 20 remain statistically lower than in 2003.<br />
2007<br />
0<br />
2011<br />
<strong>Ontario</strong> Alberta Quebec<br />
About TIMSS<br />
496<br />
518 533 526 521<br />
■ TIMSS is coordinated by the International Association for the Evaluation <strong>of</strong> Educational Achievement (IEA).<br />
■ A total <strong>of</strong> 4756 Grade 8 students participated in <strong>Ontario</strong>.<br />
About EQAO: The Education Quality and Accountability Office (EQAO) acts as a catalyst for increasing the success <strong>of</strong><br />
<strong>Ontario</strong> students by measuring their achievement in reading, writing and mathematics against a common curriculum<br />
benchmark. As an independent provincial agency, EQAO plays a pivotal role by conducting province-wide tests at key<br />
points in every student’s primary, junior and secondary education and reporting the results. The objective and reliable facts<br />
obtained add to the current knowledge about student learning and are an important tool for improvement at the individual,<br />
school and provincial levels.<br />
TIMSS_48e_highlights_1212<br />
61%<br />
72%<br />
<strong>Ontario</strong> Alberta Quebec<br />
550 559<br />
n/a<br />
<strong>Ontario</strong> Alberta Quebec<br />
81%<br />
81%<br />
77%<br />
77%<br />
76%<br />
76%<br />
n/a<br />
n/a<br />
n/a<br />
546<br />
83% 87% 85%<br />
n/a<br />
<strong>Ontario</strong> Alberta Quebec<br />
n/a<br />
83% 87% 85%<br />
510<br />
69%<br />
540<br />
83%<br />
83%<br />
531<br />
82%<br />
82%<br />
507<br />
68%<br />
520<br />
76%<br />
2003<br />
2007<br />
2011<br />
1995<br />
1999<br />
2003<br />
2007<br />
2011<br />
1995<br />
1999<br />
2003<br />
2007<br />
2011<br />
December 2012