Green Austria
Green Austria
Green Austria

Create successful ePaper yourself
Turn your PDF publications into a flip-book with our unique Google optimized e-Paper software.
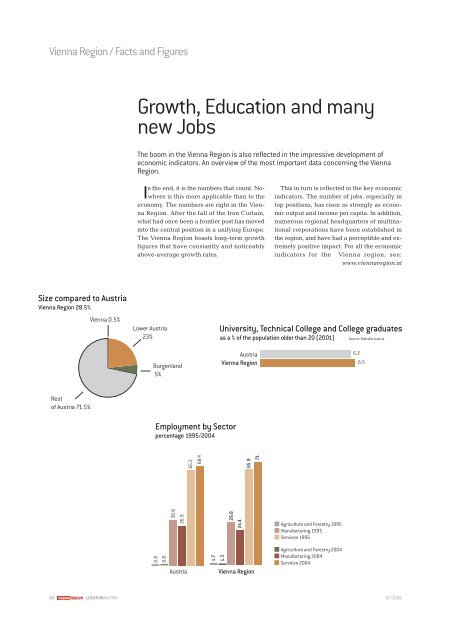
Vienna Region / Facts and Figures<br />
Size compared to <strong>Austria</strong><br />
Vienna Region 28.5%<br />
Rest<br />
of <strong>Austria</strong> 71.5%<br />
Vienna 0.5%<br />
Growth, Education and many<br />
new Jobs<br />
The boom in the Vienna Region is also reflected in the impressive development of<br />
economic indicators. An overview of the most important data concerning the Vienna<br />
Region.<br />
In the end, it is the numbers that count. Nowhere<br />
is this more applicable than to the<br />
economy. The numbers are right in the Vienna<br />
Region. After the fall of the Iron Curtain,<br />
what had once been a frontier post has moved<br />
into the central position in a unifying Europe.<br />
The Vienna Region boasts long-term growth<br />
figures that have constantly and noticeably<br />
above-average growth rates.<br />
Lower <strong>Austria</strong><br />
23%<br />
Burgenland<br />
5%<br />
Employment by Sector<br />
percentage 1995/2004<br />
0.8<br />
0.8<br />
30.8<br />
26.9<br />
65.2<br />
68.4<br />
1.7<br />
1.3<br />
LOISIUM/ROBERT HERBST HAIDEN-BAUMANN<br />
<strong>Austria</strong><br />
Vienna Region<br />
<strong>Austria</strong> Vienna Region<br />
This in turn is reflected in the key economic<br />
indicators. The number of jobs, especially in<br />
top positions, has risen as strongly as economic<br />
output and income per capita. In addition,<br />
numerous regional headquarters of multinational<br />
corporations have been established in<br />
the region, and have had a perceptible and extremely<br />
positive impact. For all the economic<br />
indicators for the Vienna region, see:<br />
www.viennaregion.at<br />
University, Technical College and College graduates<br />
as a % of the population older than 20 (2001) Source: Statistik <strong>Austria</strong><br />
32 LOCATIONAUSTRIA 02/2006<br />
29.8<br />
24.4<br />
65.9<br />
71<br />
Agriculture and Forestry 1995<br />
Manufacturing 1995<br />
Services 1995<br />
Agriculture and Forestry 2004<br />
Manufacturing 2004<br />
Services 2004<br />
6.2<br />
6.5