The Economic Impact of Behavioral Health and Intellectual disAbility Spending on the City of Philadelphia

Create successful ePaper yourself
Turn your PDF publications into a flip-book with our unique Google optimized e-Paper software.
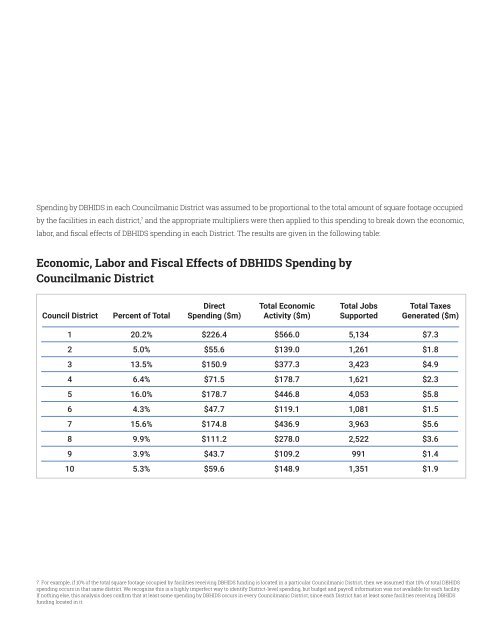
<str<strong>on</strong>g>Spending</str<strong>on</strong>g> by DBHIDS in each Councilmanic District was assumed to be proporti<strong>on</strong>al to <strong>the</strong> total amount <str<strong>on</strong>g>of</str<strong>on</strong>g> square footage occupied<br />
by <strong>the</strong> facilities in each district, 7 <str<strong>on</strong>g>and</str<strong>on</strong>g> <strong>the</strong> appropriate multipliers were <strong>the</strong>n applied to this spending to break down <strong>the</strong> ec<strong>on</strong>omic,<br />
labor, <str<strong>on</strong>g>and</str<strong>on</strong>g> fiscal effects <str<strong>on</strong>g>of</str<strong>on</strong>g> DBHIDS spending in each District. <str<strong>on</strong>g>The</str<strong>on</strong>g> results are given in <strong>the</strong> following table:<br />
<str<strong>on</strong>g>Ec<strong>on</strong>omic</str<strong>on</strong>g>, Labor <str<strong>on</strong>g>and</str<strong>on</strong>g> Fiscal Effects <str<strong>on</strong>g>of</str<strong>on</strong>g> DBHIDS <str<strong>on</strong>g>Spending</str<strong>on</strong>g> by<br />
Councilmanic District<br />
Council District<br />
Percent <str<strong>on</strong>g>of</str<strong>on</strong>g> Total<br />
Direct<br />
<str<strong>on</strong>g>Spending</str<strong>on</strong>g> ($m)<br />
Total <str<strong>on</strong>g>Ec<strong>on</strong>omic</str<strong>on</strong>g><br />
Activity ($m)<br />
Total Jobs<br />
Supported<br />
Total Taxes<br />
Generated ($m)<br />
1 20.2% $226.4 $566.0 5,134 $7.3<br />
2 5.0% $55.6 $139.0 1,261 $1.8<br />
3 13.5% $150.9 $377.3 3,423 $4.9<br />
4 6.4% $71.5 $178.7 1,621 $2.3<br />
5 16.0% $178.7 $446.8 4,053 $5.8<br />
6 4.3% $47.7 $119.1 1,081 $1.5<br />
7 15.6% $174.8 $436.9 3,963 $5.6<br />
8 9.9% $111.2 $278.0 2,522 $3.6<br />
9 3.9% $43.7 $109.2 991 $1.4<br />
10 5.3% $59.6 $148.9 1,351 $1.9<br />
7. For example, if 10% <str<strong>on</strong>g>of</str<strong>on</strong>g> <strong>the</strong> total square footage occupied by facilities receiving DBHIDS funding is located in a particular Councilmanic District, <strong>the</strong>n we assumed that 10% <str<strong>on</strong>g>of</str<strong>on</strong>g> total DBHIDS<br />
spending occurs in that same district. We recognize this is a highly imperfect way to identify District-level spending, but budget <str<strong>on</strong>g>and</str<strong>on</strong>g> payroll informati<strong>on</strong> was not available for each facility.<br />
If nothing else, this analysis does c<strong>on</strong>firm that at least some spending by DBHIDS occurs in every Councilmanic District, since each District has at least some facilities receiving DBHIDS<br />
funding located in it.