VitalSigns-2018

Create successful ePaper yourself
Turn your PDF publications into a flip-book with our unique Google optimized e-Paper software.
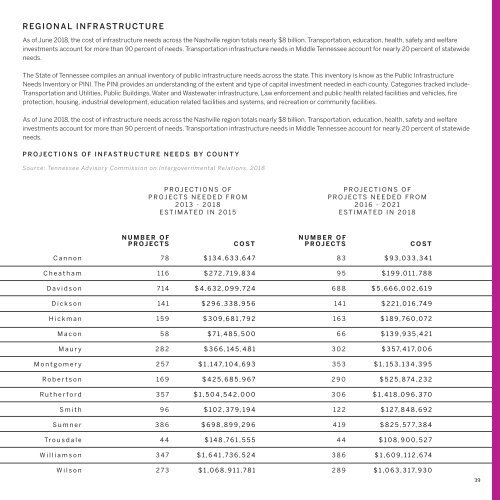
REGIONAL INFRASTRUCTURE<br />
As of June <strong>2018</strong>, the cost of infrastructure needs across the Nashville region totals nearly $8 billion. Transportation, education, health, safety and welfare<br />
investments account for more than 90 percent of needs. Transportation infrastructure needs in Middle Tennessee account for nearly 20 percent of statewide<br />
needs.<br />
The State of Tennessee compiles an annual inventory of public infrastructure needs across the state. This inventory is know as the Public Infrastructure<br />
Needs Inventory or PINI. The PINI provides an understanding of the extent and type of capital investment needed in each county. Categories tracked include-<br />
Transportation and Utilities, Public Buildings, Water and Wastewater infrastructure, Law enforcement and public health related facilities and vehicles, fire<br />
protection, housing, industrial development, education related facilities and systems, and recreation or community facilities.<br />
As of June <strong>2018</strong>, the cost of infrastructure needs across the Nashville region totals nearly $8 billion. Transportation, education, health, safety and welfare<br />
investments account for more than 90 percent of needs. Transportation infrastructure needs in Middle Tennessee account for nearly 20 percent of statewide<br />
needs.<br />
PROJECTIONS OF INFASTRUCTURE NEEDS BY COUNTY<br />
Source: Tennessee Advisory Commission on Intergovernmental Relations, <strong>2018</strong><br />
PROJECTIONS OF<br />
PROJECTS NEEDED FROM<br />
2013 - <strong>2018</strong><br />
ESTIMATED IN 2015<br />
PROJECTIONS OF<br />
PROJECTS NEEDED FROM<br />
2016 - 2021<br />
ESTIMATED IN <strong>2018</strong><br />
NUMBER OF<br />
PROJECTS<br />
COST<br />
NUMBER OF<br />
PROJECTS<br />
COST<br />
Cannon<br />
78<br />
$134,633,647<br />
83<br />
$93,033,341<br />
Cheatham<br />
116<br />
$272,719,834<br />
95<br />
$199,011,788<br />
Davidson<br />
714<br />
$4,632,099,724<br />
688<br />
$5,666,002,619<br />
Dickson<br />
141<br />
$296,338,956<br />
141<br />
$221,016,749<br />
Hickman<br />
159<br />
$309,681,792<br />
163<br />
$189,760,072<br />
Macon<br />
58<br />
$71,485,500<br />
66<br />
$139,935,421<br />
Maury<br />
282<br />
$366,145,481<br />
302<br />
$357,417,006<br />
Montgomery<br />
257<br />
$1,147,104,693<br />
353<br />
$1,153,134,395<br />
Robertson<br />
169<br />
$425,685,967<br />
290<br />
$525,874,232<br />
Rutherford<br />
357<br />
$1,504,542,000<br />
306<br />
$1,418,096,370<br />
Smith<br />
96<br />
$102,379,194<br />
122<br />
$127,848,692<br />
Sumner<br />
386<br />
$698,899,296<br />
419<br />
$825,577,384<br />
Trousdale<br />
44<br />
$148,761,555<br />
44<br />
$108,900,527<br />
Williamson<br />
347<br />
$1,641,736,524<br />
386<br />
$1,609,112,674<br />
Wilson<br />
273<br />
$1,068,911,781<br />
289<br />
$1,063,317,930<br />
39