VitalSigns-2018

You also want an ePaper? Increase the reach of your titles
YUMPU automatically turns print PDFs into web optimized ePapers that Google loves.
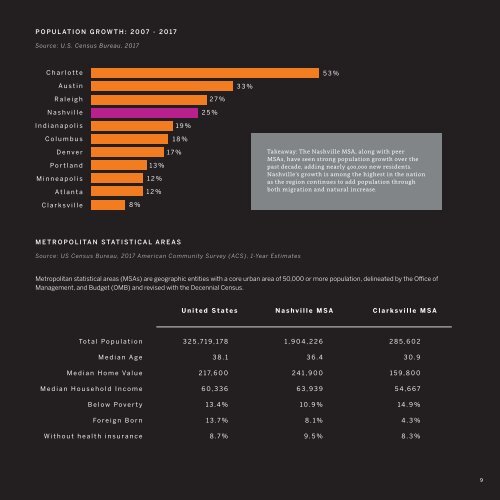
POPULATION GROWTH: 2007 - 2017<br />
Source: U.S. Census Bureau, 2017<br />
Charlotte<br />
53%<br />
Austin<br />
33%<br />
Raleigh<br />
Nashville<br />
27%<br />
25%<br />
Indianapolis<br />
19%<br />
Columbus<br />
18%<br />
Denver<br />
Portland<br />
Minneapolis<br />
Atlanta<br />
13%<br />
12%<br />
12%<br />
17%<br />
Takeaway: The Nashville MSA, along with peer<br />
MSAs, have seen strong population growth over the<br />
past decade, adding nearly 400,000 new residents.<br />
Nashville’s growth is among the highest in the nation<br />
as the region continues to add population through<br />
both migration and natural increase.<br />
Clarksville<br />
8%<br />
METROPOLITAN STATISTICAL AREAS<br />
Source: US Census Bureau, 2017 American Community Survey (ACS), 1-Year Estimates<br />
Metropolitan statistical areas (MSAs) are geographic entities with a core urban area of 50,000 or more population, delineated by the Office of<br />
Management, and Budget (OMB) and revised with the Decennial Census.<br />
United States Nashville MSA Clarksville MSA<br />
Total Population<br />
325,719,178<br />
1,904,226<br />
285,602<br />
Median Age<br />
38.1<br />
36.4<br />
30.9<br />
Median Home Value<br />
217,600<br />
241,900<br />
159,800<br />
Median Household Income<br />
60,336<br />
63,939<br />
54,667<br />
Below Poverty<br />
13.4%<br />
10.9%<br />
14.9%<br />
Foreign Born<br />
13.7%<br />
8.1%<br />
4.3%<br />
Without health insurance<br />
8.7%<br />
9.5%<br />
8.3%<br />
9