VitalSigns-2018

Create successful ePaper yourself
Turn your PDF publications into a flip-book with our unique Google optimized e-Paper software.
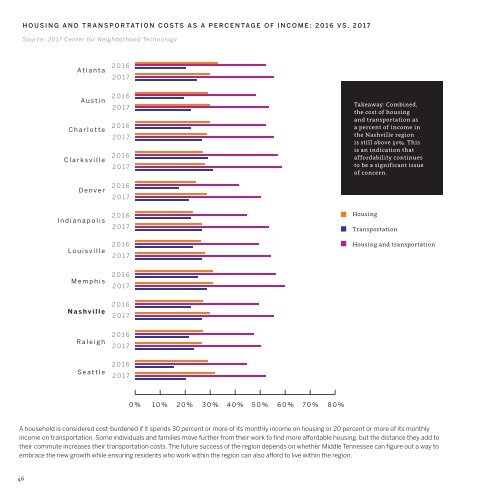
HOUSING AND TRANSPORTATION COSTS AS A PERCENTAGE OF INCOME: 2016 VS. 2017<br />
Source: 2017 Center for Neighborhood Technology<br />
Atlanta<br />
2016<br />
2017<br />
Austin<br />
Charlotte<br />
Clarksville<br />
Denver<br />
2016<br />
2017<br />
2016<br />
2017<br />
2016<br />
2017<br />
2016<br />
2017<br />
Takeaway: Combined,<br />
the cost of housing<br />
and transportation as<br />
a percent of income in<br />
the Nashville region<br />
is still above 50%. This<br />
is an indication that<br />
affordability continues<br />
to be a significant issue<br />
of concern.<br />
Indianapolis<br />
Louisville<br />
2016<br />
2017<br />
2016<br />
2017<br />
Housing<br />
Transportation<br />
Housing and transportation<br />
Memphis<br />
2016<br />
2017<br />
Nashville<br />
2016<br />
2017<br />
Raleigh<br />
2016<br />
2017<br />
Seattle<br />
2016<br />
2017<br />
0% 10% 20% 30% 40% 50% 60% 70% 80%<br />
A household is considered cost-burdened if it spends 30 percent or more of its monthly income on housing or 20 percent or more of its monthly<br />
income on transportation. Some individuals and families move further from their work to find more affordable housing, but the distance they add to<br />
their commute increases their transportation costs. The future success of the region depends on whether Middle Tennessee can figure out a way to<br />
embrace the new growth while ensuring residents who work within the region can also afford to live within the region.<br />
46