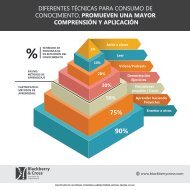
Optimizing Patient Flow in Ambulatory Clinic Setting
Acceda a la documentación, presentación, del webinar entregado el 24.10.2019, gracias a nuestro aliado, MoreSteam. Más información www.blackberrycross.com
Acceda a la documentación, presentación, del webinar entregado el 24.10.2019, gracias a nuestro aliado, MoreSteam.
Más información www.blackberrycross.com
- No tags were found...

Create successful ePaper yourself
Turn your PDF publications into a flip-book with our unique Google optimized e-Paper software.
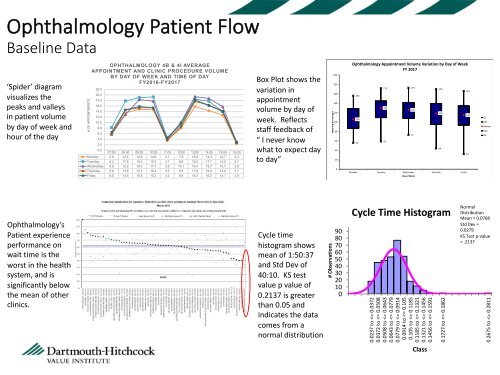
Ophthalmology <strong>Patient</strong> <strong>Flow</strong><br />
Basel<strong>in</strong>e Data<br />
‘Spider’ diagram<br />
visualizes the<br />
peaks and valleys<br />
<strong>in</strong> patient volume<br />
by day of week and<br />
hour of the day<br />
# OF APPOINTMENTS<br />
OPHTHALMOLOGY 4B & 4I AVERAGE<br />
APPOINTMENT AND CLINIC PROCEDURE VOLUME<br />
BY DAY OF WEEK AND TIME OF DAY<br />
FY2016-FY2017<br />
22.0<br />
20.0<br />
18.0<br />
16.0<br />
14.0<br />
12.0<br />
10.0<br />
8.0<br />
6.0<br />
4.0<br />
2.0<br />
0.0<br />
07:00 08:00 09:00 10:00 11:00 12:00 13:00 14:00 15:00 16:00<br />
Monday 5.6 13.5 14.8 14.6 3.7 7.9 15.8 14.3 12.7 2.3<br />
Tuesday 8.2 17.8 19.0 19.3 4.7 8.9 18.5 17.7 14.0 2.7<br />
Wednesday 5.8 12.9 18.3 17.7 3.8 10.1 19.4 18.7 15.7 2.9<br />
Thursday 5.6 14.6 15.3 15.4 3.5 8.5 17.6 16.4 14.0 2.7<br />
Friday 6.5 14.6 15.8 15.3 4.3 9.8 18.2 16.2 14.1 2.9<br />
Box Plot shows the<br />
variation <strong>in</strong><br />
appo<strong>in</strong>tment<br />
volume by day of<br />
week. Reflects<br />
staff feedback of<br />
“ I never know<br />
what to expect day<br />
to day”<br />
200<br />
180<br />
160<br />
140<br />
e<br />
m120<br />
lu<br />
o<br />
V<br />
t<br />
n<br />
e100<br />
tm<br />
<strong>in</strong><br />
o<br />
p<br />
A 80<br />
60<br />
40<br />
20<br />
0<br />
Ophthalmology Appo<strong>in</strong>tment Volume Variation by Day of Week<br />
FY 2017<br />
156<br />
106<br />
56<br />
172 173<br />
130<br />
59<br />
Monday Tuesday Wednesday Thursday Friday<br />
126<br />
73<br />
Day of Week<br />
170<br />
119<br />
44<br />
166<br />
115<br />
32<br />
Q1<br />
M<strong>in</strong><br />
Median<br />
Max<br />
Q3<br />
Ophthalmology’s<br />
<strong>Patient</strong> experience<br />
performance on<br />
wait time is the<br />
worst <strong>in</strong> the health<br />
system, and is<br />
significantly below<br />
the mean of other<br />
cl<strong>in</strong>ics.<br />
Cycle time<br />
histogram shows<br />
mean of 1:50:37<br />
and Std Dev of<br />
40:10. KS test<br />
value p value of<br />
0.2137 is greater<br />
than 0.05 and<br />
<strong>in</strong>dicates the data<br />
comes from a<br />
normal distribution<br />
# Observations<br />
90<br />
80<br />
70<br />
60<br />
50<br />
40<br />
30<br />
20<br />
10<br />
0<br />
Cycle Time Histogram<br />
0.0237 to