Asian Sky Quarterly - Q4 2019

Create successful ePaper yourself
Turn your PDF publications into a flip-book with our unique Google optimized e-Paper software.
FOURTH QUARTER <strong>2019</strong><br />
FOREWORD<br />
WU ZHENDONG<br />
CHAIRMAN, ASBAA<br />
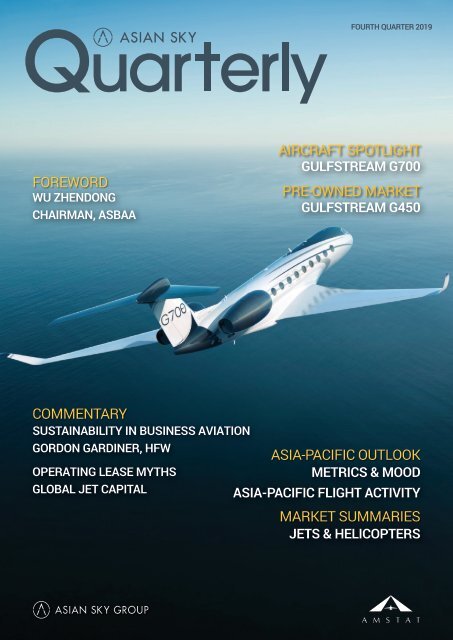
AIRCRAFT SPOTLIGHT<br />
GULFSTREAM G700<br />
PRE-OWNED MARKET<br />
GULFSTREAM G450<br />
COMMENTARY<br />
SUSTAINABILITY IN BUSINESS AVIATION<br />
GORDON GARDINER, HFW<br />
OPERATING LEASE MYTHS<br />
GLOBAL JET CAPITAL<br />
ASIA-PACIFIC OUTLOOK<br />
METRICS & MOOD<br />
ASIA-PACIFIC FLIGHT ACTIVITY<br />
MARKET SUMMARIES<br />
JETS & HELICOPTERS
It’s time to consider<br />
CorporateCare® Enhanced<br />
考 虑 采 用 增 强 版 CorporateCare®<br />
的 最 佳 时 机 到 了<br />
That’s why Rolls-Royce now offers expanded line maintenance coverage on all<br />
engines and nacelle coverage on all later engine models.<br />
罗 尔 斯 - 罗 伊 斯 对 其 全 系 发 动 机 提 供 覆 盖 更 全 面 的 航 线 维 护 , 并 且 对 未 来 新 型 发 动<br />
机 提 供 涵 盖 短 舱 部 件 服 务 。<br />
The future. Rolls-Royce.<br />
未 来 在 这 里 , 罗 尔 斯 - 罗 伊 斯
CONTENTS<br />
05<br />
ECONOMICS<br />
Overview of the Asia-Pacific region’s current status and<br />
specific country’s GDP versus their business jet and<br />
helicopter fleet size.<br />
30<br />
PRE-OWNED MARKET ANALYSIS<br />
GULFSTREAM G450<br />
A comprehensive market performance analysis of the preowned<br />
Gulfstream G450 market.<br />
11<br />
MOOD & INTENTIONS<br />
Results of our survey on the Asia-Pacific region’s outlook on<br />
economic status, aircraft utilization, purchase intentions and<br />
influencing factors.<br />
36<br />
MARKET DYNAMICS<br />
An analysis of inventory levels, market trends and the<br />
changing price signals for the business jet and helicopter<br />
fleets in the Asia-Pacific region.<br />
16<br />
19<br />
24<br />
AIRCRAFT SPOTLIGHT<br />
GULFSTREAM G700<br />
A look at the all-new G700 TM<br />
— the largest aircraft in the<br />
Gulfstream family, optimized to deliver an unparalleled<br />
experience.<br />
SPECIAL FEATURE<br />
ASIA-PACIFIC FLIGHT ACTIVITY BY WINGX<br />
A look at the flight activity in <strong>Q4</strong>, including most popular<br />
flight routes and activities by OEM.<br />
COMMENTARY<br />
TOP FIVE MYTHS ABOUT OPERATING LEASES<br />
BY GLOBAL JET CAPITAL<br />
An explanation of the most common myths about operating<br />
leases and advantages of this financing option.<br />
44<br />
48<br />
65<br />
SPECIAL FEATURE<br />
BUSINESS JET OPERATIONAL TIPS<br />
Information from Universal Weather & Aviation on operating<br />
a business jet in Japan.<br />
MARKET SUMMARY - JETS<br />
A look at market position and average days on market of<br />
featured pre-owned business jets.<br />
MARKET SUMMARY – HELICOPTERS<br />
A look at market position and average days on market of<br />
featured pre-owned helicopters.<br />
26<br />
COMMENTARY<br />
GOING GREEN BY HFW<br />
An overview of the current industry initiatives relating to<br />
sustainability and the developing regulatory environment.<br />
PUBLISHER<br />
EDITORIAL & MARKET RESEARCH<br />
Litalia Yoakum<br />
Bowen Zhang<br />
Maggie Gu<br />
Apple Cheung<br />
DESIGN<br />
Aya Leung<br />
Michael Wong<br />
The materials and information provided by <strong>Asian</strong><br />
<strong>Sky</strong> Group Limited (“ASG”) in this report is for<br />
reference only. Any information we provide about<br />
how we may interpret the data and market, or<br />
how certain issues may be addressed is provided<br />
generally without considering your specific<br />
circumstances. Such information should not be<br />
regarded as a substitute for professional advice.<br />
Independent professional advice should be sought<br />
before taking action on any matters to which<br />
information provided in this report may be relevant.<br />
ASG shall not be liable for any losses, damage, costs<br />
or expenses howsoever caused, arising directly or<br />
indirectly from the use of or inability to use this report<br />
or use of or reliance upon any information or material<br />
provided in this report or otherwise in connection with<br />
any representation, statement or information on or<br />
contained in this report.<br />
ASG endeavors to ensure that the information<br />
contained in this report is accurate as at the date<br />
of publication, but does not guarantee or warrant<br />
its accuracy or completeness, or accept any liability<br />
of whatever nature for any losses, damage, costs<br />
or expenses howsoever caused, whether arising<br />
directly or indirectly from any error or omission in<br />
compiling such information. This report also uses<br />
third party information not compiled by ASG. ASG<br />
is not responsible for such information and makes<br />
no representation about the accuracy, completeness<br />
or any other aspect of information contained. The<br />
information, data, articles, or resources provided by<br />
any other parties do not in any way signify that ASG<br />
endorses the same.<br />
ADVERTISING/AIRCRAFT SALES ENQUIRIES:<br />
sales@asianskygroup.com<br />
<strong>Asian</strong> <strong>Sky</strong> Group<br />
Suite 1401, 14 Floor, Fortis Tower<br />
77-79 Gloucester Road, Wan Chai, Hong Kong<br />
Tel: (852) 2235 9222 | Fax: (852) 2528 2766<br />
sales@asianskygroup.com<br />
www.asianskygroup.com | www.asianskymedia.com<br />
FOURTH QUARTER <strong>2019</strong> — ASIAN SKY QUARTERLY | 1
PUBLISHER’S NOTE<br />
As we enter into 2020, this edition of <strong>Asian</strong> <strong>Sky</strong> <strong>Quarterly</strong> gives us the<br />
full picture of <strong>2019</strong>, which was unquestionably quite gloomy. <strong>2019</strong> was<br />
a challenging year for Greater China, considering the economy, the<br />
US/China trade dispute and most recently the outbreak of a virus –<br />
impacting travel and businesses across the board.<br />
Each quarter of <strong>2019</strong> saw business confidence down and a great deal of<br />
economic pessimism, translating to more ‘I’m not sure’ when it comes<br />
to purchase intentions and a shift to a ‘Buyer’s Market’. Although, preowned<br />
aircraft purchase intentions are slightly up, which makes this<br />
a good time for models like the G450 – which we’ve analysed in this<br />
edition of the Report. Still, the G450 isn’t exactly the benchmark for the<br />
rest of the market as inventory values continue to go up and we see<br />
fewer and fewer transactions compared to 2018. This, of course, leads<br />
to major differences in buyer and seller pricing expectations.<br />
In <strong>Q4</strong>, almost all regions – with the exception of Central Asia – reported<br />
increased economic optimism levels; albeit still low. And, of course, we<br />
may not see this sentiment remain as we move into Q1 due to recent<br />
events in the region.<br />
In terms of flight activity, Greater China’s aircraft utilization continued<br />
to worsen – with the highest decrease in the region. This was driven by<br />
an 18% y-o-y decrease in flights departing from Mainland China. Still,<br />
the Beijing Airport remained one of the busiest for outbound flights. The<br />
silver lining of the region came via growth in business jet flights activity<br />
in Japan, Singapore, Thailand and Vietnam.<br />
To complement this, we’ll also be releasing an episode of <strong>Asian</strong> <strong>Sky</strong>cast<br />
featuring Gulfstream’s Charles Etter speaking on sustainability – a<br />
very topical point in 2020. On that same note, we have commentary<br />
from law firm HFW speaking on the developing regulatory environment<br />
surrounding ‘Going Green’ in business aviation. Global Jet Capital also<br />
shares insights on the ‘Top 5 Myths About Operating Leases’. Universal<br />
Weather & Aviation gives an update on operational requirements for<br />
business jets flying into Japan. And, with the help of Wing-X, we provide<br />
an in-depth analysis of regional flight activity. Finally, Zhendong Wu<br />
– AsBAA Chairman – shares his thoughts on the coming year in our<br />
Foreword and gives an update on AsBAA’s role at the upcoming ABACE<br />
show in April.<br />
And, for our readers, our goal in 2020 is to continue updating you on<br />
the most relevant and topical information on the business and general<br />
aviation in the Asia Pacific through all of our platforms.<br />
As Greater China and particularly Mainland China lose their status as<br />
growth driver in the region, we may see Southeast Asia take the reign<br />
in coming quarters.<br />
With all that being said, as we enter into a new Lunar Year – the Year<br />
of the Rat – we hear well wishes for prosperity, happiness and good<br />
fortune – all sentiments we can certainly hope for in the year ahead.<br />
Still, all is not gloom for us at ASG and in business aviation. This first<br />
<strong>Asian</strong> <strong>Sky</strong> <strong>Quarterly</strong> is being released at the Singapore Airshow. It’s<br />
packed with more data and more insights than before. On the cover,<br />
you’ll see Gulfstream’s G700 and likewise it’s spotlighted in this issue.<br />
Sincerely,<br />
Jeffrey C. Lowe<br />
Managing Director, <strong>Asian</strong> <strong>Sky</strong> Group<br />
SPECIAL THANKS TO OUR CONTRIBUTORS:<br />
2 | ASIAN SKY QUARTERLY — FOURTH QUARTER <strong>2019</strong>
FOREWORD<br />
Dear Colleagues and Friends,<br />
It gives me great honour to have the opportunity to address you through<br />
this platform. We are now in a new decade, a new year, and a new Lunar<br />
Year. The year this far has brought challenges and unprecedented levels<br />
of global issues. However, the Year of the Rat suggests characteristics<br />
of being industrious and thrifty, diligent and positive. Whether we choose<br />
to accept or align with zodiac suggestions, these are characteristics<br />
that will serve us well in challenging times.<br />
To be industrious will allow us to diversify and expand business models,<br />
without relying on stagnating or unproductive markets. To be thrifty<br />
forces us to consider resource sharing, efficiency boosting, and smart<br />
business models. To be diligent encourages effective safety practices,<br />
human resources measures, and smooth, effective operations. To be<br />
positive will be the driving force that asks us to navigate problems by<br />
seeing them as opportunities to improve, to evolve, to lead by example<br />
and to be solution oriented. If we keep these principles in mind, we may<br />
well navigate challenging times with more ease than we first expected.<br />
At AsBAA, core to our mission is to problem solve. We do this by<br />
working with communities to understand the issues that affect us all.<br />
We work with our members to represent their needs, and advocate<br />
on their behalf. In 2020, we are honoured and excited to deliver more<br />
enhanced support in mainland China, Hong Kong and the Greater Bay<br />
Area, Singapore, Philippines, Malaysia and Thailand. We encourage you<br />
to join and support your association. We are stronger together.<br />
ABOUT ASBAA:<br />
AsBAA’s mission is to represent the needs of its members<br />
and the wider industry through its three core pillars:<br />
Advocacy, Representation and Community. The association<br />
actively advocates the benefits of business aviation to key<br />
stakeholders such as government, transport ministries and<br />
the media. It represents the interests of all sectors of the<br />
business and general aviation industry across the region, and<br />
creates a community in which members can network, access<br />
B2B opportunities, and tackle common issues with greater<br />
collective influence.<br />
Best Wishes,<br />
Zhendong Wu<br />
Chairman, AsBAA<br />
FOURTH QUARTER <strong>2019</strong> — ASIAN SKY QUARTERLY | 3
Malaysia | Mainland China | Singapore | Hong Kong SAR | Philippines<br />
AsBAA Safety Days 2020<br />
Promoting<br />
Best Safety Practices<br />
in Asia<br />
Sponsorship and Speaking Opportunities Open<br />
#AsBAASafetyDays<br />
www.asbaa.org<br />
4 | ASIAN SKY QUARTERLY — FOURTH QUARTER <strong>2019</strong>
ECONOMICS<br />
GREATER CHINA<br />
ASIA PACIFIC REGION CIVIL HELICOPTER<br />
FLEET REPORT YEAR END <strong>2019</strong><br />
NOW AVAILABLE<br />
MAINLAND CHINA, HONG KONG, MACAU & TAIWAN<br />
Mainland China<br />
China’s 6% annual GDP growth in Q3 was the weakest pace in<br />
over 27 years. The slowed GDP growth is below both Q2’s 6.2%<br />
expansion and the 6.1% increase expected by market analysts.<br />
Nevertheless, growth is still within the government’s target<br />
of between 6.0% and 6.5% for <strong>2019</strong>. The weak economic pace<br />
comes as demand at home and abroad declines, led by the<br />
manufacturing sector.<br />
Hong Kong<br />
Hong Kong’s Q3 GDP contracted by 2.9% in Q3 from the previous<br />
year, marking its first year-on-year decline since the recession<br />
of 2009. The Q3 reading comes after 0.4% growth y-o-y in Q2.<br />
The main contributing factors in Q3 were decreased investment<br />
demand and consumption, as social unrest continues.<br />
GDP GROWTH (BILLION USD)<br />
Mainland China Taiwan<br />
$11,008 $11,138 $12,134<br />
$525<br />
$531<br />
$579<br />
$309<br />
$321<br />
$342<br />
$45<br />
$45<br />
$51<br />
2015<br />
2016<br />
2017<br />
Hong Kong<br />
$13,608<br />
$589<br />
$363<br />
$55<br />
2018<br />
Macau<br />
$14,230<br />
$603<br />
$354<br />
$50<br />
<strong>2019</strong>Q3<br />
Taiwan<br />
Taiwan’s economy grew 2.91% y-o-y in Q3, up from 2.4% in Q2.<br />
Private consumption increased, supported by rising wages, as well<br />
as government spending. Similarly export of goods and services<br />
increased 4.3% in Q3.<br />
Source: Focus Economics & Trading Economics<br />
PURCHASING MANAGER’S INDEX<br />
Mainland China Taiwan Hong Kong<br />
53.0%<br />
51.0%<br />
49.0%<br />
47.0%<br />
45.0%<br />
43.0%<br />
41.0%<br />
39.0%<br />
Expansion Contraction<br />
37.0%<br />
Dec19<br />
Nov19<br />
Oct19<br />
Sep19<br />
Aug19<br />
Jul19<br />
Jun19<br />
May19<br />
Apr19<br />
Mar19<br />
Feb19<br />
Jan19<br />
Dec18<br />
* Data Source: Trading Economics<br />
FLEET SIZE GROWTH:<br />
BUSINESS JET<br />
FLEET SIZE GROWTH:<br />
TURBINE HELICOPTER<br />
FLEET SIZE GROWTH:<br />
TUROPROPS<br />
Mainland China Taiwan Mainland China Taiwan Mainland China Taiwan<br />
Hong Kong<br />
Macau<br />
Hong Kong<br />
Hong Kong<br />
313<br />
344 338 679<br />
719<br />
313<br />
157<br />
164<br />
495<br />
581<br />
133<br />
184<br />
129<br />
135<br />
135<br />
122<br />
10<br />
27<br />
28<br />
24 25<br />
5<br />
27<br />
25<br />
25<br />
21<br />
23<br />
11<br />
19<br />
10<br />
9<br />
9 15<br />
15<br />
5<br />
4<br />
5<br />
3<br />
4<br />
2<br />
2016 2017 2018 <strong>2019</strong><strong>Q4</strong> 2016 2017 2018 <strong>2019</strong><strong>Q4</strong> 2016 2017 2018 <strong>2019</strong><strong>Q4</strong><br />
* Data Source: Amstat & ASG. Estimated number based on projection of Amstat data. For most up-to-date info, please refer to our Helicopter Fleet Report and the upcoming Business Jet Fleet Report.<br />
FOURTH QUARTER <strong>2019</strong> — ASIAN SKY QUARTERLY | 5
ECONOMICS<br />
AUSTRALASIA<br />
AUSTRALIA, NEW ZEALAND & PAPUA NEW GUINEA<br />
Australia<br />
The Australian economy advanced a seasonally adjusted 0.4<br />
percent in the September quarter of <strong>2019</strong>, slowing from an<br />
upwardly revised 0.6 percent growth in the previous period<br />
and missing market expectations of a 0.5 percent expansion.<br />
Government spending eased and household consumption<br />
expanded at its weakest pace since the global financial crisis.<br />
Through the year to the third quarter, the economy grew 1.7<br />
percent, following an upwardly revised 1.6 percent expansion in<br />
the June quarter.<br />
GDP GROWTH (BILLION USD)<br />
Australia New Zealand Papua New Guinea<br />
$1,352<br />
$1,210<br />
$1,331 $1,432 $1,451<br />
$177<br />
$188<br />
$203<br />
$205<br />
$209<br />
New Zealand<br />
New Zealand’s economy grew 0.7% quarter-on-quarter in Q3, well<br />
above Q2’s revised 0.1% growth. On an annual basis, the economy<br />
rose 2.3%. Accelerated growth in Q3 is attributed to increased<br />
domestic demand — household spending expanded 0.8% from<br />
0.4% the previous quarter.<br />
$22<br />
$21<br />
$22<br />
$23<br />
$23<br />
2015 2016 2017 2018 <strong>2019</strong>Q3<br />
PURCHASING MANAGER’S INDEX<br />
Australia<br />
New Zealand<br />
Source: Focus Economics and Trading Economics<br />
56.0%<br />
54.0%<br />
52.0%<br />
50.0%<br />
48.0%<br />
46.0%<br />
Expansion Contraction<br />
44.0%<br />
Dec19<br />
Nov19<br />
Oct19<br />
Sep19<br />
Aug19<br />
Jul19<br />
Jun19<br />
May19<br />
Apr19<br />
Mar19<br />
Feb19<br />
Jan19<br />
Dec18<br />
* Data Source: Trading Economics<br />
FLEET SIZE GROWTH:<br />
BUSINESS JET<br />
FLEET SIZE GROWTH:<br />
TURBINE HELICOPTER<br />
FLEET SIZE GROWTH:<br />
TUROPROPS<br />
Australia New Zealand<br />
Australia New Zealand<br />
Australia New Zealand<br />
Papua New Guinea Papua New Guinea Papua New Guinea<br />
181<br />
186<br />
185<br />
196<br />
808<br />
832<br />
853 855 410<br />
428<br />
433<br />
432<br />
462<br />
478<br />
511<br />
537<br />
15<br />
16<br />
19<br />
18<br />
49<br />
51<br />
54<br />
56<br />
4<br />
4<br />
4 4<br />
107<br />
104<br />
116<br />
101<br />
23<br />
22<br />
23<br />
28<br />
2016 2017 2018 <strong>2019</strong><strong>Q4</strong> 2016 2017 2018 <strong>2019</strong><strong>Q4</strong> 2016 2017 2018 <strong>2019</strong><strong>Q4</strong><br />
* Data Source: Amstat & ASG. Estimated number based on projection of Amstat data. For most up-to-date info, please refer to our Helicopter Fleet Report and the upcoming Business Jet Fleet Report.<br />
6 | ASIAN SKY QUARTERLY — FOURTH QUARTER <strong>2019</strong>
ECONOMICS<br />
EAST ASIA & CENTRAL ASIA<br />
JAPAN, SOUTH KOREA & INDIA<br />
Japan<br />
Japan’s economy grew an annualized 1.8% in Q3, much higher<br />
than initial estimates of 0.2% expansion. Private consumption<br />
and capital expenditure increased faster than initially thought<br />
while net external demand contributed negatively to the<br />
expansion.<br />
GDP GROWTH (BILLION USD)<br />
Japan<br />
South Korea<br />
$4,927 $4,860<br />
$4,389<br />
$4,971<br />
India<br />
$5,011<br />
South Korea<br />
South Korea’s grew 0.4% quarter-on-quarter, lower than market<br />
expectations and less than the Q2 1% q-o-q rate. The slowed rate<br />
is the result of significant slowdown in consumption expenditure,<br />
as well as the third consecutive quarter of contracting in the<br />
goods-exporting sector.<br />
$2,095<br />
$1,378<br />
$2,274<br />
$1,415<br />
$2,597<br />
$1,531<br />
$2,769<br />
$1,619<br />
$2,833<br />
$1,636<br />
India<br />
Growth in India continued to slow in Q3, attributed to a slump in<br />
manufacturing output. The annual GDP estimation of 5.6% growth<br />
has been cut to 4.6%, with analysts citing the credit squeeze and<br />
decreased business and consumer confidence.<br />
2015 2016 2017 2018 <strong>2019</strong>Q3<br />
PURCHASING MANAGER’S INDEX<br />
Japan South Korea India<br />
55.0%<br />
Source: Focus Economics and Trading Economics<br />
53.0%<br />
51.0%<br />
49.0%<br />
47.0%<br />
Expansion Contraction<br />
45.0%<br />
Dec19<br />
Nov19<br />
Oct19<br />
Sep19<br />
Aug19<br />
Jul19<br />
Jun19<br />
May19<br />
Apr19<br />
Mar19<br />
Feb19<br />
Jan19<br />
Dec18<br />
* Data Source: Trading Economics<br />
FLEET SIZE GROWTH:<br />
BUSINESS JET<br />
FLEET SIZE GROWTH:<br />
TURBINE HELICOPTER<br />
FLEET SIZE GROWTH:<br />
TUROPROPS<br />
Japan South Korea India Japan South Korea India Japan<br />
South Korea India<br />
138<br />
140<br />
140<br />
646<br />
647<br />
646<br />
663<br />
134<br />
155<br />
155<br />
111<br />
97<br />
94<br />
92<br />
78<br />
73<br />
54<br />
54<br />
55<br />
21<br />
21<br />
19<br />
33<br />
13<br />
286<br />
291<br />
287<br />
285<br />
16<br />
16<br />
19<br />
17<br />
222<br />
227<br />
229<br />
233<br />
2016 2017 2018 <strong>2019</strong><strong>Q4</strong> 2016 2017 2018 <strong>2019</strong><strong>Q4</strong> 2016 2017 2018 <strong>2019</strong><strong>Q4</strong><br />
* Data Source: Amstat & ASG. Estimated number based on projection of Amstat data. For most up-to-date info, please refer to our Helicopter Fleet Report and the upcoming Business Jet Fleet Report.<br />
FOURTH QUARTER <strong>2019</strong> — ASIAN SKY QUARTERLY | 7
ECONOMICS<br />
SOUTHEAST ASIA<br />
THAILAND, MALAYSIA, SINGAPORE, INDONESIA & PHILIPPINES<br />
Thailand<br />
Growth in Thailand slowed to 2.4% y-o-y in Q3, up slightly from<br />
2.3% in Q2. The slowed growth reflected ongoing troubles in the<br />
external sector, amid the regional trade war, while the strong baht<br />
has impacted the tourism sector.<br />
Malaysia<br />
Malaysia’s economy has expanded 4.4% y-o-y in Q3, following 4.9%<br />
growth in Q2. This was the weakest GDP growth since the third<br />
quarter last year on the back of heightening global uncertainty and<br />
ongoing trade tensions. Growth was mainly driven by rises in both<br />
private consumption and government spending.<br />
GDP GROWTH (BILLION USD)<br />
Singapore Thailand Malaysia<br />
$474<br />
$455<br />
$412<br />
$395<br />
$364<br />
$338<br />
$308<br />
$318<br />
$354<br />
$314<br />
$296<br />
$297<br />
$482<br />
$367<br />
$365<br />
Singapore<br />
Singapore’s economy picked up its growth pace in Q3, with a growth<br />
rate of 0.5%. On a quarterly basis, the city-state’s GDP expanded by<br />
2.1% in Q3. Growth was supported by the finance and insurance<br />
sectors, as well as information and communications sector, which<br />
is attributed to the demand for IT solutions.<br />
2015 2016<br />
2017 2018 <strong>2019</strong>Q3<br />
PURCHASING MANAGER’S INDEX<br />
Singapore Thailand Malaysia<br />
53.0%<br />
Source: Focus Economics and Trading Economics<br />
51.0%<br />
49.0%<br />
47.0%<br />
Expansion Contraction<br />
45.0%<br />
Dec19<br />
Nov19<br />
Oct19<br />
Sep19<br />
Aug19<br />
Jul19<br />
Jun19<br />
May19<br />
Apr19<br />
Mar19<br />
Feb19<br />
Jan19<br />
Dec18<br />
* Data Source: Trading Economics<br />
FLEET SIZE GROWTH:<br />
BUSINESS JET<br />
FLEET SIZE GROWTH:<br />
TURBINE HELICOPTER<br />
FLEET SIZE GROWTH:<br />
TUROPROPS<br />
Singapore Thailand Malaysia Singapore Thailand Malaysia Singapore Thailand<br />
Malaysia<br />
64<br />
60<br />
54<br />
56<br />
57<br />
59<br />
154<br />
157<br />
161<br />
153<br />
40<br />
42<br />
44<br />
48<br />
53<br />
106<br />
111<br />
111<br />
116<br />
33<br />
34<br />
28<br />
25<br />
19<br />
38<br />
37<br />
40<br />
30<br />
4<br />
6<br />
6<br />
7<br />
6<br />
5<br />
9<br />
8<br />
2016 2017 2018 <strong>2019</strong><strong>Q4</strong> 2016 2017 2018 <strong>2019</strong><strong>Q4</strong> 2016 2017 2018 <strong>2019</strong><strong>Q4</strong><br />
* Data Source: Amstat & ASG. Estimated number based on projection of Amstat data. For most up-to-date info, please refer to our Helicopter Fleet Report and the upcoming Business Jet Fleet Report.<br />
8 | ASIAN SKY QUARTERLY — FOURTH QUARTER <strong>2019</strong>
ECONOMICS<br />
Philippines<br />
The GDP in the Philippines grew 6.2% y-o-y in Q3 of <strong>2019</strong>, up<br />
from 5.5% growth in Q2. Trade and Repair of Motor Vehicles,<br />
Motorcycles, Personal and Household Goods; Construction; and<br />
Financial Intermediation were the main drivers of growth for the<br />
quarter. Among the major economic sectors, Services posted the<br />
fastest growth with 6.9 percent. Industry grew by 5.6 percent.<br />
Agriculture, Hunting, Forestry and Fishing registered a growth of<br />
3.1 percent.<br />
GDP GROWTH (BILLION USD)<br />
Indonesia Philippines<br />
$1,016<br />
$932<br />
$862<br />
$1,042<br />
$1,113<br />
Indonesia<br />
Indonesia’s economy expanded 5.02% in Q3, which marked the<br />
slowed growth level in two years. Weak investment and low<br />
government spending, as well as low commodity prices, dragged<br />
down growth in Q3 — all amid an uncertain political situation and<br />
the regional trade dispute.<br />
Source: Focus Economics and Trading Economics<br />
$292<br />
$305<br />
$314<br />
$331<br />
$344<br />
2015 2016 2017 2018 <strong>2019</strong>Q3<br />
PURCHASING MANAGER’S INDEX<br />
Indonesia Philippines<br />
55.0%<br />
53.0%<br />
51.0%<br />
49.0%<br />
47.0%<br />
Expansion Contraction<br />
45.0%<br />
Dec19<br />
Nov19<br />
Oct19<br />
Sep19<br />
Aug19<br />
Jul19<br />
Jun19<br />
May19<br />
Apr19<br />
Mar19<br />
Feb19<br />
Jan19<br />
Dec18<br />
* Data Source: Trading Economics<br />
FLEET SIZE GROWTH:<br />
BUSINESS JET<br />
FLEET SIZE GROWTH:<br />
TURBINE HELICOPTER<br />
FLEET SIZE GROWTH:<br />
TUROPROPS<br />
Indonesia Philippines Indonesia Philippines Indonesia Philippines<br />
50<br />
220<br />
117<br />
116<br />
119<br />
51 203<br />
48<br />
48<br />
208<br />
207<br />
104<br />
47<br />
47<br />
46<br />
43<br />
156<br />
162<br />
163<br />
167<br />
52<br />
57<br />
59<br />
62<br />
2016 2017 2018 <strong>2019</strong><strong>Q4</strong> 2016 2017 2018 <strong>2019</strong><strong>Q4</strong> 2016 2017 2018 <strong>2019</strong><strong>Q4</strong><br />
* Data Source: Amstat & ASG. Estimated number based on projection of Amstat data. For most up-to-date info, please refer to our Helicopter Fleet Report and the upcoming Business Jet Fleet Report.<br />
FOURTH QUARTER <strong>2019</strong> — ASIAN SKY QUARTERLY | 9
G+4+5+6+7+8+10+12+14+15<br />
MOOD & INTENTIONS:<br />
ASIA-PACIFIC REGION SURVEY <strong>2019</strong><strong>Q4</strong><br />
RESPONDENT LOCATION<br />
34+27+25+9+5+G<br />
Rest of the World (5%)<br />
Oceania (9%)<br />
SE & NE<br />
Asia (25%)<br />
410 +<br />
RESPONDENTS<br />
Central Asia (34%)<br />
Greater China (27%)<br />
RESPONDENT AIRCRAFT TYPE<br />
59+21+20+G<br />
Turboprop (20%) Business Jet (56%)<br />
Civil Helicopter<br />
(24%)<br />
RESPONDENT CATEGORY<br />
Owner /<br />
Charter User (7%)<br />
Broker (11%)<br />
Others**<br />
(21%)<br />
Aircraft Operator<br />
/Management<br />
Company (25%)<br />
36+25+21+11+7+G<br />
Aircraft Service<br />
Providers* (36%)<br />
In the fourth quarter of <strong>2019</strong>, over 410 respondents participated<br />
in ASG’s survey regarding the mood and intentions of the current<br />
business aviation market.<br />
Regions with the most respondents include:<br />
1. Central Asia (140 valid respondents, including India, Pakistan, UAE,<br />
etc.)<br />
2. Greater China (112 valid respondents, including Mainland China,<br />
Hong Kong, Macau, and Taiwan)<br />
3. Southeast and Northeast Asia (106 valid respondents, including<br />
Malaysia, Indonesia, Singapore, Brunei, Philippines, Thailand,<br />
Myanmar, Cambodia, Laos, Vietnam, Japan, and South Korea)<br />
4. Oceania (38 valid respondents, including Australia and New Zealand)<br />
61% of the respondents from this quarter’s survey are from aircraft<br />
services providers (FBO, MRO, etc.) and aircraft operators, as well as from<br />
aircraft brokers (11%), aircraft end users (7%) and other related areas.<br />
* Aircraft Serice Providers include: financial services, training, FBO, ground<br />
handlers, MRO, parts, etc.<br />
** Others include law firms, research facilities and government official<br />
TOP 10 RESPONDENT’S LOCATIONS<br />
19+<br />
United Arab Emirates (4%)<br />
Singapore (5%)<br />
Indonesia (6%)<br />
Malaysia (7%)<br />
Philippines (8%)<br />
Australia (10%)<br />
Qatar (12%)<br />
78 %<br />
OF TOTAL<br />
RESPONDENTS<br />
China (19%)<br />
India (15%)<br />
Hong Kong (14%)<br />
WHAT IS OUR CURRENT ECONOMIC STATUS?<br />
(QUARTERLY COMPARISON)<br />
Past Low Point<br />
100%<br />
Optimistic<br />
(Will get better)<br />
36%<br />
30%<br />
38%<br />
At Low Point<br />
35%<br />
45%<br />
34%<br />
52%<br />
32%<br />
56%<br />
34%<br />
52%<br />
37%<br />
55%<br />
28%<br />
41%<br />
27%<br />
38%<br />
29%<br />
29%<br />
35%<br />
32%<br />
28%<br />
32% 35%<br />
31% 32%<br />
90%<br />
80%<br />
70%<br />
60%<br />
50%<br />
40%<br />
30%<br />
Pessimistic<br />
(Will get worse)<br />
Not Reached<br />
Low Point<br />
34%<br />
27%<br />
21%<br />
15%<br />
10%<br />
11%<br />
16%<br />
32%<br />
33%<br />
36%<br />
40%<br />
37% 33%<br />
20%<br />
10%<br />
0%<br />
2016<br />
<strong>Q4</strong><br />
2017<br />
Q1<br />
2017<br />
Q2<br />
2017<br />
Q3<br />
2017<br />
<strong>Q4</strong><br />
2018<br />
Q1<br />
2018<br />
Q2<br />
2018<br />
Q3<br />
2018<br />
<strong>Q4</strong><br />
<strong>2019</strong><br />
Q1<br />
<strong>2019</strong><br />
Q2<br />
<strong>2019</strong><br />
Q3<br />
<strong>2019</strong><br />
<strong>Q4</strong><br />
FOURTH QUARTER <strong>2019</strong> — ASIAN SKY QUARTERLY | 11
MOOD & INTENTIONS: ASIA-PACIFIC REGION SURVEY <strong>2019</strong><strong>Q4</strong><br />
ECONOMIC MOOD<br />
US-China Phase I achievement stabilized overall the pessimistic mood<br />
in Asia Pacific, with Greater China improving but still hitting a 36% low.<br />
In <strong>Q4</strong> <strong>2019</strong>, 33% of the respondents believed that the economy has not<br />
hit the bottom and will get worse. This is 4% lower compared with last<br />
quarter and shows signs of continual improvement with regional market<br />
confidence.<br />
Region-wise, respondents from Greater China still formed the majority<br />
of this pessimistic group, but the optimistic level improved slightly with a<br />
low 36% in <strong>Q4</strong>. With the exception of Greater China, all the other regions<br />
have continued its momentum towards improved optimistic levels.<br />
In general, respondents who believed that the current economic<br />
situation has passed its low point or is at its low point can be described<br />
as optimistic. This quarter, 67% of respondents believed that our<br />
economy will improve in the future; a 4% increase compared to <strong>2019</strong> Q3.<br />
The Phase I trade deal between US and China has finally given some<br />
relief to the market, especially Chinese aviation shareholders — as the<br />
two largest economies in the world finally reach a point where they can<br />
cease fire and negotiate furthermore to settle the dispute.<br />
However, with the recent outbreak of the Coronavirus, China’s economic<br />
situation, as well as markets across the region and globally will feel the<br />
impacts of a slowdown in the coming months. This could, in turn, shift<br />
optimistic moods once again.<br />
OPTIMISM LEVELS SINCE 2016<strong>Q4</strong> - REGIONAL DIFFERENCES<br />
100%<br />
Greater China SE & NE Asia Central Asia Oceania<br />
100%<br />
Overall<br />
90%<br />
80%<br />
70%<br />
60%<br />
95%<br />
91%<br />
86%<br />
84%<br />
83%<br />
85%<br />
81%<br />
79%<br />
79% 79%<br />
73%<br />
70%<br />
69%<br />
68%<br />
66%<br />
62%<br />
61%<br />
94%<br />
92%<br />
92%<br />
92%<br />
89%<br />
90%<br />
89%<br />
88%<br />
87%<br />
84%<br />
78%<br />
76%<br />
75%<br />
88%<br />
83%<br />
68%<br />
95%<br />
86%<br />
80%<br />
67%<br />
82%<br />
75%<br />
72%<br />
64%<br />
86%<br />
73%<br />
65%<br />
60%<br />
89%<br />
74%<br />
67%<br />
63%<br />
84%<br />
82%<br />
73%<br />
67%<br />
50%<br />
54%<br />
48%<br />
50%<br />
43%<br />
40%<br />
41%<br />
36%<br />
30%<br />
2016<br />
<strong>Q4</strong><br />
2017<br />
Q1<br />
2017<br />
Q2<br />
2017<br />
Q3<br />
2017<br />
<strong>Q4</strong><br />
2018<br />
Q1<br />
2018<br />
Q2<br />
2018<br />
Q3<br />
2018<br />
<strong>Q4</strong><br />
<strong>2019</strong><br />
Q1<br />
<strong>2019</strong><br />
Q2<br />
<strong>2019</strong><br />
Q3<br />
32%<br />
<strong>2019</strong><br />
<strong>Q4</strong><br />
12 | ASIAN SKY QUARTERLY — FOURTH QUARTER <strong>2019</strong>
MOOD & INTENTIONS: ASIA-PACIFIC REGION SURVEY <strong>2019</strong><strong>Q4</strong><br />
AIRCRAFT UTILIZATION:<br />
REGIONAL DIFFERENCES<br />
In <strong>Q4</strong>, 29% of respondents in the surveyed<br />
area said their expected aircraft utilization<br />
had decreased, which is lower than the<br />
38% recorded in Q3, the increase is mainly<br />
contributed by respondents from all regions<br />
except Greater China where respondents<br />
believe they have increased their aircraft<br />
utilization. Additionally, 51% of respondents<br />
said their aircraft utilization had increased,<br />
which is a 5% increase compared with the<br />
previous quarter.<br />
Greater China<br />
In this quarter, only 25% of the respondents<br />
claim their fleet utilization had increased,<br />
which is currently the second lowest level<br />
of all time – a slight 4% increase from<br />
Q3. In the meantime, 58% of respondents<br />
indicated their aircraft utilization in <strong>Q4</strong> <strong>2019</strong><br />
had decreased, reaching the second highest<br />
level next to <strong>2019</strong> Q3 since the beginning of<br />
the survey. The US-China trade wars have<br />
continued to impact local operators, adding<br />
uncertainty to the country’s general aviation<br />
industry development.<br />
Oceania<br />
In <strong>Q4</strong>, 30% of respondents reported the same<br />
level of aircraft utilization. With an increased<br />
level of 57% of respondents indicating their<br />
aircraft utilization increased, a 7% increase<br />
from <strong>2019</strong> Q3. Only 13% of respondents<br />
indicated their aircraft utilization decreased.<br />
Southeast and Northeast Asia<br />
In <strong>Q4</strong> <strong>2019</strong>, 51% of respondents recorded<br />
increased aircraft utilization, which is 7% higher<br />
compared with <strong>2019</strong> Q3. 28% of respondents<br />
believe that their aircraft utilization decreased,<br />
which is 6% decrease compared with the<br />
previous quarter.<br />
* An Optimistic-Pessimistic Signal Line has been added to<br />
regional aircraft usage trend analyses for Greater China,<br />
Oceania and South and East Asia regions. An optimistic<br />
mood is derived from more people indicating ‘higher’ aircraft<br />
utilization compared with 12 months ago, while a pessimistic<br />
mood is derived from more people indicating ‘lower’<br />
aircraft utilization compared with 12 months ago.<br />
GREATER CHINA<br />
OPTIMISTIC<br />
21 19 60 18 22 60 21 33 46 23 22 55 43 24 33 41 33 26 43 21 36 62 18 21 581725<br />
PESSIMISTIC<br />
21%<br />
19%<br />
60%<br />
2017<br />
<strong>Q4</strong><br />
OCEANIA<br />
OPTIMISTIC<br />
21 38 40 30 18 52 47 18 35 26 19 56 30 25 45 26 32 42 24 48 29 25 25 50 133057<br />
PESSIMISTIC<br />
21%<br />
OPTIMISTIC<br />
PESSIMISTIC<br />
18%<br />
22%<br />
60%<br />
21%<br />
47%<br />
33%<br />
18%<br />
46%<br />
35%<br />
23%<br />
22%<br />
26%<br />
19%<br />
55%<br />
56%<br />
43%<br />
24%<br />
30%<br />
25%<br />
33%<br />
45%<br />
41%<br />
33%<br />
26%<br />
43%<br />
24%<br />
21%<br />
48%<br />
36%<br />
62%<br />
18%<br />
21%<br />
27 17 10 14 25 17 15 34 28<br />
27%<br />
38%<br />
40%<br />
2017<br />
<strong>Q4</strong><br />
14 22 20 22 18 23 17 22 21<br />
14%<br />
58%<br />
17%<br />
25%<br />
59 61 70 64 56 60 68 44 51<br />
59%<br />
2018<br />
Q1<br />
30%<br />
18%<br />
17%<br />
22%<br />
Decreased The Same Increased Signal Line*<br />
Decreased The Same Increased Signal Line*<br />
52%<br />
2018<br />
Q1<br />
SOUTHEAST AND NORTHEAST ASIA<br />
Decreased The Same Increased Signal Line*<br />
61%<br />
2018<br />
Q2<br />
2018<br />
Q2<br />
10%<br />
20%<br />
70%<br />
2018<br />
Q3<br />
2018<br />
Q3<br />
14%<br />
22%<br />
64%<br />
2018<br />
<strong>Q4</strong><br />
2018<br />
<strong>Q4</strong><br />
25%<br />
18%<br />
56%<br />
<strong>2019</strong><br />
Q1<br />
26%<br />
32%<br />
17%<br />
23%<br />
42%<br />
<strong>2019</strong><br />
Q1<br />
60%<br />
<strong>2019</strong><br />
Q2<br />
15%<br />
17%<br />
29%<br />
<strong>2019</strong><br />
Q2<br />
68%<br />
<strong>2019</strong><br />
Q3<br />
25%<br />
25%<br />
34%<br />
22%<br />
50%<br />
<strong>2019</strong><br />
Q3<br />
44%<br />
<strong>2019</strong><br />
<strong>Q4</strong><br />
13%<br />
30%<br />
28%<br />
21%<br />
57%<br />
<strong>2019</strong><br />
<strong>Q4</strong><br />
51%<br />
2017<br />
<strong>Q4</strong><br />
2018<br />
Q1<br />
2018<br />
Q2<br />
2018<br />
Q3<br />
2018<br />
<strong>Q4</strong><br />
<strong>2019</strong><br />
Q1<br />
<strong>2019</strong><br />
Q2<br />
<strong>2019</strong><br />
Q3<br />
<strong>2019</strong><br />
<strong>Q4</strong><br />
FOURTH QUARTER <strong>2019</strong> — ASIAN SKY QUARTERLY | 13
MOOD & INTENTIONS: ASIA-PACIFIC REGION SURVEY <strong>2019</strong><strong>Q4</strong><br />
SUMMARY: AIRCRAFT UTILIZATION CHANGES COMPARED TO 12 MONTHS AGO<br />
100%<br />
Up by 20% and more (>20%)<br />
90%<br />
26%<br />
80%<br />
70%<br />
Up but less than 20% (0 - 20%)<br />
25%<br />
Increased<br />
60%<br />
50%<br />
40%<br />
30%<br />
The same (0%)<br />
19%<br />
19%<br />
Unchanged<br />
20%<br />
10%<br />
0%<br />
2017<br />
<strong>Q4</strong><br />
Down but less than 20% (-20 - 0%)<br />
Down by 20% or more (
MOOD & INTENTIONS: ASIA-PACIFIC REGION SURVEY <strong>2019</strong><strong>Q4</strong><br />
PURCHASE INTENTION<br />
Regarding the current pre-owned market, 55% of respondents believed<br />
that the current market is in a ‘Buyer’s Market’ with low demand and<br />
increased supply, increasing by 5% compared with the previous quarter<br />
and once again reaching a new high level. In the meantime, the<br />
respondents who believed we are in a ‘Seller’s Market’ have increased to<br />
9%, a slight uptick compared with last quarter.<br />
For details of the pre-owned market trend, check the “Market Dynamics”<br />
section of the report.<br />
Regarding the purchase intentions of <strong>Q4</strong> <strong>2019</strong>, in total 48.2% of the<br />
respondents currently don’t want to buy an aircraft or are not sure of<br />
buying an aircraft. This was lower compared with last quarter but still<br />
relatively high.<br />
ASG noticed that the demand for both new aircraft and pre-owned<br />
aircraft together represent 51.8% of the respondents who now have the<br />
intention of buying an aircraft. It is 4% higher compared with Q3.<br />
WHERE ARE WE IN THE CURRENT PRE-OWNED MARKET?<br />
39%<br />
36%<br />
21%<br />
4%<br />
Buyer’s Market<br />
40%<br />
29%<br />
21%<br />
10%<br />
47%<br />
28%<br />
17%<br />
8%<br />
Balanced Market<br />
43%<br />
38%<br />
14%<br />
38%<br />
26%<br />
10%<br />
41%<br />
PURCHASE INTENTION 2017<strong>Q4</strong> - <strong>2019</strong><strong>Q4</strong>*<br />
Yes, a new aircraft Yes, a pre-owned aircraft No / I’m not sure<br />
38%<br />
16%<br />
Seller’s Market<br />
58%<br />
20%<br />
15%<br />
50%<br />
28%<br />
17%<br />
5% 5%<br />
8%<br />
6%<br />
53%<br />
I’m not sure<br />
2017<strong>Q4</strong> 2018Q1 2018Q2 2018Q3 2018<strong>Q4</strong> <strong>2019</strong>Q1 <strong>2019</strong>Q2 <strong>2019</strong>Q3 <strong>2019</strong><strong>Q4</strong><br />
55%<br />
21%<br />
15%<br />
9%<br />
Purchase intention by region is shown in a graph to understand regional<br />
differences for fixed-wing aircraft. Greater China has a significantly<br />
higher need for large jets, while turboprops and small jets are more<br />
38%<br />
41%<br />
40%<br />
38%<br />
41%<br />
43%<br />
46%<br />
48%<br />
suitable for Oceania. Corporate airliners are commonly needed in all<br />
areas except Oceania. Additionally, the medium and small jet categories<br />
are wanted, but on a relatively lower level.<br />
33%<br />
31% 31%<br />
29% 28%<br />
30%<br />
32%<br />
31%<br />
30%<br />
29%<br />
28%<br />
27%<br />
27%<br />
28%<br />
Since 2017 Q3’s market survey, a new method was applied filtering out those respondents<br />
who are not relevant to this question, hence reflecting a percentage drop in the category “No<br />
/ I’m not sure”.<br />
24%<br />
20%<br />
2017<strong>Q4</strong> 2018Q1 2018Q2 2018Q3 2018<strong>Q4</strong> <strong>2019</strong>Q1 <strong>2019</strong>Q2 <strong>2019</strong>Q3 <strong>2019</strong><strong>Q4</strong><br />
PURCHASE INTENTION - REGIONAL DIFFERENCES (FIXED WING)<br />
Corporate Airliner<br />
Large Jet Medium Jet Small Jet Turboprop /<br />
Piston Fixed Wing<br />
SE & NE Asia<br />
16% 18%<br />
18%<br />
16%<br />
32%<br />
Oceania<br />
5% 15%<br />
20% 15%<br />
45%<br />
Greater China<br />
11% 41%<br />
23%<br />
11%<br />
14%<br />
Central Asia 35%<br />
20% 13% 17%<br />
15%<br />
PURCHASE INTENTION<br />
- FIXED WING<br />
(OUTER IS PREFERRED)<br />
Corporate Airliner<br />
(Such as ACJ, BBJ)<br />
PURCHASE INTENTION<br />
- HELICOPTER<br />
(OUTER IS PREFERRED)<br />
Twin Turbine<br />
(Such as Sikorsky S-76C++)<br />
PURCHASE DECISIONS<br />
- INFLUENCING FACTORS<br />
(OUTER IS LIMITING)<br />
Government / Public Opinion<br />
Most Preferred<br />
Most Preferred<br />
Turboprop/Piston<br />
Fixed Wing<br />
(Such as King Air Series)<br />
Large Jet<br />
(Such as G650,<br />
Falcon 8X)<br />
Inconvenient<br />
to Use<br />
No Interesting<br />
Aircraft<br />
Small Jet<br />
(Such as Citation Series,<br />
Hawker Series)<br />
Midsize Jet<br />
(Such as G200 &<br />
CL650)<br />
Piston Helicopter<br />
(Such as Robinson R22)<br />
Single Turbine Helicopter<br />
(Such as Bell 206)<br />
No Need<br />
Greater China<br />
Central Asia<br />
Price<br />
Oceania<br />
SE & NE Asia<br />
FOURTH QUARTER <strong>2019</strong> — ASIAN SKY QUARTERLY | 15
GULFSTREAM G700:<br />
BUSINESS AVIATION’S NEW FLAGSHIP<br />
Introduced in October <strong>2019</strong>, the all-new Gulfstream G700 powered into business aviation as the industry’s<br />
new flagship. The newest aircraft from Gulfstream captures this leadership role with the most spacious cabin, the<br />
longest range at the highest speeds and the most advanced technology, all optimized by Gulfstream to deliver<br />
an unparalleled travel experience.<br />
The G700 harnesses Gulfstream-developed technology both for<br />
pilots and passengers. The aircraft features the award-winning<br />
Symmetry Flight Deck and other new safety advancements. Along<br />
with active-control sidesticks and the industry’s most extensive use<br />
of touch-screen technology, the flight deck also comes standard<br />
with another Gulfstream award-winner, the Predictive Landing<br />
Performance System. This system gives pilots advanced warning<br />
of potential runway excursions so they can adjust approaches or go<br />
around. All these technologies greatly improve situational awareness<br />
and pilot communication, so they stay alert and focused on flying.<br />
The largest aircraft in the Gulfstream family, the G700 offers an<br />
outstanding range of 6,400 nautical miles/11,853 kilometers at its<br />
high-speed cruise of Mach 0.90 and 7,500 nm/13,890km at its longrange<br />
cruise speed of Mach 0.85. The ability to fly at faster speeds<br />
(Mach 0.90 versus Mach 0.80) gives customers more time, lower<br />
annual expenses for maintenance, parts and services, and shorter<br />
crew days for safer operations.<br />
All-new, high-thrust Rolls-Royce Pearl 700 engines power the G700<br />
and, along with newly designed Gulfstream winglets, ensure the<br />
aircraft achieves high performance capabilities with its larger cabin.<br />
The aircraft offers excellent takeoff and landing performance and<br />
can operate easily at weight-restricted, short-runway and highaltitude<br />
airports.<br />
16 | ASIAN SKY QUARTERLY — FOURTH QUARTER <strong>2019</strong>
AIRCRAFT SPOTLIGHT: GULFSTREAM G700<br />
In the cabin, the tallest, widest and longest in the industry,<br />
passengers can extend their ground-based lifestyle to the air in up<br />
to five living areas.<br />
The aircraft’s extra-large ultra-galley features a 10-foot/3.048-meter<br />
countertop, yet another industry best, and a passenger lounge or<br />
crew compartment. Gourmet meals can be catered with ease in the<br />
G700 kitchen, and chefs will enjoy the extra-large refrigerator and<br />
optimized storage. After holding a productive meeting, passengers<br />
can enjoy that gourmet meal at a six-place dining area with fullydeployable<br />
table.<br />
The options throughout the cabin are limitless – settle into club<br />
seating for intimate conversation or become immersed in the<br />
entertainment zone, where the aircraft’s new speakerless system is<br />
embedded in the wall panels, giving new meaning to surround sound.<br />
Those who plan to leverage the ultra long-range capability of the<br />
G700 will appreciate the master suite with bath, to get restful sleep.<br />
They’ll also have the same amenities they are accustomed to at<br />
home, including a shower.<br />
The technology on the G700 also boosts wellness thanks to<br />
the most advanced circadian lighting system in aviation. The<br />
Gulfstream-developed technology dynamically recreates sunrise and<br />
sunset through thousands of white and amber LEDs, gently coaxing<br />
passengers into their new time zone and greatly reducing the<br />
physical impact of traveling around the world in one stop. Combined<br />
with 20 Gulfstream panoramic oval windows, the industry’s lowest<br />
cabin altitude, 100 percent fresh air and whisper-quiet sound levels,<br />
the G700 lighting and signature Gulfstream Cabin Experience<br />
practically give passengers the ability to arrive at their destination<br />
feeling more refreshed than when they departed.<br />
Gulfstream has a long history of combining design excellence with<br />
advanced technology, and the G700 propels this history into the<br />
future, doing so in the utmost safety and comfort.<br />
www.gulfstream.com<br />
“THE ABILITY TO FLY AT FASTER SPEEDS GIVES<br />
CUSTOMERS MORE TIME, LOWER ANNUAL EXPENSES<br />
FOR MAINTENANCE, PARTS AND SERVICES, AND<br />
SHORTER CREW DAYS FOR SAFER OPERATIONS.”<br />
FOURTH QUARTER <strong>2019</strong> — ASIAN SKY QUARTERLY | 17
ASIA<br />
10 & 11 JUNE<br />
THE GRAND HYATT SINGAPORE<br />
“Always good value for money. A nice snapshot of the regional business aviation<br />
environment. Great networking event with across the board insight into our industry”<br />
Gary Dolski, Metrojet<br />
“One of the best sources of expertise in the industry. A great refresher on a wide range<br />
of subjects. A must-attend event”<br />
James Hardie, Collins Aerospace<br />
“With its extensive worldwide network, Corporate Jet Investor has established itself as a<br />
top-ranked gathering of business aviation leaders and industry experts”<br />
Leo Knaapen, Bombardier Aviation<br />
Book your place by Friday 3rd April 2020 to save £200!<br />
Discounts available for booking multiple places.<br />
Ways to register:<br />
Online at corporatejetinvestor.com/book-now<br />
Email Rianne West at rianne@corporatejetinvestor.com<br />
Call +44 1737 844 383 / +1 800 757 8059<br />
18 | ASIAN SKY QUARTERLY — FOURTH QUARTER <strong>2019</strong>
SPECIAL FEATURE<br />
ASIA-PACIFIC FLIGHT ACTIVITY<br />
YEAR END <strong>2019</strong><br />
WINGX is a data research and consulting company, which provides<br />
actionable market intelligence to the global business aviation<br />
industry. Our interactive web-hosted dashboards provide our<br />
customers with the data-visualization they need to stay alert to<br />
market trends, keep tabs on market share, identify competitive<br />
threats and spot new sales opportunities. WINGX customers<br />
include aircraft operators, airframe, engine and avionics OEMs,<br />
airlines, maintenance providers, airports, fixed-based operators,<br />
satcom providers, fuel providers, legal advisors, leasing companies,<br />
banks, regulators, investors and private jet users.<br />
For further information and a free demo of our dashboards, please<br />
contact: Richard or Christoph at office@wingx-advance.com<br />
WINGX Data Source: ADSB and ATC<br />
DATA BY<br />
FOURTH QUARTER <strong>2019</strong> — ASIAN SKY QUARTERLY | 19
SPECIAL FEATURE: ASIA-PACIFIC FLIGHT ACTIVITY YEAR END <strong>2019</strong><br />
<strong>2019</strong> ASIA PACIFIC BUSINESS JET FLIGHT ACTIVITY<br />
OVERVIEW<br />
INTERNATIONAL FLIGHTS VS. DOMESTIC FLIGHTS<br />
12,000<br />
10,000<br />
8,000<br />
6,000<br />
4,000<br />
5%<br />
11%<br />
-6%<br />
26%<br />
14%<br />
16%<br />
8%<br />
0%<br />
2%<br />
-2%<br />
7%<br />
7%<br />
International Flights<br />
42,446 (57%)<br />
43+57+G<br />
74,689<br />
Total Flights<br />
Domestic Flights<br />
32,243 (43%)<br />
2,000<br />
0<br />
Jan<br />
Feb<br />
Mar<br />
Apr<br />
May<br />
Jun<br />
Jul<br />
Aug<br />
Sep<br />
Oct<br />
Nov<br />
Dec<br />
2018 Flights <strong>2019</strong> Flights YoY Growth Rate<br />
<strong>2019</strong> BUSIEST REGIONS (DEPARTURE)<br />
ANNUAL FLIGHT DURATIONS<br />
More than 5 hours (-1%)<br />
Max 30 min (+26%)<br />
4 hours to 5 hours (+5%)<br />
30 min to 1 hour(+15%)<br />
3 hours to 4 hours (+4%)<br />
2 hours to 3 hours (0%)<br />
1 hour to 2 hours<br />
(+10%)<br />
<strong>2019</strong> GREATER CHINA FLIGHT ACTIVITIES<br />
+15%, 1,379<br />
-5%, 756<br />
+5%, 3,054<br />
-18%, 10,008<br />
Large Cabin<br />
Midsize<br />
Super Light<br />
Super Midsize<br />
Light<br />
Ultra Long Range<br />
Airliner/Bizliner(Jet)<br />
-31%, 2,342<br />
DEPARTURE COUNTRY FLIGHTS YOY GROWTH RATE<br />
Mainland China<br />
India<br />
Saudi Arabia<br />
United Arab Emirates<br />
Japan<br />
Israel<br />
Singapore<br />
Indonesia<br />
Malaysia<br />
Hong Kong (China)<br />
10008<br />
7931<br />
6848<br />
6179<br />
5356<br />
4982<br />
3553<br />
3300<br />
3090<br />
3054<br />
-18%<br />
23%<br />
41%<br />
13%<br />
16%<br />
3%<br />
15%<br />
16%<br />
17%<br />
5%<br />
Mainland China<br />
Taiwan, China<br />
Macau, China<br />
Hong Kong, China<br />
* Data Source: WINGX<br />
+11%, 68<br />
+474%, 195<br />
-18%, 367<br />
+43%, 30<br />
-14%, 6,991<br />
-73%, 8<br />
* Entry Level Jet: 0%, 7<br />
The total number of flights departing from the Asia-Pacific region in<br />
<strong>2019</strong> was 74,689, increasing 7% from December 2018. <strong>2019</strong> witnessed<br />
significant growth in the short-range flight category, specifically flights<br />
lasting less than 30 minutes — which increased 26% y-o-y.<br />
<strong>2019</strong> saw a big decline in its typically top market of Mainland China,<br />
which fell 18% from 2018. However, overall business aviation flights<br />
were notably up in the Middle East and Southeast Asia. International<br />
flights represented a larger portion of the market in <strong>2019</strong>, accounting<br />
for 57% of all business jet activity<br />
20 | ASIAN SKY QUARTERLY — FOURTH QUARTER <strong>2019</strong>
SPECIAL FEATURE: ASIA-PACIFIC FLIGHT ACTIVITY YEAR END <strong>2019</strong><br />
TOP AVIATION HUBS’ PERFORMANCES<br />
BEIJING<br />
Flights<br />
-13%<br />
239<br />
-6%<br />
-4%<br />
-28%<br />
198 191 181<br />
YoY% Growth Rate<br />
-15%<br />
-21%<br />
-5%<br />
-5%<br />
Flights: 2,631<br />
YoY Growth Rate: -16%<br />
-14%<br />
-36%<br />
-22%<br />
-9%<br />
252<br />
230 222 233 248<br />
205<br />
222 210<br />
In <strong>2019</strong>, there were a total of 15,197 business jet departures in Greater<br />
China, down 11% compared to 2018. Flights within Mainland China<br />
dropped significantly by 35%, however, arrivals to Southeast Asia<br />
increased. The key transport hubs in Mainland China, Beijing and<br />
Shanghai both saw a big drop in activity this year, greatly attributed to<br />
the weak economic pace and the US-China trade conflict.<br />
As for Taiwan, activities grew by 15% making up a total of 1,375 flights,<br />
evidently in the charter market.<br />
Jan Feb Mar Apr May Jun Jul Aug Sep Oct Nov Dec<br />
SHANGHAI<br />
Flights<br />
-12%<br />
0%<br />
-11%<br />
-33% 186<br />
136 137 138 153<br />
YoY% Growth Rate<br />
-13%<br />
-3%<br />
156<br />
Flights: 1,844<br />
YoY Growth Rate: -11%<br />
Jan Feb Mar Apr May Jun Jul Aug Sep Oct Nov Dec<br />
-19%<br />
136<br />
-24%<br />
136<br />
-2% -5%<br />
191<br />
-18%<br />
203<br />
112<br />
29%<br />
160<br />
In <strong>2019</strong>, there were 3,054 business jet departures from Hong Kong.<br />
There was a significant increase in April, however just over 4.6% growth<br />
in y-o-y flights, while month-over-month activities fluctuated greatly.<br />
Tokyo-based departures to Greater China, South Korea and Southeast<br />
Asia were up, while arrivals into North America from Tokyo dropped by<br />
13%. Domestic flights within Japan played a dominant role in Tokyo’s<br />
business aviation activity, up by 21% in <strong>2019</strong>.<br />
Singapore had a strong showing in <strong>2019</strong>, with business jet activity at<br />
the Seletar Airport up 16%, with strong gains in flights within Southeast<br />
Asia, and arrivals into Greater China, Middle East.<br />
1<br />
Unless otherwise noted, all numbers are compared on a year-on-year basis.<br />
HONG KONG<br />
TOKYO<br />
Flights: 3,054<br />
Flights YoY% Growth Rate<br />
YoY Growth Rate: +4.6%<br />
Flights YoY% Growth Rate<br />
42%<br />
40%<br />
37%<br />
24%<br />
23%<br />
30%<br />
16%<br />
4%<br />
4% 6%<br />
16%<br />
-3%<br />
0%<br />
6%<br />
2%<br />
2%<br />
-5%<br />
-12%<br />
-12%<br />
223<br />
294<br />
286<br />
259<br />
234 254<br />
221<br />
249 249 265 264 278<br />
199<br />
165 170<br />
169<br />
158<br />
201<br />
154<br />
36%<br />
Flights: 2,322<br />
YoY Growth Rate: +17%<br />
7%<br />
-7%<br />
203<br />
183 197<br />
25%<br />
268<br />
10%<br />
233<br />
Jan Feb Mar Apr May Jun Jul Aug Sep Oct Nov Dec<br />
Jan Feb Mar Apr May Jun Jul Aug Sep Oct Nov Dec<br />
SINGAPORE<br />
Flights<br />
43%<br />
61%<br />
YoY% Growth Rate<br />
Flights: 3,553<br />
YoY Growth Rate: +16%<br />
14%<br />
20%<br />
12%<br />
20%<br />
18%<br />
10%<br />
9%<br />
8%<br />
1%<br />
-12%<br />
290 304<br />
332<br />
278 273<br />
245<br />
252<br />
354<br />
315 328<br />
319<br />
263<br />
Jan Feb Mar Apr May Jun Jul Aug Sep Oct Nov Dec<br />
FOURTH QUARTER <strong>2019</strong> — ASIAN SKY QUARTERLY | 21
SPECIAL FEATURE: ASIA-PACIFIC FLIGHT ACTIVITY YEAR END <strong>2019</strong><br />
<strong>2019</strong> ASIA PACIFIC BUSINESS JET FLIGHT ACTIVITIES<br />
TOTAL FLIGHT ACTIVITIES BY SIZE CATEGORY<br />
+6%, 32,830 -22%, 46<br />
+23%, 5,038<br />
+5%, 4,996<br />
+9%, 22,790<br />
+5%, 889<br />
+30%, 1,810<br />
-14%, 2,187 +1%, 4,184<br />
Ultra Long Range<br />
Large Cabin<br />
Midsize Jet<br />
Super Midsize Jet<br />
Light Jet<br />
Airliner / Bizliner (Jet)<br />
Super Light Jet<br />
Very Light Jet<br />
Entry Level Jet<br />
TOP OEM PERFORMANCE COMPARISON YOY%<br />
4% 5%<br />
24,886 22,859<br />
7,898 6,923 5,890<br />
Gulfstream<br />
Bombardier<br />
19%<br />
Dassault<br />
8% 11%<br />
Embraer<br />
Cessna<br />
16%<br />
2,301 2,042 788 623 342<br />
Hawker<br />
Beechcraft<br />
24% 26%<br />
Learjet<br />
-22%<br />
Beoing<br />
1%<br />
Airbus<br />
Israel<br />
Aerospace<br />
Industries<br />
Flights<br />
YoY Growth Rate<br />
Activity in the ultra-long-range and large cabin categories account for<br />
74% of the regional business jet movements. However, in <strong>2019</strong>, the midsize<br />
and super light-size categories had strong growth, up 23% and 30%,<br />
respectively.<br />
In terms of business jet activities by OEM: Boeing aircraft flew 22% less<br />
in <strong>2019</strong>, while Gulfstream and Bombardier jet activity rose at a steady<br />
pace — around 4.5%. Likewise, Dassault, Embraer, Cessna, and Hawker<br />
showed strong growth.<br />
<strong>2019</strong> TOP 10 CITY PAIRINGS<br />
800<br />
735<br />
700<br />
707<br />
600<br />
596 594<br />
564<br />
500<br />
400<br />
380<br />
300<br />
200<br />
100<br />
0<br />
Dept. - Arrival<br />
Jeddah - Riyadh<br />
Riyadh - Jeddah<br />
Beersheba - Beersheba<br />
Singapore - Jakarta<br />
Jakarta - Singapore<br />
Mumbal - New Delhi<br />
342 341 340 331<br />
Hong Kong - Hong Kong<br />
Beijing - Hong Kong<br />
Hong Kong - Beijing<br />
New Delhi - Mumbal<br />
The most popular regional flight pairing in <strong>2019</strong> was Saudi Arabia’s King<br />
Abdulaziz International Airport to Saudi Arabia’s King Khaled International<br />
Airport. Tel Aviv was the top destination for business jet activity in <strong>2019</strong>,<br />
with 3,939 flights departures, along with 366 aircraft arriving in Israel.<br />
TOP 10 CITIES<br />
4500<br />
4000<br />
3939<br />
3500<br />
3000<br />
2500<br />
2000<br />
1500<br />
1000<br />
500<br />
0<br />
Tel Aviv<br />
3356<br />
Singapore<br />
3207<br />
Riyadh<br />
3054<br />
Hong Kong<br />
2631<br />
Beijing<br />
2322 2205<br />
Tokyo<br />
Jebel Ali<br />
2035<br />
Jeddah<br />
1916 1844<br />
Mumbal<br />
Shanghai<br />
* Data Source: WINGX<br />
22 | ASIAN SKY QUARTERLY — FOURTH QUARTER <strong>2019</strong>
SETTING THE RECORD STRAIGHT<br />
TOP FIVE MYTHS ABOUT OPERATING LEASES<br />
BY GLOBAL JET CAPITAL<br />
There are more options today for accessing a business aircraft than ever before: from charter, to fractional<br />
ownership, to operating leases, to traditional financing. When dealing with large, highly-regulated assets that<br />
could cost tens of millions—or more—to own, weighing the options to find what makes sense for your specific<br />
requirements can be difficult. To make navigating the sometimes-complex landscape of business aviation a little<br />
easier, we’re going to clear up five common myths around operating leases—and explain some of the advantages of<br />
this frequently misunderstood financing option:<br />
1) Operating leases are too restrictive—it’s<br />
better to own.<br />
Unlike fractional ownership agreements, operating leases let<br />
you have your aircraft for the duration of the lease, which means<br />
consistently using your crew, being able to leave your personal<br />
effects on board, and enjoying the experience of ownership<br />
while putting your capital to better use. Some restrictions on<br />
customization that could potentially impact residual value and<br />
other usual lease terms apply, but limitations fall within normal<br />
patterns of ownership. With the right lessor, you can expect<br />
contract terms that are flexible and fit your unique needs, which<br />
make the experience of having an operating lease feel anything<br />
but restrictive.<br />
to find a buyer, to paying the costs of maintenance, insurance,<br />
and storage in the meantime, you may be looking at millions lost<br />
in the process.<br />
2) You’re stuck in a contract with an operating<br />
lease, which makes it inconvenient when<br />
your business changes.<br />
It’s true that operating leases are contractual, while owning a<br />
business aircraft outright is not. There’s no reason, however, why the<br />
terms of an operating lease have to be rigid or unable to adapt to<br />
Not only that, an operating lease with a predictable term makes<br />
disposition as simple as turning the aircraft back over to the<br />
lessor at end of lease—no additional planning or contingencies<br />
needed. Compare that to attempting to sell an aircraft when it’s<br />
time to upgrade or make changes to your operations. From hiring<br />
a broker, to waiting for months (or even years, in extreme cases)<br />
24 | ASIAN SKY QUARTERLY — FOURTH QUARTER <strong>2019</strong>
COMMENTARY: GLOBAL JET CAPITAL<br />
changing business conditions. Contracts can be created that adjust<br />
easily to a changing mission—including allowing for moves to larger<br />
or smaller aircraft, the option to extend, or the option to prematurely<br />
end the lease altogether. With the right financing partner, you can<br />
expect a flexible, custom-tailored contract that feels right.<br />
In fact, ownership may have risks and limitations that exceed the<br />
limitations of a contractual obligation in an operating lease. If a<br />
major uptick in your international markets means that your newly<br />
purchased mid-range aircraft is no longer up to the task of supporting<br />
your business goals, you bear the risk of waiting a long time to sell<br />
with capital tied up in an asset that doesn’t suit your needs. When<br />
you’re finally able to sell and need to purchase a new business aircraft<br />
with a longer range, you’re looking at a potentially lengthy process to<br />
secure traditional financing from a lender, coupled with a much larger<br />
capital outlay than the refundable security deposit for a lease.<br />
3) Operating leases make sense in bad resale<br />
markets or when interest rates are high, but<br />
not when resale value is strong or when<br />
interest rates are low.<br />
Even if there is a strong resale market or low interest rates when<br />
you choose to purchase an aircraft, consider the risk that you’re<br />
taking on with the large outlay of an aircraft purchase. Traditional<br />
financing typically requires large down payments and due to<br />
volatile geo-political situations, emerging technology, and the<br />
natural realities of market fluctuation, there’s no guarantee that a<br />
strong resale market for your aircraft will be there when you choose<br />
to sell. That low interest rate environment may be gone, which<br />
won’t help entice buyers to purchase your pre-owned aircraft. In<br />
the meantime, you may have paid more for a depreciating asset.<br />
Operating leases eliminate residual value risk and provide<br />
predicable costs for the duration of the lease. Budgeting stays<br />
precise, liquidity stays high, and the future becomes clearer. The<br />
resale market doesn’t come with any guarantees—an operating<br />
lease contract does.<br />
4) Operating leases are only for certain kinds of<br />
aircraft. You can’t just get whatever you want.<br />
Whether you have your eye on a new or pre-owned aircraft, or if the<br />
pre-owned aircraft you’re interested in is a little older than what you<br />
would typically expect for a leasing arrangement, there are very few<br />
limitations to what can be obtained with an operating lease today.<br />
Specialists in business aviation financing like Global Jet Capital look to<br />
spread risk across a large portfolio, encompassing aircraft from every<br />
major manufacturer, every global market, and a variety of age ranges.<br />
5)You can only achieve privacy by purchasing<br />
an aircraft, not leasing.<br />
If privacy is important to you, a leased aircraft may actually provide<br />
an additional layer of anonymity. An operating lease reduces visibility<br />
to an aircraft’s end user, as the public records of the FAA identify the<br />
lessor as the owner of the aircraft, giving you greater privacy.<br />
Interested in learning more about the<br />
flexible financing options available<br />
for obtaining a business aircraft?<br />
Global Jet Capital’s financial products<br />
are designed to help you optimize<br />
your private aviation experience<br />
across the lifetime of the asset—<br />
from acquisition to disposition and<br />
upgrade. Whether freeing up capital<br />
or enjoying the flexibility to transition<br />
between aircraft, we work tirelessly<br />
to understand your needs and provide<br />
straightforward and highly responsive<br />
solutions.<br />
Visit www.globaljetcapital.com to<br />
learn more.<br />
FOURTH QUARTER <strong>2019</strong> — ASIAN SKY QUARTERLY | 25
GOING GREEN:<br />
PROTECTING THE FUTURE OF<br />
BUSINESS AVIATION<br />
IN THIS ARTICLE, BUSINESS AVIATION EXPERTS, HFW HONG KONG PARTNER GORDON<br />
GARDINER AND SINGAPORE SENIOR ASSOCIATE JAMES JORDAN, PROVIDE AN<br />
OVERVIEW OF THE CURRENT INDUSTRY INITIATIVES RELATING TO SUSTAINABILITY<br />
AS WELL AS THE DEVELOPING REGULATORY ENVIRONMENT, BEFORE CONSIDERING<br />
THE TECHNOLOGICAL SOLUTIONS WHICH MAY PROVIDE THE ANSWERS TO THE<br />
INDUSTRY’S PERCEIVED PROBLEMS.<br />
Business aviation accounts for 0.04% of global CO2 emissions . This<br />
compares to 2% from the airline industry , with industries such as<br />
fashion and construction contributing a staggering 10% and 39%<br />
respectively.<br />
Notwithstanding its position as a modest contributor, business<br />
aviation attracts a disproportionate amount of public attention due<br />
to its high-profile clientele. Many allege these individuals should be<br />
doing more to set a positive environmental example, with the British<br />
Royalty becoming the latest high-profile targets of flygskam, or ‘flightshaming’.<br />
This scrutiny has prompted sustained and repeated calls for<br />
the sector to limit or reduce its carbon emissions.<br />
The solution to an image crisis is not, however, to divert attention to<br />
the actions of others, but instead to demonstrate and publicise the<br />
already significant strides made by the business aviation community<br />
in its mission to become sustainable, in the face of the escalating<br />
threat of irreversible climate change. Indeed, the current media focus<br />
provides an opportunity to convey business aviation’s message while<br />
people are listening.<br />
GLOBAL REGULATORY DEVELOPMENTS<br />
The introduction of ICAO’s Carbon Offsetting Reduction Scheme for<br />
International Aviation (CORSIA) is the most significant initiative applying<br />
to the broader aviation sector. From this year onwards, CORSIA aims<br />
to mitigate CO2 emissions from the global aviation industry, whilst still<br />
allowing for growth through a combination of reducing emissions and<br />
carbon offsetting.<br />
While CORSIA does not specifically exclude business aviation, operators<br />
that produce less than 10,000 metric-tons of CO2 in international flights<br />
annually (domestic flights are not covered) are exempt from the scheme,<br />
as are aircraft with a maximum take-off weight of less than 5,700 kg.<br />
The reality is that the majority of business aviation operators will be<br />
unaffected, with only operators of fleets of larger jets being caught by<br />
CORSIA.<br />
CORSIA will, however, bring the issue of emissions reduction and carbon<br />
offsetting to the forefront of the public dialogue on the impact of aviation<br />
on the environment.<br />
26 | ASIAN SKY QUARTERLY — FOURTH QUARTER <strong>2019</strong>
COMMENTARY: PROTECTING THE FUTURE OF BUSINESS AVIATION<br />
INDUSTRY INITIATIVES<br />
Business aviation has been at the forefront of<br />
developments relating to decarbonisation within the<br />
broader aviation sector.<br />
Figures from the European Business Aviation Association<br />
suggest that business aviation has already improved its<br />
carbon footprint by 40% over the last 40 years . This is<br />
an impressive achievement in an era where almost every<br />
other industry has significantly increased its carbon<br />
footprint.<br />
To establish clear goals for the industry, the Business<br />
Aviation Commitment on Climate Change (BACCC) was<br />
created in 2009 by the International Business Aviation<br />
Council (IBAC) and General Aviation Manufacturers<br />
Association (GAMA).<br />
The BACCC supports the International Civil Aviation<br />
Organization’s (ICAO) Programme of Action on<br />
International Aviation and Climate Change, and<br />
established the following three clear goals:<br />
1. Improving fuel efficiency by 2% per year from 2010<br />
until 2020<br />
2. Achieving carbon-neutral growth from 2020<br />
3. Reducing CO2 emissions by 50% by 2050 relative<br />
to 2005<br />
Significant improvements have been made in relation to<br />
fuel efficiency but it remains to be seen whether carbonneutral<br />
growth can be achieved from this year onwards.<br />
The business aviation community is, however, well placed<br />
to build on its efforts to date.<br />
A CROWDED REGULATORY ENVIRONMENT<br />
The regulatory environment is becoming increasingly crowded with<br />
CORSIA adding to the well-established carbon reduction scheme of the<br />
European Union, the EU Emissions Trading Scheme (“ETS”).<br />
Unlike CORSIA, which requires carbon emissions above a baseline to<br />
be offset, the EU ETS sets an overall cap on the level of emissions but,<br />
within that cap, permits allowances to be bought and sold as required.<br />
The EU scheme may apply to business aviation operators, although<br />
there are a raft of potentially applicable exemptions.<br />
No decision has yet been reached on whether EU ETS will continue after<br />
CORSIA comes into full effect next year and, if so, how the two schemes<br />
will interact. In addition, despite some countries talking about imposing<br />
their own carbon pricing or ticket tax to address emissions on top of<br />
CORSIA, national regulators should act with caution before introducing<br />
further regulations so as to avoid creating a patchwork of competing<br />
requirements.<br />
TECHNOLOGICAL ADVANCEMENTS<br />
Aircraft and engine manufacturers have brought to market new products<br />
incorporating lighter materials and fuel-saving designs. In particular,<br />
the advancements in composite materials over the past decade has<br />
resulted in significant fuel savings. The speed of such advancements is<br />
only set to increase, and it is anticipated that a business aircraft built in<br />
2050 will be 45% more fuel efficient than one built in 2005.<br />
SUSTAINABLE ALTERNATIVE FUELS<br />
Sustainable Alternative Fuel (SAF) offers the greatest opportunity to<br />
significantly lower carbon emissions from aviation.<br />
SAF is typically derived from renewable feed stocks as well as other<br />
sustainable sources (ranging from cooking oil, plant oils, municipal solid<br />
waste, waste gases, sugars, purpose-grown biomass, and agricultural<br />
residues) blended with up to 50% traditional Jet-A fuel. As numerous<br />
flights have now shown, including new aircraft delivery flights and<br />
FOURTH QUARTER <strong>2019</strong> — ASIAN SKY QUARTERLY | 27
COMMENTARY: PROTECTING THE FUTURE OF BUSINESS AVIATION<br />
SAF-fuelled aircraft arrivals at EBACE and NBAA-BACE, the clear<br />
message is that SAF is safe, can simply be ‘dropped-in’ to aircraft, and<br />
does not affect aircraft performance.<br />
Weaning the aviation industry off pure fossil fuels, which are subject<br />
to increasingly volatile price fluctuations resulting from geo-political<br />
struggles, will allow the industry to better predict its operating costs<br />
leading to a more stable business model. Business aviation operators<br />
should, therefore, have a vested interest in supporting the nascent SAF<br />
industry.<br />
Although the supply of SAF is still limited and is more expensive than<br />
traditional jet fuel, greater adoption by both business and commercial<br />
aviation will create economies of scale which will inevitably lead to price<br />
reductions. This will however require support from governments and<br />
other policy leaders to incentivise the use of SAF.<br />
ABOUT THE AUTHORS<br />
HFW HONG KONG PARTNER GORDON GARDINER<br />
AND SINGAPORE SENIOR ASSOCIATE JAMES JORDAN<br />
ARE TRUSTED LEGAL ADVISERS TO THE BUSINESS<br />
AVIATION COMMUNITY. THEY REGULARLY ADVISE ON<br />
A DIVERSE RANGE OF BUSINESS AVIATION MATTERS<br />
AND ARE PART OF A GLOBAL TEAM THAT PROVIDES<br />
CLIENTS WITH SOLUTIONS ACROSS THE BROAD<br />
SPECTRUM OF FINANCING & LEASING, COMMERCIAL<br />
CONTRACTS, REGULATORY ISSUES, AND DISPUTES.<br />
ELECTRIFICATION…SOLUTION OR PROBLEM?<br />
The gradual introduction of hybrid-electric propulsion systems, and<br />
eventually all-electric engines, is the aviation industry’s ultimate solution<br />
for combating emissions.<br />
GORDON GARDINER<br />
Partner, Hong Kong<br />
D +852 3983 7710<br />
E gordon.gardiner@hfw.com<br />
While business aviation (more so than civil aviation) lends itself to<br />
electrification due to the smaller aircraft types, it is important to consider<br />
how the electricity is generated. The merits of electrification will be<br />
significantly diminished if the power for charging batteries is sourced<br />
from low-efficiency coal-fired power stations.<br />
JAMES JORDAN<br />
Senior Associate, Singapore<br />
D +65 6411 5374<br />
M +65 8123 3558<br />
E james.jordan@hfw.com<br />
Hybrid-electrification for aviation is anticipated as being 10 years away,<br />
with full-electrification 20 years or more away from fruition. It is hoped<br />
that during this period, governments with a high fossil fuel reliance will<br />
move their power generation towards renewable sources.<br />
A GREEN FUTURE FOR BUSINESS AVIATION<br />
Business aviation has long been at the forefront of technological<br />
innovation, including technologies which have improved fuel efficiency<br />
and reduced environmental impact. Much has already been done to<br />
ensure that the industry confronts the challenges of carbon emissions<br />
and sustainability. It should not, however, rest on its laurels as there is<br />
still more that can and should be done.<br />
A proactive rather than a defensive stance should be adopted so as<br />
to accurately manage the public perception that business aviation is<br />
a significant contributor to global emissions. Continuing to support<br />
sustainability is not, therefore, simply a moral or ethical obligation – it<br />
is necessary to protect the reputation and profitability of the future of<br />
business aviation.<br />
HFW has more than 600 lawyers working across Asia Pacific,<br />
the Americas, Europe and the Middle East. HFW is committed<br />
to Asia Pacific, with seven offices and three associations across<br />
the region.<br />
HFW has been at the forefront of legal developments in the<br />
aerospace sector for more than four decades. With more than<br />
80 specialist aviation lawyers in ten international hubs, HFW<br />
provides at the point of delivery the resources of a global team.<br />
HFW prides itself in knowing clients’ business needs and delivers<br />
solutions 24 hours a day.<br />
Recent examples of HFW’s business aviation work include<br />
advising on:<br />
• Sale and purchase agreements for both new and used business jets<br />
• Acquisition and financing or refinancing by lease or loan of numerous<br />
business jets<br />
• Terms and conditions of use for an <strong>Asian</strong> FBO<br />
• Commercial contracts relating to the services provided by an <strong>Asian</strong> MRO<br />
facility<br />
• Various commercial disputes in relation to aircraft acquisition and<br />
aircraft management<br />
• Insured claims arising out of business jet and general aviation incidents<br />
and major accidents<br />
hfw.com<br />
www.dassaultfalcon.com<br />
28 | ASIAN SKY QUARTERLY — FOURTH QUARTER <strong>2019</strong>
You could hope that your bank will have the<br />
flexibility to finance up to 100% of your new<br />
business aircraft –<br />
\ Or, you could let us.<br />
To a traditional bank, aircraft financing is generally an exotic side business. To us, it’s our only business. We understand the importance<br />
of your aircraft to your productivity, and your business. Which is why we offer the kind of flexibility in financing that allows our customers<br />
to take delivery of the aircraft they want—not the one they can get financed. With a finance lease from Global Jet Capital, you’ll have the<br />
flexibility to finance up to 100% of your new aircraft—including progress payments. It’s just another example of how our singular focus on<br />
aircraft financing offers benefits you won’t find at a bank.<br />
And with more than $2.6 billion in assets, world-class financial backing, hundreds of years of collective experience, and thousands of<br />
business aircraft transactions behind us, Global Jet Capital is uniquely positioned to craft customized solutions.<br />
844.436.8200 \ info@globaljetcapital.com \ globaljetcapital.com<br />
Miami \ Hong Kong \ Zurich \ New York<br />
FOURTH QUARTER <strong>2019</strong> — ASIAN SKY QUARTERLY | 29
PRE-OWNED MARKET ANALYSIS<br />
GULFSTREAM G450<br />
30 | ASIAN SKY QUARTERLY — FOURTH QUARTER <strong>2019</strong>
PRE-OWNED MARKET ANALYSIS: GULFSTREAM G450<br />
INTRODUCTION<br />
Complete with a long-range and large-cabin, the Gulfstream G450 is<br />
an upgrade from the popular GIV-SP/G400 model. Since it first entered<br />
production in 2004, the business jet has become one of the company’s<br />
most dependable aircraft. In 2016, the US-based aircraft manufacturer<br />
announced the final G450 would be scheduled for delivery to a customer<br />
in early 2018. The announcement came one year prior to the first G500<br />
entered service.<br />
Flying at a long-range cruise speed of Mach 0.80 and a max speed<br />
of Mach 0.85 with eight passengers, the G450 reaches a range of<br />
4,350-nautical-miles connecting London to Seattle on just one tank of<br />
fuel. Powered by Rolls-Royce Tay MK 611-8C engines, the aircraft can<br />
climb up to 41,000 feet in twenty-three minutes and offer 13,850 pounds<br />
of thrust. The G450 also meets both Federal Aviation Regulations (FAR)<br />
Part 36 noise standards and Special Federal Aviation Regulations<br />
(SFAR) Part 27 emissions limits, leaving oil consumption and vibrations<br />
low. The advanced sound suppression technology continues to be a<br />
main selling point for the G450.<br />
MODEL COMPARISON<br />
MODEL POSITIONING<br />
MAX RANGE (N.M.)<br />
6K<br />
5K<br />
4K<br />
Total Variable Cost/Hour (USD)<br />
5,500 8,000<br />
CL650, CL605 &<br />
CL604<br />
Falcon 900EX Easy<br />
Falcon 900EX<br />
G450<br />
3K<br />
1,000 1,200 1,400 1,600 1,800 2,000 2,200<br />
CABIN VOLUME (CU.FT)<br />
Gulfstream New G500<br />
Global 5000 / 5500<br />
G450<br />
GLOBAL<br />
5000 / 5500<br />
CHALLENGER<br />
604<br />
CHALLENGER<br />
605<br />
CHALLENGER<br />
650<br />
FALCON<br />
900EX<br />
FALCON<br />
900EX EASY<br />
GULFSTREAM<br />
NEW G500<br />
MARKET AVAILABILITY<br />
YEAR PRODUCED<br />
MANUFACTURER<br />
FLEET IN<br />
OPERATION<br />
FLEET FOR SALE<br />
2005-2016<br />
GULFSTREAM<br />
2015 - PRESENT<br />
BOMBARDIER<br />
1996 -2007<br />
BOMBARDIER<br />
2007 - 2015<br />
BOMBARDIER<br />
2015 - PRESENT<br />
BOMBARDIER<br />
1995 - 2003<br />
DASSULT<br />
2003 - 2010<br />
DASSULT<br />
2018 - PRESENT<br />
GULFSTREAM<br />
354<br />
234<br />
355<br />
287<br />
96 118<br />
119<br />
27<br />
18<br />
9<br />
1 30<br />
97<br />
124<br />
57<br />
2<br />
ENGINE TYPE<br />
RR-TAY 611-8C RR-BR 710-A2-20<br />
GE-CF34-3B<br />
GE-CF34-3B<br />
GE-CF34-3B<br />
MTO<br />
HONEYWELL<br />
TFE731-60<br />
HONEYWELL<br />
TFE731-60<br />
P&W CANADA<br />
PW814GA<br />
POWERPLANT &<br />
PERFORMANCES*<br />
ENGINE THRUST<br />
(LBS/SHP)<br />
MAXIMUM RANGE<br />
UP TO (NBAA IFR RES, SEAT FULL)<br />
MAXIMUM TAKE-OFF<br />
WEIGHT(LBS.)<br />
13,850<br />
4,070<br />
74,600<br />
14,750<br />
5200<br />
92,500<br />
8,729<br />
3,756<br />
48,200<br />
8,729<br />
3,756<br />
48,200<br />
9,220<br />
3,756<br />
48,200<br />
5,000<br />
4,500<br />
48,300<br />
5,000 15,144<br />
4,500 5,135<br />
49,000 79,600<br />
NORMAL CRUISE TAS<br />
(KN)<br />
459<br />
470<br />
459<br />
459<br />
424<br />
420<br />
430 488<br />
COST CABIN DIMENSIONS DIMENSIONS<br />
LENGTH (FT.)<br />
HEIGHT (FT.)<br />
WING SPAN (FT.)<br />
CABIN WIDTH (FT.)<br />
CABIN HEIGHT (FT.)<br />
CABIN LENGTH (FT.)<br />
CABIN VOLUME (CU.FT.)<br />
TOTAL VARIABLE<br />
COST/HOUR<br />
PRICE NEW<br />
(USD,000)<br />
89.30<br />
25.20<br />
77.80<br />
7.30<br />
6.20<br />
45.10<br />
1,658<br />
6,902<br />
43,150<br />
96.80<br />
25.50<br />
94.00<br />
8.17<br />
6.25<br />
42.47<br />
1,889<br />
7,829<br />
50,441<br />
68.40<br />
20.70<br />
64.30<br />
8.17<br />
6.08<br />
28.40<br />
1,146<br />
5,818<br />
26,800<br />
68.40<br />
20.70<br />
64.30<br />
8.17<br />
6.08<br />
28.40<br />
1,146<br />
5,532<br />
21,000<br />
68.40<br />
20.70<br />
64.30<br />
8.17<br />
6.08<br />
28.40<br />
1,146<br />
5,508<br />
32,350<br />
66.30<br />
24.80<br />
63.40<br />
7.70<br />
6.20<br />
33.20<br />
1,270<br />
6,329<br />
38,650<br />
66.30 91.20<br />
24.80 25.50<br />
63.40 86.30<br />
7.70 7.90<br />
6.20 6.30<br />
33.20 47.58<br />
1,270 1,715<br />
6,147 6,952<br />
41,350 45,500<br />
Data Source: OEM & Conklin & de Decker<br />
FOURTH QUARTER <strong>2019</strong> — ASIAN SKY QUARTERLY | 31
PRE-OWNED MARKET ANALYSIS: GULFSTREAM G450<br />
With the main cabin approximately 45 feet one inch in length and 6 feet<br />
two inches in height, the G450 accommodates up to 16, with typical<br />
configurations suitable for 14. The main cabin’s standard setup includes<br />
three living areas, as well as a forward and aft lavatory and a full galley,<br />
making the aircraft spacious and comfortable. The cabin is decked out<br />
with LED lighting, 12 panoramic and heated windows to avoid fogging,<br />
a quieter environmental control system and a two- to three-zone digital<br />
temperature control system, depending on configuration. Like other<br />
Gulfstream jets, the G450 features 100% fresh air system, with a<br />
pressurized cabin altitude varying between 5,000 and 6,000 feet.<br />
four large displays arranged across the cockpit, the system offers an<br />
Enhanced Vision System and a Visual Guidance System with a Head-up<br />
Display as an option.<br />
Competitors of the G450 include Bombardier’s Global 5000, the<br />
Dassault Falcon 900DX/LX and the Legacy 650. The larger and heavier<br />
Global 5000 has a few inches of more cabin space, in width, and can<br />
travel at a maximum range of 5,200nm. The lighter Falcon 900DX can<br />
travel 4,1000nm (with full seats), which the LX can travel 4,800nm (with<br />
full seats) and a maximum cruising speed of Mach 0.84.<br />
The G450 cockpit utilizes Gulfstream’s PlaneView avionics system,<br />
based on Honeywell’s Primus Epic integrated avionics system. With<br />
OPERATING FLEET & AGE DISTRIBUTION<br />
Currently, there are over 350 G450 aircraft operating around the world.<br />
Production stopped on this model in 2017, meaning the youngest G450<br />
is now three years old. The market is concentrated, however, with eight<br />
countries operating 84% of the total G450 fleet. Among those countries<br />
are the US, China, Saudi Arabia, Mexico, and Brazil.<br />
over 10 years old. Asia, on the other hand, is home to a much younger<br />
fleet — most of which are within 10 years old. The Greater China market<br />
has the second largest fleet next to the US, with almost half of its aircraft<br />
based in Hong Kong, making Hong Kong the top departure and arrival<br />
destinations for G450 operations in Asia Pacific.<br />
The Northern America market, specifically the US market which has the<br />
largest G450 fleet, is relatively older with the majority of these aircraft<br />
FLEET DISTRIBUTION - TOP COUNTRIES<br />
Country/Regions<br />
Fleet in Operation<br />
FLEET DISTRIBUTION BY REGIONS<br />
Regions<br />
Fleet in Operation %<br />
United States<br />
Greater China<br />
Saudi Arabia<br />
Mexico<br />
Brazil<br />
Turkey<br />
England<br />
San Marino<br />
212<br />
39<br />
14<br />
12<br />
6<br />
6<br />
5<br />
5<br />
Northern America<br />
Asia<br />
Latin Amer. & Carib<br />
Middle East<br />
Western Europe<br />
Eastern Europe<br />
Northern Africa<br />
Sub-Saharan Africa<br />
214<br />
51<br />
29<br />
25<br />
23<br />
8<br />
2<br />
2<br />
60%<br />
14%<br />
8%<br />
7%<br />
6%<br />
2%<br />
1%<br />
1%<br />
Total<br />
299<br />
Total<br />
354 100%<br />
% of total fleet<br />
84%<br />
AGE DISTRIBUTION BY OPERATING REGIONS<br />
45<br />
40<br />
35<br />
30<br />
25<br />
20<br />
15<br />
10<br />
5<br />
0<br />
2003<br />
2004<br />
2005<br />
2006<br />
2007<br />
2008<br />
2009<br />
2010<br />
2011<br />
2012<br />
2013<br />
2014<br />
2015<br />
2016<br />
2017<br />
Sub-Saharan Africa Northern Africa Eastern Europe Western Europe Middle East Latin Amer. & Carib Asia Northern America<br />
Data Source: Amstat & <strong>Asian</strong> <strong>Sky</strong> Group<br />
32 | ASIAN SKY QUARTERLY — FOURTH QUARTER <strong>2019</strong>
PRE-OWNED MARKET ANALYSIS: GULFSTREAM G450<br />
G450 OPERATIONS IN ASIA PACIFIC<br />
max. 30 min (6%)<br />
1.5h to 2.0h (15%)<br />
more than 4h (19%)<br />
Data Source: WingX<br />
35+25+19+15+6+G<br />
G450 UTILIZATION - FLIGHT DURATION BEHAVIORS<br />
2.0h to 4.0h (35%)<br />
30 min to 1.5h (25%)<br />
The G450 fleet in Asia Pacific is often used for flight missions within<br />
a four-hour range, which reflects the use of this aircraft for domestic<br />
flights or those within the region.<br />
As for the top destinations, Hong Kong, Manila, Beijing, Shenzhen,<br />
Jakarta and Singapore have become the top cities for both arrivals and<br />
departures.<br />
Despite the fact that the G450 is capable of intercontinental flights, only<br />
19% of flight missions actually need this in Asia Pacific. This once again<br />
shows the regional preferences for large-cabin business jets.<br />
FLEET DISTRIBUTION BY REGIONS<br />
Departure Airport<br />
VHHH-Chek Lap Kok International Airport<br />
RPLL-Ninoy Aquino International Airport<br />
ZBAA-Beijing Capital International Airport<br />
ZGSZ-Shenzhen Bao’an International Airport<br />
WIHH-Halim Perdanakusuma International Airport<br />
WSSL-Seletar Airport<br />
ZSSS-Shanghai Hongqiao International Airport<br />
RJTT-Tokyo International Airport<br />
VMMC-Macau International Airport<br />
RCSS-Taipei Songshan Airport<br />
Arrival Airport<br />
VHHH-Chek Lap Kok International Airport<br />
RPLL-Ninoy Aquino International Airport<br />
ZBAA-Beijing Capital International Airport<br />
ZGSZ-Shenzhen Bao’an International Airport<br />
ZSSS-Shanghai Hongqiao International Airport<br />
WSSL-Seletar Airport<br />
WIHH-Halim Perdanakusuma International Airport<br />
VMMC-Macau International Airport<br />
RJTT-Tokyo International Airport<br />
RCSS-Taipei Songshan Airport<br />
Data Source: WingX<br />
Departures<br />
196<br />
195<br />
176<br />
148<br />
110<br />
103<br />
91<br />
77<br />
71<br />
65<br />
Arrivals<br />
213<br />
203<br />
174<br />
152<br />
107<br />
100<br />
95<br />
76<br />
75<br />
62<br />
PRE-OWNED MARKET SNAPSHOT<br />
In <strong>2019</strong>, we saw a considerable number of G450s placed on market for<br />
sale. As of December <strong>2019</strong>, the market has ample supply of the pre-owned<br />
G450, with 26 aircraft listed for sale, representing 7% of the total fleet.<br />
Asking prices have decreased as the depreciation from an aging fleet and<br />
market supply continued to increase. Currently the average asking price<br />
is around US$13-14M, minus around US$2M compared with the same<br />
time last year. And it ranges from around US$10M for a 2006 model to a<br />
US$17M for a 2015 model.<br />
PRE-OWNED G450 ASKING PRICE POSITIONING<br />
Asking Price (M USD)<br />
$19<br />
$18<br />
$17<br />
$16<br />
$15<br />
$14<br />
$13<br />
$12<br />
$11<br />
$10<br />
$9<br />
2010 - 2604h<br />
Age-Time Score<br />
Fleet with Asking Prices<br />
Price Est. for Make Offers<br />
Asking Price Estimation<br />
2015 - 1070h<br />
2014 - 865h<br />
2014 - 953h<br />
2013 - 684h<br />
2013 - 2693h<br />
2013 - 1009h<br />
2012 - 1,775h<br />
2011 - 2396h<br />
2013 - 1928h<br />
2012 - 3730h<br />
2012 - 1827h<br />
2009 - 2646h 2010 - 4354h<br />
2013 - 2627h<br />
2008 - 3645h<br />
2010 - 2509h<br />
2008 - 4731h<br />
2011 - 1800h<br />
2010 - 3270h<br />
2008 - 4323h<br />
2008 - 2092h<br />
2006 - 3888h<br />
2010 - 3428h<br />
2004 - 2937h<br />
2010 - 1911h<br />
2008 - 3330h<br />
2010 - 2911h<br />
2007 - 4904h<br />
2006 - 4537h<br />
The average days on market is around 300 days. Since 2015, the days<br />
on market has been slowly increasing, from around 200 days.<br />
The transaction activities have slowed down compared with <strong>2019</strong> Q3<br />
and 2018 <strong>Q4</strong>, which is unusual given the fact that year end times are<br />
usually a peak period for G450 to close transactions.<br />
G450 % FOR SALE 7.43%<br />
METRIC<br />
ASKING PRICE<br />
DOM<br />
YEAR<br />
TTAF<br />
LANDINGS<br />
FOR SALE MARKET<br />
MIN., AVG. / MED., MAX<br />
$9.5M $14.3M<br />
28<br />
122<br />
2,004<br />
306<br />
177<br />
$13.5M $22M<br />
293<br />
2,636<br />
1,308<br />
1,316<br />
2,010<br />
2,010<br />
2,703<br />
1,714<br />
2,015<br />
4,888<br />
2,748<br />
Data Source: <strong>Asian</strong> <strong>Sky</strong> Group<br />
Data Source: Amstat<br />
FOURTH QUARTER <strong>2019</strong> — ASIAN SKY QUARTERLY | 33
PRE-OWNED MARKET ANALYSIS: GULFSTREAM G450<br />
AIRCRAFT FOR SALE, TRANSACTIONS AND AVERAGE DAYS ON MARKET<br />
Days on Market<br />
Aircraft For Sale<br />
400<br />
300<br />
200<br />
No. of AC Sold<br />
Days on Market<br />
# of AC for Sale & Sold<br />
Millions<br />
100<br />
1 1<br />
2 3<br />
2 2<br />
2 1 1 1 1 1 1<br />
25 26 29 29 29 30 28 29 28 32 38 36 37 35 34 29 30 33 29 29 32 29 31 28 25 26 22 29 32 30 33 30 26 26 24 22 22 20 20 19 18 20 20 23 24 20 20 18 18 17 22 25 22 21 23 23 23 21 28 29<br />
Jan-15<br />
May-15<br />
Sep-15<br />
Jan-16<br />
2<br />
3 3 3 3 7<br />
4 3<br />
4 2 5<br />
4<br />
1 6 5<br />
2 1<br />
1<br />
2<br />
4<br />
4<br />
2<br />
1 3<br />
2 3 2 3 5<br />
1 3<br />
1 3 4 3 4 5 4<br />
2<br />
5 5 6 1<br />
May-16<br />
Sep-16<br />
Jan-17<br />
The G450 market has been proven to be robust and active, and it has<br />
been playing an important role in the large cabin business jet market.<br />
The number of G450 aircraft for sale, as well as market inventory values<br />
(fleet number times asking prices), all have been on par with the global<br />
market trend. According to ASG’s findings, the high demand for preowned<br />
G450s, is one of the leading factors for the pre-owned market<br />
revival between 2016-2017, during which the pre-owned G450 market<br />
has enjoyed a significantly higher demand, thus helping the global<br />
market self-adjust with its inventory value quickly being consumed.<br />
Since 2015, transactions in the G450 market are typically closed in the<br />
second half of the year. This is a higher transaction level compared with<br />
the global market.<br />
Since mid 2018, more large cabin aircraft (including G450s) have been<br />
put on market for sale, which — along with the worldwide economic<br />
downturn and the US-China trade war — which all had a combined<br />
impact of pushing the market towards a ‘Buyers’ Market’ once again. This<br />
has caused market hesitation and unavoidably impacted transactions.<br />
Many aircraft sellers have had to reduce their original asking prices in<br />
order to hedge against the increasing number of aircraft available. In the<br />
meantime, the buying and selling price expectation between sellers<br />
and buyers differed significantly, causing deals to fall apart.<br />
AVERAGE ASKING PRICE:<br />
G450 VS. GLOBAL MARKET<br />
24<br />
22<br />
20<br />
18<br />
16<br />
14<br />
12<br />
Jan 2015<br />
May 2015<br />
Sep 2015<br />
Jan 2016<br />
May 2016<br />
Data Source: Amstat & <strong>Asian</strong> <strong>Sky</strong> Group<br />
G450<br />
Global Market<br />
Sep 2016<br />
Jan 2017<br />
May 2017<br />
Sep 2017<br />
Jan 2018<br />
May 2018<br />
Sep 2018<br />
Jan <strong>2019</strong><br />
May <strong>2019</strong><br />
Sep <strong>2019</strong><br />
May-17<br />
Jan 2020<br />
M USD<br />
G450 Market Value<br />
% Level vs. Global Market Totals<br />
Sep-17<br />
700<br />
G450 For Sale<br />
G450 Sold<br />
Global Market<br />
Global Total For Sale<br />
%<br />
Global Total Sold<br />
% Inventory Value<br />
18.0% 12<br />
16.0%<br />
14.0%<br />
12.0%<br />
10.0%<br />
8.0%<br />
6.0%<br />
4.0%<br />
2.0%<br />
Sep-18<br />
0.0% 0<br />
Jan 2015<br />
Jan-18<br />
May 2015<br />
Sep 2015<br />
May-18<br />
SUMMARY<br />
May 2016<br />
Jan 2017<br />
Jan-19<br />
Jan 2018<br />
May-19<br />
Sep 2018<br />
Sep-19<br />
PRE-OWNED MARKET VALUE: G450 VS. GLOBAL<br />
May <strong>2019</strong><br />
Dec-19<br />
The G450 is still a very welcome pre-owned model, but market<br />
pessimism will likely not go away any time soon– this means we can<br />
foresee the G450 market inventory continue to increase with its prices<br />
continuing to reduce. This is obviously good news for buyers, who can<br />
now pay much less now than half a year ago to get the deal done. For<br />
sellers, this means they have to set a reasonable price for their G450 if<br />
they want the aircraft to be sold quickly.<br />
G450 Inventory Value Global Inventory Value<br />
800 11<br />
600 9<br />
500 8<br />
400 7<br />
Pre-owned G450 leading<br />
300 pre-owned market with a higher<br />
6<br />
inventory consumption rate.<br />
200 5<br />
Jan 2015<br />
May 2015<br />
Sep 2015<br />
Jan 2016<br />
Jan 2016<br />
May 2016<br />
Sep 2016<br />
Sep 2016<br />
Jan 2017<br />
Pre-owned G450 consumed at<br />
similar speed as global market.<br />
May 2017<br />
May 2017<br />
Sep 2017<br />
Sep 2017<br />
Jan 2018<br />
May 2018<br />
May 2018<br />
Sep 2018<br />
Jan <strong>2019</strong><br />
Jan <strong>2019</strong><br />
May <strong>2019</strong><br />
SUPPLY DEMAND: G450 VS. GLOBAL MARKET<br />
Sep <strong>2019</strong><br />
Sep <strong>2019</strong><br />
Jan 2020<br />
Jan 2020<br />
10<br />
Global Market Value Trend Line<br />
B USD<br />
Global Market Value<br />
10<br />
8<br />
6<br />
4<br />
2<br />
34 | ASIAN SKY QUARTERLY — FOURTH QUARTER <strong>2019</strong>
FlightSafety is Here For<br />
YOU<br />
Your Success<br />
Relax. Our instructors work to ensure<br />
YOU have an exceptional training<br />
experience with a positive outcome.<br />
Your Proficiency<br />
Be the very best. We are committed<br />
to helping YOU achieve and maintain<br />
the highest level of skills and safety.<br />
Your Satisfaction<br />
Count on us. We all have the same goal:<br />
providing YOU with the highest-quality<br />
training and outstanding service.<br />
flightsafety.com • 314.785.7815 • A Berkshire Hathaway company
MARKET DYNAMICS<br />
PRE-OWNED BUSINESS JETS MARKET - <strong>2019</strong> <strong>Q4</strong><br />
INVENTORY VALUE (USD) 1<br />
$9,992M<br />
WORLDWIDE<br />
$7,388M<br />
ASIA PACIFIC<br />
$1,729M<br />
$911M<br />
Dec Jan Feb Mar Apr May Jun Jul Aug Sep Oct Nov Dec Jan Feb Mar Apr May Jun Jul Aug Sep Oct Nov Dec Jan Feb Mar Apr May Jun Jul Aug Sep Oct Nov Dec<br />
20162017<br />
2018<br />
<strong>2019</strong><br />
The Inventory Value Line represents the number of aircraft actively being marketed for sale in USD terms. 2<br />
The Trend Line represents the market’s direction in terms of the balance between sellers and buyers (supply and<br />
demand) at today’s price levels. A rising Trend Line indicates that pre-owned activity is stabilizing, with sellers of<br />
aircraft increasingly likely to find buyers.<br />
The Signal Line represents an indication of where the market’s direction may be heading in the future. A Signal<br />
Line consistently falling below the Trend Line indicates that any improvement in the market’s direction may not be<br />
entirely sustainable.<br />
MARKET TREND 1<br />
WORLDWIDE<br />
TREND<br />
WORSENING<br />
TREND REVERSAL<br />
MOVING TOWARDS SELLER’S MARKET<br />
MOVING TOWARDS BUYER’S MARKET<br />
AIRCRAFT SOLD 1<br />
WORLDWIDE<br />
TREND REVERSAL<br />
73<br />
70<br />
65<br />
47<br />
58<br />
58 54<br />
50 51 52 54<br />
56 57 60 56<br />
54<br />
50<br />
52<br />
47<br />
49<br />
45 47<br />
46<br />
45<br />
42<br />
39<br />
41<br />
41<br />
38<br />
35<br />
36 34 33<br />
45<br />
92<br />
56<br />
30<br />
Dec Jan Feb Mar Apr May Jun Jul Aug Sep Oct Nov Dec Jan Feb Mar Apr May Jun Jul Aug Sep Oct Nov Dec Jan Feb Mar Apr May Jun Jul Aug Sep Oct Nov Dec<br />
20162017<br />
2018<br />
<strong>2019</strong><br />
1 The historical inventory value and transactions are subject to change based on latest market information updates.<br />
2 ASG’s Inventory Value line is calculated by taking the total number of aircraft for sale from a selection of 39 different models, multiplied by their average asking prices.<br />
36 | ASIAN SKY QUARTERLY — FOURTH QUARTER <strong>2019</strong><br />
Source: AMSTAT & ASG
MARKET DYNAMICS<br />
% OF FLEET SOLD<br />
1.30%<br />
1.25%<br />
1.20%<br />
1.15%<br />
1.10%<br />
1.05%<br />
1.00%<br />
0.95%<br />
0.90%<br />
0.85%<br />
0.80%<br />
0.75%<br />
0.70%<br />
0.65%<br />
0.60%<br />
0.55%<br />
0.50%<br />
0.45%<br />
0.40%<br />
0.35%<br />
Dec<br />
16<br />
Feb<br />
17<br />
Apr<br />
17<br />
Jun<br />
17<br />
Aug<br />
17<br />
Oct<br />
17<br />
Dec<br />
17<br />
Feb<br />
18<br />
Apr<br />
18<br />
Jun<br />
18<br />
Aug<br />
18<br />
Oct<br />
18<br />
Dec<br />
18<br />
Feb<br />
19<br />
Apr<br />
19<br />
Jun<br />
19<br />
Aug<br />
19<br />
Oct<br />
19<br />
Dec<br />
19<br />
AVERAGE ASKING PRICE<br />
MILLION USD<br />
28<br />
26<br />
24<br />
ASIA PACIFIC<br />
22<br />
20<br />
18<br />
WORLDWIDE<br />
16<br />
14<br />
12<br />
Dec<br />
16<br />
Feb<br />
17<br />
Apr<br />
17<br />
Jun<br />
17<br />
Aug<br />
17<br />
Oct<br />
17<br />
Dec<br />
17<br />
Feb<br />
18<br />
Apr<br />
18<br />
Jun<br />
18<br />
Aug<br />
18<br />
Oct<br />
18<br />
Dec<br />
18<br />
Feb<br />
19<br />
Apr<br />
19<br />
Jun<br />
19<br />
Aug<br />
19<br />
Oct<br />
19<br />
Dec<br />
19<br />
% OF FLEET FOR SALE<br />
15%<br />
ASIA PACIFIC<br />
13%<br />
11%<br />
9%<br />
7%<br />
WORLDWIDE<br />
5%<br />
3%<br />
Dec<br />
16<br />
Feb<br />
17<br />
Apr<br />
17<br />
Jun<br />
17<br />
Aug<br />
17<br />
Oct<br />
17<br />
Dec<br />
17<br />
Feb<br />
18<br />
Apr<br />
18<br />
Jun<br />
18<br />
Aug<br />
18<br />
Oct<br />
18<br />
Dec<br />
18<br />
Feb<br />
19<br />
Apr<br />
19<br />
Jun<br />
19<br />
Aug<br />
19<br />
Oct<br />
19<br />
Dec<br />
19<br />
AVERAGE DAYS ON MARKET<br />
550<br />
500<br />
450<br />
ASIA PACIFIC<br />
400<br />
350<br />
300<br />
WORLDWIDE<br />
250<br />
200<br />
Dec<br />
16<br />
Feb<br />
17<br />
Apr<br />
17<br />
Jun<br />
17<br />
Aug<br />
17<br />
Oct<br />
17<br />
Dec<br />
17<br />
Feb<br />
18<br />
Apr<br />
18<br />
Jun<br />
18<br />
Aug<br />
18<br />
Oct<br />
18<br />
Dec<br />
18<br />
Feb<br />
19<br />
Apr<br />
19<br />
Jun<br />
19<br />
Aug<br />
19<br />
Oct<br />
19<br />
Dec<br />
19<br />
Source: AMSTAT & ASG<br />
FOURTH QUARTER <strong>2019</strong> — ASIAN SKY QUARTERLY | 37
MARKET DYNAMICS<br />
SUPPLY / DEMAND INDICATORS<br />
BUSINESS JETS<br />
SUPPLY VS. DEMAND RATIO<br />
AVERAGE DAYS ON MARKET<br />
SUPPLY ><br />
DEMAND<br />
% OF FLEET<br />
FOR SALE<br />
MODEL<br />
DAYS ON MARKET<br />
AVERAGE<br />
AVERAGE<br />
NO TRANSACTIONS<br />
15.8%<br />
4.1%<br />
11.1%<br />
AIRBUS<br />
ACJ318<br />
ACJ319<br />
ACJ320<br />
3.7%<br />
8.7%<br />
6.2%<br />
BOEING<br />
BBJ<br />
BBJ2<br />
CL300<br />
3.2%<br />
CL350<br />
4.7%<br />
CL604<br />
8.7%<br />
6.7%<br />
11.5%<br />
10.3%<br />
BOMBARDIER<br />
CL605<br />
CL650<br />
CL850<br />
GL Express<br />
9.2%<br />
GL XRS<br />
8.8%<br />
GL5000<br />
4.8%<br />
GL6000<br />
8.3%<br />
CIT. CJ3<br />
5.6%<br />
2.8%<br />
CESSNA<br />
CIT. CJ4<br />
CIT. Latitude<br />
4.9%<br />
CIT. Sovereign<br />
NO TRANSACTIONS<br />
6.1%<br />
F2000LX<br />
7.6%<br />
F2000LXS<br />
2.4%<br />
F2000S<br />
NO TRANSACTIONS<br />
5.2%<br />
5.7%<br />
16.7%<br />
4.2%<br />
8.3%<br />
1.4%<br />
41.2%<br />
9.3%<br />
7.7%<br />
4.4%<br />
EMBRAER DASSAULT<br />
F7X<br />
F8X<br />
F900DX<br />
F900EX<br />
F900EXe<br />
F900LX<br />
L1000<br />
L600<br />
L650<br />
Phenom 300<br />
9.9%<br />
G200<br />
NO TRANSACTIONS<br />
6.1%<br />
8.2%<br />
7.4%<br />
5.7%<br />
4.9%<br />
GULFSTREAM<br />
G280<br />
G450<br />
G500<br />
G550<br />
G650<br />
4.0%<br />
G650ER<br />
450% 400% 350% 400% 250% 200% 150% 100% 50% 0<br />
Average AC for sale / Total sold in last 12 months<br />
6.3%<br />
Average<br />
0 200 400 600 800 1000<br />
The above chart reflects where certain aircraft models are positioned<br />
in terms of supply and demand (based on a ratio of completed<br />
transactions compared to the number of sellers and the average<br />
number of days on the market for a transaction to take place).<br />
These indications do not necessarily mean that prices will be higher in<br />
the future, but it does indicate that sellers of these particular models<br />
are more likely to find willing buyers in a shorter period of time than the<br />
overall average.<br />
For some model types, given the market indicators shown on the<br />
previous page, the stabilization in pre-owned asking prices and<br />
decline in inventory level appear to have stimulated increased<br />
demand, leading to an increase in transactions and a more balanced<br />
state of supply and demand.<br />
38 | ASIAN SKY QUARTERLY — FOURTH QUARTER <strong>2019</strong><br />
This can be seen most with certain Gulfstream (G200, G450, G550,<br />
G650), Bombardier models (Challenger 604/605 & Global 5000)<br />
and Dassault Falcon models (2000 Series and 7X), where more<br />
transactions are occurring relative to the number for sale, and<br />
transactions are requiring less time on the market for sellers to<br />
complete.<br />
Source: AMSTAT & ASG
MARKET DYNAMICS<br />
MARKET POSITIONING<br />
BUSINESS JETS<br />
MOVING TOWARDS<br />
BUYER’S MARKET<br />
Balanced<br />
Supply & Demand<br />
MOVING TOWARDS<br />
SELLER’S MARKET<br />
AIRBUS<br />
BOEING<br />
BOMBARDIER<br />
EMBRAER DASSAULT<br />
CESSNA<br />
GULFSTREAM<br />
ACJ318<br />
ACJ319<br />
ACJ320<br />
BBJ 1<br />
BBJ 2<br />
CL300<br />
CL350<br />
CL604<br />
CL605<br />
CL650<br />
CL850<br />
GL Express<br />
GL XRS<br />
GL5000<br />
GL6000<br />
CIT. CJ3<br />
CIT. CJ4<br />
CIT. Latitude<br />
CIT. Sovereign<br />
F2000LX<br />
F2000LXS<br />
F2000S<br />
F7X<br />
F8X<br />
F900DX<br />
F900EX<br />
F900EXe<br />
F900LX<br />
L1000<br />
L600<br />
L650<br />
Phenom 300<br />
G200<br />
G280<br />
G450<br />
G500<br />
G550<br />
G650<br />
G650ER<br />
The above chart provides a visual representation of the Supply /<br />
Demand Ratio of each aircraft model relative to the overall market,<br />
and is based on a ‘Marketability’ calculation for each particular model<br />
including the following four market indicators:<br />
When taking into account these four factors, most of the the large and<br />
medium sized jets, such as Challenger 600, Falcon 2000 & 900 Series,<br />
as well as the various Gulfstream models, appear better positioned to<br />
find buyers available, compare to corporate airliner models.<br />
1. The percentage of aircraft for sale relative to its fleet size.<br />
2. The number of aircraft sold relative to the average number for sale.<br />
3. The average days for sale relative to the overall market average.<br />
4. The momentum of the marketplace (represented by the trend<br />
towards supply and demand market equilibrium portrayed earlier).<br />
* Since <strong>2019</strong> Q3, ASG expanded its market research scope to include 39 business jet models<br />
including light jet models as described in the report.<br />
Source: AMSTAT & ASG<br />
FOURTH QUARTER <strong>2019</strong> — ASIAN SKY QUARTERLY | 39
MARKET DYNAMICS<br />
PRE-OWNED CIVIL HELICOPTERS MARKET - <strong>2019</strong> <strong>Q4</strong><br />
INVENTORY VALUE (USD) 1<br />
WORLDWIDE<br />
$1,323M<br />
$1,121M<br />
ASIA PACIFIC<br />
$244M<br />
$168M<br />
Dec Jan Feb Mar Apr May Jun Jul Aug Sep Oct Nov Dec Jan Feb Mar Apr May Jun Jul Aug Sep Oct Nov Dec Jan Feb Mar Apr May Jun Jul Aug Sep Oct Nov Dec<br />
20162017<br />
2018<br />
<strong>2019</strong><br />
The Inventory Value Line represents the number of aircraft actively being marketed for sale in USD terms. 2<br />
The Trend Line represents the market’s direction in terms of the balance between sellers and buyers (supply and<br />
demand) at today’s price levels. A rising Trend Line indicates that pre-owned activity is stabilizing, with sellers of<br />
aircraft increasingly likely to find buyers.<br />
The Signal Line represents an indication of where the market’s direction may be heading in the future. A Signal<br />
Line consistently falling below the Trend Line indicates that any improvement in the market’s direction may not be<br />
entirely sustainable.<br />
MARKET TREND 1<br />
WORLDWIDE<br />
MOVING TOWARDS SELLER’S MARKET<br />
TREND<br />
WORSENING<br />
MOVING TOWARDS BUYER’S MARKET<br />
TREND<br />
IMPROVEMENT<br />
AIRCRAFT SOLD 1<br />
WORLDWIDE<br />
TREND<br />
IMPROVEMENT<br />
41 45 44 47 46 45<br />
36<br />
38<br />
31<br />
28 30<br />
26 30 34<br />
25<br />
22<br />
33<br />
45<br />
40<br />
34 38<br />
46<br />
39 37<br />
35<br />
28 27 26 27 28 27<br />
24 22<br />
26<br />
16<br />
22<br />
16<br />
Dec Jan Feb Mar Apr May Jun Jul Aug Sep Oct Nov Dec Jan Feb Mar Apr May Jun Jul Aug Sep Oct Nov Dec Jan Feb Mar Apr May Jun Jul Aug Sep Oct Nov Dec<br />
20162017<br />
2018<br />
<strong>2019</strong><br />
1 The historical inventory value and transactions are subject to change based on latest market information updates.<br />
2 ASG’s Inventory Value line is calculated by taking the total number of aircraft for sale from a selection of 16 different models, multiplied by their average asking prices.<br />
40 | ASIAN SKY QUARTERLY — FOURTH QUARTER <strong>2019</strong><br />
Source: AMSTAT & ASG
MARKET DYNAMICS<br />
% OF FLEET SOLD<br />
0.60%<br />
0.50%<br />
0.40%<br />
0.30%<br />
0.20%<br />
0.10%<br />
0.00%<br />
Dec<br />
16<br />
Feb<br />
17<br />
Apr<br />
17<br />
Jun<br />
17<br />
Aug<br />
17<br />
Oct<br />
17<br />
Dec<br />
17<br />
Feb<br />
18<br />
Apr<br />
18<br />
Jun<br />
18<br />
Aug<br />
18<br />
Oct<br />
18<br />
Dec<br />
18<br />
Feb<br />
19<br />
Apr<br />
19<br />
Jun<br />
19<br />
Aug<br />
19<br />
Oct<br />
19<br />
Dec<br />
19<br />
AVERAGE ASKING PRICE<br />
MILLION USD<br />
4.0<br />
3.5<br />
ASIA PACIFIC<br />
3.0<br />
2.5<br />
WORLDWIDE<br />
2.0<br />
1.5<br />
Dec<br />
16<br />
Feb<br />
17<br />
Apr<br />
17<br />
Jun<br />
17<br />
Aug<br />
17<br />
Oct<br />
17<br />
Dec<br />
17<br />
Feb<br />
18<br />
Apr<br />
18<br />
Jun<br />
18<br />
Aug<br />
18<br />
Oct<br />
18<br />
Dec<br />
18<br />
Feb<br />
19<br />
Apr<br />
19<br />
Jun<br />
19<br />
Aug<br />
19<br />
Oct<br />
19<br />
Dec<br />
19<br />
% OF FLEET FOR SALE<br />
5.5%<br />
5.0%<br />
4.5%<br />
WORLDWIDE<br />
4.0%<br />
3.5%<br />
3.0%<br />
2.5%<br />
ASIA PACIFIC<br />
2.0%<br />
1.5%<br />
Dec<br />
16<br />
Feb<br />
17<br />
Apr<br />
17<br />
Jun<br />
17<br />
Aug<br />
17<br />
Oct<br />
17<br />
Dec<br />
17<br />
Feb<br />
18<br />
Apr<br />
18<br />
Jun<br />
18<br />
Aug<br />
18<br />
Oct<br />
18<br />
Dec<br />
18<br />
Feb<br />
19<br />
Apr<br />
19<br />
Jun<br />
19<br />
Aug<br />
19<br />
Oct<br />
19<br />
Dec<br />
19<br />
AVERAGE DAYS ON MARKET<br />
700<br />
650<br />
WORLDWIDE<br />
600<br />
550<br />
500<br />
ASIA PACIFIC<br />
450<br />
400<br />
350<br />
300<br />
Dec<br />
16<br />
Feb<br />
17<br />
Apr<br />
17<br />
Jun<br />
17<br />
Aug<br />
17<br />
Oct<br />
17<br />
Dec<br />
17<br />
Feb<br />
18<br />
Apr<br />
18<br />
Jun<br />
18<br />
Aug<br />
18<br />
Oct<br />
18<br />
Dec<br />
18<br />
Feb<br />
19<br />
Apr<br />
19<br />
Jun<br />
19<br />
Aug<br />
19<br />
Oct<br />
19<br />
Dec<br />
19<br />
Source: AMSTAT & ASG<br />
FOURTH QUARTER <strong>2019</strong> — ASIAN SKY QUARTERLY | 41
MARKET DYNAMICS<br />
SUPPLY / DEMAND INDICATORS<br />
CIVIL HELICOPTERS<br />
SUPPLY VS. DEMAND RATIO<br />
AVERAGE DAYS ON MARKET<br />
SUPPLY ><br />
DEMAND<br />
% OF FLEET<br />
FOR SALE<br />
MODEL<br />
DAYS ON MARKET<br />
AVERAGE<br />
AVERAGE<br />
1.3%<br />
EC145<br />
3.2%<br />
H125<br />
3.4%<br />
1.8%<br />
9.4%<br />
6.4%<br />
AIRBUS HELICOPTERS<br />
H130<br />
H145<br />
H155<br />
EC135P2<br />
0.7%<br />
EC135T2<br />
9.5%<br />
EC155B<br />
5.2%<br />
BELL 206 JetRanger<br />
5.2%<br />
BELL 206 LongRanger<br />
3.4%<br />
4.1%<br />
6.5%<br />
6.0%<br />
5.5%<br />
2.5%<br />
19.7%<br />
SIKORSKY LEONARDO<br />
BELL HELICOPTER<br />
BELL 407<br />
BELL 412EP<br />
BELL 412HP<br />
BELL 429<br />
AW109SP GN<br />
AW139<br />
S76C+<br />
350% 300% 250% 200% 150% 100% 50% 0<br />
Average AC for sale / Total sold in last 12 months<br />
4.5%<br />
Average<br />
0 100 200 300 400 500 600 700 800<br />
The above chart reflects where certain aircraft models are positioned in terms of supply and demand (based on a ration of completed transactions<br />
compared to the number of sellers, and average number of days on the market for a transaction to take place).<br />
42 | ASIAN SKY QUARTERLY — FOURTH QUARTER <strong>2019</strong><br />
Source: AMSTAT & ASG
MARKET DYNAMICS<br />
MARKET POSITIONING<br />
CIVIL HELICOPTERS<br />
MOVING TOWARDS<br />
BUYER’S MARKET<br />
Balanced<br />
Supply & Demand<br />
MOVING TOWARDS<br />
SELLER’S MARKET<br />
EC145<br />
H125<br />
SIKORSKY LEONARDO BELL HELICOPTER<br />
AIRBUS HELICOPTERS<br />
H130<br />
H145<br />
H155<br />
EC135P2<br />
EC135T2<br />
EC155B<br />
BELL 206 JetRanger<br />
BELL 206 LongRanger<br />
BELL 407<br />
BELL412EP<br />
BELL412HP<br />
BELL 429<br />
AW109SP GN<br />
AW139<br />
S76C+<br />
The above chart provides a visual representation of the Supply / Demand Ratio of each aircraft model relative to the overall market, resulting in a<br />
‘Marketability’ calculation of each particular model based on the following four market indicators:<br />
1. The percentage of aircraft for sale relative to its fleet size.<br />
2. The number of aircraft sold relative to the average number for sale.<br />
3. The average days for sale relative to the overall market average.<br />
4. The momentum of the marketplace (represented by the trend towards supply and demand market equilibrium portrayed earlier).<br />
Source: AMSTAT & ASG<br />
FOURTH QUARTER <strong>2019</strong> — ASIAN SKY QUARTERLY | 43
OPERATIONAL TIPS: BUSINESS JETS IN JAPAN<br />
OPERATIONAL TIPS:<br />
BUSINESS JETS IN JAPAN<br />
UNIVERSAL WEATHER & AVIATION, INC.<br />
EARLY IN 2020, JAPAN ANNOUNCED INCREASED SECURITY INSPECTIONS OF LUGGAGE OF ARRIVAL/<br />
DEPARTING PRIVATE JET PASSENGERS AS WELL AS AN EXPANSION FOR DOMESTIC OPERATION<br />
PERMITS.<br />
HERE’S WHAT YOU NEED TO KNOW:<br />
NEW MANDATORY LUGGAGE<br />
INSPECTIONS FOR PRIVATE JET<br />
PASSENGERS<br />
Effective Jan. 6, 2020, Japan’s Transport Ministry ordered security<br />
inspections of luggage of a certain size for departing private jet<br />
passengers at some airports. Note: There is no official document<br />
issued from the ministry regarding this rule at this stage. We will<br />
update this article when and if, an official notice is published.<br />
Previously, passenger luggage inspections on private jets were only<br />
conducted at the request of the flight crew. Large luggage over a<br />
certain size (as determined by duty officers) will now be inspected at<br />
the following airports.<br />
• Narita International Airport (RJAA)<br />
• Haneda Airport (RJTT)<br />
• Kansai International Airport (RJBB)<br />
• Chubu Centrair International Airport (RJGG)<br />
• Kobe Airport (RJBE)<br />
• Nagoya Airport (RJNA)<br />
44 | ASIAN SKY QUARTERLY — FOURTH QUARTER <strong>2019</strong>
OPERATIONAL TIPS: BUSINESS JETS IN JAPAN<br />
EXPANSION OF ALLOWANCE FOR<br />
DOMESTIC OPERATION PERMIT<br />
Effective Jan. 1, 2020, Japan announced an expansion of allowance<br />
for domestic ops permits.<br />
1. Schedule changes and permit tolerance:<br />
• Old rule: Permit changes were previously only allowed within<br />
-24 hours / +72 hours from the approved ETA and ETD<br />
• New rule: Changes are now allowed within -1 day / +3 days<br />
from the approved operation dates<br />
2. Allowance for flight route<br />
• Old rule: Flight route for domestic ops need to be followed as<br />
approved<br />
• New rule: The flight route is now changeable as long as<br />
the operator is using the approved airports. For example:<br />
Approved [KIAH-RJTT-RJBB-RJTT-KIAH] legs can be operated<br />
as [KIAH-RJBB-RJTT-KIAH] without permit revision<br />
3. Allowance for setting alternate airports<br />
• Old rule: Setting alternate airports was not allowed<br />
• New rule: Setting alternate airports is now possible “within<br />
reason.<br />
Note: Airport coordination (slots/parking/CIQ/ground handling)<br />
needs to be confirmed apart from domestic operation permits for<br />
all airports.<br />
2020 TOKYO SUMMER & PARALYMPIC<br />
GAMES REMINDER<br />
The 2020 Summer Games will be held in Tokyo from July 24 – Aug.<br />
9, 2020. The Paralympics will be held from Aug. 25 – Sept. 6, 2020.<br />
As of the time of publication, the Special Slot Coordination period for<br />
the six primary airports handling traffic for the games has ended.<br />
APPLYING FOR SLOTS NOW THROUGH<br />
JULY<br />
Non-scheduled flight requests for the six airports will be coordinated<br />
at the Japan Civial Aviation Bureau Special Coordination Office if the<br />
relevant airport slot is still available. The three Tokyo Metro airports<br />
are expected to be in very high-demand. Slot requests submitted<br />
before the 20th of each month are expected to be replied to by the<br />
end of the same month. During July through September 2020, adhoc<br />
coordination may take place.<br />
CONCLUSION<br />
Japan has enacted several changes in 2020 and will be starting<br />
mandatory inspections of private jet passenger luggage at several<br />
airports. Japan has also expanded the allowance for domestic ops<br />
permits, adding a bit more flexibility.<br />
Operators planning a mission to Japan in 2020, must also be mindful<br />
of the Summer Games and Paralympics, which will require advance<br />
planning if traveling to any of the six designated Games airports.<br />
FOR THE FULL BREAKDOWN, VISIT:<br />
universalweather.com/japan2020<br />
FOURTH QUARTER <strong>2019</strong> — ASIAN SKY QUARTERLY | 45
THE NEW FLAGSHIP<br />
HAS ARRIVED<br />
Live life to the fullest in our new flagship, the Gulfstream G700 .<br />
The G700 features the tallest, widest and longest cabin in the industry, plus all-new,<br />
high-thrust Rolls-Royce engines and the award-winning Symmetry Flight Deck .<br />
46 | ASIAN SKY QUARTERLY — FOURTH QUARTER <strong>2019</strong>
FOURTH QUARTER <strong>2019</strong> — ASIAN SKY QUARTERLY | 47
AIRCRAFT POSITIONING - BUSINESS JET<br />
AIRCRAFT ACQUISITION VS. MAX RANGE<br />
CORP. AIRLINER<br />
LONG RANGE<br />
LARGE<br />
MEDIUM<br />
LIGHT<br />
VERY LIGHT<br />
ACJ321<br />
ACJ320<br />
BBJ3<br />
BBJ2<br />
24<br />
23<br />
22<br />
21<br />
20<br />
19<br />
18<br />
17<br />
16<br />
15<br />
14<br />
ACJ319 BBJ<br />
G650ER<br />
ACJ318<br />
G650<br />
GLOBAL 6000<br />
G550<br />
LINEAGE 1000E<br />
F8X<br />
GLOBAL 5000<br />
F7X<br />
G500<br />
F900LX<br />
13<br />
12<br />
11<br />
10<br />
9<br />
8<br />
CIT. XLS+<br />
LEGACY 500<br />
LEGACY 650<br />
LEGACY 600<br />
CIT. X+<br />
CIT. SOVEREIGN+ F2000DX<br />
CIT. LATITUDE<br />
L75<br />
CL850<br />
LEGACY 450<br />
CIT. SOVEREIGN<br />
H850XP<br />
CIT. X<br />
H4000<br />
CL350<br />
CL650<br />
G350<br />
CL300 G300<br />
F2000<br />
G150<br />
H900XP<br />
CL605<br />
F50EX<br />
G200<br />
GLOBAL EXPRESS XRS<br />
F2000LXS<br />
G450<br />
F2000S<br />
GLOBAL EXPRESS<br />
G280<br />
F900EX EASY<br />
F2000LX<br />
G-IVSP<br />
G-IV F900EX<br />
F2000EX<br />
CL604<br />
G-V<br />
7<br />
6<br />
5<br />
4<br />
3<br />
CIT. CJ4 L70<br />
H800XP<br />
CIT. VII<br />
PHENOM 300<br />
L45XR<br />
L60XR<br />
CIT. CJ3+ CIT. XLS<br />
CIT. EXCEL<br />
L40XR<br />
G100<br />
CIT. CJ2+ CIT. CJ3<br />
CIT. ENCORE+<br />
ASTRA SP<br />
CIT. M2 DIAMOND 1A<br />
CIT. ENCORE<br />
H800 CIT. ULTRA<br />
CIT. BRAVO<br />
CIT. CJ2<br />
NEXTANT 400XTI<br />
H400XP<br />
CIT. CJ1<br />
CIT. CJ1+<br />
BEECHJET 400<br />
PREMIER 1A<br />
HONDAJET<br />
PHENOM 100E<br />
CIT. MUSTANG<br />
2<br />
ECLIPSE 550<br />
1<br />
500<br />
1,000<br />
1,500<br />
2,000<br />
2,500<br />
3,000<br />
3,500<br />
4,000<br />
4,500<br />
5,000<br />
5,500<br />
6,000<br />
6,500<br />
7,000<br />
7,500<br />
8,000<br />
TOTAL ANNUAL COST (MILLION USD/YEAR)<br />
MAX RANGE (N.M.)<br />
* The estimated total yearly cost is based on aircraft ownership cost for 10 years including financing, plus annual operating costs and regional adjustments.<br />
Source: Conklin & de Decker <strong>2019</strong><br />
48 | ASIAN SKY QUARTERLY — FOURTH QUARTER <strong>2019</strong>
MARKET SUMMARY PER MODEL — BUSINESS JETS<br />
INVENTORY LEVEL, PRICE TREND & TRANSACTIONS<br />
ACJ318, ACJ319 & ACJ320<br />
MARKET SUMMARY -- JETS<br />
AIRBUS<br />
PERFORMANCE<br />
Max Range<br />
Max Speed<br />
Typ. Passengers<br />
ACJ318<br />
4,253 N.M. /7,877 km<br />
Mach 0.82<br />
19<br />
ACJ319<br />
6,000 N.M. /11,112 km<br />
Mach 0.82<br />
19<br />
ACJ320<br />
5,250 N.M. /9,723 km<br />
Mach 0.82<br />
19<br />
SUPPLY<br />
No. for Sale<br />
Avg Asking Price<br />
Avg Days on Market<br />
<strong>2019</strong> Dec <strong>2019</strong> Sep <strong>2019</strong> Dec <strong>2019</strong> Sep <strong>2019</strong> Dec <strong>2019</strong> Sep<br />
3 (15.8%) 3 (15.8%) 3 (4.1%) 5 (6.8%) 2 (11.1%) 2 (11.1%)<br />
26.0M USD 26.0M USD 45.5M USD 46.9M USD 39.5M USD 39.5M USD<br />
844 753<br />
929 700<br />
488 397<br />
TRANSACTION<br />
Past 12 Months<br />
Past 3 Months<br />
<strong>2019</strong> Dec <strong>2019</strong> Sep <strong>2019</strong> Dec <strong>2019</strong> Sep <strong>2019</strong> Dec <strong>2019</strong> Sep<br />
1<br />
1<br />
2<br />
2<br />
0<br />
0<br />
0<br />
1<br />
0<br />
1<br />
0<br />
0<br />
Average Asking Price<br />
ACJ318<br />
Market Indicators (vs. Last Quarter)<br />
$39.3<br />
$39.3<br />
$51.4<br />
$50.6<br />
$45.2<br />
ACJ319<br />
ACJ320<br />
Average<br />
$46.9<br />
$45.5<br />
$39.5 $39.5<br />
ACJ318<br />
Transaction Level (Past 12 Months)<br />
Inventory Level<br />
Average Asking Price<br />
Average Days on Market<br />
$37.0<br />
$29.3<br />
$39.5 $39.5 $39.5<br />
$30.3 $23.9 $23.7<br />
$25.3 $26.0<br />
ACJ319<br />
Transaction Level (Past 12 Months)<br />
Inventory Level<br />
$25.0<br />
$25.0<br />
Average Asking Price<br />
For Sale vs. Sold<br />
Average Days on Market<br />
Sold<br />
2<br />
For Sale<br />
1<br />
1<br />
1<br />
1<br />
ACJ320<br />
Transaction Level (Past 12 Months)<br />
Inventory Level<br />
9 9 7 7 9 7 8 7 10 11 11 12 12 11 11 11 10 10 10 11 11 10 9 9 8<br />
Average Asking Price<br />
Average Days on Market<br />
Dec Feb Apr Jun Aug Oct Dec Feb Apr Jun Aug Oct Dec<br />
2017 2018 <strong>2019</strong><br />
Source: AMSTAT & ASG<br />
FEATURED AIRCRAFT<br />
BBJ 787-8<br />
TOTAL HOURS: DELIVERY HOURS<br />
TOTAL CYCLES: DELIVERY CYCLES<br />
• Interior Completed <strong>2019</strong><br />
• Brand New Aircraft with Delivery Hours & Cycles Only<br />
• One of the Longest Ranged Business Jet - Capable of Flying 16 Hours<br />
Non-stop<br />
• 39 Passenger VVIP Configuration, with 2,415 square feet (224 square<br />
meters) Living Space including: a Master Suite, VIP Lounge, Dining<br />
Lounge, Business Class, Fwd & Aft Galley, Crew Rest Area and a gym.<br />
• Aero H+ Satcom w/ Ku-Band High Speed Internet<br />
• State-of-the-art avionics, including: New, Latest Generation FMC;<br />
SELCAL, ADS, FANS-1 & CPDLC; Dual Head-Up Displays; Weather<br />
Radar, TCAS & TAWS; Approved For GLS II Approaches<br />
FOURTH QUARTER <strong>2019</strong> — ASIAN SKY QUARTERLY | 49
MARKET SUMMARY -- JETS<br />
BBJ & BBJ2<br />
BOEING<br />
PERFORMANCE<br />
Max Range<br />
Max Speed<br />
Typ. Passengers<br />
BBJ<br />
6,235 N.M. / 11,547 km<br />
Mach 0.82<br />
19<br />
BBJ2<br />
5,620 N.M. / 10,408 km<br />
Mach 0.82<br />
19<br />
SUPPLY<br />
No. for Sale<br />
Avg Asking Price<br />
Avg Days on Market<br />
<strong>2019</strong> Dec <strong>2019</strong> Sep <strong>2019</strong> Dec <strong>2019</strong> Sep<br />
5 (3.7%) 7 (5.2%) 2 (8.7%) 2 (8.7%)<br />
48.0M USD 52.5M USD 90.0M USD 90.0M USD<br />
439 439<br />
313 222<br />
TRANSACTION<br />
Past 12 Months<br />
Past 3 Months<br />
<strong>2019</strong> Dec <strong>2019</strong> Sep <strong>2019</strong> Dec <strong>2019</strong> Sep<br />
5<br />
5<br />
1<br />
1<br />
0<br />
2<br />
0<br />
0<br />
Average Asking Price<br />
BBJ2<br />
BBJ<br />
Average<br />
$90.0 $90.0 $90.0<br />
Market Indicators (vs. Last Quarter)<br />
BBJ<br />
Transaction Level (Past 12 Months)<br />
Inventory Level<br />
Average Asking Price<br />
Average Days on Market<br />
$69.0<br />
$59.0<br />
$37.3 $37.3<br />
For Sale vs. Sold<br />
$58.0<br />
$40.9<br />
$58.0<br />
$43.4<br />
$50.0<br />
$53.0<br />
$48.0<br />
BBJ2<br />
Transaction Level (Past 12 Months)<br />
Inventory Level<br />
Average Asking Price<br />
Average Days on Market<br />
Sold<br />
For Sale<br />
1<br />
1<br />
1<br />
5<br />
1<br />
3<br />
1 2 2 1<br />
1<br />
3<br />
1<br />
1<br />
14 15 16 13 10 12 13 13 13 12 12 12 13 12 11 11 12 12 13 11 10 9<br />
9<br />
7<br />
7<br />
Dec Feb Apr Jun Aug Oct Dec Feb Apr Jun Aug Oct Dec<br />
2017 2018 <strong>2019</strong><br />
Source: AMSTAT & ASG<br />
FEATURED AIRCRAFT<br />
BELL HELCIOPTERS<br />
SIKORSKY<br />
BBJ2 SN42510<br />
TOTAL HOURS: DELIVERY HOURS<br />
TOTAL CYCLES: DELIVERY CYCLES<br />
• FAA FAR Part 91 Compliance<br />
• Delivered in June 2018<br />
• Total 4 Cockpit Seats + 2 Cabin Crew Seats + 27 TTOL Passenger Seats<br />
• Six Zone Cabin Configuration<br />
• Low Cabin Altitude System (6,500 ft cabin altitude at 41,000 cruising<br />
altitude)<br />
• Thermal and Acoustic Insulation Upgrade<br />
• Satcom & Internet Access<br />
• Additional Potable Water Tank<br />
• 5 Auxiliary Fuel Tanks (0 Fwd / 5 Aft)<br />
50 | ASIAN SKY QUARTERLY — FOURTH QUARTER <strong>2019</strong>
MARKET SUMMARY -- JETS<br />
CHALLENGER 300 & 350<br />
PERFORMANCE<br />
Max Range<br />
Max Speed<br />
Typ. Passengers<br />
CL300<br />
3,340 N.M. /6,185 km<br />
Mach 0.82<br />
19<br />
CL350<br />
3,421 N.M. /6,335 km<br />
Mach 0.82<br />
19<br />
SUPPLY<br />
No. for Sale<br />
Avg Asking Price<br />
Avg Days on Market<br />
TRANSACTION<br />
Past 12 Months<br />
Past 3 Months<br />
<strong>2019</strong> Dec <strong>2019</strong> Sep <strong>2019</strong> Dec <strong>2019</strong> Sep<br />
28 (6.2%) 31 (6.8%) 10 (3.2%) 6 (2.0%)<br />
9.8M USD 10.0M USD 15.6M USD 16.2M USD<br />
184 123<br />
98 127<br />
<strong>2019</strong> Dec <strong>2019</strong> Sep <strong>2019</strong> Dec <strong>2019</strong> Sep<br />
29<br />
4<br />
25<br />
8<br />
10<br />
1<br />
9<br />
4<br />
BOMBARDIER<br />
Average Asking Price<br />
CL350<br />
Market Indicators (vs. Last Quarter)<br />
$17.6 $17.4<br />
$16.7 $16.1<br />
CL300<br />
Average<br />
$15.6<br />
CL300<br />
Transaction Level (Past 12 Months)<br />
Inventory Level<br />
$15.7<br />
$16.2<br />
Average Asking Price<br />
Average Days on Market<br />
$10.1<br />
$10.0<br />
$9.5<br />
$9.8<br />
CL350<br />
Transaction Level (Past 12 Months)<br />
$7.9<br />
For Sale vs. Sold<br />
$8.4 $8.2<br />
Inventory Level<br />
Average Asking Price<br />
Average Days on Market<br />
Sold<br />
For Sale<br />
3 4 3<br />
5<br />
8<br />
1 4 4 7<br />
4 6 2 5<br />
4 7<br />
2<br />
4<br />
3 5 5<br />
2 3<br />
1<br />
2<br />
1<br />
27 26 27 26 25 21 23 25 27 25 26 23 22 17 24 23 28 36 37 36 35 37<br />
35<br />
36<br />
38<br />
Dec Feb Apr Jun Aug Oct Dec Feb Apr Jun Aug Oct Dec<br />
2017 2018 <strong>2019</strong><br />
Source: AMSTAT & ASG<br />
FEATURED AIRCRAFT<br />
CHALLENGER 350 SN20649<br />
TOTAL HOURS: 531 SINCE NEW<br />
TOTAL CYCLES: 200 SINCE NEW<br />
• Delivery Date: December 2016<br />
• Fully Enrolled on Programs: Honeywell MSP, BBD Smart Parts & CAMP<br />
Tracking<br />
• FANS 1/A+ (CPDLC & ADS-C), & TCAS 7.1<br />
• Gogo Biz Cabin Wifi & Swift Broadband High Speed Data<br />
• 3C Inspection Completed: December <strong>2019</strong><br />
• Aircraft Still Under Warranty<br />
• Single Owner Since New<br />
FOURTH QUARTER <strong>2019</strong> — ASIAN SKY QUARTERLY | 51
MARKET SUMMARY -- JETS<br />
CHALLENGER 604, 605 & 650<br />
PERFORMANCE<br />
Max Range<br />
Max Speed<br />
Typ. Passengers<br />
CL604<br />
4,027 N.M. / 7,458 km<br />
Mach 0.82<br />
9<br />
CL605<br />
4,123 N.M. / 7,635 km<br />
Mach 0.82<br />
9<br />
CL650<br />
4,123 N.M. / 7,635 km<br />
Mach 0.82<br />
10<br />
BOMBARDIER<br />
SUPPLY<br />
No. for Sale<br />
Avg Asking Price<br />
Avg Days on Market<br />
TRANSACTION<br />
Past 12 Months<br />
Past 3 Months<br />
<strong>2019</strong> Dec <strong>2019</strong> Sep <strong>2019</strong> Dec <strong>2019</strong> Sep <strong>2019</strong> Dec <strong>2019</strong> Sep<br />
17 (4.7%) 18 (5.0%) 25 (8.7%) 23 (8.0%) 6 (6.7%) 5 (6.0%)<br />
4.6M USD 5.0M USD 11.2M USD 11.8M USD 17.5M USD 18.2M USD<br />
300 350<br />
173 186<br />
190 156<br />
<strong>2019</strong> Dec <strong>2019</strong> Sep <strong>2019</strong> Dec <strong>2019</strong> Sep <strong>2019</strong> Dec <strong>2019</strong> Sep<br />
34<br />
10<br />
24<br />
9<br />
25<br />
6<br />
19<br />
4<br />
3<br />
1<br />
2<br />
0<br />
Average Asking Price<br />
CL650<br />
CL605<br />
CL604<br />
Average<br />
$18.7 $18.7 $18.7 $18.2<br />
$17.5<br />
Market Indicators (vs. Last Quarter)<br />
CL604<br />
Transaction Level (Past 12 Months)<br />
Inventory Level<br />
Average Asking Price<br />
$10.8<br />
$10.7<br />
$12.4 $12.0 $12.1 $11.9<br />
$11.2<br />
Average Days on Market<br />
CL605<br />
Transaction Level (Past 12 Months)<br />
$5.1<br />
$4.8<br />
$5.4 $5.0 $5.1 $4.9 $4.6<br />
Inventory Level<br />
$0.0<br />
$0.0<br />
For Sale vs. Sold<br />
Average Asking Price<br />
Average Days on Market<br />
6<br />
Sold<br />
11<br />
4<br />
For Sale<br />
6 8<br />
10<br />
4<br />
10<br />
7<br />
7 9<br />
8<br />
4<br />
11<br />
1<br />
5<br />
6 1<br />
9<br />
6<br />
2<br />
5<br />
7 7 3<br />
CL650<br />
Transaction Level (Past 12 Months)<br />
Inventory Level<br />
Average Asking Price<br />
48 50 49 41 40 35 35 28 33 28 25 32 34 35 34 34 37 43 49 50 49 46<br />
46 46 48<br />
Average Days on Market<br />
Dec Feb Apr Jun Aug Oct Dec Feb Apr Jun Aug Oct Dec<br />
2017 2018 <strong>2019</strong><br />
Source: AMSTAT & ASG<br />
FEATURED AIRCRAFT<br />
CITATION MUSTANG SN 5100441<br />
TOTAL HOURS: 793 SINCE NEW<br />
TOTAL CYCLES: 609 SINCE NEW<br />
• 5 Passenger Executive Configuration<br />
• Aircraft Enrolled on ProParts Program, Power Advantage & CESCOM<br />
• 2020 Avionics Compliance Ready<br />
• No Known Corrosion or Damage History<br />
• Always Hangared in Sapura Hangar, Subang<br />
• FAA Part 91 Maintained by Cessna Service Centre in Singapore<br />
• Fresh 36M Inspection at Cessna Singapore Center in December <strong>2019</strong><br />
52 | ASIAN SKY QUARTERLY — FOURTH QUARTER <strong>2019</strong>
MARKET SUMMARY -- JETS<br />
CHALLENGER 850<br />
Average Asking Price<br />
Market Indicators (vs. Last Quarter)<br />
$7.2<br />
$8.3<br />
$8.6 $8.6<br />
$8.1<br />
Transaction Level (Past 12 Months)<br />
Inventory Level<br />
Average Asking Price<br />
$7.2<br />
For Sale vs. Sold<br />
$6.5<br />
Average Days on Market<br />
PERFORMANCE<br />
Max Range<br />
Max Speed<br />
Typ. Passengers<br />
6,750 N.M. / 12,501 km<br />
Mach 0.87<br />
18<br />
BOMBARDIER<br />
Sold<br />
1<br />
For Sale<br />
1<br />
1<br />
1 1 1<br />
2<br />
3<br />
2<br />
1<br />
1<br />
16 17 17 16 16 15 12 10 8 8 8 8 8 7 8 8 8 9 9 9 9 8<br />
9 10 10<br />
Dec Feb Apr Jun Aug Oct Dec Feb Apr Jun Aug Oct Dec<br />
2017 2018 <strong>2019</strong><br />
SUPPLY<br />
No. for Sale<br />
Avg Asking Price<br />
Avg Days on Market<br />
TRANSACTION<br />
Past 12 Months<br />
Past 3 Months<br />
<strong>2019</strong> Dec <strong>2019</strong> Sep<br />
10 (11.5%) 8 (9.3%)<br />
8.1M USD 7.2M USD<br />
451 458<br />
<strong>2019</strong> Dec <strong>2019</strong> Sep<br />
8 6<br />
2 3<br />
Source: AMSTAT & ASG<br />
FOURTH QUARTER <strong>2019</strong> — ASIAN SKY QUARTERLY | 53
MARKET SUMMARY -- JETS<br />
GLOBAL EXPRESS, 5000, XRS & 6000<br />
PERFORMANCE<br />
Max Range<br />
Max Speed<br />
Typ. Passengers<br />
GLOBAL 5000<br />
5,350 N.M. / 9,908 km<br />
Mach 0.82<br />
13<br />
GLOBAL EXPRESS<br />
6,125 N.M. / 11,343 km<br />
Mach 0.82<br />
13<br />
GLOBAL XRS<br />
6,226 N.M. / 11,520 km<br />
Mach 0.82<br />
13<br />
GLOBAL 6000<br />
6,080 N.M. / 11,260 km<br />
Mach 0.82<br />
13<br />
BOMBARDIER<br />
SUPPLY<br />
No. for Sale<br />
Avg Asking Price<br />
Avg Days on Market<br />
TRANSACTION<br />
Past 12 Months<br />
Past 3 Months<br />
<strong>2019</strong> Dec <strong>2019</strong> Sep <strong>2019</strong> Dec <strong>2019</strong> Sep <strong>2019</strong> Dec <strong>2019</strong> Sep <strong>2019</strong> Dec <strong>2019</strong> Sep<br />
20 (8.8%) 27 (12.0%) 15 (10.3%) 16 (11.0%) 15 (9.2%) 15 (9.3%) 15 (4.8%) 10 (3.3%)<br />
16.8M USD 16.8M USD 10.2M USD 9.3M USD 29.8M USD 29.8M USD 36.7M USD 32.0M USD<br />
271 220<br />
326 307<br />
550 391<br />
151 139<br />
<strong>2019</strong> Dec <strong>2019</strong> Sep <strong>2019</strong> Dec <strong>2019</strong> Sep <strong>2019</strong> Dec <strong>2019</strong> Sep <strong>2019</strong> Dec <strong>2019</strong> Sep<br />
16<br />
6<br />
10<br />
4<br />
17<br />
6<br />
11<br />
5<br />
12<br />
2<br />
10<br />
3<br />
12<br />
3<br />
9<br />
3<br />
Average Asking Price<br />
GL EXPRESS<br />
GL6000<br />
Market Indicators (vs. Last Quarter)<br />
$40.1<br />
$38.1<br />
GL XRS<br />
GL5000<br />
Average<br />
GLOBAL 5000<br />
Transaction Level (Past 12 Months)<br />
$38.0<br />
$14.8<br />
3<br />
Sold<br />
9<br />
For Sale vs. Sold<br />
For Sale<br />
$31.0<br />
$19.5<br />
$18.2<br />
$20.2<br />
$12.6<br />
$7.7 $7.6 $8.4<br />
$27.7<br />
8<br />
3 8 7 4 5<br />
3 3<br />
5 11<br />
3<br />
$32.0<br />
$16.6<br />
$18.6<br />
$17.6<br />
$16.9<br />
$9.0 $8.8 $9.3 $10.2<br />
51 50 49 47 47 45 48 53 48 51 52 56 55 59 60 69 74 68 63 65 64 68<br />
7<br />
1<br />
5<br />
$33.6<br />
$33.0 $32.0<br />
3<br />
5<br />
5<br />
4<br />
$32.8<br />
3<br />
8<br />
6 10<br />
$36.7<br />
$29.8<br />
1<br />
66 61 65<br />
Inventory Level<br />
Average Asking Price<br />
Average Days on Market<br />
GLOBAL EXPRESS<br />
Transaction Level (Past 12 Months)<br />
Inventory Level<br />
Average Asking Price<br />
Average Days on Market<br />
GLOBAL XRS<br />
Transaction Level (Past 12 Months)<br />
Inventory Level<br />
Average Asking Price<br />
Average Days on Market<br />
GLOBAL 6000<br />
Transaction Level (Past 12 Months)<br />
Inventory Level<br />
Dec Feb Apr Jun Aug Oct Dec Feb Apr Jun Aug Oct Dec<br />
2017 2018 <strong>2019</strong><br />
Average Asking Price<br />
Average Days on Market<br />
Source: AMSTAT & ASG<br />
FEATURED AIRCRAFT<br />
LEGACY 500 SN55000072<br />
TOTAL HOURS: 596 SINCE NEW<br />
TOTAL CYCLES: 181 SINCE NEW<br />
• Very Low Hours & One Owner Since New<br />
• Airframe Enrolled on EECE<br />
• Engine & APU Enrolled on MSP Gold<br />
• Aircraft Enrolled on CAMP<br />
• 10 Passenger Executive Configuration with Fwd Galley<br />
• SATCOM, Swift Broadband High Speed Data and Cabin Wi-fi<br />
• RNP-1,2,4,5,10 Certification<br />
• SVS, EVS & HUD<br />
• ADS-B Out, FANS 1/A+, ATN-B1 CPDLC<br />
• Weather Radar, TCAS 7.1, CVR, ELT, FDR<br />
54 | ASIAN SKY QUARTERLY — FOURTH QUARTER <strong>2019</strong>
MARKET SUMMARY -- JETS<br />
CITATION CJ3 & CJ4<br />
PERFORMANCE<br />
Max Range<br />
Max Speed<br />
Typ. Passengers<br />
Cit. CJ3<br />
1,891 N.M. / 3,502 km<br />
Mach 0.73<br />
6<br />
Cit. CJ4<br />
1,991 N.M. / 3,687 km<br />
Mach 0.77<br />
7<br />
SUPPLY<br />
No. for Sale<br />
Avg Asking Price<br />
Avg Days on Market<br />
<strong>2019</strong> Dec <strong>2019</strong> Sep <strong>2019</strong> Dec <strong>2019</strong> Sep<br />
34 (8.3%) 32 (7.8%) 17 (5.6%) 11 (3.7%)<br />
3.6M USD 3.7M USD 6.0M USD 6.1M USD<br />
162 171<br />
125 115<br />
TRANSACTION<br />
Past 12 Months<br />
Past 3 Months<br />
<strong>2019</strong> Dec <strong>2019</strong> Sep <strong>2019</strong> Dec <strong>2019</strong> Sep<br />
57 38<br />
27 26<br />
19 15<br />
6<br />
5<br />
Average Asking Price<br />
CJ4<br />
CJ3<br />
Average<br />
Market Indicators (vs. Last Quarter)<br />
Cit. CJ3<br />
Transaction Level (Past 12 Months)<br />
CESSNA<br />
$6.6<br />
$6.2<br />
$6.1<br />
$6.3<br />
$6.6<br />
$6.2<br />
$6.0<br />
Inventory Level<br />
Average Asking Price<br />
Average Days on Market<br />
$4.4<br />
$4.4 $4.3<br />
$4.7<br />
Cit. CJ4<br />
Transaction Level (Past 12 Months)<br />
Inventory Level<br />
$3.8<br />
For Sale vs. Sold<br />
$3.8<br />
$3.6<br />
Average Asking Price<br />
Average Days on Market<br />
Sold<br />
8<br />
18<br />
For Sale<br />
2 4<br />
8<br />
6<br />
3<br />
4<br />
5<br />
4<br />
5<br />
10<br />
11<br />
14<br />
3<br />
6<br />
3 9 6<br />
4 6<br />
10<br />
9<br />
9<br />
9<br />
31 27 24 23 29 29 29 32 34 38 40 46 44 36 37 45 46 54 50 51 44 43<br />
46 54 51<br />
Dec Feb Apr Jun Aug Oct Dec Feb Apr Jun Aug Oct Dec<br />
2017 2018 <strong>2019</strong><br />
Source: AMSTAT & ASG<br />
FEATURED AIRCRAFT<br />
LINEAGE 1000 SN19000453<br />
TOTAL HOURS: 985 SINCE NEW<br />
TOTAL CYCLES: 327 SINCE NEW<br />
• Capable Of Connecting London - Cape Town Or Paris - New York Non-Stop.<br />
• Flexible Operations At London City, Aspen And Teterboro Airport<br />
• Wide Body Cabin With 5 Zones And Up To 19 Seats<br />
• Baggage Compartment For Up To 30 Large Suitcases<br />
• Fly-By-Wire Controls, Dual FMS/VHF/MCDU/CCD<br />
• CPDLC/ADSB-OUT/QAR/EFB<br />
• Printer / Fax Machine / Four Cabin Cordless Telephone Handsets<br />
• Universal Power Outlet / Reading Light And Proximity Light On Each Seat<br />
• Seat Personal Control Unit /Adjustable Headrest & Legrest<br />
• 1000 Hours Only Since New, No Damage History<br />
FOURTH QUARTER <strong>2019</strong> — ASIAN SKY QUARTERLY | 55
MARKET SUMMARY -- JETS<br />
CITATION LATITUDE<br />
Average Asking Price<br />
Market Indicators (vs. Last Quarter)<br />
$13.7<br />
$13.3 $13.0<br />
Transaction Level (Past 12 Months)<br />
Inventory Level<br />
Average Asking Price<br />
Average Days on Market<br />
$12.3 $12.3 $12.3<br />
For Sale vs. Sold<br />
$12.3<br />
PERFORMANCE<br />
Max Range<br />
Max Speed<br />
Typ. Passengers<br />
2,870N.M. / 5,315 km<br />
Mach 0.80<br />
9<br />
CESSNA<br />
Sold<br />
For Sale<br />
2<br />
1<br />
1<br />
SUPPLY<br />
No. for Sale<br />
Avg Asking Price<br />
Avg Days on Market<br />
<strong>2019</strong> Dec <strong>2019</strong> Sep<br />
6 (2.8%) 5 (2.5%)<br />
13.0M USD 13.4M USD<br />
180 252<br />
1<br />
1 1<br />
2 1 3 4 4 4 4 2 2 2 2 2 1 2 3 4 4 5 5 5 5 5<br />
1<br />
7 6 6<br />
Dec Feb Apr Jun Aug Oct Dec Feb Apr Jun Aug Oct Dec<br />
2017 2018 <strong>2019</strong><br />
1<br />
TRANSACTION<br />
Past 12 Months<br />
Past 3 Months<br />
<strong>2019</strong> Dec <strong>2019</strong> Sep<br />
5 3<br />
2 2<br />
CITATION SOVEREIGN<br />
Average Asking Price<br />
Market Indicators (vs. Last Quarter)<br />
$7.3<br />
$7.1 $7.0 $7.7<br />
$6.2<br />
For Sale vs. Sold<br />
$6.6 $5.9<br />
Transaction Level (Past 12 Months)<br />
Inventory Level<br />
Average Asking Price<br />
Average Days on Market<br />
PERFORMANCE<br />
Max Range<br />
Max Speed<br />
Typ. Passengers<br />
3,010N.M. / 5,574 km<br />
Mach 0.80<br />
9<br />
5<br />
Sold<br />
3<br />
1<br />
For Sale<br />
5<br />
5<br />
7<br />
9<br />
5<br />
5<br />
4<br />
2<br />
33 33 37 36 31 26 21 19 12 14 14 19 18 18 23 22 24 22 22 22 15 17<br />
5<br />
3<br />
14 18 17<br />
Dec Feb Apr Jun Aug Oct Dec Feb Apr Jun Aug Oct Dec<br />
2017 2018 <strong>2019</strong><br />
4<br />
2<br />
2<br />
4<br />
2 3<br />
4<br />
3<br />
2<br />
2<br />
1<br />
SUPPLY<br />
No. for Sale<br />
Avg Asking Price<br />
Avg Days on Market<br />
TRANSACTION<br />
Past 12 Months<br />
Past 3 Months<br />
<strong>2019</strong> Dec <strong>2019</strong> Sep<br />
17 (4.9%) 17 (4.9%)<br />
5.9M USD 6.6M USD<br />
162 117<br />
<strong>2019</strong> Dec <strong>2019</strong> Sep<br />
27 22<br />
5 9<br />
Source: AMSTAT & ASG<br />
56 | ASIAN SKY QUARTERLY — FOURTH QUARTER <strong>2019</strong>
MARKET SUMMARY -- JETS<br />
FALCON 900DX/EX/EX EASy/LX<br />
PERFORMANCE<br />
Max Range<br />
Max Speed<br />
Typ. Passengers<br />
F900DX<br />
4,100 N.M. /7,593 km<br />
Mach 0.83<br />
12<br />
F900EX<br />
4,500 N.M. /8,334 km<br />
Mach 0.83<br />
12<br />
F900EX EASy<br />
4,500 N.M. /8,334 km<br />
Mach 0.83<br />
12<br />
F900LX<br />
4,750 N.M. /8,800 km<br />
Mach 0.83<br />
12<br />
SUPPLY<br />
No. for Sale<br />
Avg Asking Price<br />
Avg Days on Market<br />
<strong>2019</strong> Dec <strong>2019</strong> Sep <strong>2019</strong> Dec <strong>2019</strong> Sep <strong>2019</strong> Dec <strong>2019</strong> Sep <strong>2019</strong> Dec <strong>2019</strong> Sep<br />
4 (16.7%) 2 (8.3%) 5 (4.2%) 6 (5.1%) 10 (8.3%) 5 (4.2%) 1 (1.4%) 2 (2.7%)<br />
12.7M USD 12.4M USD 6.9M USD 7.5M USD 14.4M USD 15.9M USD 21.7M USD 23.9M USD<br />
248 336<br />
179 217<br />
113 259<br />
53 259<br />
TRANSACTION<br />
Past 12 Months<br />
Past 3 Months<br />
<strong>2019</strong> Dec <strong>2019</strong> Sep <strong>2019</strong> Dec <strong>2019</strong> Sep <strong>2019</strong> Dec <strong>2019</strong> Sep <strong>2019</strong> Dec <strong>2019</strong> Sep<br />
3<br />
2<br />
11 6<br />
11 11<br />
6<br />
5<br />
1<br />
2<br />
5<br />
1<br />
0<br />
2<br />
1<br />
1<br />
Average Asking Price<br />
F900EX EASy<br />
F900EX<br />
Market Indicators (vs. Last Quarter)<br />
F900LX<br />
F900DX<br />
Average<br />
F900DX<br />
Transaction Level (Past 12 Months)<br />
Inventory Level<br />
$21.0<br />
$19.0<br />
$22.2<br />
$17.7<br />
$18.5<br />
$15.2<br />
5.4<br />
$24.5 $24.5<br />
$21.7<br />
$15.0 $14.9 $14.4<br />
Average Asking Price<br />
Average Days on Market<br />
F900EX<br />
Transaction Level (Past 12 Months)<br />
Inventory Level<br />
DASSAULT<br />
$11.5<br />
$12.5<br />
$6.5 $6.4<br />
For Sale vs. Sold<br />
Sold For Sale<br />
$12.5 $12.5 $12.5 $12.9 $12.7<br />
$7.4 $6.5 $6.9 $7.5 $6.9<br />
Average Asking Price<br />
Average Days on Market<br />
F900EX EASy<br />
Transaction Level (Past 12 Months)<br />
Inventory Level<br />
Average Asking Price<br />
4 4<br />
3<br />
2<br />
5<br />
1 4<br />
1 3 2 2<br />
5<br />
3<br />
6<br />
1<br />
2<br />
1<br />
2<br />
6<br />
2<br />
2<br />
2<br />
2<br />
4<br />
1<br />
Average Days on Market<br />
F900LX<br />
Transaction Level (Past 12 Months)<br />
Inventory Level<br />
23 24 28 25 26 24 23 24 23 22 24 17 18 19 18 19 18 16 17 17 16 15 16 21 20<br />
Dec Feb Apr Jun Aug Oct Dec Feb Apr Jun Aug Oct Dec<br />
2017 2018 <strong>2019</strong><br />
Average Asking Price<br />
Average Days on Market<br />
Source: AMSTAT & ASG<br />
FEATURED AIRCRAFT<br />
G450 SN4202<br />
TOTAL HOURS: 2,604 SINCE NEW<br />
TOTAL CYCLES: 953 SINCE NEW<br />
• 14 Passenger Configuration with Forward Galley<br />
• Engines Enrolled on RRCC<br />
• APU Enrolled on MSP<br />
• Airframe Enrolled on Gulfstream Planeparts<br />
• FAA Compliant, EASA Validation<br />
• ADSB-Out, High Speed Data, FM Immunity<br />
• FANS-1A, CPDLC, TCAS7.1<br />
• Honeywell Head Up Display / Visual Guidance System<br />
• Fresh Annual Inspection<br />
• 96 Month Inspection Completed<br />
FOURTH QUARTER <strong>2019</strong> — ASIAN SKY QUARTERLY | 57
MARKET SUMMARY -- JETS<br />
FALCON 2000LX/LXS/S<br />
PERFORMANCE<br />
Max Range<br />
Max Speed<br />
Typ. Passengers<br />
F2000LX<br />
4,000 N.M. /7,408 km<br />
Mach 0.83<br />
10<br />
F2000LXS<br />
4,000 N.M. /7,408 km<br />
Mach 0.83<br />
10<br />
F2000S<br />
3,350 N.M. /6,208 km<br />
Mach 0.83<br />
10<br />
SUPPLY<br />
No. for Sale<br />
Avg Asking Price<br />
Avg Days on Market<br />
<strong>2019</strong> Dec <strong>2019</strong> Sep <strong>2019</strong> Dec <strong>2019</strong> Sep <strong>2019</strong> Dec <strong>2019</strong> Sep<br />
8 (6.1%) 6 (4.5%) 7 (7.6%) 6 (6.7%) 1 (2.4%) 0 (0.0%)<br />
15.0M USD 14.2M USD 22.3M USD 22.6M USD 27.7M USD N/A.<br />
162 141<br />
178 170<br />
74 0<br />
TRANSACTION<br />
Past 12 Months<br />
Past 3 Months<br />
<strong>2019</strong> Dec <strong>2019</strong> Sep <strong>2019</strong> Dec <strong>2019</strong> Sep <strong>2019</strong> Dec <strong>2019</strong> Sep<br />
7<br />
7<br />
6<br />
3<br />
2<br />
2<br />
0<br />
1<br />
3<br />
0<br />
0<br />
1<br />
Average Asking Price<br />
F2000S<br />
F2000LXS<br />
F2000LX<br />
Average<br />
Market Indicators (vs. Last Quarter)<br />
F2000LX<br />
Transaction Level (Past 12 Months)<br />
Inventory Level<br />
DASSAULT<br />
$27.9<br />
$19.0<br />
$13.6<br />
$25.0<br />
$17.9<br />
$14.3<br />
$25.0 $25.0<br />
$17.5<br />
$16.5<br />
$16.5<br />
$14.5<br />
$24.1<br />
$23.1<br />
$16.0<br />
$27.7<br />
$22.6 $22.3<br />
$14.2 $15.0<br />
Average Asking Price<br />
Average Days on Market<br />
F2000LXS<br />
Transaction Level (Past 12 Months)<br />
Inventory Level<br />
Average Asking Price<br />
Average Days on Market<br />
F2000S<br />
Transaction Level (Past 12 Months)<br />
For Sale vs. Sold<br />
Inventory Level<br />
Sold<br />
2<br />
For Sale<br />
3 2 2<br />
1<br />
4<br />
2<br />
2<br />
1 3<br />
2<br />
1<br />
2<br />
1<br />
1<br />
1<br />
2<br />
1<br />
1<br />
2<br />
1<br />
Average Asking Price<br />
Average Days on Market<br />
10 11 9 10 10 7 7 7 7 8 9 8 9 7 7 8 11 11 11 11 13 12<br />
14 16 16<br />
Dec Feb Apr Jun Aug Oct Dec Feb Apr Jun Aug Oct Dec<br />
2017 2018 <strong>2019</strong><br />
Source: AMSTAT & ASG<br />
FEATURED AIRCRAFT<br />
FALCON 7X SN 251<br />
TOTAL HOURS: 1,512 SINCE NEW<br />
TOTAL CYCLES: 754 SINCE NEW<br />
• 16 Passenger Configuration, Fwd Galley & Aft Lavatory<br />
• Aircraft Enrolled on ESP Gold & MSP<br />
• 2020 Avionics Mandate Ready: EASy II Upgrade including ADS-B Out,<br />
FANS 1A+ & CPDLC<br />
• Lightning Sensor System, Electronic Jeppesen Charts, SSQAR<br />
• Aero H+ Inmarsat Satcom, Classic & Swift Broadband w/ Cabin Wifi<br />
58 | ASIAN SKY QUARTERLY — FOURTH QUARTER <strong>2019</strong>
MARKET SUMMARY -- JETS<br />
FALCON 7X<br />
Average Asking Price<br />
Market Indicators (vs. Last Quarter)<br />
$27.5<br />
Transaction Level (Past 12 Months)<br />
Inventory Level<br />
Average Asking Price<br />
$23.3<br />
$23.2<br />
Average Days on Market<br />
$22.2<br />
For Sale vs. Sold<br />
$21.7<br />
$23.2<br />
$21.2<br />
PERFORMANCE<br />
Max Range<br />
Max Speed<br />
Typ. Passengers<br />
5,950 N.M. / 11,018 km<br />
Mach 0.90<br />
12<br />
Sold For Sale<br />
2 2 1 4<br />
4 6<br />
5<br />
2 2<br />
2<br />
2<br />
2 3<br />
4<br />
1<br />
4 2<br />
2 1 1<br />
4<br />
1<br />
3 2<br />
2<br />
21 22 24 20 18 19 17 18 16 14 11 9 12 15 15 18 17 17 16 16 17 19 18 14 15<br />
Dec Feb Apr Jun Aug Oct Dec Feb Apr Jun Aug Oct Dec<br />
2017 2018 <strong>2019</strong><br />
SUPPLY<br />
No. for Sale<br />
Avg Asking Price<br />
Avg Days on Market<br />
TRANSACTION<br />
Past 12 Months<br />
Past 3 Months<br />
<strong>2019</strong> Dec <strong>2019</strong> Sep<br />
15 (5.2%) 19 (6.6%)<br />
21.2M USD 23.3M USD<br />
239 197<br />
<strong>2019</strong> Dec <strong>2019</strong> Sep<br />
27 21<br />
6 5<br />
DASSAULT<br />
Source: AMSTAT & ASG<br />
FOURTH QUARTER <strong>2019</strong> — ASIAN SKY QUARTERLY | 59
MARKET SUMMARY -- JETS<br />
PHENOM 300<br />
Average Asking Price<br />
Market Indicators (vs. Last Quarter)<br />
Transaction Level (Past 12 Months)<br />
$6.9<br />
$7.2<br />
Inventory Level<br />
Average Asking Price<br />
$6.7<br />
Average Days on Market<br />
$6.7<br />
$6.9<br />
For Sale vs. Sold<br />
$6.2<br />
$6.8<br />
PERFORMANCE<br />
Max Range<br />
Max Speed<br />
Typ. Passengers<br />
1,242 N.M. / 2,300 km<br />
Mach 0.78<br />
5<br />
2<br />
Sold<br />
6<br />
For Sale<br />
2<br />
1<br />
2<br />
4<br />
2<br />
8<br />
3<br />
2 1 2<br />
2<br />
6<br />
1<br />
3<br />
2 2<br />
4<br />
5<br />
3 3 2<br />
SUPPLY<br />
No. for Sale<br />
Avg Asking Price<br />
Avg Days on Market<br />
<strong>2019</strong> Dec <strong>2019</strong> Sep<br />
20 (4.4%) 21 (4.7%)<br />
6.7M USD 6.8M USD<br />
287 213<br />
15 14 13 16 16 18 19 16 17 10 13 15 16 16 18 18 19 18 19 19 20 21<br />
20 20<br />
20<br />
TRANSACTION<br />
Past 12 Months<br />
Past 3 Months<br />
<strong>2019</strong> Dec <strong>2019</strong> Sep<br />
35 27<br />
8 11<br />
Dec Feb Apr Jun Aug Oct Dec Feb Apr Jun Aug Oct Dec<br />
2017 2018 <strong>2019</strong><br />
EMBRAER<br />
LEGACY 600/650<br />
Average Asking Price<br />
L650<br />
L600<br />
Average<br />
Market Indicators (vs. Last Quarter)<br />
L600<br />
Transaction Level (Past 12 Months)<br />
L650<br />
$12.5 $12.5<br />
$11.7<br />
$12.7<br />
$15.1<br />
$14.2<br />
$14.0<br />
Inventory Level<br />
Average Asking Price<br />
Average Days on Market<br />
$6.6 $6.9<br />
For Sale vs. Sold<br />
Sold For Sale<br />
$7.3 $7.0 $7.2 $5.1<br />
$5.7<br />
PERFORMANCE<br />
Max Range<br />
Max Speed<br />
Typ. Passengers<br />
L600 L650<br />
3,400 N.M. 3,640 N.M.<br />
6,297 km 7,112 km<br />
Mach 0.80 Mach 0.80<br />
13 13<br />
4<br />
1<br />
5<br />
1<br />
3<br />
7<br />
7<br />
3 3<br />
4 3<br />
3<br />
2 1<br />
3<br />
1<br />
2<br />
2<br />
1<br />
3<br />
SUPPLY<br />
No. for Sale<br />
Avg Asking Price<br />
Avg Days on Market<br />
Dec | Sep<br />
18 | 15<br />
5.1M USD<br />
4.7M USD<br />
242 | 307<br />
Dec | Sep<br />
7 | 6<br />
14.0M USD<br />
15.1M USD<br />
259 | 203<br />
28 27 25 24 23 20 21 20 24 24 21 22 22 21 21 25 23 21 22 24 21 21<br />
22 21 25<br />
Dec Feb Apr Jun Aug Oct Dec Feb Apr Jun Aug Oct Dec<br />
2017 2018 <strong>2019</strong><br />
TRANSACTION<br />
Past 12 Months<br />
Past 3 Months<br />
Dec | Sep<br />
21 | 18<br />
3 | 7<br />
Dec | Sep<br />
10 | 7<br />
3 | 1<br />
Source: AMSTAT & ASG<br />
60 | ASIAN SKY QUARTERLY — FOURTH QUARTER <strong>2019</strong>
MARKET SUMMARY -- JETS<br />
LINEAGE 1000/E<br />
Average Asking Price<br />
Market Indicators (vs. Last Quarter)<br />
Transaction Level (Past 12 Months)<br />
$17.9<br />
$18.8<br />
$19.0<br />
$21.6<br />
$20.2<br />
Inventory Level<br />
Average Asking Price<br />
Average Days on Market<br />
$15.7<br />
$16.8<br />
PERFORMANCE<br />
Max Range<br />
4,400 N.M. / 8,149 km<br />
Max Speed<br />
Mach 0.82<br />
For Sale vs. Sold<br />
Typ. Passengers<br />
19<br />
Sold<br />
1<br />
For Sale<br />
1<br />
1<br />
SUPPLY<br />
No. for Sale<br />
Avg Asking Price<br />
Avg Days on Market<br />
<strong>2019</strong> Dec <strong>2019</strong> Sep<br />
7 (41.2%) 6 (35.3%)<br />
20.2M USD 20.6M USD<br />
567 561<br />
7 7 6 6 5 4 5 5 6 6 7 7 7 8 9 9 9 9 9 9 6 6<br />
6 7<br />
7<br />
TRANSACTION<br />
Past 12 Months<br />
<strong>2019</strong> Dec <strong>2019</strong> Sep<br />
1 0<br />
Past 3 Months<br />
1<br />
0<br />
Dec Feb Apr Jun Aug Oct Dec Feb Apr Jun Aug Oct Dec<br />
2017 2018 <strong>2019</strong><br />
Source: AMSTAT & ASG<br />
EMBRAER<br />
FOURTH QUARTER <strong>2019</strong> — ASIAN SKY QUARTERLY | 61
MARKET SUMMARY -- JETS<br />
G200<br />
Average Asking Price<br />
Market Indicators (vs. Last Quarter)<br />
$4.8<br />
Transaction Level (Past 12 Months)<br />
$4.3<br />
$4.6<br />
$4.3<br />
Inventory Level<br />
Average Asking Price<br />
Average Days on Market<br />
$4.0<br />
$3.8<br />
PERFORMANCE<br />
Max Range<br />
3,050 N.M. / 5,651 km<br />
For Sale vs. Sold<br />
$3.0<br />
Max Speed<br />
Typ. Passengers<br />
Mach 0.81<br />
8<br />
Sold<br />
4<br />
For Sale<br />
2 3<br />
3<br />
1<br />
3<br />
3<br />
3<br />
6<br />
2<br />
2<br />
2<br />
4<br />
4<br />
1<br />
1<br />
4<br />
2 2<br />
4<br />
1<br />
3<br />
1<br />
3<br />
SUPPLY<br />
No. for Sale<br />
Avg Asking Price<br />
Avg Days on Market<br />
<strong>2019</strong> Dec<br />
24 (9.9%)<br />
4.3M USD<br />
254<br />
<strong>2019</strong> Sep<br />
28 (11.6%)<br />
4.0M USD<br />
226<br />
32 31 33 31 27 25 24 20 17 17 21 26 27 23 20 21 25 27 27 27 28 28<br />
25 27<br />
24<br />
TRANSACTION<br />
Past 12 Months<br />
<strong>2019</strong> Dec<br />
30<br />
<strong>2019</strong> Sep<br />
23<br />
Past 3 Months<br />
7<br />
7<br />
Dec Feb Apr Jun Aug Oct Dec Feb Apr Jun Aug Oct Dec<br />
2017 2018 <strong>2019</strong><br />
G280<br />
Average Asking Price<br />
Market Indicators (vs. Last Quarter)<br />
GULFSTREAM<br />
$16.8<br />
$17.7<br />
$17.5<br />
$15.8<br />
$16.0<br />
$15.4<br />
Transaction Level (Past 12 Months)<br />
Inventory Level<br />
Average Asking Price<br />
Average Days on Market<br />
$14.0<br />
PERFORMANCE<br />
Max Range<br />
3,600 N.M. / 6,667 km<br />
Max Speed<br />
Mach 0.84<br />
For Sale vs. Sold<br />
Typ. Passengers<br />
8<br />
Sold<br />
For Sale<br />
1<br />
1<br />
SUPPLY<br />
No. for Sale<br />
<strong>2019</strong> Dec<br />
11 (6.1%)<br />
<strong>2019</strong> Sep<br />
9 (5.2%)<br />
Avg Asking Price<br />
15.4M USD<br />
16.0M USD<br />
Avg Days on Market<br />
139<br />
110<br />
3<br />
1<br />
1 2<br />
1<br />
TRANSACTION<br />
Past 12 Months<br />
<strong>2019</strong> Dec<br />
5<br />
<strong>2019</strong> Sep<br />
3<br />
2 2 2 3 2 1 1 3 3 3 2 2 4 4 4<br />
4<br />
4<br />
4<br />
7<br />
9 8<br />
9<br />
10<br />
12<br />
11<br />
Past 3 Months<br />
2<br />
0<br />
Dec Feb Apr Jun Aug Oct Dec Feb Apr Jun Aug Oct Dec<br />
2017 2018 <strong>2019</strong><br />
Source: AMSTAT & ASG<br />
62 | ASIAN SKY QUARTERLY — FOURTH QUARTER <strong>2019</strong>
MARKET SUMMARY -- JETS<br />
G450<br />
Average Asking Price<br />
Market Indicators (vs. Last Quarter)<br />
$16.7<br />
$16.9<br />
$16.3<br />
Transaction Level (Past 12 Months)<br />
Inventory Level<br />
$15.1<br />
$14.9<br />
$15.4<br />
Average Asking Price<br />
Average Days on Market<br />
For Sale vs. Sold<br />
$14.4<br />
PERFORMANCE<br />
Max Range<br />
Max Speed<br />
Typ. Passengers<br />
4,350 N.M. / 8,056 km<br />
Mach 0.85<br />
13<br />
Sold For Sale<br />
4<br />
3<br />
5<br />
1 3 3 4 3 2<br />
4<br />
1<br />
5 5<br />
6<br />
2<br />
4<br />
3<br />
1<br />
2<br />
3<br />
5<br />
4<br />
2<br />
1<br />
SUPPLY<br />
No. for Sale<br />
Avg Asking Price<br />
Avg Days on Market<br />
<strong>2019</strong> Dec<br />
23 (6.5%)<br />
14.4M USD<br />
266<br />
<strong>2019</strong> Sep<br />
23 (6.5%)<br />
15.8M USD<br />
281<br />
22 22 20 20 19 18 20 20 23 24 20 20 18 18 17 22 25 22 21 23 23 23<br />
21 28<br />
29<br />
TRANSACTION<br />
Past 12 Months<br />
Past 3 Months<br />
<strong>2019</strong> Dec<br />
38<br />
7<br />
<strong>2019</strong> Sep<br />
31<br />
10<br />
Dec Feb Apr Jun Aug Oct Dec Feb Apr Jun Aug Oct Dec<br />
2017 2018 <strong>2019</strong><br />
G550<br />
Average Asking Price<br />
Market Indicators (vs. Last Quarter)<br />
$23.9<br />
$23.3<br />
For Sale vs. Sold<br />
$28.0<br />
$26.5<br />
$22.7<br />
$22.2<br />
$21.9<br />
Transaction Level (Past 12 Months)<br />
Inventory Level<br />
Average Asking Price<br />
Average Days on Market<br />
PERFORMANCE<br />
Max Range<br />
Max Speed<br />
Typ. Passengers<br />
6,750 N.M. / 12,501 km<br />
Mach 0.87<br />
18<br />
GULFSTREAM<br />
Sold For Sale<br />
5<br />
2 2<br />
3 5<br />
4<br />
3 5<br />
3 2<br />
4<br />
3<br />
3 4 1 3 3<br />
2<br />
4<br />
4<br />
4 3<br />
2<br />
2<br />
24 22 17 19 21 24 29 24 27 26 24 27 28 27 26 27 18 18 19 24 31 32 31 33 33<br />
SUPPLY<br />
No. for Sale<br />
Avg Asking Price<br />
Avg Days on Market<br />
TRANSACTION<br />
Past 12 Months<br />
Past 3 Months<br />
<strong>2019</strong> Dec <strong>2019</strong> Sep<br />
33 (5.7%) 32 (5.6%)<br />
21.9M USD 22.9M USD<br />
166 162<br />
<strong>2019</strong> Dec <strong>2019</strong> Sep<br />
34<br />
9<br />
25<br />
5<br />
Dec Feb Apr Jun Aug Oct Dec Feb Apr Jun Aug Oct Dec<br />
2017 2018 <strong>2019</strong><br />
Source: AMSTAT & ASG<br />
FOURTH QUARTER <strong>2019</strong> — ASIAN SKY QUARTERLY | 63
MARKET SUMMARY -- JETS<br />
G650 & G650 ER<br />
Average Asking Price<br />
G650ER<br />
Market Indicators (vs. Last Quarter)<br />
$65.2<br />
$64.3<br />
$61.9<br />
G650<br />
Average<br />
Transaction Level (Past 12 Months)<br />
Inventory Level<br />
G650<br />
G650ER<br />
$56.6<br />
$58.3<br />
$56.7<br />
$56.5<br />
$52.2<br />
Average Asking Price<br />
Average Days on Market<br />
For Sale vs. Sold<br />
Sold For Sale<br />
$53.4<br />
$52.4<br />
$50.9 $47.0<br />
$45.9<br />
$44.9<br />
PERFORMANCE<br />
Max Range<br />
Max Speed<br />
Typ. Passengers<br />
G650 G650ER<br />
7,000 N.M. 7,500 N.M.<br />
12,964 km 13,890 km<br />
Mach 0.90 Mach 0.90<br />
18 18<br />
2<br />
1 2<br />
1<br />
2<br />
2<br />
3<br />
2 1 3 3<br />
2 3<br />
4 2<br />
1<br />
1 1 1 1<br />
1<br />
SUPPLY<br />
No. for Sale<br />
Avg Asking Price<br />
Avg Days on Market<br />
Dec | Sep<br />
9 | 6<br />
44.9M USD<br />
45.5M USD<br />
116 | 134<br />
Dec | Sep<br />
8 | 10<br />
52.2M USD<br />
46.7M USD<br />
142 | 133<br />
17 15 12 12 16 20 16 13 11 15 18 14 12 12 9 10 15 16 15 16 16 16<br />
17 15 17<br />
Dec Feb Apr Jun Aug Oct Dec Feb Apr Jun Aug Oct Dec<br />
2017 2018 <strong>2019</strong><br />
TRANSACTION<br />
Past 12 Months<br />
Past 3 Months<br />
Dec | Sep Dec | Sep<br />
9 | 8 6 | 5<br />
1 | 1 1 | 1<br />
Source: AMSTAT & ASG<br />
GULFSTREAM<br />
64 | ASIAN SKY QUARTERLY — FOURTH QUARTER <strong>2019</strong>
AIRCRAFT POSITIONING - CIVIL HELICOPTERS<br />
ACQUISITION COST VS. MAX RANGE<br />
AIRCRAFT ACQUISITION PRICE (MILLION USD)<br />
6<br />
5<br />
4<br />
3<br />
2<br />
1<br />
0<br />
HEAVY<br />
(SUPER) MEDIUM<br />
LIGHT TWIN<br />
SINGLE TURBINE<br />
PISTON<br />
100<br />
S-76D<br />
BELL 412EPI<br />
H135(T3)<br />
BELL 430<br />
MD902<br />
BELL 429<br />
MD530F BELL 206L4<br />
MD502N<br />
MD600N<br />
MD550E R66<br />
R22 BETA II<br />
R44 RAVEN II<br />
H225<br />
BELL 407GXP<br />
H215(C1)<br />
S-76C++<br />
H145<br />
S-92<br />
200 300 400<br />
500<br />
600 700<br />
MAXIMUM RANGE (N.M)<br />
H155<br />
BELL 505<br />
EN480B BELL 407<br />
AW169<br />
AW109 GRANDNEW<br />
AW109 POWER<br />
H125<br />
H130 AW119KX<br />
H120<br />
H175<br />
AW139<br />
AW189<br />
ACQUISITION COST VS. MAX TAKEOFF WEIGHT<br />
AIRCRAFT ACQUISITION PRICE (MILLION USD)<br />
8<br />
4<br />
2<br />
1<br />
0.5<br />
0.25<br />
1000<br />
HEAVY<br />
(SUPER) MEDIUM<br />
LIGHT TWIN<br />
SINGLE TURBINE<br />
PISTON<br />
2000<br />
MD500E<br />
EN480B<br />
R66<br />
R44 RAVEN II<br />
R22 BETA II<br />
MD520N<br />
MD530F<br />
H120<br />
MD 902<br />
H135(T3)<br />
AW109 POWER<br />
BELL 407GXP<br />
4000<br />
MD 600N<br />
BELL 505<br />
MAX TAKE-OFF WEIGHT (LBS)<br />
8000<br />
16000<br />
H225<br />
H155<br />
H215(C1)<br />
H145<br />
S-76D<br />
AW189<br />
AW169<br />
H175<br />
AW139<br />
BELL 429<br />
BELL 412EPI<br />
S-76C++<br />
BELL 430<br />
AW109 GRANDNEW<br />
AW119KX<br />
H130<br />
H125 BELL 407 BELL 206L4<br />
S-92<br />
32000<br />
ACQUISITION COST VS. CABIN VOLUME<br />
AIRCRAFT ACQUISITION PRICE (MILLION USD)<br />
8<br />
4<br />
2<br />
1<br />
0.5<br />
0.25<br />
20<br />
HEAVY<br />
(SUPER) MEDIUM<br />
LIGHT TWIN<br />
SINGLE TURBINE<br />
PISTON<br />
EN480B<br />
MD 520N<br />
MD 530F<br />
R44 RAVEN II<br />
R22 BETA II<br />
MD 500E<br />
R66<br />
40<br />
H125<br />
H130<br />
H120<br />
BELL 505<br />
MD 902<br />
H135(T3)<br />
80<br />
BELL 407GXP<br />
MD 600N<br />
BELL 407<br />
BELL 206L4<br />
H215(C1) S-92<br />
H175<br />
BELL430<br />
H145<br />
S-76D H155<br />
AW169<br />
AW139<br />
AW189<br />
BELL412EPI S-76C++<br />
BELL429 AW109 GRANDNEW<br />
AW109 POWER<br />
AW119KX<br />
160<br />
CABIN VOLUMN (CU.FT)<br />
H225<br />
320 640 800<br />
Source: Conklin & de Decker <strong>2019</strong><br />
FOURTH QUARTER <strong>2019</strong> — ASIAN SKY QUARTERLY | 65
SUMMARY -- HELICOPTERS<br />
MARKET SUMMARY PER MODEL — CIVIL HELICOPTERS<br />
INVENTORY LEVEL, PRICE TREND & TRANSACTIONS<br />
H125<br />
Average Asking Price<br />
Market Indicators (vs. Last Quarter)<br />
$2.6<br />
Transaction Level (Past 12 Months)<br />
Inventory Level<br />
$2.4<br />
$2.4<br />
$2.5<br />
$2.4<br />
$2.5<br />
Average Asking Price<br />
Average Days on Market<br />
For Sale vs. Sold<br />
$2.3<br />
PERFORMANCE<br />
Max Range<br />
Max Speed<br />
Typ. Passengers<br />
340 N.M. / 630 km<br />
140 Knots<br />
6<br />
6<br />
Sold<br />
8<br />
For Sale<br />
5<br />
3 3<br />
3<br />
4<br />
1<br />
3<br />
2<br />
1<br />
1<br />
4 4<br />
8<br />
2<br />
1<br />
2<br />
2 1<br />
1<br />
SUPPLY<br />
No. for Sale<br />
Avg Asking Price<br />
Avg Days on Market<br />
<strong>2019</strong> Dec<br />
25 (3.2%)<br />
2.3M USD<br />
510<br />
<strong>2019</strong> Sep<br />
25 (3.2%)<br />
2.5M USD<br />
462<br />
19 17 18 21 19 18 18 17 18 21 23 23 23 25 26 31 32 33 29 27 29 25<br />
26 27<br />
25<br />
TRANSACTION<br />
Past 12 Months<br />
Past 3 Months<br />
<strong>2019</strong> Dec<br />
28<br />
4<br />
<strong>2019</strong> Sep<br />
24<br />
5<br />
Dec Feb Apr Jun Aug Oct Dec Feb Apr Jun Aug Oct Dec<br />
2017 2018 <strong>2019</strong><br />
H130<br />
Average Asking Price<br />
Market Indicators (vs. Last Quarter)<br />
Transaction Level (Past 12 Months)<br />
AIRBUS<br />
$2.8<br />
$2.9<br />
$2.9<br />
$2.9<br />
$3.1<br />
$3.1<br />
$3.0<br />
Inventory Level<br />
Average Asking Price<br />
Average Days on Market<br />
For Sale vs. Sold<br />
PERFORMANCE<br />
Max Range<br />
Max Speed<br />
Typ. Passengers<br />
333 N.M. / 606km<br />
128 Knots<br />
7<br />
Sold<br />
1<br />
For Sale<br />
2<br />
4<br />
2<br />
2<br />
2<br />
1 1<br />
1<br />
1 1 1<br />
2<br />
SUPPLY<br />
No. for Sale<br />
Avg Asking Price<br />
Avg Days on Market<br />
<strong>2019</strong> Dec<br />
9 (3.4%)<br />
3.0M USD<br />
514<br />
<strong>2019</strong> Sep<br />
10 (3.8%)<br />
3.1M USD<br />
558<br />
9 9 7 7 6 6 6 5 5 5 5 5 4 4 9 10 10 9 10 11 10 10<br />
11 9<br />
9<br />
TRANSACTION<br />
Past 12 Months<br />
Past 3 Months<br />
<strong>2019</strong> Dec<br />
6<br />
0<br />
<strong>2019</strong> Sep<br />
6<br />
3<br />
Dec Feb Apr Jun Aug Oct Dec Feb Apr Jun Aug Oct Dec<br />
2017 2018 <strong>2019</strong><br />
Source: AMSTAT & ASG<br />
66 | ASIAN SKY QUARTERLY — FOURTH QUARTER <strong>2019</strong>
MARKET SUMMARY -- HELICOPTERS<br />
EC135P2 & T2<br />
$2.7<br />
Average Asking Price<br />
$2.8<br />
$3.1<br />
$2.5<br />
$2.6<br />
EC135T2<br />
EC135P2<br />
Average<br />
$2.4<br />
$2.2<br />
Market Indicators (vs. Last Quarter)<br />
Transaction Level (Past 12 Months)<br />
Inventory Level<br />
Average Asking Price<br />
Average Days on Market<br />
EC135P2 EC135T2<br />
$1.7 $1.7<br />
For Sale vs. Sold<br />
Sold For Sale<br />
1 1 1 1<br />
1<br />
$1,6<br />
1<br />
2<br />
$1.7<br />
5<br />
1<br />
1<br />
$1.7<br />
1<br />
$1.7<br />
1<br />
$1.7<br />
PERFORMANCE<br />
Max Range<br />
Max Speed<br />
Typ. Passengers<br />
SUPPLY<br />
No. for Sale<br />
Avg Asking Price<br />
Avg Days on Market<br />
EC135P2<br />
332 N.M.<br />
614 km<br />
127 Knots<br />
6<br />
Dec | Sep<br />
10 | 9<br />
2.2M USD<br />
2.4M USD<br />
572 | 541<br />
EC135T2<br />
332 N.M.<br />
614 km<br />
127 Knots<br />
6<br />
Dec | Sep<br />
1 | 2<br />
1.7M USD<br />
1.7M USD<br />
1,438 | 945<br />
9 10 11 10 11 11 11 11 12 12 12 11 9 9 10 10 11 12 12 11 11 11<br />
11 10 11<br />
Dec Feb Apr Jun Aug Oct Dec Feb Apr Jun Aug Oct Dec<br />
2017 2018 <strong>2019</strong><br />
TRANSACTION<br />
Past 12 Months<br />
Past 3 Months<br />
Dec | Sep<br />
2 | 1<br />
1 | 0<br />
Dec | Sep<br />
1 | 1<br />
0 | 1<br />
H145<br />
Average Asking Price<br />
Market Indicators (vs. Last Quarter)<br />
Transaction Level (Past 12 Months)<br />
$4.1<br />
$4.2<br />
$3.9<br />
$4.8<br />
$4.5<br />
Inventory Level<br />
Average Asking Price<br />
Average Days on Market<br />
AIRBUS<br />
For Sale vs. Sold<br />
$3.6<br />
$3.4<br />
PERFORMANCE<br />
Max Range<br />
Max Speed<br />
Typ. Passengers<br />
461 N.M. / 855 km<br />
131 Knots<br />
9<br />
4<br />
Sold<br />
1<br />
For Sale<br />
3<br />
2<br />
1<br />
1<br />
2<br />
2<br />
1<br />
3<br />
2<br />
2<br />
1<br />
3<br />
4<br />
SUPPLY<br />
No. for Sale<br />
Avg Asking Price<br />
Avg Days on Market<br />
<strong>2019</strong> Dec <strong>2019</strong> Sep<br />
9 (1.3%) 10 (1.4%)<br />
4.5M USD 4.8M USD<br />
334 319<br />
11 11 9 9 9 7 9 11 13 15 14 14 12 13 13 13 13 12 9 9 8 10<br />
12 10<br />
9<br />
TRANSACTION<br />
Past 12 Months<br />
Past 3 Months<br />
<strong>2019</strong> Dec <strong>2019</strong> Sep<br />
18 11<br />
7 5<br />
Dec Feb Apr Jun Aug Oct Dec Feb Apr Jun Aug Oct Dec<br />
2017 2018 <strong>2019</strong><br />
Source: AMSTAT & ASG<br />
FOURTH QUARTER <strong>2019</strong> — ASIAN SKY QUARTERLY | 67
MARKET SUMMARY -- HELICOPTERS<br />
H155 & EC155B<br />
Average Asking Price<br />
EC155B<br />
Market Indicators (vs. Last Quarter)<br />
H155<br />
Average<br />
Transaction Level (Past 12 Months)<br />
H155<br />
EC155B<br />
$5.1<br />
$4.9<br />
$4.9<br />
$5.5<br />
$4.5<br />
$4.3<br />
$5.5<br />
Inventory Level<br />
Average Asking Price<br />
Average Days on Market<br />
$2.9<br />
$2.0<br />
For Sale vs. Sold<br />
Sold For Sale<br />
$2.0<br />
$2.0<br />
$2.0<br />
$2.8<br />
$2.9<br />
PERFORMANCE<br />
Max Range<br />
Max Speed<br />
Typ. Passengers<br />
H155<br />
516 N.M.<br />
955 km<br />
150 Knots<br />
13<br />
EC155B<br />
516 N.M.<br />
955 km<br />
135 Knots<br />
13<br />
1<br />
1<br />
1<br />
SUPPLY<br />
No. for Sale<br />
Avg Asking Price<br />
Avg Days on Market<br />
Dec | Sep<br />
13 | 17<br />
5.5M USD<br />
5.1M USD<br />
533 | 352<br />
Dec | Sep<br />
4 | 6<br />
2.9M USD<br />
3.7M USD<br />
400 | 263<br />
14 13 14 16 16 15 15 15 15 15 13 13 13 12 12 12 11 10 11 11 15 23<br />
20 18 17<br />
Dec Feb Apr Jun Aug Oct Dec Feb Apr Jun Aug Oct Dec<br />
2017 2018 <strong>2019</strong><br />
TRANSACTION<br />
Past 12 Months<br />
Past 3 Months<br />
Dec | Sep<br />
0 | 0<br />
0 | 0<br />
Dec | Sep<br />
2 | 1<br />
1 | 0<br />
H225<br />
Average Asking Price<br />
Market Indicators (vs. Last Quarter)<br />
Transaction Level (Past 12 Months)<br />
AIRBUS<br />
$6.0 $6.0<br />
Inventory Level<br />
Average Asking Price<br />
$4.5<br />
$3.5<br />
For Sale vs. Sold<br />
$5.8 $5.8<br />
$4.0<br />
Average Days on Market<br />
PERFORMANCE<br />
Max Range<br />
Max Speed<br />
Typ. Passengers<br />
452 N.M. / 837 km<br />
142 Knots<br />
19<br />
Sold<br />
For Sale<br />
SUPPLY<br />
No. for Sale<br />
Avg Asking Price<br />
Avg Days on Market<br />
<strong>2019</strong> Dec <strong>2019</strong> Sep<br />
11 (6.3%) 13 (7.4%)<br />
4.0M USD 6.0M USD<br />
950 814<br />
12 12 13 13 13 13 13 13 14 13 13 17 17 16 13 13 13 13 13 13 13 13<br />
12 12<br />
11<br />
TRANSACTION<br />
Past 12 Months<br />
Past 3 Months<br />
<strong>2019</strong> Dec <strong>2019</strong> Sep<br />
0 0<br />
0 0<br />
Dec Feb Apr Jun Aug Oct Dec Feb Apr Jun Aug Oct Dec<br />
2017 2018 <strong>2019</strong><br />
Source: AMSTAT & ASG<br />
68 | ASIAN SKY QUARTERLY — FOURTH QUARTER <strong>2019</strong>
MARKET SUMMARY -- HELICOPTERS<br />
BELL 206 JETRANGER / LONGRANGER<br />
Average Asking Price<br />
Bell 206 LongRanger<br />
Bell 206 JetRanger<br />
Average<br />
Market Indicators (vs. Last Quarter)<br />
Bell 206JBell 206L<br />
Transaction Level (Past 12 Months)<br />
$1.0<br />
$0.9<br />
$0.9<br />
$0.9<br />
$0.9<br />
$0.8<br />
$0.8<br />
Inventory Level<br />
Average Asking Price<br />
Average Days on Market<br />
$0.5<br />
$0.6<br />
$0.6<br />
$0.6 $0.6<br />
$0.6<br />
For Sale vs. Sold<br />
Sold For Sale<br />
12 18 19 21 22<br />
17 13<br />
17<br />
11 16 8<br />
12<br />
15 18 17<br />
8 12 9<br />
7 8 11<br />
4 10<br />
$0.6<br />
4<br />
PERFORMANCE<br />
Max Range<br />
Max Speed<br />
Typ. Passengers<br />
SUPPLY<br />
No. for Sale<br />
Avg Asking Price<br />
Avg Days on Market<br />
Bell 206J<br />
374 N.M.<br />
693 km<br />
121 Knots<br />
4<br />
Dec | Sep<br />
132 | 138<br />
0.6M USD<br />
0.6M USD<br />
736 | 663<br />
Bell 206L<br />
270 N.M.<br />
500 km<br />
105 Knots<br />
6<br />
Dec | Sep<br />
69 | 70<br />
0.8M USD<br />
0.8M USD<br />
496 | 471<br />
206 211 209 200 197 206 206 205 195 201 201 211 215 205 209 201 208 215 213 211 210 208 206 193 201<br />
Dec Feb Apr Jun Aug Oct Dec Feb Apr Jun Aug Oct Dec<br />
2017 2018 <strong>2019</strong><br />
TRANSACTION<br />
Past 12 Months<br />
Past 3 Months<br />
Dec | Sep<br />
100 | 83<br />
17 | 23<br />
Dec | Sep<br />
10 | 9<br />
1 | 3<br />
BELL 407<br />
Average Asking Price<br />
Market Indicators (vs. Last Quarter)<br />
$2.3<br />
Transaction Level (Past 12 Months)<br />
Inventory Level<br />
Average Asking Price<br />
Average Days on Market<br />
$2.0<br />
$1.9<br />
For Sale vs. Sold<br />
$1.9<br />
$1.9<br />
$2.0<br />
$2.0<br />
PERFORMANCE<br />
Max Range<br />
Max Speed<br />
Typ. Passengers<br />
323 N.M. / 598 km<br />
132 Knots<br />
7<br />
BELL<br />
6<br />
Sold<br />
9<br />
For Sale<br />
8<br />
6<br />
5<br />
6 6 8 5 4<br />
5<br />
5<br />
6<br />
10<br />
3<br />
5 4<br />
1 5 5 7<br />
3<br />
3<br />
5<br />
2<br />
SUPPLY<br />
No. for Sale<br />
Avg Asking Price<br />
Avg Days on Market<br />
<strong>2019</strong> Dec <strong>2019</strong> Sep<br />
53 (3.4%) 43 (2.8%)<br />
2.3M USD 2.2M USD<br />
554 624<br />
55 53 45 50 48 44 42 42 42 44 46 47 48 48 48 41 38 41 43 44 39 43<br />
44 49<br />
53<br />
TRANSACTION<br />
Past 12 Months<br />
Past 3 Months<br />
<strong>2019</strong> Dec <strong>2019</strong> Sep<br />
56 46<br />
10 16<br />
Dec Feb Apr Jun Aug Oct Dec Feb Apr Jun Aug Oct Dec<br />
2017 2018 <strong>2019</strong><br />
Source: AMSTAT & ASG<br />
FOURTH QUARTER <strong>2019</strong> — ASIAN SKY QUARTERLY | 69
MARKET SUMMARY -- HELICOPTERS<br />
BELL 412EP/412HP<br />
Average Asking Price<br />
Bell 412 HP<br />
Market Indicators (vs. Last Quarter)<br />
$5.0<br />
$4.4<br />
$4.8<br />
$4.6<br />
$4.4<br />
Bell 412 EP<br />
Average<br />
$3.6<br />
$3.9<br />
Bell 412EPBell 412HP<br />
Transaction Level (Past 12 Months)<br />
Inventory Level<br />
Average Asking Price<br />
Average Days on Market<br />
$3.0 $3.0<br />
For Sale vs. Sold<br />
Sold For Sale<br />
$2.9<br />
$3.0<br />
$2.8<br />
$2.0<br />
$2.0<br />
PERFORMANCE<br />
Max Range<br />
Max Speed<br />
Typ. Passengers<br />
Bell 412EP<br />
356 N.M. /<br />
659 km<br />
140 Knots<br />
9<br />
Bell 412HP<br />
349 N.M. /<br />
646 km<br />
133 Knots<br />
14<br />
1<br />
2<br />
3<br />
2<br />
3<br />
2<br />
1<br />
1<br />
3<br />
2<br />
2 1<br />
1 2<br />
3 5<br />
2<br />
1<br />
3<br />
1<br />
SUPPLY<br />
No. for Sale<br />
Avg Asking Price<br />
Avg Days on Market<br />
Dec | Sep<br />
23 | 24<br />
3.9M USD<br />
3.6M USD<br />
682 | 658<br />
Dec | Sep<br />
3 | 3<br />
2.0M USD<br />
2.0M USD<br />
964 | 873<br />
32 32 33 30 35 32 32 34 37 37 38 38 36 38 35 36 34 33 31 28 27 27<br />
26 26 26<br />
Dec Feb Apr Jun Aug Oct Dec Feb Apr Jun Aug Oct Dec<br />
2017 2018 <strong>2019</strong><br />
TRANSACTION<br />
Past 12 Months<br />
Past 3 Months<br />
Dec | Sep<br />
21 | 17<br />
4 | 7<br />
Dec | Sep<br />
2 | 2<br />
0 | 1<br />
BELL 429<br />
Average Asking Price<br />
Market Indicators (vs. Last Quarter)<br />
$5.5<br />
$5.6<br />
$5.5<br />
$5.6<br />
$5.6<br />
Transaction Level (Past 12 Months)<br />
Inventory Level<br />
Average Asking Price<br />
Average Days on Market<br />
$4.8<br />
BELL<br />
For Sale vs. Sold<br />
$4.5<br />
PERFORMANCE<br />
Max Range<br />
Max Speed<br />
Typ. Passengers<br />
368 N.M. / 681 km<br />
130 Knots<br />
7<br />
Sold<br />
2<br />
2<br />
For Sale<br />
3<br />
1<br />
1<br />
1<br />
2<br />
1<br />
1<br />
1<br />
1<br />
2<br />
1<br />
1<br />
1<br />
1<br />
SUPPLY<br />
No. for Sale<br />
Avg Asking Price<br />
Avg Days on Market<br />
<strong>2019</strong> Dec <strong>2019</strong> Sep<br />
21 (6.0%) 21 (6.1%)<br />
4.5M USD 4.9M USD<br />
394 389<br />
18 17 15 16 16 15 14 13 14 14 14 15 16 15 16 15 17 20 21 20 21 21<br />
24 24<br />
21<br />
TRANSACTION<br />
Past 12 Months<br />
Past 3 Months<br />
<strong>2019</strong> Dec <strong>2019</strong> Sep<br />
10 9<br />
1 4<br />
Dec Feb Apr Jun Aug Oct Dec Feb Apr Jun Aug Oct Dec<br />
2017 2018 <strong>2019</strong><br />
Source: AMSTAT & ASG<br />
70 | ASIAN SKY QUARTERLY — FOURTH QUARTER <strong>2019</strong>
MARKET SUMMARY -- HELICOPTERS<br />
A109SP GRANDNEW<br />
Average Asking Price<br />
Market Indicators (vs. Last Quarter)<br />
$6.2<br />
Transaction Level (Past 12 Months)<br />
Inventory Level<br />
Average Asking Price<br />
$4.3<br />
$4.7<br />
$4.5<br />
$4.2<br />
Average Days on Market<br />
$3.7<br />
For Sale vs. Sold<br />
$4.1<br />
$4.3<br />
PERFORMANCE<br />
Max Range<br />
Max Speed<br />
Typ. Passengers<br />
480 N.M. / 889 km<br />
130 Knots<br />
7<br />
Sold<br />
1<br />
For Sale<br />
2<br />
1<br />
1<br />
1<br />
2<br />
2<br />
2<br />
2<br />
1<br />
2<br />
1 1<br />
SUPPLY<br />
No. for Sale<br />
Avg Asking Price<br />
Avg Days on Market<br />
<strong>2019</strong> Dec <strong>2019</strong> Sep<br />
10 (5.5%) 8 (4.5%)<br />
4.2M USD 4.5M USD<br />
320 354<br />
10 10 9 8 9 6 6 8 8 9 10 9 8 8 9 7 7 8 8 8 9 8<br />
12 10<br />
10<br />
TRANSACTION<br />
Past 12 Months<br />
Past 3 Months<br />
<strong>2019</strong> Dec <strong>2019</strong> Sep<br />
8 6<br />
2 0<br />
Dec Feb Apr Jun Aug Oct Dec Feb Apr Jun Aug Oct Dec<br />
2017 2018 <strong>2019</strong><br />
AW139<br />
Average Asking Price<br />
Market Indicators (vs. Last Quarter)<br />
$7.8<br />
$7.5<br />
$7.8<br />
$8.3<br />
$7.7<br />
Transaction Level (Past 12 Months)<br />
Inventory Level<br />
Average Asking Price<br />
Average Days on Market<br />
For Sale vs. Sold<br />
$7.1 $7.1<br />
$6.5<br />
PERFORMANCE<br />
Max Range<br />
Max Speed<br />
Typ. Passengers<br />
568 N.M. / 1,052 km<br />
140 Knots<br />
15<br />
Sold For Sale<br />
3 2 2<br />
1<br />
2<br />
3 1<br />
1 1<br />
5<br />
1<br />
2 3 3<br />
1 1<br />
26 26 29 30 28 28 28 28 27 28 28 25 24 26 26 27 26 23 23 26 23 22<br />
22 23 23<br />
SUPPLY<br />
No. for Sale<br />
Avg Asking Price<br />
Avg Days on Market<br />
TRANSACTION<br />
Past 12 Months<br />
Past 3 Months<br />
<strong>2019</strong> Dec <strong>2019</strong> Sep<br />
23 (2.5%) 22 (2.4%)<br />
6.5M USD 7.1M USD<br />
524 480<br />
<strong>2019</strong> Dec <strong>2019</strong> Sep<br />
19 15<br />
4 5<br />
LEONARDO<br />
Dec Feb Apr Jun Aug Oct Dec Feb Apr Jun Aug Oct Dec<br />
2017 2018 <strong>2019</strong><br />
Source: AMSTAT & ASG<br />
FOURTH QUARTER <strong>2019</strong> — ASIAN SKY QUARTERLY | 71
MARKET SUMMARY -- HELICOPTERS<br />
S-76C+ / S-76C++<br />
Average Asking Price<br />
S76C+<br />
Market Indicators (vs. Last Quarter)<br />
$6.3<br />
$7.0<br />
$5.8<br />
$5.8<br />
$5.0<br />
S76C++<br />
Average<br />
$4.7<br />
$4.6<br />
S76C+<br />
Transaction Level (Past 12 Months)<br />
Inventory Level<br />
Average Asking Price<br />
Average Days on Market<br />
S76C++<br />
$2.8<br />
$2.5<br />
For Sale vs. Sold<br />
Sold For Sale<br />
$1.9<br />
$1.9<br />
$2.2<br />
$3.5<br />
$1.7<br />
PERFORMANCE<br />
Max Range<br />
Max Speed<br />
Typ. Passengers<br />
S-76C+<br />
335 N.M. /<br />
620 km<br />
155 Knots<br />
12<br />
S-76C++<br />
335 N.M. /<br />
620 km<br />
155 Knots<br />
12<br />
1<br />
2<br />
2<br />
1<br />
1<br />
2<br />
1<br />
1<br />
1<br />
1 1 1 1<br />
1<br />
SUPPLY<br />
No. for Sale<br />
Avg Asking Price<br />
Avg Days on Market<br />
Dec | Sep<br />
23 | 24<br />
1.7M USD<br />
1.7M USD<br />
611 | 560<br />
Dec | Sep<br />
22 | 21<br />
4.6M USD<br />
4.7M USD<br />
737 | 740<br />
48 48 46 46 44 49 54 51 49 47 48 46 46 42 46 47 42 45 41 41 45 45<br />
44 45 45<br />
Dec Feb Apr Jun Aug Oct Dec Feb Apr Jun Aug Oct Dec<br />
2017 2018 <strong>2019</strong><br />
TRANSACTION<br />
Past 12 Months<br />
Past 3 Months<br />
Dec | Sep<br />
0 | 0<br />
0 | 0<br />
Dec | Sep<br />
6 | 5<br />
1 | 1<br />
FEATURED AIRCRAFT<br />
H120 SN 1680<br />
TOTAL HOURS: 227 SINCE NEW<br />
TOTAL CYCLES: 404 SINCE NEW<br />
Source: AMSTAT & ASG<br />
• Very Low Hours, Mint Condition<br />
• Fresh 12 Month Inspection<br />
• One Owner Since New, Always Hangared<br />
• Meticulously Maintained<br />
• Air Conditioning System<br />
• Dual Controls<br />
• Reinforced Sound Proofing<br />
• Emergency Floatation Gear (Fixed Parts)<br />
SIKORSKY<br />
BELL 407GX SN 54349<br />
TOTAL HOURS: 792 SINCE NEW<br />
TOTAL CYCLES: 1,341 SINCE NEW<br />
• New Paint and Interior in 2017<br />
• Immaculate Bell Maintenance & Always Hangared<br />
• 2 Pilots + 5 Passengers VIP Configuration<br />
• Air Conditioning, Plus Power Kit, HeliSAS Autopilot<br />
• Inlet Barrier Filter with IVF<br />
• High Skid Landing Gear with Flitestep Kit<br />
• Jettison Crew Door Kit<br />
• Wire Strike Protection System<br />
• Cockpit Chin Bubble Windows<br />
72 | ASIAN SKY QUARTERLY — FOURTH QUARTER <strong>2019</strong>
RedeFIning<br />
mobility<br />
PROPELLING<br />
THE FUTURE IN<br />
> VERTICAL LIFT<br />
> URBAN AIR MOBILITY<br />
> UNMANNED SYSTEMS<br />
> AUTONOMOUS VEHICLES<br />
Be at the forefront of where the latest rotorcraft<br />
and unmanned technologies converge to shape<br />
the future of mobility.<br />
Meet with key decision makers and buyers at<br />
Rotorcraft Asia and Unmanned Systems Asia<br />
2021, Asia Pacific’s first integrated platform for<br />
the most revolutionary mobility solutions from<br />
the skies to the seas.<br />
Singapore is a strategic point for us to enter the Asia Pacific<br />
market and the show has been a fantastic platform for us to<br />
meet with potential and existing customers…”<br />
“We are very happy with the size of the show… and the great<br />
diversity of delegates that came to visit us – from different<br />
countries and industries; commercial and government entities,<br />
many of whom had specific problems that we could provide<br />
solutions for.”<br />
“The quality of visitors is great. We have been very impressed with…<br />
CONNECT WITH US<br />
to secure your preferred spot at the show<br />
or learn more about your participation options:<br />
Lim Mei Ling<br />
+65 6595 6113<br />
sales2021@rca-umsa.com<br />
@RCAUMSA<br />
www.rca-umsa.com<br />
95%<br />
satisfaction rate<br />
FROM OUR EXHIBITORS<br />
Hear more of what our exhibitors<br />
have to say and check out what<br />
went on at the show!<br />
SCA N HERE<br />
ORGANISED BY:<br />
SUPPORTED BY:<br />
HELD IN:
Customized Solutions for Your Air Medical Needs.<br />
+1 (888)-863-5072<br />
spectrum-aeromed.com