Asian Sky Quarterly 2023 Q1

You also want an ePaper? Increase the reach of your titles
YUMPU automatically turns print PDFs into web optimized ePapers that Google loves.
1ST QUARTER <strong>2023</strong><br />
Cover Feature<br />
Features<br />
DASSAULT AVIATION<br />
RCA-UMSA <strong>2023</strong><br />
ROLLS-ROYCE<br />
THE NEXT GLOBAL SKY FORUM<br />
Global <strong>Sky</strong> Studies<br />
EUROPE PROFILE<br />
MOOD & INTENTIONS<br />
MARKET DYNAMICS<br />
MARKET SUMMARY<br />
Market Updates<br />
IADA<br />
FIRST QUARTER <strong>2023</strong> — GLOBAL SKY QUARTERLY | I
THE GULFSTREAM<br />
DIFFERENCE<br />
Your mission is our inspiration. Every investment we<br />
make—in advanced technology, precision manufacturing<br />
and worldwide customer support—is an investment in you.
CONTENTS<br />
04<br />
STATE-OF-THE-ART FACILITY TO<br />
SERVE ASIA-PACIFIC GENERAL<br />
AVIATION MARKET<br />
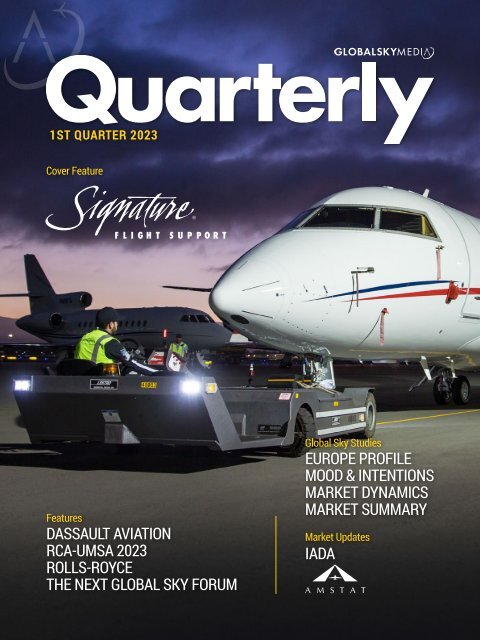
SIGNATURE AVIATION<br />
36<br />
THE GLOBAL SKY FORUM –<br />
HELICOPTERS <strong>2023</strong><br />
A prelude to the upcoming Global <strong>Sky</strong> Forum to be held in<br />
Brisbane, Australia.<br />
06<br />
A look into Signature Aviation’s revamped FBO facility<br />
based in Anchorage, Alaska.<br />
EUROPE AVIATION MARKET<br />
PROFILE<br />
An analysis of the market for business jets and helicopters<br />
in the Europe region, including trends, challenges, and<br />
factors driving growth.<br />
38<br />
51<br />
IADA MARKET REPORT<br />
The International Aircraft Dealer’s Association presents its<br />
first quarter market report.<br />
GLOBAL PRE-OWNED MARKET<br />
UPDATE<br />
AMSTAT<br />
24<br />
LOOK TO NEW HORIZONS WITH<br />
NEW JETS<br />
DASSAULT AVIATION<br />
A snapshot of the latest developments from Dassault,<br />
including updates on the up-and-coming business jet<br />
models including the 6X and 10X.<br />
57<br />
A review of the global market for pre-owned business jets<br />
and turboprops.<br />
RCA-UMSA MOBILITY FORUM<br />
ANSWERS MANY AAM<br />
QUESTIONS<br />
A review of the Global <strong>Sky</strong> Media co-organized RCA-UMSA<br />
28<br />
ENHANCING PERFORMANCE<br />
NOW; INCREASING VALUE IN<br />
THE FUTURE<br />
ROLLS-ROYCE<br />
59<br />
Mobility Forum which explored the challenges and recent<br />
developments in advanced air mobility and drones.<br />
MARKET DYNAMICS<br />
An analysis of Asia-Pacific inventory levels, market trends<br />
Rolls-Royce explains how its updated service portfolio<br />
and the changing price signals for the business jet and<br />
future proofs its value proposition.<br />
helicopter fleets.<br />
31<br />
BUSINESS AVIATION<br />
QUARTERLY SURVEY<br />
Results from our survey regarding the worldwide outlook<br />
on economic status, aircraft utilization, purchase and<br />
chartering intentions, and influencing factors shaping the<br />
69<br />
88<br />
MARKET SUMMARY<br />
BUSINESS JETS<br />
MARKET SUMMARY<br />
HELICOPTERS<br />
current market.<br />
COVER IMAGE<br />
Courtesy of Signature<br />
Flight Support<br />
FIRST QUARTER <strong>2023</strong> — GLOBAL SKY QUARTERLY | 1
EDITOR’S NOTE<br />
Being a journalist is very much<br />
like being in a real-world game<br />
that you are constantly playing.<br />
It goes something like this:<br />
Company X wants to tell you<br />
about its new product, service or<br />
results. Whilst company X’s news<br />
might be A) Mildly interesting, B)<br />
Quite boring, or C) Totally untrue,<br />
as a journalist you still have to play the game so that company X will<br />
hopefully tell you more interesting stories further down the line.<br />
The game is not as one-sided as it sounds. Company X is also playing,<br />
as it needs journalists to be able to spread its news. It's strategy will<br />
be to try and tell you just about enough to get you interested in its<br />
story. However, this means that company X isn’t going to tell you what<br />
you want to know, it will give you a sugar-coated version of events,<br />
from which you will have to try and piece together the real story.<br />
And so, the game begins. For the journalist it’s a frustrating case of<br />
"I know that you know more than you are telling me, and I’m going<br />
to try and get you to tell me more," whilst for company X it is more<br />
along the lines of "I’ve been told that I can only say what I’ve told you<br />
already, so I don’t want to risk getting told off by telling you more."<br />
As a journalist, you quickly learn to read between the lies (sic), and, if<br />
you’re meeting face-to-face, you quickly learn to look for tells – a wry<br />
smile, a scratch of the nose, or in one case, from one PR person that<br />
is sadly no longer working in the industry, a same handed scratch<br />
under the armpit, much akin to a chimpanzee.<br />
See, company X will always focus on the good news. It make sense,<br />
after all they say that all news is good news. But that isn’t always<br />
true. The FAA releasing an accident report saying that the cause<br />
of an accident was that your pilot was drunk, or a disgruntled<br />
passenger announcing that they are suing you as they booked a<br />
flight on a Global 7500 but ended up on a 58-year-old IAI WestWind<br />
instead, is never good news.<br />
So the devil, as they say, is in the details, and never is that more true<br />
than annual results season. We’ve seen the results from all of the<br />
OEMs, operators and some of the brokers. Some have come out with<br />
spectacular statements that focus solely on one positive, which all<br />
the time belie the real story that’s buried deep inside their reports.<br />
The good thing is that most reports are readily available on the<br />
company’s investor relations websites, so they are easy to find and<br />
dissect yourself. So next time you have some spare time, read the<br />
accompanying press release first, then dig into the details of the<br />
report. I’ll leave it to you to decide which ones are A), B) or C).<br />
If you’ve picked up the EBACE special edition printed copy of Global<br />
<strong>Sky</strong> <strong>Quarterly</strong> during EBACE and this is the first time that you have<br />
read the publication, then thanks for joining us. I hope that you will<br />
enjoy reading our publication and that you will consider signing up to<br />
our distribution list to receive the electronic copy for free every time<br />
it is published.<br />
If you’re a long-time reader (Thanks!) then you will be familiar with<br />
many of the sections in this <strong>Quarterly</strong>. There are a few changes since<br />
the previous issue, the biggest of which being that our justifiably<br />
famous Mood and Intentions survey now not only focusses on Asia-<br />
Pacific, but its coverage has been expanded to cover all parts of the<br />
globe to give a truly worldwide picture of where the business aviation<br />
industry will be heading in the next six months. We also have a deep<br />
dive into the Europe market, with our very own Qianyun Zhou and<br />
Jeffrey Tang presenting data and analysis on the second biggest<br />
business aviation market in the world.<br />
SPECIAL THANKS TO OUR CONTRIBUTORS AND SPONSORS<br />
2 | GLOBAL SKY QUARTERLY — FIRST QUARTER <strong>2023</strong>
PUBLISHER<br />
As well as the usual data and intelligence that you have come<br />
to rely on, this issue also includes special features covering<br />
Rolls-Royce's CorporateCare® Enhanced (CCE) program, whilst<br />
Dassault digs into the past as it celebrates the 60th anniversary<br />
of the first flight of its iconic Falcon 20 and looks to the future<br />
with its upcoming Falcon 6X and Falcon 10X, the former of<br />
which is just around the corner.<br />
EDITORIAL & MARKET RESEARCH<br />
Alud Davies<br />
Casper Zhuang<br />
Charlie Xu<br />
Dennis Lau<br />
Jeffrey Tang<br />
Liana Liu<br />
Qianyun Zhou<br />
Samuel Gao<br />
Silvia Huang<br />
Xiangyun Ning<br />
Elsewhere, we spoke to Signature Flight Support, which is<br />
opening a new facility in Anchorage, Alaska, which it is hoping<br />
will become the de facto stopping off point for business and<br />
general aviation flights routing between North America and<br />
Asia. We also have a feature on the Mobility Forum that was<br />
part of the recent Rotorcraft Asia and Unmanned Systems Asia<br />
(RCA-UMSA) event in Singapore. Global <strong>Sky</strong> Media co-organized<br />
the forum, which, according to everybody in attendance, was a<br />
great success.<br />
And speaking of Global <strong>Sky</strong> Media events, I am delighted to<br />
announce that we are well into the planning for our next forum<br />
event. With the previous event, which was held in Kuala Lumpur<br />
Malaysia, focusing solely on business aviation, our next event<br />
will switch to helicopters. Australia is really the only place that<br />
we can hold the event as it has the biggest installed base in<br />
Asia-Pacific, so we will hold the forum in Brisbane between<br />
September 12th – 13th. Please check out the mini feature on<br />
page 36-37 to find out more.<br />
As always, I’d like to thank everybody that has contributed to<br />
this issue of <strong>Quarterly</strong>.<br />
DESIGN<br />
Amy Liu-Lhuissier<br />
Luna Huang<br />
Zoe Xiao<br />
ADVERTISING/ENQUIRIES:<br />
Joey Wong<br />
jwong@globalsky.media<br />
(852) 9582 0117<br />
www.globalsky.media<br />
Global <strong>Sky</strong> Media is part of <strong>Asian</strong> <strong>Sky</strong> Group. The materials and<br />
information provided by Global <strong>Sky</strong> Media in this report are for<br />
reference only. While such information was compiled using the best<br />
available data as of March 31, <strong>2023</strong>, any information we provide about<br />
how we may interpret the data and market, or how certain issues<br />
may be addressed is provided generally without considering your<br />
specific circumstances. Such information should not be regarded<br />
as a substitute for professional advice. Independent professional<br />
advice should be sought before taking action on any matters to which<br />
information provided in this report may be relevant.<br />
Global <strong>Sky</strong> Media shall not be liable for any losses, damage, costs<br />
or expenses howsoever caused, arising directly or indirectly from<br />
the use of or inability to use this report or use of or reliance upon<br />
any information or material provided in this report or otherwise in<br />
connection with any representation, statement or information on or<br />
contained in this report.<br />
Sincerely,<br />
Alud Davies<br />
Editor-in-Chief<br />
Global <strong>Sky</strong> Media<br />
PS. Sorry Bombardier, I'd take the WestWind flight every<br />
time!<br />
Global <strong>Sky</strong> Media endeavors to ensure that the information contained<br />
in this report is accurate as at the date of publication, but does not<br />
guarantee or warrant its accuracy or completeness, or accept any<br />
liability of whatever nature for any losses, damage, costs or expenses<br />
howsoever caused, whether arising directly or indirectly from any error<br />
or omission in compiling such information. This report also uses third<br />
party information not compiled by Global <strong>Sky</strong> Media. Global <strong>Sky</strong> Media<br />
is not responsible for such information and makes no representation<br />
about the accuracy, completeness or any other aspect of information<br />
contained. The information, data, articles, or resources provided by<br />
any other parties do not in any way signify that Global <strong>Sky</strong> Media<br />
endorses the same.<br />
FIRST QUARTER <strong>2023</strong> — GLOBAL SKY QUARTERLY | 3
SPONSORED CONTENT<br />
SIGNATURE AVIATION LAUNCHES<br />
STATE-OF-THE-ART FACILITY TO SERVE<br />
ASIA-PACIFIC GENERAL AVIATION MARKET<br />
By Alud Davies<br />
To many people, Alaska is the final frontier, a winter wonderland full of exotic fauna and flora, as well<br />
as perpetually snow-capped peaks. Its location, nestled in the far northwest of the continental United<br />
States, separated from Washington State by Canada, is what makes it seem remote, and, in certain places,<br />
seemingly inhospitable. Yet it is this remoteness that makes the state thrive, especially as a stopping off<br />
point for aircraft transiting from the North America to Asia.<br />
As a freight hub in the 1980s and early 1990s, the state capital<br />
Anchorage had one of the most exotic airports in the world. On<br />
the main freight ramp silver Flying Tigers Douglas DC-8s rubbed<br />
shoulders with Federal Express Boeing 727s, as pre-400 series<br />
Cathay Pacific, Japan Airlines and Korean Air 747s taxied past<br />
whilst making fuel stops. Just across the road, the Lake Hood<br />
Seaplane base was bustling with many locally built early De<br />
Havilland Canada seaplanes, whilst a growing number of private<br />
individuals were snapping up old DHC-2 Beavers to fly themselves.<br />
Although the advent of the -400 model 747s and later aircraft<br />
diminished the need for a fuel stop between North America and<br />
Asia, the airport still thrives. FedEx has a major base at the airport,<br />
and many other cargo airlines still stop in to refuel or change<br />
crews. The Flying Tigers DC-8s might have gone, but the airport is<br />
becoming an increasingly important stopping off point for business<br />
jets delivering, or transiting from the US to Asia, and vice versa.<br />
4 | GLOBAL SKY QUARTERLY — FIRST QUARTER <strong>2023</strong>
SPONSORED CONTENT<br />
To capitalize on Anchorage’s growing importance, Signature<br />
Aviation, the airport’s main FBO, recently completed work<br />
remodeling its main facility at the airport. Internally known as<br />
Signature East, the remodeled FBO lounge has been designed to<br />
replicate as many of Alaska’s characteristics as possible, with<br />
the ultimate aim of making passengers feel like they are at home.<br />
The centerpiece is a wood burning fireplace, which makes the<br />
lounge feel cozy, even though it is bigger than most. The lounge<br />
also includes a full-service executive conference room and pilot’s<br />
lounge, located just down the hallway from the passenger lounge,<br />
which includes two sleeping rooms so that transiting crews can<br />
rest without being disturbed.<br />
One of the main aims when remodeling the facility was to bring the<br />
customs services under the same building as the FBO.<br />
having customs facilities on site. This brings an added advantage<br />
for passengers passing through the facility, as once they have<br />
cleared customs, they are free to travel anywhere in the US without<br />
having to clear customs again. This means that passengers from<br />
Asia that are travelling to smaller cities or airports in the US,<br />
can make their fuel stop in Anchorage, clear customs and then<br />
fly directly to their final destination. This is especially useful for<br />
aircraft flying onwards to locations with Signature facilities, as<br />
it speeds up arrival at the final destination even quicker, as the<br />
passengers will already be within the Signature network by the time<br />
they arrive at their final destination.<br />
“It’s a great location to clear customs. Aircraft are able to land,<br />
clear customs and immigration, and then be able to go to any other<br />
location in the US without any issues,” says Marty.<br />
Before the new facility<br />
opened, aircraft would<br />
need to clear customs and<br />
immigration at a different part<br />
of the airport before coming<br />
across to the FBO.”<br />
“We saw a spike in the number of transpacific general aviation and<br />
executive jet travel, and that with that, because of the way that<br />
Signature West is laid out here, it would take us a good 30 – 45<br />
minutes to get our equipment across to US Customs, which is in the<br />
north terminal of the airport,” says Marty Bettis, General Manager,<br />
Signature Flight Support, Anchorage. “And then, the passengers have<br />
to get off the aircraft, clear customs, and then if they want to park at<br />
Signature, they will have to cross two active runways to get to us.”<br />
Signature West, on the opposite side of the airport is where the<br />
company parks larger corporate aircraft as it has around 93,000sq<br />
ft of parking space, as well as hangarage that can accommodate<br />
aircraft right up to the Boeing 767, including the Airbus ACJ and<br />
Boeing Business Jet aircraft.<br />
You might be forgiven for thinking that hangar space at the airport<br />
would be necessary because of the environment. But despite most<br />
people’s impression of Anchorage being a winter wonderland, Marty<br />
says that the weather at the airport is temperate and isn’t prone to<br />
ground fog or frost.<br />
That’s not to say that it doesn’t snow, but the airport has one of<br />
the best snow removal teams in the business, which according<br />
to Marty has won national snow removal competitions on several<br />
occasions. “The airport operates 24 hours a day, and has never<br />
closed,” says Marty.<br />
That problem has now been solved, with the remodeled facility<br />
www.signatureaviation.com<br />
FIRST QUARTER <strong>2023</strong> — GLOBAL SKY QUARTERLY | 5
EUROPE AVIATION<br />
MARKET PROFILE<br />
As a highly established and consolidated market in business aviation,<br />
Europe's business jet fleet has demonstrated a relatively steady<br />
operational trend over the past three years. Despite the inevitable<br />
impact of the COVID-19 pandemic and the geopolitical conflict in<br />
Ukraine had on the overall market in Q4 2020 and Q2 2022 respectively,<br />
the number of aircraft in various categories, including Light aircraft,<br />
have remained resilient in the region.<br />
With a stable and consistent track record, Europe's business aviation<br />
market demonstrated its ability to weather the challenges of both the<br />
pandemic and political instability.<br />
In 2022, the business jet market underwent a stabilization process after<br />
experiencing a period of volatility characterized by an influx of first-time<br />
business jet travelers during the onset of the pandemic. This period of<br />
soaring demand and inflated pre-owned market values was coupled<br />
with limited supply of quality pre-owned aircraft. Inventory has gradually<br />
replenished, yet the pre-owned market remains a mixed environment.<br />
While prices for certain models, such as the Challenger 300 and the<br />
G550, have faced a downward correction due to their increased supply<br />
in the market, values for highly sought-after Light jets, such as the<br />
Embraer Phenom 300 series, have maintained strong asking prices,<br />
thanks to the low levels of supply in the region.<br />
Since 2022, various macro-level factors have introduced a sense<br />
of fragility to the business jet market. The ongoing war in Ukraine<br />
triggered an energy crisis, and the European Union's implementation<br />
of isolating measures against Russian-linked or owned business<br />
aircraft, as per Regulation (EU) 833/2014, led to the grounding of their<br />
aircraft. Moreover, there has been mounting public pressure to suspend<br />
business aircraft operations within the region due to accusations of a<br />
high carbon footprint per passenger journey, with Amsterdam's Schiphol<br />
Airport even proposing a ban on business jets by the end of 2025.<br />
Most recently, the collapse of major banking institutions, such as<br />
Silicon Valley Bank and Credit Suisse, has sent shockwaves across<br />
the business jet market. Known transactions have been aborted that<br />
were linked to the creditors' demise. These factors have added to the<br />
uncertainty surrounding the market and its future prospects.<br />
The helicopter market is poised for a gradual recovery following a rather<br />
muted market during Q4 2022, particularly from the perspective of<br />
major lessors in the region such as LCI, who have seen recent doubledigit<br />
lease rate increases. Lessors are expected to renew their aging<br />
fleets to maintain optimal fleet utilization among key leasing partners<br />
in Europe, which could potentially replenish the pre-owned market<br />
inventory. Additionally, resolving supply issues for critical servicing<br />
components may bring presently stored and inactive aircraft back into<br />
service, thereby making them available in the marketplace.<br />
Despite the inevitable headwinds facing the business aviation market<br />
in Europe for the remainder of the year, such as continuing high interest<br />
rates and looming uncertainties regarding an impending economic<br />
recession, the industry looks set to remain buoyant. Supply chains<br />
are gradually recovering, and OEM deliveries are tentatively releasing<br />
production backlogs. As the market moves towards rationalized pricing<br />
and depreciation levels away from the frenzied initial pandemic peak,<br />
the pre-owned market for business jets is expected to maintain demand<br />
from seasoned aircraft owners looking to replace their existing aircraft<br />
with newer models.<br />
DATA BY<br />
Note: Due to a difference in statistical methods between data sources, the data presented in the <strong>Quarterly</strong> report may differ from the data<br />
displayed in the Business Jet Fleet Report.<br />
6 | GLOBAL SKY QUARTERLY — FIRST QUARTER <strong>2023</strong>
BUSINESS JET<br />
MARKET OVERVIEW<br />
EUROPE PROFILE: BUSINESS JET<br />
Business Jet Fleet by Quarter<br />
Corp. Airliner Long Range Large Medium Light Very Light<br />
3,000<br />
2,500<br />
2,561 2,575 2,593 2,566 2,567 2,570 2,582 2,579 2,561 2,535 2,533 2,519 2,535<br />
2,000<br />
1,500<br />
1,000<br />
500<br />
0<br />
2020<strong>Q1</strong> 2020Q2 2020Q3 2020Q4 2021<strong>Q1</strong> 2021Q2 2021Q3 2021Q4 2022<strong>Q1</strong> 2022Q2 2022Q3 2022Q4 <strong>2023</strong><strong>Q1</strong><br />
According to data from AMSTAT, the business jet fleet in Europe stood<br />
at 2,535 jets as of <strong>Q1</strong> <strong>2023</strong>, having fluctuated from the same fleet size<br />
since the beginning of Q3 2022. Fleet numbers peaked in Europe during<br />
Q3 2020, with a total of 2,593 jets, before the onset of the Omicron<br />
coronavirus variant disrupted aviation travel throughout Q4 2020 and<br />
into <strong>Q1</strong> 2021. However, as the region re-emerged from the second<br />
wave of the pandemic, businesses more readily re-opened, and newly<br />
developed vaccines gained approval, leading to rapid inoculation in<br />
Europe when compared to the rest of the world.<br />
Unlike other regions such as Asia-Pacific, travel restrictions and<br />
national lockdowns were quickly relaxed in Europe, providing<br />
opportunities for high-net-worth individuals to utilize business jets as a<br />
safer and more efficient form of travel during a time when commercial<br />
aviation was still struggling to return to normalcy.<br />
Undoubtedly, the shift in demand for business jet travel has supported<br />
further procurement of aircraft. Although demand from fractional<br />
owners and charter operators dropped by around eight percent over<br />
the past year, a select number of operators are expected to contribute<br />
to demand especially during seasonal holidays, when there was a high<br />
level of demand for leisure travel. According to Deniz Weissenborn of<br />
Platoon Aviation, there have been sustained high levels of inquiries for<br />
routes to Paris, Olbia, and Nice in southern France.<br />
The market recovered throughout 2021, with a fleet of 2,560 jets during<br />
<strong>Q1</strong> 2021 increasing to 2,584 jets recorded during Q4 2021. However, the<br />
start of the Russia-Ukraine war in February 2022 set off a chain of supply<br />
chain disruptions to sources such as gas, oil, and food commodities<br />
critical to the European economy. Sanctions designed to debilitate<br />
Russia's economy had largely isolated their business role in the world.<br />
As a wider consequence of the sanctions and the closure of European<br />
airspace to aircraft registered, owned, or chartered through Russian<br />
connections, these aircraft have inevitably been taken out of the<br />
operating fleet and deprived of servicing and support. According to<br />
Daniel Hall from Cirium, over 400 business jets worldwide have been<br />
affected, a large proportion of which have European registrations from<br />
countries such as Austria, Germany, and Luxembourg.<br />
In March 2022, the European Business Aviation Association (EBAA)<br />
noted the first of a series of business jets being impounded due to<br />
sanctions against Russian assets. This involved the grounding and<br />
suspension of a Luxembourg-registered Global 6500 that landed at<br />
Farnborough Airport in Hampshire, England, from New York shortly<br />
after the United Kingdom enacted legislation that criminalized the<br />
operation and handling of aircraft connected to Russia. Another<br />
aircraft detained by the UK authorities, a Citation Latitude 680A was<br />
deregistered in London.<br />
FIRST QUARTER <strong>2023</strong> — GLOBAL SKY QUARTERLY | 7
EUROPE PROFILE: BUSINESS JET<br />
Registries and authorities from several countries in Europe, including<br />
the offshore-based Isle of Man, imposed deregistration orders on<br />
aircraft connected to Russian owners. These included two BD-700<br />
Global Express, a Falcon 7X, a G650, and an Airbus A340-300.<br />
In June 2022, United States authorities issued a warrant for the<br />
seizure of a G650 with Luxembourg registration, reportedly due to a<br />
violation of the Export Control Reform Act (ECRA) for re-exporting the<br />
US-manufactured aircraft into Russia without a Bureau of Industry and<br />
Security (BIS) License.<br />
The sanctions have undoubtedly created significant disruptions for<br />
the industry, but players in the market, such as Europe-based charter<br />
service providers, are finding innovative ways to adapt and overcome<br />
challenges associated with Russia's omission from the market. The<br />
effects of impounding aircraft connected to Russian owners were felt<br />
in the European fleet from April 2022 onward, with the fleet dropping<br />
by 29 aircraft within two months by June 2022. However, pre-owned<br />
market inventory started to see pronounced replenishment starting at<br />
the beginning of Q4 2022, reaching 141 jets for sale during November<br />
2022, the highest figure seen since September 2021.<br />
The fleet reached its lowest point over the three-year period at the end<br />
of Q4 2022 with 2,519 jets, but has been steadily increasing since,<br />
registering a net addition of 16 jets in <strong>Q1</strong> <strong>2023</strong>, which included seven<br />
Light jets and seven Large jets. Notable increases since the previous<br />
quarter were seen in countries such as the United Kingdom (four<br />
additions), Denmark (three additions), and Slovenia (three additions).<br />
Top Five Countries of Registration<br />
550<br />
Germany France Austria Malta United Kingdom<br />
500<br />
300<br />
280<br />
260<br />
240<br />
220<br />
200<br />
180<br />
160<br />
140<br />
Mar<br />
2020<br />
Apr May Jun Jul Aug Sep Oct Nov Dec Jan Feb Mar Apr May Jun Jul Aug Sep Oct Nov Dec Jan Feb Mar Apr May Jun Jul Aug Sep Oct Nov Dec Jan Feb Mar<br />
2021<br />
2022<br />
<strong>2023</strong><br />
8 | GLOBAL SKY QUARTERLY — FIRST QUARTER <strong>2023</strong>
EUROPE PROFILE: BUSINESS JET<br />
Top Five Countries of Registration by Size Category in <strong>Q1</strong> <strong>2023</strong><br />
Corp. Airliner Long Range Large Medium Light Very Light<br />
0 100 200 300 400 500<br />
GERMANY<br />
12 43 68 55 219<br />
104<br />
MALTA<br />
15 108 61<br />
41 30<br />
7<br />
AUSTRIA<br />
58 21 28<br />
68 39<br />
UNITED KINGDOM<br />
6 46 28 43 40 24<br />
FRANCE<br />
18 22 36 60 47<br />
In <strong>Q1</strong> <strong>2023</strong>, Germany maintained its position as the country with the<br />
largest business jet fleet in Europe, accounting for one-fifth of all jets<br />
in operation. However, the Russia-Ukraine war and resulting energy<br />
crisis, coupled with sanctions impacting German-registered aircraft<br />
with Russian connections, had a major disruptive effect on the German<br />
economy and its business aviation sector. As a result, the jet fleet in<br />
Germany declined from 522 jets in February 2022, at the start of the<br />
conflict, to 501 jets since the beginning of <strong>Q1</strong> <strong>2023</strong>, a decrease of 2.1%<br />
over a three-year period.<br />
Germany's dominance in the Light Jet segment with a 27% market<br />
share was particularly noteworthy, which was over three times higher<br />
than that of countries such as Austria and France.<br />
On the other hand, Malta had the second-highest number of Large<br />
jets with a total of 61 jets, while Austria had the second-largest<br />
fleet of Long Range jets with 58 in operation. The United Kingdom,<br />
with the fourth-largest fleet in Europe, contracted by almost onequarter<br />
of its total fleet count from <strong>Q1</strong> 2020 over the three-year<br />
period. Despite the challenges faced, various operators undertook<br />
fleet modernization programs to replace aging aircraft, and could<br />
offer prospects for growth in the future.<br />
Business Jet OEMs in <strong>Q1</strong> <strong>2023</strong><br />
Business Jet Size Categories in <strong>Q1</strong> <strong>2023</strong><br />
Airbus (34, 1%)<br />
Pilatus (57, 2%)<br />
Gulfstream (218, 9%)<br />
Embraer (262, 10%)<br />
2,535<br />
Cirrus(29, 1%)<br />
Boeing (23, 1%)<br />
Others* (52, 2%)<br />
Textron (889, 35%)<br />
Very Light (348, 14%)<br />
Large (382, 15%)<br />
2,535 488<br />
Corp. Airliner (70, 3%)<br />
Light (807, 32%)<br />
Dassault (345, 14%)<br />
Bombardier (626, 25%)<br />
Medium (388, 15%)<br />
Long Range (540, 21%)<br />
Others*: Other OEMs include Honda, Eclipse, Nextant, British Aerospace, Lockheed, Fokker, North American, Mitsubishi, IAI, MD.<br />
FIRST QUARTER <strong>2023</strong> — GLOBAL SKY QUARTERLY | 9
EUROPE PROFILE: BUSINESS JET<br />
Textron Aviation emerged as the most popular major OEM in the<br />
European business aviation market, with its Light and Very Light<br />
jet type series such as the Citation 525A (CJ2) and the Citation<br />
525 (CJ1) leading the way. These aircraft models have a prominent<br />
presence in the market thanks to their optimal range for flying within<br />
the continent, comparatively lower operating and maintenance costs<br />
than other jets in the same category, desirable fuel efficiency relative<br />
to their performance, and their ability to approach shorter runways<br />
at smaller airports across the region. The OEM also contributed the<br />
highest volume of Medium jets in the region with 138 jets during the<br />
latest quarter.<br />
Light jets have become increasingly popular among business jet<br />
travellers in Europe due to their performance capabilities most<br />
suited to operating intracontinental routes and constitute 32% of the<br />
fleet in the region. Popular Light-sized models in the region include<br />
the CJ2 and CJ3, the Phenom 300, and the Pilatus PC-24.<br />
Bombardier and Dassault were the major manufacturers that<br />
contributed the most volume of Long Range, and Large aircraft to<br />
the European market. The most popular Long Range model was the<br />
Global 6000, with 104 jets in operation, which saw a transaction<br />
during the current quarter when an aircraft was transferred from the<br />
United States to Luxaviation in San Marino. Following closely was<br />
the Falcon 7X, with 84 registered in operation, while the Falcon 8X,<br />
the extended-range variant, had a fleet of 41 jets. The Long Range<br />
category represented the second largest market share in Europe.<br />
The Falcon 2000EX, an extended-range variant of the Falcon<br />
2000, was the most popular Large jet in Europe and had 77 jets in<br />
operation. This model was only produced between 2003 and 2004,<br />
and the recent average asking prices ranged between USD $8 and<br />
$11 million according to Controller. During this quarter, an aircraft<br />
from NetJets Europe in Portugal was sold to the United States.<br />
The Challenger 300 and the updated 350 series were the most<br />
popular Medium jets in Europe, with a collective fleet of 86 jets<br />
registered during the latest quarter. Despite residual values<br />
plateauing after a noticeable rise in the previous year according to<br />
VREF, the Challenger 300’s asking price ranged from USD $10 million<br />
to $16 million, depending on the model year, while the newer 350<br />
(model years 2016 to 2020) commanded asking prices of between<br />
USD $13.5 and $26.7 million according to Controller.<br />
Embraer was the fourth largest OEM in Europe with a total market<br />
share of 10%, primarily producing Light and Large jets in the region.<br />
The Phenom 300 was its leading model in Europe, with a fleet of<br />
66 jets in operation during <strong>Q1</strong> <strong>2023</strong>, representing 14% of the global<br />
fleet of 487 jets. The updated variant of the model, the Phenom<br />
300E, registered 34 units in operation in the latest quarter and could<br />
present an attractive opportunity for buyers given recent asking<br />
prices for the Phenom 300 (averaging USD $8.51 million), which had<br />
come close to the average of USD $9 million being asked for the<br />
newer 300E. With significant revisions to its cabin design aimed at<br />
enhancing comfort, the 300E could attract buyers initially interested<br />
in the older Phenom 300 or even the Pilatus PC-24.<br />
Gulfstream, the fifth largest OEM, had 27% of all Long Range jets in<br />
Europe. The G550 was the most prevalent, with 54 jets in operation,<br />
followed by the G650 (36 jets), the G650ER (23 jets), and the GV /<br />
GV-SP (21 jets).<br />
Corporate Airliners had the smallest market share in the region,<br />
largely due to their large footprint and reliance on larger airports. The<br />
ACJ319 was the most popular Corporate Airliner in the region, with<br />
24 jets registered during the latest quarter.<br />
10 | GLOBAL SKY QUARTERLY — FIRST QUARTER <strong>2023</strong>
EUROPE PROFILE: BUSINESS JET<br />
PRE-OWNED MARKET SITUATION<br />
Inventory Value (USD) 1<br />
3,000,000,000<br />
2,500,000,000<br />
2,000,000,000<br />
Corp. Airliner<br />
1,500,000,000<br />
Long Range<br />
1,000,000,000<br />
50,000,000<br />
Large<br />
Medium<br />
0<br />
Mar Apr May Jun Jul Aug Sep Oct Nov Dec Jan Feb Mar Apr May Jun Jul Aug Sep Oct Nov Dec Jan Feb Mar Apr May Jun Jul Aug Sep Oct Nov Dec Jan Feb Mar<br />
2020<br />
2021<br />
2022<br />
<strong>2023</strong><br />
Light<br />
Very Light<br />
Source: AMSTAT & Global <strong>Sky</strong> Media<br />
There was little doubt that the rate of inventory consumption for<br />
business jets during 2022 did not keep pace with market activity<br />
during 2021. The number of aircraft for sale on the pre-owned market<br />
dropped from a monthly average of 163 jets during 2021, down to an<br />
average of 117 jets during 2022. Average monthly transactions also<br />
declined from 28 jets sold in the months of 2021, down to 24 sold in<br />
the months during 2022. The demand for aircraft has dropped from the<br />
peak transaction levels seen in Q2 2021 (and subsequently resulted in<br />
sustained consumption of inventory) but remained at a high level.<br />
However, with OEMs needing to process order backlogs of up to two<br />
years or above amid the slow recovery of supply chains (especially<br />
concerning engine manufacturers), it would take a long period of time<br />
before their deliveries start to meaningfully replenish the operating fleet<br />
back to the levels seen in Q3 2020.<br />
Therefore existing owners of desirable aircraft that are maintained to<br />
a high, turnkey standard (considering existing long servicing times<br />
due to supply strains for parts) look set to capitalize on the scarce<br />
existing supply for their aircraft (owing to slower replenishment of<br />
the pre-owned market) to command higher asking prices. The market<br />
trend for aircraft prices as shown in the Market Dynamics section in<br />
the report reinforces the view that prices worldwide were still strong,<br />
and that a gradual balancing of the supply and demand as seen<br />
during the second half of 2022 did not necessarily equate to firm<br />
moderation of asking prices.<br />
On the evidence in the rate of recovery observed across the market<br />
inventory during <strong>Q1</strong> <strong>2023</strong>, it was clear that aside from Corporate Airliner<br />
jets, inventory had risen for all other sizes of jets in Europe over the<br />
past quarter. 6.3% of Very Light jets in operation was being advertised<br />
for sale, up from 5.2% in Q4 2022, 6.5% of Long Range jets were for sale<br />
up from 4.8%, 6.3% of Large jets were for sale, up from 4.8%, and 7.2%<br />
of Light jets were for sale, also up from 4.8%.<br />
Note: 1. Inventory value is adjusted by Global <strong>Sky</strong> Media based on aggregated data. It is calculated by taking the number of aircraft for sale, multiplied by their average asking prices.<br />
FIRST QUARTER <strong>2023</strong> — GLOBAL SKY QUARTERLY | 11
EUROPE PROFILE: BUSINESS JET<br />
Aircraft For Sale<br />
300<br />
Corp. Airliner Long Range Large Medium Light Very Light<br />
250<br />
200<br />
150<br />
100<br />
50<br />
0<br />
Mar<br />
2020<br />
Apr<br />
May Jun Jul Aug Sep Oct Nov Dec Jan Feb Mar Apr May Jun Jul Aug Sep Oct Nov Dec Jan Feb Mar Apr May Jun Jul Aug Sep Oct Nov Dec Jan Feb Mar<br />
2021<br />
2022<br />
<strong>2023</strong><br />
Percent of AC for Sale (% of Fleet)<br />
12.0%<br />
10.0%<br />
8.0%<br />
6.0%<br />
4.0%<br />
2.0%<br />
0.0%<br />
Mar<br />
20<br />
May<br />
20<br />
Jul<br />
20<br />
Sep<br />
20<br />
Nov<br />
20<br />
Jan<br />
21<br />
Mar<br />
21<br />
May<br />
21<br />
Jul<br />
21<br />
Sep<br />
21<br />
Nov<br />
21<br />
Jan<br />
22<br />
Mar<br />
22<br />
May<br />
22<br />
Jul<br />
22<br />
Sep<br />
22<br />
Nov<br />
22<br />
Jan<br />
23<br />
Mar<br />
23<br />
Avg. Days on Market<br />
600<br />
500<br />
400<br />
300<br />
200<br />
100<br />
0<br />
Mar<br />
20<br />
May<br />
20<br />
Jul<br />
20<br />
Sep<br />
20<br />
Nov<br />
20<br />
Jan<br />
21<br />
Mar<br />
21<br />
May<br />
21<br />
Jul<br />
21<br />
Sep<br />
21<br />
Nov<br />
21<br />
Jan<br />
22<br />
Mar<br />
22<br />
May<br />
22<br />
Jul<br />
22<br />
Sep<br />
22<br />
Nov<br />
22<br />
Jan<br />
23<br />
Mar<br />
23<br />
The pre-owned market for business jets in Europe has shown a<br />
decreasing trend in the average number of days that the aircraft was<br />
listed, with an average of 223 days recorded in the latest quarter,<br />
down from slightly below 300 days since Q2 2022. This trend was<br />
partly due to sales of older aircraft, such as one 2002 Citation Excel<br />
and a 2000-build Dassault Falcon 2000, in the first half of 2022.<br />
Another example is a 1982 Citation IISP that finally sold during <strong>Q1</strong><br />
2022, having been on the market since Q4 2011.<br />
12 | GLOBAL SKY QUARTERLY — FIRST QUARTER <strong>2023</strong>
EUROPE PROFILE: BUSINESS JET<br />
Aircraft Sold<br />
Corp. Airliner Long Range Large Medium Light Very Light<br />
40<br />
35<br />
30<br />
25<br />
20<br />
15<br />
10<br />
5<br />
0<br />
Mar<br />
2020<br />
Apr<br />
May Jun Jul Aug Sep Oct Nov Dec Jan Feb Mar Apr May Jun Jul Aug Sep Oct Nov Dec Jan Feb Mar Apr May Jun Jul Aug Sep Oct Nov Dec Jan Feb Mar<br />
2021<br />
2022<br />
<strong>2023</strong><br />
% of AC Sold / Total AC in Operation<br />
1.6%<br />
1.4%<br />
1.2%<br />
1.0%<br />
0.8%<br />
0.6%<br />
0.4%<br />
0.2%<br />
0.0%<br />
Mar<br />
20<br />
May<br />
20<br />
Jul<br />
20<br />
Sep<br />
20<br />
Nov<br />
20<br />
Jan<br />
21<br />
Mar<br />
21<br />
May<br />
21<br />
Jul<br />
21<br />
Sep<br />
21<br />
Nov<br />
21<br />
Jan<br />
22<br />
Mar<br />
22<br />
May<br />
22<br />
Jul<br />
22<br />
Sep<br />
22<br />
Nov<br />
22<br />
Jan<br />
23<br />
Mar<br />
23<br />
From <strong>Q1</strong> 2022 to the end of Q4 2022, the percentage of aircraft sold<br />
in relation to the fleet in operation remained consistent and ranged<br />
from 0.7% to 1.1%. This evidenced a cooling of the market compared<br />
to the busy activity observed throughout 2021. Over the course of<br />
the latest quarter, there were a total of 60 transactions recorded as<br />
of publication, though this was still lower than the 70 recorded in the<br />
same quarter of the previous year, suggesting that the anticipated<br />
shift towards a balanced market may not be a swift process despite<br />
being predicted during the previous quarter.<br />
FIRST QUARTER <strong>2023</strong> — GLOBAL SKY QUARTERLY | 13
EUROPE PROFILE: BUSINESS JET<br />
The market in Europe had a strong preference for acquiring<br />
business jets that were already based in Europe. This is due to the<br />
competent servicing and management provided by well-established<br />
operators. Additionally, aircraft designated with registries based<br />
in the European Union comply with certification and airworthiness<br />
requirements stipulated by the European Union Aviation Safety<br />
Agency, providing assurances as to the fitness of the operating<br />
fleet. Very Light and Light jets commonly remain within the region<br />
through intra-Europe movements, that are equipped and maintained<br />
to reliably operate high-demand routes across Europe.<br />
Seller Location - Sold to Europe<br />
Corp. Airliner Long Range Large Medium Light Very Light<br />
0 50 100 150 200 250 300 350<br />
400<br />
EUROPE<br />
50<br />
47<br />
43<br />
161 76 378<br />
NORTH AMERICA<br />
4<br />
33 13<br />
22<br />
33 16<br />
121<br />
MENA<br />
14<br />
REST OF THE WORLD<br />
10<br />
ASIA-PACIFIC<br />
10<br />
Note: Only transactions where the buyer and seller country are known are included.<br />
Over the latest three-year period, 71% of aircraft were sold within<br />
the same region. Of those sold to Europe, 23% came from North<br />
America, with 59% of those incoming aircraft being Medium, Light,<br />
and Very Light jets.<br />
Buyer Location - Sold from Europe<br />
Corp. Airliner Long Range Large Medium Light Very Light<br />
EUROPE<br />
0 50 100 150 200 250 300 350 400<br />
450<br />
66<br />
51<br />
45<br />
164<br />
78 406<br />
NORTH AMERICA<br />
35<br />
29 20 27 15 127<br />
ASIA-PACIFIC<br />
38<br />
REST OF THE WORLD<br />
13<br />
MENA<br />
13<br />
Note: Only transactions where the buyer and seller country are known are included.<br />
In contrast, 21% of the aircraft sold by Europe in the past three-year<br />
period went to North America, and 51% of those sales comprised<br />
larger aircraft. A small number of jets were also sold to the Asia-<br />
Pacific and Middle East-North Africa (MENA) regions, with 22%<br />
of those aircraft carrying offshore registrations from San Marino,<br />
Malta, and the Isle of Man.<br />
14 | GLOBAL SKY QUARTERLY — FIRST QUARTER <strong>2023</strong>
EUROPE PROFILE: BUSINESS JET<br />
OTHER OEMS<br />
Other OEMs Market Share in <strong>Q1</strong> <strong>2023</strong><br />
Eclipse (14, 1%)<br />
Major OEMs (2,418, 95%)<br />
Honda (17, 1%)<br />
Other OEMs (117, 5%)<br />
Cirrus (29, 1%)<br />
Pilatus (57, 2%)<br />
Among Light models from other OEMs operating in Europe such as<br />
the HondaJet and its newer Elite range, the PC-24 has seen 185% fleet<br />
growth over the past three years.The PC-24 has proven particularly<br />
appealing to charter and fractional operators in Europe, with Germanybased<br />
Platoon Aviation recently taking delivery of its sixth PC-24<br />
and Luxembourg-based Jetfly, the largest global operator of the type,<br />
adding its tenth to its fleet. Pilatus and Honda had a market share of<br />
7% and 2% in the Light jet market, respectively. Other models in the Very<br />
Light category including the Cirrus SF50, and both the Eclipse 500 and<br />
550, making up 12% of all Very Light jets operating in the region. Cirrus<br />
and Eclipse had an OEM market share of 8% and 4% in the Very Light<br />
market, respectively.<br />
Other OEMs Fleet by Quarter<br />
Pilatus Cirrus Eclipse Honda<br />
60<br />
50<br />
40<br />
30<br />
20<br />
10<br />
0<br />
2020<strong>Q1</strong> 2020Q2 2020Q3 2020Q4 2021<strong>Q1</strong> 2021Q2 2021Q3 2021Q4 2022<strong>Q1</strong> 2022Q2 2022Q3 2022Q4 <strong>2023</strong><strong>Q1</strong><br />
FIRST QUARTER <strong>2023</strong> — GLOBAL SKY QUARTERLY | 15
EUROPE PROFILE: BUSINESS JET<br />
Other OEMs Fleet by Model and Country of Registration in <strong>Q1</strong> <strong>2023</strong><br />
28<br />
18<br />
9<br />
8 7 7 7 6 6 8<br />
5 4<br />
2 2<br />
GERMANY<br />
LUXEMBOURG<br />
POLAND<br />
FRANCE<br />
SWEDEN<br />
SWITZERLAND<br />
AUSTRIA<br />
BELGIUM<br />
NETHERLANDS<br />
ITALY<br />
UNITED KINGDOM<br />
SAN MARINO<br />
MALTA<br />
OTHERS<br />
TOTAL<br />
Pilatus PC-24 12 17 2 1 7 6 3 3 1 2 1 2 57<br />
Cirrus VISION<br />
SF50<br />
8 1 4 2 1 2 3 2 4 2 29<br />
HondaJet 2 3 4 1 1 1 1 13<br />
Eclipse 500 3 2 1 4 10<br />
HondaJet<br />
ELITE<br />
1 1 1 1 4<br />
Eclipse 550 3 1 4<br />
TOTAL 28 18 9 8 7 7 7 6 6 5 4 2 2 8 117<br />
Other OEMs Fleet For Sale vs. Sold<br />
For Sale<br />
Sold<br />
1<br />
2<br />
2<br />
1 3<br />
1<br />
1<br />
4<br />
3<br />
1<br />
2<br />
4<br />
5<br />
1<br />
2<br />
1<br />
2<br />
1<br />
2<br />
1<br />
1 1<br />
1<br />
1<br />
11<br />
11<br />
11 12 14 15 13 12 10 7 8 8 7 6 6 4 3 3 3 4 4 5 2 2 1 2 3 6 8 6 6 6 6 5 5 6 6<br />
Mar Apr<br />
2020<br />
May Jun Jul Aug Sep Oct Nov Dec Jan Feb Mar Apr May Jun Jul Aug Sep Oct Nov Dec Jan Feb Mar Apr May Jun Jul Aug Sep Oct Nov Dec Jan Feb Mar<br />
2021<br />
2022<br />
<strong>2023</strong><br />
Pre-owned market inventory was at its highest for models on sale from<br />
the other OEMs during Q3 2020, with a total of 15 advertised for sale<br />
during September 2020. Inventory for Light jets went through a muted<br />
period during <strong>Q1</strong> 2022 and into the beginning of Q2 when no additional<br />
aircraft went on sale. As a result, just one Very Light jet was added to<br />
the market during April 2022. Since Q3 2022, the inventory levels have<br />
been stable, averaging between five and six aircraft being advertised on<br />
the market. Transactions reached an elevated level in 2021 when seven<br />
aircraft were sold over the two-month period of May and June 2021,<br />
before the market saw the highest volume of transactions in a single<br />
month during May 2022 where a total of five aircraft were sold. During<br />
the latest quarter, there were no transactions recorded for business jets<br />
from the other OEMs.<br />
16 | GLOBAL SKY QUARTERLY — FIRST QUARTER <strong>2023</strong>
HELICOPTER<br />
EUROPE PROFILE: HELICOPTER<br />
MARKET OVERVIEW<br />
Helicopter Fleet by Quarter<br />
Heavy Super Medium Medium Twin Light Twin Single<br />
4,500<br />
4,000<br />
3,982 4,002 4,019 4,036 4,001 4,023 4,025 4,038 4,076 4,101 4,099 4,111 4,115<br />
3,500<br />
3,000<br />
2,500<br />
2,000<br />
1,500<br />
1,000<br />
500<br />
0<br />
2020<strong>Q1</strong> 2020Q2 2020Q3 2020Q4 2021<strong>Q1</strong> 2021Q2 2021Q3 2021Q4 2022<strong>Q1</strong> 2022Q2 2022Q3 2022Q4 <strong>2023</strong><strong>Q1</strong><br />
Top Five Countries of Registration<br />
United Kingdom France Italy Germany Spain<br />
700<br />
650<br />
600<br />
550<br />
500<br />
450<br />
400<br />
350<br />
300<br />
Mar<br />
20<br />
May<br />
20<br />
Jul<br />
20<br />
Sep<br />
20<br />
Nov<br />
20<br />
Jan<br />
21<br />
Mar<br />
21<br />
May<br />
21<br />
Jul<br />
21<br />
Sep<br />
21<br />
Nov<br />
21<br />
Jan<br />
22<br />
Mar<br />
22<br />
May<br />
22<br />
Jul<br />
22<br />
Sep<br />
22<br />
Nov<br />
22<br />
Jan<br />
23<br />
Mar<br />
23<br />
FIRST QUARTER <strong>2023</strong> — GLOBAL SKY QUARTERLY | 17
EUROPE PROFILE: HELICOPTER<br />
The helicopter fleet in Europe recorded a net addition of 39 helicopters<br />
during the 12-month period from <strong>Q1</strong> 2022 to <strong>Q1</strong> <strong>2023</strong>, reaching a total of<br />
4,115 in operation and a growth rate close to 1.0%. Over the latest threeyear<br />
period, the fleet increased by 3.3%. The top five countries by fleet<br />
size held a market share of 67%, with France leading the national fleet<br />
count at 637 helicopters, overtaking the UK's largest fleet in Q2 2022.<br />
The UK's fleet shrank by 9% over the latest three-year period, totalling 607<br />
helicopters in operation during <strong>Q1</strong> <strong>2023</strong>. Italy maintained the third largest<br />
helicopter fleet with 561 in operation, having surpassed Germany's fleet<br />
in <strong>Q1</strong> 2022. Germany and Spain completed the top five countries with<br />
528 and 439 helicopters, respectively.<br />
Following the spike in demand associated with the reopening of the<br />
world economy in 2021, the helicopter market has likewise moderated,<br />
experiencing a slower growth rate by <strong>Q1</strong> <strong>2023</strong>. The helicopter fleet in<br />
Europe grew by 1.9% over a 12-month period during <strong>Q1</strong> 2022, which<br />
has since slowed down to just under 1% during <strong>Q1</strong> <strong>2023</strong> over the same<br />
period. Moreover, the pre-owned market for sale has seen a year-onyear<br />
reduction of 18.8% since <strong>Q1</strong> 2022, while the latest quarter in <strong>2023</strong><br />
recorded a 44.2% decrease in the number of transactions compared to<br />
the sales figures achieved during <strong>Q1</strong> 2022.<br />
Helicopter OEMs in <strong>Q1</strong> <strong>2023</strong><br />
Helicopter Size Categories in <strong>Q1</strong> <strong>2023</strong><br />
MD (127, 3%)<br />
Sikorsky (83, 2%)<br />
Heavy (88, 2%)<br />
Super Medium (46, 1%)<br />
Leonardo (667, 16%)<br />
Medium Twin (742, 18%)<br />
Bell (801, 20%)<br />
4,115<br />
Airbus (2,437, 59%)<br />
4,115<br />
Single (1,713, 42%)<br />
Light Twin (1,526, 37%)<br />
Airbus dominated the European helicopter market in <strong>Q1</strong> <strong>2023</strong> with a<br />
commanding 59% market share, with its Single Turbine H125 boasting<br />
a fleet of 744 helicopters in operation, making it the most popular<br />
model. The Light Twin H135 followed closely behind with a fleet of<br />
619. Bell came in second place among helicopter OEMs with a market<br />
share of 20%, and its most popular models included the Single Bell 206<br />
and Medium Twin Bell 412. Leonardo secured the third spot with 667<br />
helicopters in operation, and its highly successful Medium Twin AW139<br />
and Light Twin AW109 were household names. Rounding out the top<br />
five were MD and Sikorsky, with the Heavy S-92 proving reliable for<br />
offshore and search and rescue (SAR) missions in the region.<br />
Single and Light Twin helicopters were the backbone of the<br />
European helicopter fleet, accounting for 79% of the total fleet,<br />
and their versatility made them well-suited for a broad range of<br />
configurations and missions.<br />
Government agencies in Europe operated a sizeable proportion of<br />
the helicopter fleet, which they used for various missions such as<br />
law enforcement, border surveillance, forestry management, and<br />
firefighting. Among the largest government operators in the region were<br />
the German Federal Police Air Service and the French Armed Forces<br />
(Gendarmerie Nationale).<br />
Babcock was the largest commercial operator in the region, and<br />
according to Parapex Media, had an operating fleet of 254 helicopters<br />
based across several European countries, including France, Italy,<br />
Portugal, Spain, Sweden, and the United Kingdom. Two of the<br />
largest emergency medical services (EMS) operators in Germany,<br />
DRF - Stiftung Luftrettung Gemeinnutzige and ADAC Luftrettung, had<br />
operating fleets of 64 and 55 helicopters, respectively.<br />
18 | GLOBAL SKY QUARTERLY — FIRST QUARTER <strong>2023</strong>
EUROPE PROFILE: HELICOPTER<br />
Top Five Countries of Registration by Size Category in <strong>Q1</strong> <strong>2023</strong><br />
Heavy Super Medium Medium Twin Light Twin Single<br />
0 100 200 300 400 500 600 700<br />
FRANCE<br />
20 64<br />
250<br />
303<br />
UNITED KINGDOM<br />
45 26 84 256<br />
196<br />
ITALY<br />
229 126<br />
204<br />
GERMANY<br />
68<br />
285 172<br />
SPAIN<br />
124<br />
147 163<br />
In France, Single engine helicopters had a market share of 48% of the<br />
national fleet, with models like the H120 and H125 used for various<br />
missions by operators such as HeliDax SAS and SAF Aero Group. In<br />
Germany, Light Twin helicopters accounted for 54% of the operating<br />
fleet, with models like the H135 and H145 configured for missions<br />
such as law enforcement, charter, and EMS. Italy, with a strong<br />
manufacturing presence of Leonardo, had the largest share of Medium<br />
Twin helicopters in its operating fleet, with heavy utilization in EMS by<br />
operators such as Airgreen Srl and Babcock.<br />
Super Medium and Heavy helicopters were utilized for offshore and<br />
search and rescue (SAR) missions in the United Kingdom and France.<br />
Bristow, NHV, CHC Helicopters, and Offshore Helicopter Services UK<br />
Ltd (now owned by Ultimate Aviation based in South Africa) were the<br />
leading operators of the AW189, H175, and S-92A Heavy helicopters.<br />
FIRST QUARTER <strong>2023</strong> — GLOBAL SKY QUARTERLY | 19
EUROPE PROFILE: HELICOPTER<br />
PRE-OWNED MARKET SITUATION¹<br />
Inventory Value (USD) 2<br />
450,000,000<br />
400,000,000<br />
350,000,000<br />
300,000,000<br />
250,000,000<br />
Medium Twin<br />
200,000,000<br />
Light Twin<br />
150,000,000<br />
100,000,000<br />
Single<br />
50,000,000<br />
0<br />
Mar<br />
20<br />
May Jul Sep Nov Jan Mar May Jul Sep Nov Jan Mar May Jul Sep Nov<br />
21<br />
22<br />
Jan<br />
23<br />
Mar<br />
Aircraft For Sale<br />
Medium Twin<br />
Light Twin<br />
Single<br />
300<br />
250<br />
200<br />
150<br />
100<br />
50<br />
0<br />
Mar<br />
20<br />
May Jul Sep Nov Jan Mar May Jul Sep Nov Jan Mar May Jul Sep Nov Jan Mar<br />
21<br />
22<br />
23<br />
Notes: 1.Insufficient data is available for the pre-owned Heavy and Super Medium helicopter for sale, therefore these two particular size categories are not displayed on the graphs. However,<br />
the available data has been incorporated in the calculation of total average days on market.<br />
2. Inventory value is calculated by taking the number of aircraft for sale, multiplied by their average asking prices.<br />
20 | GLOBAL SKY QUARTERLY — FIRST QUARTER <strong>2023</strong>
EUROPE PROFILE: HELICOPTER<br />
Avg. Days on Market<br />
1,000<br />
900<br />
800<br />
700<br />
600<br />
500<br />
400<br />
Mar<br />
20<br />
Apr<br />
May Jun Jul Aug Sep Oct Nov Dec Jan Feb Mar Apr May Jun Jul Aug Sep Oct Nov Dec Jan Feb Mar Apr May Jun Jul Aug Sep Oct Nov Dec Jan Feb Mar<br />
21<br />
22<br />
23<br />
According to the latest available data, the helicopter market in Europe<br />
had stabilized from <strong>Q1</strong> 2020 to <strong>Q1</strong> 2022, despite facing various<br />
challenges such as supply chain issues associated with the COVID-19<br />
pandemic, economic downturn, and a decline in the price of oil which<br />
had affected fleet demand for oil and gas operations. However, the<br />
pre-owned inventory saw more pronounced consumption from <strong>Q1</strong><br />
2022 onwards, as evidenced by the declining number of helicopters for<br />
sale and average number of days helicopters spent on the market. The<br />
average number of days had dropped from 604 at the end of Q4 2022 to<br />
528 at the end of <strong>Q1</strong> <strong>2023</strong>.<br />
In view of decreasing inventory since the beginning of Q2 2022 and<br />
operators returning to optimal utilization of their fleets, there is now<br />
a growing need for a replacement cycle to keep up with operational<br />
demand across a wide range of missions' usage. Specific operators,<br />
such as those involved with offshore and gas, are facing challenges<br />
in maintaining their fleet services due to ongoing supply chain<br />
issues involving servicing components. As an increasing number of<br />
helicopters are contracted for other missions or become grounded due<br />
to a lack of parts, the demand for helicopters to be fit for service could<br />
place increasing pressure on offshore operators to keep their fleets<br />
active while bearing larger associated costs.<br />
Despite the challenges, there are opportunities for OEMs to ramp up<br />
production and consider repurposing inactive aircraft into certified<br />
parts to keep existing fleets active. The operational shortages<br />
experienced in this sector could present a unique opportunity for the<br />
industry to adapt and innovate, providing solutions that will keep the<br />
market moving forward.<br />
Aircraft Sold<br />
40<br />
Heavy Super Medium Medium Twin<br />
Light Twin Single<br />
35<br />
30<br />
25<br />
20<br />
15<br />
10<br />
5<br />
0<br />
Mar<br />
20<br />
May<br />
20<br />
Jul<br />
20<br />
Sep<br />
20<br />
Nov<br />
20<br />
Jan<br />
21<br />
Mar<br />
21<br />
May<br />
21<br />
Jul<br />
21<br />
Sep<br />
21<br />
Nov<br />
21<br />
Jan<br />
22<br />
Mar<br />
22<br />
May<br />
22<br />
Jul<br />
22<br />
Sep<br />
22<br />
Nov<br />
22<br />
Jan<br />
23<br />
Mar<br />
23<br />
FIRST QUARTER <strong>2023</strong> — GLOBAL SKY QUARTERLY | 21
EUROPE PROFILE: HELICOPTER<br />
There has been two transaction peaks in the helicopter market<br />
over the latest three-year period. During May 2021, transactions<br />
for Single helicopters increased sharply, especially for the Bell<br />
206, Eurocopter AS350B3e, and Eurocopter EC120B. These models<br />
were in high demand among European operators utilizing them for<br />
charter and multi-missions roles.<br />
The second transaction peak occurred in April 2022 when transactions<br />
for Medium Twin helicopters notably increased, especially for models<br />
such as the AW139, Bell 412, and S-76C/C++.<br />
Seller Location - Sold to Europe<br />
Heavy<br />
Super Medium<br />
Medium Twin<br />
Light Twin<br />
Single<br />
0 50 100 150 200 250 300 350 400 450 500<br />
EUROPE<br />
11<br />
45 146<br />
249 454<br />
NORTH AMERICA<br />
6 10 19<br />
38<br />
REST OF THE WORLD<br />
12<br />
ASIA-PACIFIC<br />
11<br />
MENA<br />
3<br />
Note: Only transactions where the buyer and seller country are known are included.<br />
Up to 88% of helicopters sold to Europe over the latest three-year period<br />
were intra-Europe movements, which included 249 Single helicopters,<br />
and 146 Light Twin helicopters. In addition, 78% of all transactions<br />
that involved Heavy and Super Medium helicopters were intra-Europe<br />
movements. All three Super Medium helicopters that were sold to the<br />
region over the same period were previously advertised for sale in Europe.<br />
Buyer Location - Sold from Europe<br />
Heavy Super Medium Medium Twin Light Twin Single<br />
0 50 100 150 200 250 300 350 400 450 500<br />
EUROPE 13 48<br />
152<br />
256 473<br />
NORTH AMERICA<br />
5 25 13 19<br />
62<br />
ASIA-PACIFIC<br />
43<br />
REST OF THE WORLD<br />
23<br />
MENA<br />
12<br />
Note: Only transactions where the buyer and seller country are known are included.<br />
Conversely, in the past three years, 77% of helicopters sold from Europe<br />
remained within the region, while 10% were sold to North America,<br />
consisting of 25 Medium Twin helicopters. Helicopters sold to Asia-<br />
Pacific represented 7% of all sales. The United Kingdom was the country<br />
with the largest number of both incoming and outgoing helicopters,<br />
having sold 102 and procured 129 over the three-year period.<br />
22 | GLOBAL SKY QUARTERLY — FIRST QUARTER <strong>2023</strong>
FIRST QUARTER <strong>2023</strong> — GLOBAL SKY QUARTERLY | 23
SPONSORED CONTENT<br />
DASSAULT AVIATION<br />
LOOKS TO NEW HORIZONS<br />
WITH NEW JETS<br />
On May 4, 1963, Dassault Aviation’s first business jet, the Mystère 20, took to the air. In the months that<br />
followed the aircraft would be rebranded as the Falcon 20, which the company deemed a better name for the<br />
American market where its success was essential.<br />
That success would come quickly. Following a visit to Dassault in the early 1960s, legendary aviator Charles<br />
Lindbergh discover the aircraft and quickly informed Juan Trippe, the pioneering founder of Pan American<br />
Airlines, about the aircraft, as he knew Tripp was looking for suitable aircraft to begin a business jet division.<br />
Pan Am, as it would later be known, would go on to place a firm order for 40 Falcon 20s, and take out options<br />
on a further 120 aircraft.<br />
24 | GLOBAL SKY QUARTERLY — FIRST QUARTER <strong>2023</strong>
SPONSORED CONTENT<br />
The Falcon 20 set the pattern<br />
for all subsequent Dassault<br />
business jets.”<br />
Its flight controls, systems and structures borrowed heavily from<br />
Dassault’s Ouragan jet fighter-bomber, France’s first.<br />
That infusion of fighter DNA made the Falcon 20 lighter and<br />
stronger than other contemporary jets, and far faster, with a<br />
maximum operating speed of Mach 0.88. Thanks to powered servo<br />
flight controls and aerodynamics from the Ouragan, pilots swooned<br />
over the aircraft’s superior handling.<br />
The aircraft was a true fusion of market driven comfort wrapped<br />
around a core of fighter technology. For six decades now, that<br />
formula has not changed. Today, Dassault is the only company that<br />
builds fighters and business jets.<br />
While other sixties era business jet brands—Hawker Siddeley, North<br />
American Aviation, Aero Commander, even storied Learjet—have<br />
faded from the scene, Dassault continues to design and build the<br />
most advanced jets in business aviation.<br />
Dassault’s current flagship, the Falcon 8X, can fly up to 12,000 km.<br />
The region figures heavily in the company’s long-term plans. Today,<br />
more than 1,200 business jets are based in the Asia Pacific region,<br />
with new markets such as Vietnam and Malaysia emerging.<br />
Dassault Aviation is bracketing the 8X with two all-new ultrawidebody<br />
designs intended to make occupants feel more as if they<br />
were in their own homes than in a business jet.<br />
The flying penthouse<br />
The 10,200 km Falcon 6X will enter service this year. It has a cabin<br />
that is 1.98m tall by 2.58m wide, making it the largest purpose-built<br />
business jet. Dassault’s in-house Design Studio set a new standard<br />
for contemporary business jet interiors, as recognized by honors<br />
such as the prestigious Red Dot award for industrial design.<br />
The 6X’s digital (fly-by-wire) flight controls, derived from Mirage and<br />
Rafale fighters, are the most advanced yet in a Falcon. Dassault<br />
pioneered fly-by-wire for business aircraft. The company’s digital<br />
flight controls provide full envelope protection, meaning protection<br />
against stalls, overspeeds and overstressing the airframe. They<br />
reduce pilot workload, enhance safety, and provide passengers with<br />
a smoother ride in turbulence. Test pilots say the 6X is the best<br />
handling Falcon yet.<br />
FIRST QUARTER <strong>2023</strong> — GLOBAL SKY QUARTERLY | 25
SPONSORED CONTENT<br />
The 6X will be followed onto the market by an even larger business<br />
jet, the Falcon 10X, with certification planned for 2025. Today,<br />
Dassault is building major structures and systems for the aircraft.<br />
The Falcon 10X cabin is 2.03m by 2.77m cabin, larger than some<br />
regional jets. Range is 13,900 km and its top speed brushes the<br />
speed of sound at Mach 0.925.<br />
The 10X cabin simply gives passengers more of everything. It<br />
has an extended galley with a crew rest area as an option. The<br />
passenger area has four cabin zones of equal size, each with its<br />
own climate controls, but the design is flexible as each zone can be<br />
shortened or extended to customize the layout.<br />
The 10X will have the next generation of digital flight control. New<br />
on the 10X is a Smart Throttle—one lever controlling both engines<br />
in all conditions and tied into the flight control system. It enables an<br />
automatic recovery mode in the event of a wake turbulence upset.<br />
Factory Service Expands in Asia<br />
To support current and future products, Dassault Aviation has<br />
more than doubled the size of its factory service center network in<br />
recent years. Much of that growth has come through new service<br />
centers in the Asia-Pacific region. More service locations mean<br />
more GoTeams ready to dispatch to customers at a moment’s<br />
notice, more parts locally available and more capability for major<br />
inspections and upgrades.<br />
In 2022 it was listed by the Financial Times as one of Europe’s<br />
climate leaders. All Falcons can operate on a 50 percent blend of<br />
sustainable aviation fuel (SAF) , and the Falcon10X will be 100<br />
percent SAF capable. The use of SAF is also part of the SAF plan<br />
implemented by Dassault to reduce the carbon footprint of its<br />
aviation operations. All flights operated by company-owned Falcon<br />
aircraft, whether for testing, demos or Falcon support, are using<br />
SAF blends. Dassault offers a supply at its flagship FBO at Paris-Le<br />
Bourget.<br />
No company today can ignore<br />
environmental concerns and<br />
Dassault is at the forefront<br />
of environmental initiatives<br />
within aviation.”<br />
Dassault is unique in one other way for a major aerospace<br />
company: it is still majority owned by the heirs of its founder,<br />
Marcel Dassault. The advantage, as the company sees it, is less<br />
focus on quarterly earnings and more on long-term investments<br />
and product support infrastructure.<br />
www.dassaultfalcon.com<br />
Dassault Falcon 10X<br />
Factory Service Expands in Asia<br />
26 | GLOBAL SKY QUARTERLY — FIRST QUARTER <strong>2023</strong>
FIRST QUARTER <strong>2023</strong> — GLOBAL SKY QUARTERLY | 27
SPONSORED CONTENT<br />
ENHANCING PERFORMANCE<br />
NOW;<br />
INCREASING VALUE<br />
IN THE FUTURE<br />
With a customer fleet comprised of over 4,000 aircraft and about 8,000 engines, Rolls-Royce<br />
Business Aviation has developed a portfolio of services that ensure its globe-hopping customers<br />
get the most availability from their aircraft now, and top dollar at resale time.<br />
28 | GLOBAL SKY QUARTERLY — FIRST QUARTER <strong>2023</strong>
SPONSORED CONTENT<br />
What a difference two years make. At this time in 2020 travel<br />
restrictions caused by the COVID-19 pandemic made business and<br />
private aviation’s future look disheartening at best.<br />
Aviation at Rolls-Royce. “CCE mitigates maintenance expense by<br />
providing protection against the cost of scheduled and unscheduled<br />
maintenance to the engines.<br />
But, today, thanks to a variety of reasons, the business jet industry<br />
is enjoying a renaissance. Individuals and companies that, 24<br />
months ago, had never dreamed of owning airplanes are buying<br />
them in record numbers. And that global upsurge has caught even<br />
the most experienced business aviation insiders by surprise.<br />
“We [Rolls-Royce Business Aviation] are making sure there’s no<br />
unforeseen risks for our customers,” he continues. “The customer<br />
gets comprehensive coverage for their engine at a predetermined<br />
hourly rate per flying hour. This provides budget predictability and<br />
transparency.”<br />
“We were looking at the wrong things,” says Mesinger Jet Sales<br />
president and CEO Jay Mesinger. “What we didn’t understand was<br />
the wealth that was going to be created during this pandemic or the<br />
absolute disdain people have for getting on the airlines. We also didn’t<br />
understand that they would turn that disdain and that wealth into the<br />
largest number of first-time buyers ever coming into our industry.”<br />
Many industry leaders believe that these new-generation buyers<br />
are entering into aircraft ownership not for its “romance” but for the<br />
tangible business benefits that this high-value asset can deliver.<br />
Helping owners get it right the first time<br />
Of course, the parts that most contribute to the asset’s value are its<br />
engines. And one of the first lessons aircraft owners learn is that<br />
those engines are also the most expensive parts to inspect and repair.<br />
That’s where Rolls-Royce’s CorporateCare® Enhanced (CCE) program<br />
can help. Aircraft owners that enroll in the program have the peace of<br />
mind of knowing there won’t be any costly surprises when it comes to<br />
engine inspection, maintenance, or repairs.<br />
“CorporateCare Enhanced offers substantial financial and operational<br />
benefits to customers, including increased availability, asset value,<br />
and liquidity,” explains Andy Robinson, SVP Services - Business<br />
“It doesn’t matter if they’re in the first month or the eighth year of<br />
the program; we take care of all costs associated with any covered<br />
event,” Robinson adds. “CCE covers all scheduled inspections,<br />
service bulletins, troubleshooting, spare parts, and even provides<br />
lease engines.<br />
“In addition, with the exception of the Tay and AE-series engines,<br />
where we don’t provide the engine nacelles, CorporateCare Enhanced<br />
covers the complete nacelle,” Robinson continues. “The program<br />
even covers erosion and corrosion.”<br />
Price is what you pay. Value<br />
is what you get.”<br />
Warren Buffett<br />
Been there, done that<br />
Robinson shares a story that highlights just how far Rolls-Royce<br />
Business Aviation has gone to “rescue” an AOG customer.<br />
As he explains, one of the company’s CorporateCare Enhanced<br />
customers had flown to the islands of the Maldives– the smallest<br />
country in Asia– and, when preparing to depart, encountered an<br />
issue with one of his airplane’s engines.<br />
The only solution to getting the aircraft off the island was to replace its<br />
malfunctioning engine. Not an easy task under the best of conditions.<br />
With limited infrastructure, we chartered C-130 to deliver a<br />
replacement engine– along with the on-wing technical team and<br />
equipment needed to resolve the issue on the island,” Robinson<br />
says. “This was done at no cost to the customer as they were<br />
covered by CorporateCare.”<br />
Yes, this was an unlikely situation, but it highlights Rolls-Royce<br />
Business Aviation’s commitment to getting its customers’ aircraft<br />
back in the air as quickly, and with as little inconvenience as possible.<br />
FIRST QUARTER <strong>2023</strong> — GLOBAL SKY QUARTERLY | 29
SPONSORED CONTENT<br />
“We understand that owners rely on their aircraft to save them time<br />
and provide unhindered travel flexibility,” Robinson says. “That’s<br />
critical to them. We’ve built a global service network that is in a<br />
class of its own and is dedicated to meeting the unique needs of<br />
business aviation customers.<br />
As noted earlier, another benefit to first-time buyers is that<br />
CorporateCare Enhanced is truly a turn-key engine program. Once<br />
the aircraft is on the program, you eliminate all the worry about<br />
future engine maintenance costs. Plus, being enrolled pays a handy<br />
dividend when you sell the aircraft.<br />
“CorporateCare Enhanced also provides customers with access<br />
to our global support infrastructure, including engine health<br />
monitoring, a network of over 75 authorized service centers, 65<br />
on-wing technicians, and several global spare-parts stores. All<br />
strategically placed around the globe,” he continues. “To make it<br />
easy for our customers, it’s all managed by the experts at Rolls-<br />
Royce 24/7 Business Aviation’s Aircraft Availability Center.”<br />
A benefit aircraft sellers can pass to new owners<br />
While many “extended coverage plans” are thought to bring their<br />
highest value to the owner when an asset is purchased new,<br />
Robinson says that’s not the case with Rolls-Royce’s CorporateCare<br />
Enhanced program.<br />
“With so many business aircraft changing hands now, it’s bringing<br />
a lot of first-time owners, and many of them are buying pre-owned<br />
aircraft,” he explains. “CorporateCare Enhanced is completely<br />
transferable with no added transfer fees, enabling for faster resale<br />
and higher resale value.<br />
“In addition, if you buy a Rolls-Royce powered aircraft that is not<br />
enrolled in the program, you have the opportunity to get coverage,”<br />
Robinson says. “Yes, there is a one-time buy-in cost, but the<br />
owner will still enjoy all the benefits that come with CorporateCare<br />
Enhanced coverage.”<br />
“We created CorporateCare Enhanced on a direct request from key<br />
customers who make up our Corporate Customer Council– C3,”<br />
Robinson says. “They wanted a service option that covered the full<br />
powerplant that Rolls-Royce Business Aviation provides and more.<br />
They were instrumental in developing today’s program. Currently,<br />
more than 70% of all our business aviation engines are enrolled in<br />
the programme.”<br />
Robinson adds that everyone at Rolls-Royce Business Aviation is<br />
gratified by the accolades that its customer support offerings have<br />
gained over the years.<br />
“We are proud that the industry as a whole and our customers in<br />
particular recognize our efforts,” he says. “We have been voted the<br />
number-one service provider by AIN [Aviation International News]<br />
several times in the recent past. Its readers’ votes of confidence<br />
are a great motivation for us to keep building on our position as an<br />
industry leader.<br />
“CorporateCare Enhanced is an excellent program for owners with<br />
any size fleet,” Robinson concludes. “It makes it easy for owners<br />
to manage their costs in a way that is fully transparent while<br />
eliminating unexpected engine maintenance costs and ensuring the<br />
aircraft’s ongoing availability. And with improved residual value, our<br />
program is a plus when it comes time to sell.<br />
www.rolls-royce.com<br />
30 | GLOBAL SKY QUARTERLY — FIRST QUARTER <strong>2023</strong>
BUSINESS<br />
AVIATION<br />
MOOD &<br />
INTENTIONS<br />
QUARTERLY SURVEY
MOOD & INTENTIONS: QUARTERLY SURVEY<br />
QUARTERLY SURVEY<br />
The survey results reflect the views of respondents worldwide on the status of the business aviation market.<br />
1. A total of 88% respondents had an optimistic outlook on the<br />
economy moving forward, with an equal share of respondents<br />
asserting that the latest economic environment was either at<br />
the lowest point or recovering past its lowest point.<br />
2. Considering the recent replenishment of pre-owned market<br />
inventory, 43% of respondents regarded it as a buyer’s market,<br />
while those who viewed it as a seller’s market decreased by<br />
around 20 percentage points over the past quarter.<br />
3. Large jets were the preferred choice of aircraft among those<br />
seeking an aircraft in the market, while price remained the<br />
predominant factor behind purchasing decisions.<br />
4. Over 70% of respondents expressed their intention to charter<br />
aircraft within the next three months.<br />
RESPONDENT BREAKDOWN<br />
Respondent Location Breakdown<br />
Top Locations<br />
Middle East &<br />
North Africa (3%)<br />
Southeast &<br />
Northeast Asia (6%)<br />
Rest of the World (8%)<br />
Greater China (15%)<br />
South Asia (2%)<br />
Oceania (2%)<br />
Singapore (2%)<br />
India (2%)<br />
Canada (2%)<br />
Hong Kong (4%)<br />
United Kingdom (5%)<br />
Mainland China (12%)<br />
90% of total<br />
respondents<br />
Australia (2%)<br />
Indonesia (1%)<br />
Pakistan (1%)<br />
Malaysia (1%)<br />
North America (64%)<br />
United States (68%)<br />
In the latest quarter, 324 business aviation professionals participated in Global <strong>Sky</strong><br />
Media’s survey about the mood and intentions of the industry. Respondents were<br />
based across numerous regions across the world, including North America, East Asia,<br />
Oceania, South Asia, Europe, Southeast & Northeast Asia, and Middle East & North<br />
Africa.<br />
Respondent’s Aircraft Type<br />
Aircraft Owner /<br />
Charter User (18%)<br />
Aircraft Operator /<br />
Management Company (41%)<br />
Civil Helicopter (21%)<br />
Respondent’s Category 1 Aircraft Sales /<br />
Service Providers<br />
(FBO, MRO, etc.) 2 (18%)<br />
93% of total<br />
respondents<br />
Turboprop (27%) Business Jet (52%)<br />
Charter Broker (23%)<br />
The majority of survey responses (41%) came from professionals working in aircraft<br />
operations and management, with respondents working in aircraft sales and<br />
brokerage coming in second (23%). Service providers in the industry, such as FBOs<br />
and MROs, had the third largest response (18%), and 18% were business aircraft<br />
owners and charter users.<br />
Notes: 1. There were 24 respondents not related to the industry, accounting for 7% of total respondents.<br />
2. Aircraft Service Providers includes financial services, training, FBO, ground handlers, Service, MRO, parts, etc.<br />
32 | GLOBAL SKY QUARTERLY — FIRST QUARTER <strong>2023</strong>
MOOD & INTENTIONS: QUARTERLY SURVEY<br />
FACTORS CRITICAL TO THE FUTURE OF AVIATION<br />
Rank the following factors that you think are critical to the future of business aviation / general aviation 1 :<br />
Customer Service<br />
Carbon Emissions<br />
Cabin Sanitation<br />
Maintenance Support<br />
Privacy<br />
1. Outer means more critical.<br />
Flexibility / Punctuality<br />
Value for Price Paid<br />
Respondents regarded flexibility and punctuality as key aspects of<br />
delivering value in business and general aviation in this edition’s survey,<br />
ranking them with the same degree of importance as value in return on<br />
investment. These factors undoubtedly tie in with delivering a high level of<br />
customer service, and compared to the previous quarterly survey results<br />
which focused on the Asia-Pacific region, the worldwide perspective<br />
similarly reflected this as a top priority. In contrast, considerations around<br />
carbon emissions was the lowest among other factors such as sanitation,<br />
privacy, and maintenance support.<br />
ECONOMIC STATUS<br />
What is Our Economic Status in <strong>Q1</strong> <strong>2023</strong>?<br />
Optimistic (Will get better)<br />
Past Low Point (44%)<br />
Pessimistic (Will get worse)<br />
Not Reached Low Point (12%)<br />
Optimistic (Will get better)<br />
At Low Point (44%)<br />
According to the survey, 88% of respondents had a positive outlook on the global<br />
economy, believing that the economic conditions were presently at their lowest point,<br />
or past that point before an impending recovery. The remaining 12% believed that<br />
there would be further depression in the market before predictable signs of recovery<br />
could potentially emerge beyond the latest quarter.<br />
PURCHASE INTENTIONS<br />
Purchase Intentions <strong>Q1</strong> <strong>2023</strong><br />
Purchase Decisions - Influencing Factors<br />
Government / Public Opinion<br />
Not Sure (11%)<br />
Inconvenient to Use<br />
(limited or inflexible operation)<br />
No Interesting Aircraft<br />
New Aircraft (42%)<br />
Pre-owned Aircraft (47%)<br />
Most Limited<br />
No Need<br />
Price<br />
There was a larger proportion of respondents with an intention to purchase a preowned<br />
aircraft (47%) compared to those looking for a new order from OEMs (42%).<br />
This was not surprising given that backlogs with major OEMs were, on average, still<br />
at two years or longer for taking delivery, contributing to greater demand for near-new<br />
or modernized jets in the pre-owned market. The large business jet was the preferred<br />
type of aircraft among respondents with an intention to purchase (pre-owned or new)<br />
within the next 12 months.<br />
FIRST QUARTER <strong>2023</strong> — GLOBAL SKY QUARTERLY | 33
MOOD & INTENTIONS: QUARTERLY SURVEY<br />
Aircraft Purchase Intention - Fixed Wing<br />
Aircraft Purchase Intention - Rotary<br />
Corporate Airliner<br />
(Such as ACJ, BBJ)<br />
Twin Turbine Helicopter<br />
(Such as Sikorsky S-76C+)<br />
Most Preferred<br />
Turboprop/<br />
Piston Fixed Wing<br />
(Such as King Air Series)<br />
Large Jet<br />
(Such as G650,<br />
Falcon 8X)<br />
Most Preferred<br />
Small Jet<br />
(Such as Citation Series,<br />
Hawker Series)<br />
Medium Jet<br />
(Such as Challenger 650)<br />
Piston Helicopter<br />
(Such as Robinson R22)<br />
Single Turbine Helicopter<br />
(Such as Bell 206)<br />
Where are We Currently in the Pre-owned Market?<br />
Buyer’s Market Balanced Market Seller’s Market I’m not sure<br />
67%<br />
62%<br />
63%<br />
54%<br />
52%<br />
58%<br />
58%<br />
55%<br />
53%<br />
58%<br />
47%<br />
46%<br />
43%<br />
22%<br />
30%<br />
29%<br />
26%<br />
26%<br />
24%<br />
28%<br />
26%<br />
28%<br />
26%<br />
13%<br />
12%<br />
8%<br />
13%<br />
11%<br />
18%<br />
13%<br />
7%<br />
17%<br />
10%<br />
15%<br />
8%<br />
19%<br />
16%<br />
16%<br />
18%<br />
16%<br />
11%<br />
15%<br />
8%<br />
10%<br />
20%<br />
8%<br />
0%<br />
0%<br />
0%<br />
4%<br />
3%<br />
2020<br />
<strong>Q1</strong><br />
2020<br />
Q2<br />
2020<br />
Q3<br />
2020<br />
Q4<br />
2021<br />
<strong>Q1</strong><br />
2021<br />
Q2<br />
2021<br />
Q3<br />
2021<br />
Q4<br />
2022<br />
<strong>Q1</strong><br />
2022<br />
Q2<br />
2022<br />
Q3<br />
2022<br />
Q4<br />
<strong>2023</strong><br />
<strong>Q1</strong><br />
Given the general replenishment of inventory in the business jet pre-owned market,<br />
43% of respondents believed that the market was shifting towards a buyer’s market.<br />
This stood at just 20% from the survey results of the previous quarter, while those<br />
that believed the market favored the seller had markedly dropped from 46% recorded<br />
in the previous survey to 28% in the current result. The proportion of respondents<br />
who thought the market was balanced between supply and demand had remained<br />
the same since the last quarter, at 26%. The varying responses to the perception of<br />
where the market was positioned depended on the model of aircraft that was on the<br />
market and whether it was specifically in high demand in relation to the number being<br />
advertised for sale. During the latest quarter, the market environment was mixed;<br />
some aircraft maintained strong residual values despite undergoing price corrections<br />
as their inventory increased, while aging aircraft that were not as modern as desired<br />
by potential buyers commanded lower values and stayed in the market for a longer<br />
period compared to their newer counterparts.<br />
34 | GLOBAL SKY QUARTERLY — FIRST QUARTER <strong>2023</strong>
MOOD & INTENTIONS: QUARTERLY SURVEY<br />
CHARTER INTENTIONS<br />
Charter Intentions in Next Three Months<br />
No (7%)<br />
Not sure / Considering (21%)<br />
Yes (72%)<br />
Up to 72% of respondents intend to use charter services within the next three<br />
months, while 7% did not plan to use such services. New for this edition of the<br />
survey was a question that asked respondents to rank their considerations<br />
for choosing a suitable charter operator or broker. Among the most important<br />
considerations were their safety record and the quality of overall service, while<br />
reputation and experience was also regarded as pivotal for a well-accommodated<br />
chartering experience, second only to safety record and the quality of overall<br />
service. Less important according to respondents was the budget, that is far less<br />
complex when compared to associated fees from ownership.<br />
Primary Considerations for Choosing the Most Suitable Charter Operator / Broker<br />
5-Essential 3-Average 1-Irrelevant<br />
0 10% 20% 30% 40% 50% 60% 70% 80% 90% 100<br />
SAFETY RECORD<br />
42% 42% 14%<br />
REPUTATION &<br />
EXPERIENCE<br />
32%<br />
48%<br />
16%<br />
4%<br />
FLEET SIZE &<br />
AVAILABILITY<br />
18%<br />
51%<br />
23%<br />
5% 3%<br />
LICENSING &<br />
INSURANCE PROVISION<br />
22%<br />
53%<br />
18%<br />
6%<br />
FEES TRANSPARENCY<br />
21%<br />
50%<br />
20%<br />
7%<br />
BUDGET<br />
19%<br />
49%<br />
24%<br />
6%<br />
QUALITY OF SERVICE<br />
40%<br />
42%<br />
14%<br />
4%<br />
FLEET UTILIZATION<br />
How is Your Aircraft Utilization Compared to 12 Months Ago?<br />
Based on the responses of 72% of the participants, it appears that business<br />
Down 20% or more<br />
(20%) (24%)<br />
Decreased (14%)<br />
Up but less than 20%<br />
(0—20%) (48%)<br />
Down but less than 20%<br />
(-20% — 0%) (11%)<br />
Unchanged (14%)<br />
The same (0%) (14%)<br />
Increased (72%)<br />
aviation activity has increased globally. Among them, 24% reported an increase<br />
in activity of 20% or more, while 48% reported an increase in activity of up to<br />
20%. The remaining 14% of respondents reported no change or a decrease in<br />
fleet utilization, which was evenly split.<br />
Since the lifting of global pandemic restrictions, the demand for business jet<br />
travel has increased significantly, particularly among charter operators, who are<br />
experiencing interest from first-time users seeking a safer and more convenient<br />
way to travel. The peak in demand and subsequent consumption of pre-owned<br />
business jets from 2021 to 2022 have also contributed to increased activity. This<br />
period has undoubtedly benefited sellers of aircraft, who have taken advantage<br />
of higher asking prices in the market.<br />
FIRST QUARTER <strong>2023</strong> — GLOBAL SKY QUARTERLY | 35
GLOBAL SKY FORUM IN AUSTRALIA<br />
THE GLOBAL SKY FORUM<br />
– HELICOPTERS <strong>2023</strong><br />
By Alud Davies<br />
Fresh from organizing the inaugural<br />
Global <strong>Sky</strong> Forum – Business Aviation<br />
in Kuala Lumpur, Malaysia in February,<br />
and co-organizing the Mobility<br />
Forum during the Rotocraft Asia and<br />
Unmanned Systems Asia event in<br />
Singapore in May, the highly successful<br />
Global <strong>Sky</strong> Forum series will move<br />
to Brisbane, Australia, in September,<br />
where it will focus on helicopters.<br />
Australia was the logical choice to host the next Global <strong>Sky</strong> Forum,<br />
as it has the largest fleet of helicopters in Asia-Pacific. According<br />
to the latest Civil Helicopters Fleet Report, Australia had 967 civil<br />
registered turbine helicopters in its fleet at the end of 2022. As well<br />
as being the biggest market in the region, it is also the country that<br />
grew the most in 2022, having added a net 4% more helicopters to<br />
its fleet during the year.<br />
36 | GLOBAL SKY QUARTERLY — FIRST QUARTER <strong>2023</strong>
GLOBAL SKY FORUM IN AUSTRALIA<br />
The location of the next<br />
Global <strong>Sky</strong> Forum –<br />
Helicopters was never in<br />
doubt, Australia not only has<br />
the biggest fleet helicopter<br />
fleet in the region, but it also<br />
added the most helicopters to<br />
its fleet in 2022.”<br />
says Tan Rahman, Managing Director, Global <strong>Sky</strong> Media.<br />
The forum itself will take on a familiar format, with engaging panel<br />
sessions that will be designed to educate and stimulate further<br />
conversation. As with the Global <strong>Sky</strong> Forum – Business Aviation<br />
in Kuala Lumpur earlier in the year, presentations will be mostly<br />
banned unless they are necessary.<br />
Brisbane, Australia<br />
One of the key features from the first Global <strong>Sky</strong> Forum was the<br />
amount of time that people had to network. Bringing people together<br />
was one of the main aims of the for the first forum, so this will be<br />
extended for the Australia forum as well in the form of extra-long lunch<br />
and refreshment breaks. There will also be a cocktail party on the first<br />
night of the forum, as well as the night before the conference starts.<br />
The conference agenda has been programmed after speaking with<br />
local experts in the helicopter industry to ensure that most panels<br />
sessions can focus on local challenges and opportunities. As well as<br />
panels focusing solely on the host country, the conference will also<br />
include a session on Australia’s neighbor to the east, New Zealand.<br />
Although New Zealand’s helicopter market is a little over half the<br />
size of Australia’s, it’s 567 helicopters at the end of 2022 makes<br />
it the fourth largest in Asia-Pacific, behind Australia, mainland<br />
China and India. It is also a distinctly different market to Australia,<br />
whereas the former is largely flat, New Zealand is known for its<br />
mountainous terrain, meaning that it’s a different market when it<br />
comes to mission profiles.<br />
“The forum will be held in Australia, but New Zealand is a vitally<br />
important market for helicopters,” says Rahman. “So, we felt it is very<br />
important to also have a panel focusing on Australia’s nearest neighbor.”<br />
The desire for networking was evidenced not only by the direct feedback<br />
that Global <strong>Sky</strong> Media received, but it was also very noticeable in the<br />
feedback forms that were distributed towards the end of the Kuala<br />
Lumpur forum. Other feedback indicated that 45 minutes was in some<br />
cases too long for a panel discussion, so the Brisbane event will cap<br />
panel times at 30 minutes maximum. Delegates also indicated that they<br />
enjoyed the opportunity to ask questions as well, so rather than relying<br />
mostly on the Slido smartphone-based platform for taking questions, the<br />
forum will also set aside some time at the end of the forum for delegates<br />
to directly ask questions to the panel.<br />
The Global <strong>Sky</strong> Forum – Helicopters <strong>2023</strong> will take place between<br />
September 12th – 13th, at the Hilton Hotel, Brisbane, Australia. To<br />
find out more, and register for the event, please visit the dedicated<br />
event website:<br />
www.theglobalskyforum.com<br />
Global <strong>Sky</strong> Forum – Business Aviation <strong>2023</strong> Global <strong>Sky</strong> Forum – Business Aviation <strong>2023</strong><br />
FIRST QUARTER <strong>2023</strong> — GLOBAL SKY QUARTERLY | 37
IADA MARKET REPORT<br />
FIRST QUARTER <strong>2023</strong><br />
It’s my pleasure to present to you the First Quarter <strong>2023</strong> IADA Market<br />
Report. The IADA Market Report has become a valued resource for<br />
anyone interested in the business aviation industry. Our sales data<br />
and global perspectives on the market provide an informed view of<br />
where our industry stands and our projections about the course of our<br />
industry over the next six months.<br />
Our data are both quantitative (based on actual sales and<br />
transactions) and qualitative (based on The Perspective Survey,<br />
conducted quarterly among all IADA members). The value of our data<br />
is crucial due to the leadership and performance of IADA members<br />
in the global marketplace. We are proud to say that IADA Accredited<br />
Dealers and Certified Brokers continue to be the pacesetters in the<br />
business aircraft market, buying and selling more aircraft by dollar<br />
volume than the rest of the world’s dealers combined.<br />
While our headlines are full of dire news about the state of the world’s<br />
economy, IADA Accredited Dealers, Certified Brokers, OEMs, and<br />
Products and Services Members are resilient.<br />
• They show increased optimism about the next six months of the<br />
business aircraft market compared with the fourth quarter of 2022.<br />
• Sales continue to be strong, with data showing closed deals<br />
coming off their recent peak but well above 2021 levels.<br />
• Projections for sales, finance/leasing and insurance sectors<br />
all show a rebound from the data we collected in last quarter’s<br />
Perspective Survey.<br />
IADA plays a pivotal role at the intersection of supply and demand<br />
forces in today’s business aviation marketplace. I trust that you will<br />
find our latest Market Report to be timely, insightful and a must-read<br />
to stay at the leading edge of this exciting industry.<br />
Onward and upward,<br />
WAYNE STARLING<br />
Executive Director, IADA<br />
38 | GLOBAL SKY QUARTERLY — FIRST QUARTER <strong>2023</strong>
IADA MARKET REPORT<br />
BACKGROUND ON RESPONDENTS<br />
IADA Products and Services Members are part of our collective<br />
network and represent a breadth of members that provide<br />
comprehensive services, including transactions, operation,<br />
maintenance, insurance, and financing and leasing. Together, they<br />
offer a unique perspective on the current state of the industry, as well<br />
as an informed point of view on projections for the next six months.<br />
CURRENT ROLE OF SURVEY RESPONDENTS<br />
CURRENT SALES MARKET OF SURVEY RESPONDENTS<br />
DEALER/BROKER<br />
FINANCE/LEASE PROVIDER<br />
INSURANCE PROVIDER<br />
ESCROW AGENT<br />
LEGAL<br />
NEW AIRCRAFT SALES<br />
PRE-OWNED AIRCRAFT SALES<br />
BOTH NEW AND<br />
PRE-OWNED AIRCRAFT SALES<br />
OTHER (MAINTENANCE,<br />
OPERATIONS, ETC.)<br />
MARKETS THAT MEMBERS DO BUSINESS IN<br />
97% of IADA dealers<br />
do business in<br />
NORTH AMERICA<br />
62% of IADA dealers<br />
do business in<br />
EUROPE<br />
44% of IADA dealers<br />
do business in<br />
ASIA AND PACIFIC<br />
56% of IADA dealers<br />
do business in<br />
LATIN AMERICA/CARIBBEAN<br />
35% of IADA dealers<br />
do business in<br />
AFRICA<br />
40% of IADA dealers<br />
do business in<br />
MIDDLE EAST<br />
WHO IS DRIVING TODAY’S MARKET<br />
SELLERS<br />
BUYERS<br />
FIRST QUARTER <strong>2023</strong> — GLOBAL SKY QUARTERLY | 39
IADA MARKET REPORT<br />
GENERAL MARKET CONDITIONS<br />
The following charts provide insights into IADA members’<br />
assessments of current and nearterm evolving market conditions<br />
and are derived from our proprietary online quarterly surveys.<br />
Responses are aggregated and reported on a 1- 5 scale, with a<br />
score of 1 representing “Worst Ever” and 5 representing “Best Ever.”<br />
OVERALL MARKET CONDITIONS | <strong>Q1</strong> YEAR OVER YEAR<br />
On a 1-5 scale, with 1 meaning “worst ever” and 5 meaning “best ever”<br />
<strong>Q1</strong> <strong>2023</strong> <strong>Q1</strong> 2022<br />
What is your assessment of the current<br />
business aircraft sales market?<br />
3.6<br />
4.1<br />
What is your projection for the business<br />
aircraft sales market six months from now?<br />
3.2<br />
3.9<br />
What is your projection for the business aircraft<br />
finance/leasing market six months from now?<br />
2.9<br />
3.3<br />
What is your projection for the business aircraft<br />
insurance market six months from now? (This is a new survey question as of <strong>Q1</strong> <strong>2023</strong>)<br />
2.9<br />
CURRENT MARKET<br />
ASSESSMENT OF THE CURRENT BUSINESS AIRCRAFT SALES MARKET<br />
On a 1-5 scale, with 1 meaning “worst ever” and 5 meaning “best ever”<br />
BEST EVER<br />
5<br />
4<br />
4.1<br />
3.7<br />
3.8<br />
3.6 3.6<br />
NORMAL<br />
3<br />
2<br />
WORST EVER<br />
1<br />
<strong>Q1</strong> 2022 Q2 2022 Q3 2022 Q4 2022 <strong>Q1</strong> <strong>2023</strong><br />
40 | GLOBAL SKY QUARTERLY — FIRST QUARTER <strong>2023</strong>
IADA MARKET REPORT<br />
SALES<br />
AIRCRAFT SALES MARKET PROJECTIONS 6 MONTHS FROM NOW<br />
On a 1-5 scale, with 1 meaning “worst ever” and 5 meaning “best ever”<br />
BEST EVER<br />
5<br />
4<br />
3.9<br />
NORMAL<br />
3<br />
3.3<br />
3.2<br />
3.0<br />
3.2<br />
2<br />
WORST EVER<br />
1<br />
<strong>Q1</strong> 2022<br />
Q2 2022<br />
Q3 2022<br />
Q4 2022<br />
<strong>Q1</strong> <strong>2023</strong><br />
AIRCRAFT FINANCE/LEASING MARKET PROJECTIONS 6 MONTHS FROM NOW<br />
On a 1-5 scale, with 1 meaning “worst ever” and 5 meaning “best ever”<br />
FINANCE/LEASING<br />
BEST EVER<br />
5<br />
4<br />
3.3<br />
NORMAL<br />
3<br />
2.7<br />
2.8<br />
2.6<br />
2.9<br />
2<br />
WORST EVER<br />
1<br />
<strong>Q1</strong> 2022<br />
Q2 2022<br />
Q3 2022<br />
Q4 2022<br />
<strong>Q1</strong> <strong>2023</strong><br />
INSURANCE<br />
AIRCRAFT INSURANCE MARKET PROJECTIONS 6 MONTHS FROM NOW<br />
On a 1-5 scale, with 1 meaning “worst ever” and 5 meaning “best ever”<br />
BEST EVER<br />
5<br />
4<br />
NORMAL<br />
3<br />
2.9<br />
2<br />
WORST EVER<br />
1<br />
<strong>Q1</strong> 2022<br />
Q2 2022<br />
Q3 2022<br />
Q4 2022<br />
<strong>Q1</strong> <strong>2023</strong><br />
FIRST QUARTER <strong>2023</strong> — GLOBAL SKY QUARTERLY | 41
IADA MEMBER INSIGHTS<br />
Pre-owned buyers are expecting significant<br />
price reductions, but inventory remains<br />
low especially on late-model aircraft.<br />
ROBERT SAMMARTINO<br />
SKYTECH INC. // IADA ACCREDITED DEALER<br />
Still low inventory and a seller’s market.<br />
Buyers being more cautious but still active.<br />
TODD SPANGLER<br />
JETCRAFT // IADA ACCREDITED DEALER<br />
If it weren’t for supply chain issues limiting OEM<br />
production capacity, we’d be looking at “best ever.”<br />
RONALD SMITH<br />
WESTERN AIRCRAFT, INC. // IADA ACCREDITED DEALER<br />
The pack has separated. Every market’s for<br />
itself. Some are firm, others are soft. Some prices<br />
are way down, others remain unchanged.<br />
MIKE SWARTZ<br />
SWARTZ AVIATION GROUP, LLC // IADA ACCREDITED DEALER<br />
42 | GLOBAL SKY QUARTERLY — FIRST QUARTER <strong>2023</strong>
IADA MARKET REPORT<br />
6-MONTH MARKET SECTOR OUTLOOK<br />
The following charts are derived from a series of questions seeking<br />
IADA members’ perspectives on specific sectors of the pre-owned<br />
aircraft market. Responses regarding the outlook for the next six<br />
months are aggregated and reported on a 5-point scale, with 1<br />
representing “Significant Decrease,” and 5 representing “Significant<br />
Increase.”<br />
PRICING<br />
PRICING PROJECTIONS FOR THE NEXT 6 MONTHS<br />
On a 1-5 scale, with 1 meaning “significant decrease” and 5 meaning “significant increase”<br />
TURBOPROP<br />
LIGHT JET<br />
MIDSIZE JET<br />
LARGE JET+<br />
5<br />
SIGNIFICANT<br />
INCREASE<br />
0%<br />
0%<br />
1%<br />
2%<br />
4<br />
SLIGHT<br />
INCREASE<br />
8% 2% 4%<br />
2%<br />
24% 22%<br />
3<br />
STABLE<br />
40%<br />
35%<br />
2<br />
SLIGHT<br />
DECREASE<br />
52%<br />
63% 64% 64%<br />
1<br />
SIGNIFICANT<br />
DECREASE<br />
0%<br />
0%<br />
7%<br />
11%<br />
PRICING PROJECTIONS OVER THE LAST YEAR, BY QUARTER<br />
All averages fall between 2 (“slight decrease”) and 4 (“slight increase”).<br />
<strong>Q1</strong> '22 <strong>Q1</strong> '22 Q3 '22 Q4 '22 <strong>Q1</strong> '23<br />
4<br />
SLIGHT<br />
INCREASE<br />
TURBOPROP<br />
LIGHT JET<br />
3<br />
STABLE<br />
MIDSIZE JET<br />
2.6<br />
2<br />
SLIGHT<br />
DECREASE<br />
2.4<br />
2.3<br />
2.2<br />
LARGE &<br />
ULTRA - LONG -<br />
RANGE JET<br />
FIRST QUARTER <strong>2023</strong> — GLOBAL SKY QUARTERLY | 43
IADA MARKET REPORT<br />
SUPPLY<br />
SUPPLY PROJECTIONS FOR THE NEXT 6 MONTHS<br />
On a 1-5 scale, with 1 meaning “significant decrease” and 5 meaning “significant increase”<br />
TURBOPROP LIGHT JET MIDSIZE JET LARGE JET+<br />
5<br />
SIGNIFICANT<br />
INCREASE<br />
5%<br />
5%<br />
8%<br />
14%<br />
4<br />
SLIGHT<br />
INCREASE<br />
62% 69% 67% 60%<br />
3<br />
STABLE<br />
27%<br />
23%<br />
19%<br />
22%<br />
2<br />
SLIGHT<br />
DECREASE<br />
6%<br />
4%<br />
5%<br />
2%<br />
1<br />
SIGNIFICANT<br />
DECREASE<br />
0% 0%<br />
2% 2%<br />
PRICING PROJECTIONS OVER THE LAST YEAR, BY QUARTER<br />
All averages fall between 2 (“slight decrease”) and 4 (“slight increase”).<br />
<strong>Q1</strong> '22 <strong>Q1</strong> '22 Q3 '22 Q4 '22 <strong>Q1</strong> '23<br />
4<br />
SLIGHT<br />
INCREASE<br />
3.8<br />
3.8<br />
3.7<br />
3.7<br />
TURBOPROP<br />
LIGHT JET<br />
3<br />
STABLE<br />
MIDSIZE JET<br />
2<br />
SLIGHT<br />
DECREASE<br />
LARGE &<br />
ULTRA - LONG -<br />
RANGE JET<br />
44 | GLOBAL SKY QUARTERLY — FIRST QUARTER <strong>2023</strong>
WILLINGNESS TO INVENTORY PROJECTIONS FOR THE NEXT 6 MONTHS<br />
On a 1-5 scale, with 1 meaning “significant decrease” and 5 meaning “significant increase”<br />
IADA MARKET REPORT<br />
WILLINGNESS TO INVENTORY<br />
TURBOPROP LIGHT JET MIDSIZE JET LARGE JET+<br />
5<br />
SIGNIFICANT<br />
INCREASE<br />
1%<br />
2%<br />
2%<br />
1%<br />
4<br />
SLIGHT<br />
INCREASE<br />
14%<br />
12%<br />
11%<br />
10%<br />
3<br />
STABLE<br />
60% 58% 52% 52%<br />
2<br />
SLIGHT<br />
DECREASE<br />
21%<br />
23%<br />
22%<br />
18%<br />
1<br />
SIGNIFICANT<br />
DECREASE<br />
5%<br />
4%<br />
13%<br />
18%<br />
WILLINGNESS TO INVENTORY PROJECTIONS OVER THE LAST YEAR, BY QUARTER<br />
All averages fall between 2 (“slight decrease”) and 4 (“slight increase”).<br />
<strong>Q1</strong> '22 <strong>Q1</strong> '22 Q3 '22 Q4 '22 <strong>Q1</strong> '23<br />
4<br />
SLIGHT<br />
INCREASE<br />
TURBOPROP<br />
LIGHT JET<br />
3<br />
STABLE<br />
2.9<br />
2.8<br />
2.7<br />
2.6<br />
MIDSIZE JET<br />
2<br />
SLIGHT<br />
DECREASE<br />
LARGE &<br />
ULTRA - LONG -<br />
RANGE JET<br />
FIRST QUARTER <strong>2023</strong> — GLOBAL SKY QUARTERLY | 45
IADA MARKET REPORT<br />
DEMAND<br />
DEMAND PROJECTIONS FOR THE NEXT 6 MONTHS<br />
On a 1-5 scale, with 1 meaning “significant decrease” and 5 meaning “significant increase”<br />
TURBOPROP LIGHT JET MIDSIZE JET LARGE JET+<br />
5<br />
SIGNIFICANT<br />
INCREASE<br />
1%<br />
0% 0% 0%<br />
4<br />
SLIGHT<br />
INCREASE<br />
16%<br />
13%<br />
18% 17%<br />
3<br />
STABLE<br />
58% 54% 50% 45%<br />
2<br />
SLIGHT<br />
DECREASE<br />
24%<br />
33% 26%<br />
30%<br />
1<br />
SIGNIFICANT<br />
DECREASE<br />
1% 1% 6% 7%<br />
DEMAND PROJECTIONS OVER THE LAST YEAR, BY QUARTER<br />
All averages fall between 2 (“slight decrease”) and 4 (“slight increase”).<br />
<strong>Q1</strong> '22 <strong>Q1</strong> '22 Q3 '22 Q4 '22 <strong>Q1</strong> '23<br />
4<br />
SLIGHT<br />
INCREASE<br />
TURBOPROP<br />
LIGHT JET<br />
3<br />
STABLE<br />
2.9<br />
2.8<br />
2.8<br />
2.7<br />
MIDSIZE JET<br />
2<br />
SLIGHT<br />
DECREASE<br />
LARGE &<br />
ULTRA - LONG -<br />
RANGE JET<br />
46 | GLOBAL SKY QUARTERLY — FIRST QUARTER <strong>2023</strong>
IADA MARKET REPORT<br />
MONTHLY ACTIVITY REPORTS<br />
The perspectives and projections from IADA Members for the<br />
IADA Market Report are supported by the monthly transaction/<br />
activity reports submitted by IADA Accredited Dealers through<br />
AircraftExchange. Evidence suggests that overall deal flow in <strong>Q1</strong> <strong>2023</strong><br />
moderated somewhat year-over-year. Closed deals remained above <strong>Q1</strong><br />
2021 levels, reflecting a return to a more balanced marketplace.<br />
Please note that, in addition to sales data from AircraftExchange<br />
listings, the IADA Market Report includes data from all IADA<br />
Accredited Dealer activities and transactions, reported in total.<br />
Herein is a summary of those reports.<br />
IADA DEALER ACTIVITY REPORT<br />
<strong>Q1</strong> <strong>2023</strong> Q4 2022 Q3 2022 Q2 2022 <strong>Q1</strong> 2022<br />
NEW ACQUISITION AGREEMENTS<br />
134<br />
166<br />
169<br />
162<br />
223<br />
166<br />
IN <strong>Q1</strong> <strong>2023</strong><br />
RETAINED TO SELL EXCLUSIVELY<br />
146<br />
155<br />
197<br />
212<br />
210<br />
197<br />
IN <strong>Q1</strong> <strong>2023</strong><br />
LOWERED PRICE<br />
6<br />
52<br />
45<br />
31<br />
22<br />
52<br />
IN <strong>Q1</strong> <strong>2023</strong><br />
FELL APART<br />
53<br />
48<br />
42<br />
40<br />
45<br />
53<br />
IN <strong>Q1</strong> <strong>2023</strong><br />
UNDER CONTRACT<br />
206<br />
227<br />
231<br />
255<br />
259<br />
206<br />
IN <strong>Q1</strong> <strong>2023</strong><br />
CLOSED DEALS<br />
239<br />
331<br />
310<br />
288<br />
470<br />
239<br />
IN <strong>Q1</strong> <strong>2023</strong><br />
0 100 200 300 400 500<br />
FIRST QUARTER <strong>2023</strong> — GLOBAL SKY QUARTERLY | 47
IADA MARKET REPORT<br />
IADA DEALER ACTIVITY YEAR-TO-DATE COMPARISON<br />
<strong>Q1</strong> 2022 YTD<br />
2022 YEAR TOTAL<br />
<strong>Q1</strong> <strong>2023</strong> YTD<br />
NEW ACQUISITION AGREEMENTS<br />
223<br />
166<br />
688<br />
RETAINED TO SELL EXCLUSIVELY<br />
155<br />
197<br />
723<br />
LOWERED PRICE<br />
6<br />
52<br />
104<br />
FELL APART<br />
45 175<br />
53<br />
UNDER CONTRACT<br />
259<br />
206<br />
972<br />
CLOSED DEALS<br />
288 1399<br />
239<br />
TOTAL CLOSED DEALS BY QUARTER<br />
2020 2021 2022<br />
<strong>2023</strong><br />
554<br />
501<br />
470<br />
124<br />
213<br />
288<br />
239<br />
174<br />
316 310<br />
283<br />
340 331<br />
<strong>Q1</strong> Q2 Q3 Q4<br />
48 | GLOBAL SKY QUARTERLY — FIRST QUARTER <strong>2023</strong>
IADA MARKET REPORT<br />
CONCLUDING THOUGHTS<br />
The years 2021 and 2022 will be remembered as a<br />
time when the true value of business aviation was<br />
realized by a growing network of customers eager to<br />
accelerate out of the unprecedented pandemic‐driven<br />
restrictions imposed on their freedom of movement.<br />
In 2021 and then again in 2022, our Accredited<br />
Dealers and Certified Brokers worked feverishly to<br />
meet the surging demand for business aircraft.<br />
After the first quarter of <strong>2023</strong>:<br />
1. There is compelling evidence that demand and<br />
supply forces are rebalancing, with less frenetic<br />
activity, more realistic pricing and a slow but<br />
steady buildup of available inventory.<br />
2. Specific low-time models with attractive<br />
pedigrees will continue to attract customer<br />
interest and top-dollar offers. However, the<br />
overall market has begun to downshift from<br />
its demand-driven peak characterized by<br />
accelerating prices and residual values.<br />
3. Pre-owned inventory levels have begun to<br />
replenish.Most OEMs have grown their order<br />
backlogs to represent more than two years<br />
of production and are working to accelerate<br />
deliveries in the face of slowly recovering<br />
supply chains.<br />
We foresee a continuation of relatively tight market<br />
conditions through <strong>2023</strong>, governed by customers who<br />
will act to purchase desirable aircraft that fulfill their<br />
missions and not wait two or more years to receive<br />
their next aircraft.<br />
With the market in flux, we are confident that buyers<br />
and sellers will continue to recognize the value-add<br />
benefits of engaging an IADA Accredited Dealer and<br />
Certified Broker for their business aircraft needs. We<br />
look forward to their continued success in <strong>2023</strong>.<br />
FIRST QUARTER <strong>2023</strong> — GLOBAL SKY QUARTERLY | 49
50 | GLOBAL SKY QUARTERLY — FIRST QUARTER <strong>2023</strong>
GLOBAL<br />
PRE-OWNED<br />
MARKET UPDATE<br />
Andrew Young, AMSTAT General Manager, said, "While it is clear that there has been a slowing in transaction activity and an increase<br />
in the supply of pre-owned aircraft, these changes are only relative to the activity of the past two years, and in fact pre-owned<br />
transaction activity still remains above historical levels and availability still remains way below historical norms." He added, "That<br />
said, these changes also seem to have been enough to slow, stop, or even reverse the upward trend in values in the last 2-6 months,<br />
depending on the respective market segment."<br />
FIRST QUARTER <strong>2023</strong> — GLOBAL SKY QUARTERLY | 51
GLOBAL PRE-OWNED MARKET UPDATE<br />
Using data derived from the Premier+ service, AMSTAT provides an update on<br />
the pre-owned business aircraft market. While there were fewer transactions<br />
recorded in <strong>Q1</strong> <strong>2023</strong> compared to <strong>Q1</strong> 2021 and 2022, transaction counts in<br />
the first quarter exceeded <strong>Q1</strong> 2019 and 2020. Pre-owned inventory is up but<br />
remains below 10-year average levels. Higher supply and slowing demand are<br />
putting the brakes on the upward trend in values seen over the last two years.<br />
BUSINESS JETS - RESALE RETAIL TRANSACTIONS<br />
2021 2022 <strong>2023</strong><br />
600<br />
500<br />
400<br />
The pre-owned business jets transaction count for <strong>Q1</strong><br />
<strong>2023</strong> was 27% lower than <strong>Q1</strong> 2022, and 20% lower than<br />
<strong>Q1</strong> 2021, but 3% and 10% higher than <strong>Q1</strong> 2020 and 2019<br />
respectively.<br />
300<br />
200<br />
100<br />
0<br />
Jan Feb Mar Apr May Jun Jul Aug Sep Oct Nov Dec<br />
BUSINESS TURBOPROPS - RESALE RETAIL TRANSACTIONS<br />
250<br />
200<br />
2021 2022 <strong>2023</strong><br />
The pre-owned d business turboprop transaction count<br />
for <strong>Q1</strong> <strong>2023</strong> was 31% lower than <strong>Q1</strong> 2022, and 23% lower<br />
than <strong>Q1</strong> 2021, but still 2% higher than <strong>Q1</strong> 2020.<br />
150<br />
100<br />
50<br />
0<br />
Jan Feb Mar Apr May Jun Jul Aug Sep Oct Nov Dec<br />
BUSINESS JETS & TURBOPROPS FOR SALE / LEASE<br />
Jets<br />
Turboprop<br />
The inventory of pre-owned<br />
1,400<br />
business jets for sale is up<br />
62% year-over-year. While this<br />
1,200<br />
change is significant only 5.2%<br />
1,000<br />
of the active fleet is for sale<br />
compared to a 10-year average<br />
800<br />
of 9.3%. The inventory of preowned<br />
turboprops for sale is up<br />
600<br />
28% year-over-year. Today, 3.6%<br />
of the active fleet or turboprops<br />
400<br />
Apr<br />
2022<br />
May Jun Jul Aug Sep Oct Nov Dec Jan<br />
<strong>2023</strong><br />
Feb Mar Apr<br />
is for sale, compared to a 10-<br />
year average of 7.2%.<br />
52 | GLOBAL SKY QUARTERLY — FIRST QUARTER <strong>2023</strong>
GLOBAL PRE-OWNED MARKET UPDATE<br />
HEAVY JETS - SHORT TERM MEDIAN VALUE CHANGE<br />
30%<br />
Increase Decrease Total<br />
20%<br />
10%<br />
0%<br />
-10%<br />
Jan1<br />
Jan15<br />
Feb1<br />
Feb15<br />
Mar1<br />
Mar15<br />
Apr1<br />
Apr15<br />
May1<br />
May15<br />
Jun1<br />
Jun15<br />
Jul1<br />
Jul15<br />
Aug1<br />
Aug15<br />
Sep1<br />
Sep15<br />
Oct1<br />
Oct15<br />
Nov1<br />
Nov15<br />
Dec1<br />
Dec15<br />
Jan1<br />
Jan15<br />
Feb1<br />
Feb15<br />
Mar1<br />
Mar15<br />
Over the past 12 months, the median value of pre-owned Heavy<br />
Jets is up 13%, but year-to-date this metric has declined 1%. The<br />
slowdown in this value metric is due to a slowdown in pre-owned<br />
transaction activity. Resale retail transactions in <strong>Q1</strong> <strong>2023</strong> were<br />
down 14% from <strong>Q1</strong> 2022 and down 3% from <strong>Q1</strong> 2021. However,<br />
<strong>Q1</strong> 2022 still outperformed <strong>Q1</strong> 2020 (+15%) and <strong>Q1</strong> 2019 (+5%).<br />
Pre-owned availability in the Heavy Jet segment is up 14% year-todate<br />
and up 94% year-over-year. However, despite this significant<br />
increase, only 5.3% of active Heavy Jets are for sale, compared to a<br />
10-year average of 8.4%. The pre-owned supply is still much lower<br />
by historical standards.<br />
SUPER-MID JETS - SHORT TERM MEDIAN VALUE CHANGE<br />
50%<br />
Increase Decrease Total<br />
40%<br />
30%<br />
20%<br />
10%<br />
0%<br />
-10%<br />
Jan1<br />
Jan15<br />
Feb1<br />
Feb15<br />
Mar1<br />
Mar15<br />
Apr1<br />
Apr15<br />
May1<br />
May15<br />
Jun1<br />
Jun15<br />
Jul1<br />
Jul15<br />
Aug1<br />
Aug15<br />
Sep1<br />
Sep15<br />
Oct1<br />
Oct15<br />
Nov1<br />
Nov15<br />
Dec1<br />
Dec15<br />
Jan1<br />
Jan15<br />
Feb1<br />
Feb15<br />
Mar1<br />
Mar15<br />
The median value of pre-owned Super-Mid Jets has continued to<br />
steadily increase, up 31% over the last 12-months. The rate of<br />
increase has slowed recently with this metric up only 4% year-to-date.<br />
Super-Mid Jets demand has slowed, with resale retail transactions<br />
in <strong>Q1</strong> <strong>2023</strong> down 29% from <strong>Q1</strong> 2022 and down 6% versus <strong>Q1</strong> 2021.<br />
However <strong>Q1</strong> <strong>2023</strong> transactions were 15% ahead of <strong>Q1</strong> 2019 (as a<br />
pre-covid benchmark). Availability in this market is up 151% yearover-year<br />
and up 11% year-to-date, but with 5% of the fleet for sale,<br />
availability remains well below the 10-year-moving average of 8.2%.<br />
A slowdown in the rate of value increase year-to-date is likely due to<br />
slowing demand and increasing supply in this segment.<br />
FIRST QUARTER <strong>2023</strong> — GLOBAL SKY QUARTERLY | 53
GLOBAL PRE-OWNED MARKET UPDATE<br />
MEDIUM JETS - SHORT TERM MEDIAN VALUE CHANGE<br />
50%<br />
Increase Decrease Total<br />
40%<br />
30%<br />
20%<br />
10%<br />
0%<br />
-10%<br />
Mar15<br />
Mar1<br />
Feb15<br />
Feb1<br />
Jan15<br />
Jan1<br />
Dec15<br />
Dec1<br />
Nov15<br />
Nov1<br />
Oct15<br />
Oct1<br />
Sep15<br />
Sep1<br />
Aug15<br />
Aug1<br />
Jul15<br />
Jul1<br />
Jun15<br />
Jun1<br />
May15<br />
May1<br />
Apr15<br />
Apr1<br />
Mar15<br />
Mar1<br />
Feb15<br />
Feb1<br />
Jan15<br />
Jan1<br />
The median value of pre-owned Medium Jets has risen 17% year-overyear<br />
and is up 9% year-to-date. Pre-owned transaction activity in <strong>Q1</strong><br />
<strong>2023</strong> was 44% off <strong>Q1</strong> 2022 levels and below the <strong>Q1</strong> counts for the last<br />
5 years. Availability in this segment is up 57% year-over-year and up<br />
8% year-to-date. However, with only 4.9% of the active fleet for sale,<br />
this level remains well below the 10% 10-year average for this market<br />
segment.<br />
LIGHT JETS - SHORT TERM MEDIAN VALUE CHANGE<br />
40%<br />
Increase Decrease Total<br />
30%<br />
20%<br />
10%<br />
0%<br />
-10%<br />
Mar15<br />
Mar1<br />
Feb15<br />
Feb1<br />
Jan15<br />
Jan1<br />
Dec15<br />
Dec1<br />
Nov15<br />
Nov1<br />
Oct15<br />
Oct1<br />
Sep15<br />
Sep1<br />
Aug15<br />
Aug1<br />
Jul15<br />
Jul1<br />
Jun15<br />
Jun1<br />
May15<br />
May1<br />
Apr15<br />
Apr1<br />
Mar15<br />
Mar1<br />
Feb15<br />
Feb1<br />
Jan15<br />
Jan1<br />
The median value change in this pre-owned segment has largely<br />
plateaued since mid-2022. Year-over-year, this metric is up 15%<br />
and is up 5% year-to-date. As with other jet segments, resale<br />
transactions activity in this market in <strong>Q1</strong> was lower by 31% than in<br />
<strong>Q1</strong> 2022 and 16% below <strong>Q1</strong> 2021 but still ahead of 2020 and 2019.<br />
Availability in this market is up 4% YTD and 39% year-over-year, but<br />
only 5.4% of the fleet is for sale versus a 10-year average of 10.6%.<br />
54 | GLOBAL SKY QUARTERLY — FIRST QUARTER <strong>2023</strong>
GLOBAL PRE-OWNED MARKET UPDATE<br />
TURBOPROPS - SHORT TERM MEDIAN VALUE CHANGE<br />
30%<br />
Increase Decrease Total<br />
25%<br />
20%<br />
15%<br />
10%<br />
5%<br />
0%<br />
-5%<br />
Jan1<br />
Jan15<br />
Feb1<br />
Feb15<br />
Mar1<br />
Mar15<br />
Apr1<br />
Apr15<br />
May1<br />
May15<br />
Jun1<br />
Jun15<br />
Jul1<br />
Jul15<br />
Aug1<br />
Aug15<br />
Sep1<br />
Sep15<br />
Oct1<br />
Oct15<br />
Nov1<br />
Nov15<br />
Dec1<br />
Dec15<br />
Jan1<br />
Jan15<br />
Feb1<br />
Feb15<br />
Mar1<br />
Mar15<br />
The median value of pre-owned Turboprops has risen 19% year-overyear<br />
but has remained unchanged year-to-date. Unlike most of the<br />
jet segments, <strong>Q1</strong> transaction activity in this segment fell below <strong>Q1</strong><br />
in each of the last 5 years, suggesting some slowdown in pre-owned<br />
demand. The inventory of Turboprops is 17% higher today than a year<br />
ago and up 3% year-to-date, but at 3.6% of the active fleet for sale, still<br />
way below the 7.2% 10-year average of available in this pre-owned<br />
segment.<br />
Data Source: AMSTAT<br />
Commentary by Andrew Young<br />
IMPORTANT NOTE: The chart above uses aggregated data. The changes in values this year within individual make and model markets, and for specific serial numbers, may vary to a greater or<br />
lesser degree from these trends.<br />
FIRST QUARTER <strong>2023</strong> — GLOBAL SKY QUARTERLY | 55
SPONSORED CONTENT<br />
RCA-UMSA MOBILITY FORUM<br />
ANSWERS MANY<br />
AAM QUESTIONS<br />
By Alud Davies<br />
With eVTOLs and drones becoming increasingly more important, the Rotorcraft Asia and Unmanned Systems Asia<br />
(RCA-UMSA) event held recently in Singapore had a Mobility Forum dedicated to discussing the future of both.<br />
Organized in partnership with Global <strong>Sky</strong> Media, the forum discussed the current state of the AAM and drone<br />
markets and looked forward to what we can expect from both in the future.<br />
The forum kicked off with a keynote address from Tan Kah Han, Chief<br />
Technology Officer / Senior Director (Unmanned System Group)<br />
from the Civil Aviation Authority of Singapore (CAAS), who explained<br />
the city-state’s current views on AAM and Drones, as well as how<br />
Singapore will integrate both drones and eVTOLs into Singapore’s<br />
current airspace.<br />
With day one largely focussed on advanced air mobility (AAM),<br />
forum panelists discussed practical applications as well as<br />
regulatory challenges that lie ahead for the sector. During one<br />
panel, that specifically looked into how the AAM sector is funded,<br />
James WANG, Professor MAE Department, and Director of eVTOL<br />
Research & Innovation Centre, Nanyang Technological University<br />
argued that it is likely it is likely to take at least 12 years from the<br />
56 | GLOBAL SKY QUARTERLY — FIRST QUARTER <strong>2023</strong>
SPONSORED CONTENT<br />
initial launch of an eVTOL design for it to be built, certificated,<br />
delivery and finally break even.<br />
This timeline was largely echoed by attendees, who were asked by<br />
Teo Hui Ling, Partner, Reed Smith, who moderated the panel, to give a<br />
show of hands on when they believed that the industry would be able<br />
to commercialize itself, with the overwhelming majority voting for<br />
2035 or later.<br />
Whilst some of the panelists felt that eVTOLs, and in some cases<br />
drones, can replace helicopters on missions including powerline<br />
inspections and some emergency medical missions, it is unlikely that<br />
they will replace large twin-engine helicopters that operate in the oil &<br />
gas sector.<br />
Later in the afternoon, there<br />
were two panels dedicated to<br />
helicopters, with one panel, in<br />
particular, looking at whether<br />
eVTOLs will ever be able to<br />
truly replace helicopters.”<br />
The last session on day one had a look at both sides of the argument,<br />
asking if AAM is just another Pie in the <strong>Sky</strong> Pipedream. It was perhaps<br />
no surprise that both panelists were firmly in the AAM camp. Both<br />
Augustine Tai, Head of Business Development, APAC, Eve Air Mobility,<br />
and Oliver Plogmann, Partner, McKinsey, fought the case for AAM,<br />
arguing that not only are we taking the right steps now, but the sector<br />
is likely to commercialize itself before the 2035 date that attendees<br />
suggested earlier in the day.<br />
Both panelists were also asked if the recent slowdown in investments<br />
into the sector was a sign that investors are starting to feel burnt out,<br />
especially as several AAM companies have recently said that it will<br />
take at least $1 billion to certify their eVTOLs. Whilst acknowledging a<br />
slowdown in investments, Augustine pointed out that the investments<br />
that have been made recently have been larger, with investors<br />
focussing on bigger projects, as well as those that are getting closer<br />
to being certificated.<br />
On Day Two the focus switched from AAM and helicopters, and<br />
more towards drones, and opened with a keynote address by Maran<br />
Paramanathan, Director (Unmanned Systems Policy, Regulations, and<br />
Operations), Civil Aviation Authority of Singapore (CAAS). Following<br />
the keynote, a panel on Drone regulation looked into the key issues<br />
surrounding certification and legal usage of drones before two further<br />
panels about drones closed out the day.<br />
Both of the final two panels were centered on the real-world usage<br />
of drones and their applications. The first looked at drones that were<br />
being used for surveillance, be it in engineering, the energy sector, or<br />
even in border patrol missions.<br />
The final session of the day looked into drones being used in the<br />
logistics industry. With Amazon exploring deliveries by drone, the<br />
panel discussed the feasibility of delivering to dense urban areas but<br />
came to the conclusion that it is likely the drones will be used in some<br />
areas of the distribution chain, but it is unlikely that they will make the<br />
final delivery. The panel did of course make the distinction between<br />
urban and rural deliveries, stating that drones would be perfect for<br />
delivering to out-of-the-way locations.<br />
Overall, the forum brought together many different companies<br />
from across the spectrum of AAM and drones into one space. The<br />
discussions that were had, both on and off the stage raised many<br />
questions but also provided many answers to the questions that<br />
people already had before the event.<br />
www.rca-umsa.com<br />
FIRST QUARTER <strong>2023</strong> — GLOBAL SKY QUARTERLY | 57
Global <strong>Sky</strong> News<br />
Stay informed with your weekly roundup<br />
of all the biggest aviation news delivered<br />
straight to your inbox. Sign up to Global<br />
<strong>Sky</strong> News for curated stories in business<br />
aviation, general aviation, helicopters<br />
and advanced air mobility.<br />
SCAN TO<br />
SIGN UP<br />
www.globalsky.media/newsletter-sign-up
MARKET<br />
DYNAMICS<br />
BUSINESS JET AND<br />
CIVIL HELICOPTER<br />
PRE-OWNED MARKET<br />
<strong>Q1</strong> <strong>2023</strong><br />
FIRST QUARTER <strong>2023</strong> — GLOBAL SKY QUARTERLY | 59
MARKET DYNAMICS: BUSINESS JET<br />
PRE-OWNED BUSINESS JET MARKET <strong>Q1</strong> <strong>2023</strong><br />
Understanding the market dynamics graphs:<br />
The Inventory Value Line represents the number of aircraft actively being marketed for sale. 1<br />
The Signal Line represents an indication of where the market’s direction may be heading in the future.<br />
INVENTORY VALUE (USD) 2<br />
$8,307M<br />
$6,986M<br />
WORLDWIDE<br />
$898M<br />
ASIA-PACIFIC<br />
$412M<br />
MARKET TREND 2 WORLDWIDE<br />
MOVING TOWARDS SELLER’S MARKET<br />
MOVING TOWARDS BUYER’S MARKET<br />
TREND REVERSAL<br />
TREND REVERSAL<br />
AIRCRAFT TRANSACTIONS 2 WORLDWIDE<br />
175<br />
135<br />
120<br />
23<br />
28<br />
42<br />
54<br />
37<br />
60<br />
66<br />
90<br />
44<br />
43<br />
65<br />
70<br />
65<br />
58<br />
67<br />
62<br />
60<br />
80<br />
47<br />
63<br />
44<br />
39<br />
55<br />
75<br />
63<br />
63<br />
65 67<br />
53<br />
48 42<br />
51<br />
39<br />
16<br />
Mar<br />
2020<br />
Apr<br />
May Jun Jul Aug Sep Oct Nov Dec Jan Feb Mar Apr May Jun Jul Aug Sep Oct Nov Dec Jan Feb Mar Apr May Jun Jul Aug Sep Oct Nov Dec Jan Feb Mar<br />
2021<br />
2022<br />
<strong>2023</strong><br />
1 Global <strong>Sky</strong> Media’s Inventory Value line is calculated by taking the total number of aircraft for sale from a selection of 39 different models, multiplied by their average asking prices.<br />
2 Historical inventory value and transactions are subject to change based on latest market information updates.<br />
60 | GLOBAL SKY QUARTERLY — FIRST QUARTER <strong>2023</strong>
MARKET DYNAMICS: BUSINESS JET<br />
WORLDWIDE % OF FLEET SOLD<br />
2.10%<br />
2.00%<br />
1.90%<br />
1.80%<br />
1.70%<br />
1.60%<br />
1.50%<br />
1.40%<br />
1.30%<br />
1.20%<br />
1.10%<br />
1.00%<br />
0.90%<br />
0.80%<br />
0.70%<br />
0.60%<br />
0.50%<br />
0.40%<br />
0.30%<br />
0.20%<br />
Mar<br />
2020<br />
May Jul Sep Nov Jan Mar May Jul Sep Nov Jan Mar May Jul Sep Nov Jan<br />
2021<br />
2022<br />
<strong>2023</strong><br />
AVERAGE ASKING PRICE<br />
Mar<br />
MILLION USD<br />
35<br />
30<br />
25<br />
20<br />
ASIA-PACIFIC<br />
15<br />
WORLDWIDE<br />
10<br />
Mar<br />
2020<br />
% OF FLEET FOR SALE<br />
May Jul Sep Nov Jan Mar May Jul Sep Nov Jan Mar May Jul Sep Nov Jan<br />
2021<br />
2022<br />
<strong>2023</strong><br />
Mar<br />
9%<br />
8%<br />
ASIA-PACIFIC<br />
7%<br />
6%<br />
5%<br />
4%<br />
WORLDWIDE<br />
3%<br />
2%<br />
1%<br />
AVERAGE DAYS ON MARKET<br />
500<br />
450<br />
Mar<br />
2020<br />
May Jul Sep Nov Jan Mar May Jul Sep Nov Jan Mar May Jul Sep Nov Jan<br />
2021<br />
2022<br />
<strong>2023</strong><br />
ASIA-PACIFIC<br />
Mar<br />
400<br />
350<br />
300<br />
250<br />
200<br />
150<br />
100<br />
WORLDWIDE<br />
50<br />
Mar<br />
2020<br />
May Jul Sep Nov Jan Mar May Jul Sep Nov Jan Mar May Jul Sep Nov Jan<br />
2021<br />
2022<br />
<strong>2023</strong><br />
Mar<br />
FIRST QUARTER <strong>2023</strong> — GLOBAL SKY QUARTERLY | 61
MARKET DYNAMICS: BUSINESS JET<br />
SUPPLY / DEMAND INDICATORS<br />
BUSINESS JETS<br />
SUPPLY VS. DEMAND RATIO<br />
AVERAGE DAYS ON MARKET<br />
SUPPLY<br />
> DEMAND<br />
DAYS ON MARKET<br />
AVERAGE<br />
% OF FLEET<br />
FOR SALE<br />
MODEL<br />
AVERAGE<br />
NO TRANSACTION<br />
NO TRANSACTION<br />
NO TRANSACTION<br />
NO TRANSACTION<br />
NO TRANSACTION<br />
450% 400% 350% 300% 250% 200% 150% 100% 50% 0<br />
Average AC for sale / Total sold in last 12 months<br />
11.1%<br />
1.4%<br />
3.8%<br />
5.2%<br />
4.3%<br />
4.0%<br />
2.5%<br />
8.3%<br />
5.6%<br />
1.5%<br />
5.6%<br />
12.3%<br />
5.6%<br />
8.6%<br />
4.0%<br />
3.1%<br />
2.3%<br />
1.5%<br />
4.0%<br />
5.5%<br />
2.3%<br />
0.0%<br />
0.0%<br />
3.3%<br />
3.7%<br />
3.7%<br />
ACJ318<br />
ACJ319<br />
ACJ320<br />
BBJ<br />
BBJ2<br />
CL300<br />
CL350<br />
CL604<br />
CL605<br />
CL650<br />
CL850<br />
GL Express<br />
GL XRS<br />
GL5000<br />
GL6000<br />
CIT. CJ3<br />
CIT. CJ4<br />
CIT. Latitude<br />
CIT. Sovereign<br />
F2000LX<br />
F2000LXS<br />
F2000S<br />
3.7% F7X<br />
3.4%<br />
4.3%<br />
F8X<br />
F900DX<br />
6.7% F900EX<br />
3.4%<br />
2.6%<br />
8.8%<br />
3.6%<br />
4.0%<br />
10.0%<br />
5.4%<br />
4.5%<br />
2.7%<br />
4.1%<br />
Average<br />
F900EXe<br />
F900LX<br />
L1000<br />
L600<br />
L650<br />
Phenom 300<br />
G200<br />
G280<br />
G450<br />
G500<br />
G550<br />
G650<br />
G650ER<br />
0 200 400 600 800 1000<br />
The above chart reflects where certain aircraft models are positioned<br />
in terms of supply and demand (based on a ratio of completed<br />
transactions compared to the number of sellers and the average<br />
number of days on the market for a transaction to take place).<br />
These indications do not necessarily mean that prices will be higher<br />
in the future, but it does indicate that sellers of these particular<br />
models are more likely to find willing buyers in a shorter period of<br />
time than on average.<br />
For some model types, given the market indicators shown on the<br />
previous page, the stabilization in pre-owned asking prices and decline<br />
in inventory level appear to have stimulated increased demand,<br />
leading to an increase in transactions and a more balanced state of<br />
supply and demand.<br />
This can be seen the most with certain Gulfstream (G550 and G650),<br />
Bombardier Challenger and Global models, as well as Dassault Falcon<br />
models (2000 Series and 7X), where more transactions are occurring<br />
relative to the number for sale, and transactions are requiring less time<br />
on the market for sellers to complete.<br />
62 | GLOBAL SKY QUARTERLY — FIRST QUARTER <strong>2023</strong>
MARKET DYNAMICS: BUSINESS JET<br />
MARKET POSITIONING<br />
BUSINESS JETS<br />
INCREASED SUPPLY<br />
Balanced<br />
Supply & Demand<br />
INCREASED DEMAND<br />
ACJ318<br />
ACJ319<br />
ACJ320<br />
BBJ<br />
BBJ 2<br />
CL300<br />
CL350<br />
CL604<br />
CL605<br />
CL650<br />
CL850<br />
GL Express<br />
GL XRS<br />
GL5000<br />
GL6000<br />
CIT. CJ3<br />
CIT. CJ4<br />
CIT. Latitude<br />
CIT. Sovereign<br />
F2000LX<br />
F2000LXS<br />
F2000S<br />
F7X<br />
F8X<br />
F900DX<br />
F900EX<br />
F900EX EASy<br />
F900LX<br />
L1000<br />
L600<br />
L650<br />
Phenom 300<br />
G200<br />
G280<br />
G450<br />
G500<br />
G550<br />
G650<br />
G650ER<br />
The above chart provides a visual representation of the supply /<br />
demand ratio of each aircraft model relative to the overall market,<br />
and is based on a "Marketability" calculation for each particular<br />
model including the following four market indicators:<br />
When taking into account these four factors, the supply of most<br />
models in pre-owned market continues to increase. We may see<br />
the global pre-owned market move further towards a buyer’s<br />
market in <strong>2023</strong>.<br />
1. The percentage of aircraft for sale relative to its fleet size.<br />
2. The number of aircraft sold relative to the average number for sale.<br />
3. The average days for sale relative to the overall market average.<br />
4. The momentum of the marketplace (represented by the trend<br />
towards supply and demand market equilibrium portrayed earlier).<br />
FIRST QUARTER <strong>2023</strong> — GLOBAL SKY QUARTERLY | 63
MARKET DYNAMICS: CIVIL HELICOPTERS<br />
PRE-OWNED HELICOPTERS MARKET <strong>Q1</strong> <strong>2023</strong><br />
Understanding the market dynamics graphs:<br />
The Inventory Value Line represents the number of aircraft actively being marketed for sale. 1<br />
The Signal Line represents an indication of where the market’s direction may be heading in the future.<br />
INVENTORY VALUE (USD) 2<br />
$1,089M<br />
WORLDWIDE<br />
$966M<br />
ASIA-PACIFIC<br />
$186M<br />
$74M<br />
MARKET TREND 2 WORLDWIDE<br />
MOVING TOWARDS SELLER’S MARKET<br />
MOVING TOWARDS BUYER’S MARKET<br />
TREND IMPROVEMENT<br />
AIRCRAFT TRANSACTIONS 2,3 WORLDWIDE<br />
35<br />
29<br />
22<br />
14<br />
28<br />
33<br />
29<br />
37<br />
30<br />
37<br />
34<br />
43<br />
60<br />
54<br />
34<br />
58<br />
37<br />
18<br />
48<br />
40<br />
61<br />
37<br />
39<br />
30<br />
50<br />
54<br />
41<br />
35<br />
38<br />
39<br />
42<br />
45 47<br />
44<br />
46<br />
34<br />
17<br />
Mar<br />
2020<br />
Apr<br />
May Jun Jul Aug Sep Oct Nov Dec Jan Feb Mar Apr May Jun Jul Aug Sep Oct Nov Dec Jan Feb Mar Apr May Jun Jul Aug Sep Oct Nov Dec Jan Feb Mar<br />
2021<br />
2022<br />
<strong>2023</strong><br />
1 Global <strong>Sky</strong> Media’s Inventory Value line is calculated by taking the total number of aircraft for sale from a selection of 39 different models, multiplied by their average asking prices.<br />
2 Historical inventory value and transactions are subject to change based on latest market information updates.<br />
64 | GLOBAL SKY QUARTERLY — FIRST QUARTER <strong>2023</strong>
MARKET DYNAMICS: CIVIL HELICOPTERS<br />
% OF AIRCRAFT SOLD / TOTAL AIRCRAFT IN OPERATION<br />
0.60%<br />
0.50%<br />
0.40%<br />
0.30%<br />
0.20%<br />
0.10%<br />
0.00%<br />
Mar<br />
2020<br />
May Jul Sep Nov Jan Mar May Jul Sep Nov Jan Mar May Jul Sep Nov Jan<br />
2021<br />
2022<br />
<strong>2023</strong><br />
AVERAGE ASKING PRICE<br />
Mar<br />
MILLION USD<br />
3.8<br />
3.6<br />
3.4<br />
3.2<br />
3.0<br />
2.8<br />
2.6<br />
2.4<br />
2.2<br />
ASIA-PACIFIC<br />
WORLDWIDE<br />
2.0<br />
Mar<br />
2020<br />
May Jul Sep Nov Jan Mar May Jul Sep Nov Jan Mar May Jul Sep Nov Jan<br />
2021<br />
2022<br />
<strong>2023</strong><br />
Mar<br />
% OF AIRCRAFT FOR SALE<br />
5.0%<br />
4.5%<br />
WORLDWIDE<br />
4.0%<br />
3.5%<br />
ASIA-PACIFIC<br />
3.0%<br />
2.5%<br />
2.0%<br />
1.5%<br />
AVERAGE DAYS ON MARKET<br />
750<br />
700<br />
Mar<br />
2020<br />
May Jul Sep Nov Jan Mar May Jul Sep Nov Jan Mar May Jul Sep Nov Jan<br />
2021<br />
2022<br />
<strong>2023</strong><br />
ASIA-PACIFIC<br />
Mar<br />
650<br />
600<br />
WORLDWIDE<br />
550<br />
500<br />
450<br />
400<br />
350<br />
Mar<br />
2020<br />
May Jul Sep Nov Jan Mar May Jul Sep Nov Jan Mar May Jul Sep Nov Jan<br />
2021<br />
2022<br />
<strong>2023</strong><br />
Mar<br />
FIRST QUARTER <strong>2023</strong> — GLOBAL SKY QUARTERLY | 65
MARKET DYNAMICS: CIVIL HELICOPTERS<br />
SUPPLY / DEMAND INDICATORS<br />
HELICOPTERS<br />
SUPPLY VS. DEMAND RATIO<br />
SUPPLY / DEMAND INDICATORS<br />
SUPPLY<br />
> DEMAND<br />
DAYS ON MARKET<br />
AVERAGE<br />
% FOR SALE MODEL<br />
AVERAGE<br />
0.9%<br />
EC145<br />
2.0%<br />
H125<br />
3.9%<br />
H130<br />
1.7%<br />
H145<br />
6.4%<br />
H155<br />
1.9%<br />
EC135P2<br />
0.7%<br />
EC135T2<br />
5.1%<br />
EC155B<br />
2.6%<br />
3.0%<br />
BELL<br />
206JETRANGER<br />
BELL<br />
206LONGRANGER<br />
1.9%<br />
BELL 407<br />
2.6%<br />
BELL 412EP<br />
2.0%<br />
BELL 412HP<br />
1.8%<br />
BELL 429<br />
5.4%<br />
AW109SP GN<br />
3.2%<br />
AW139<br />
4.9%<br />
S76C+<br />
350% 300% 250% 200% 150% 100% 50% 0 2.48%<br />
0 100 200 300 400 500 600 700 800<br />
Average<br />
Average AC for sale / Total sold in last 12 months<br />
Average Days for Sale on Market<br />
The above chart reflects where certain aircraft models are positioned<br />
in terms of supply and demand (based on a ratio of completed<br />
transactions compared to the number of sellers, and average number<br />
of days on the market for a transaction to take place).<br />
66 | GLOBAL SKY QUARTERLY — FIRST QUARTER <strong>2023</strong>
MARKET DYNAMICS: CIVIL HELICOPTERS<br />
MARKET POSITIONING<br />
HELICOPTERS<br />
INCREASED SUPPLY<br />
Balanced<br />
Supply & Demand<br />
INCREASED DEMAND<br />
EC145<br />
H125<br />
H130<br />
H145<br />
H155<br />
EC135P2<br />
EC135T2<br />
EC155B<br />
BELL 206JETRANGER<br />
BELL 206LONGRANGER<br />
BELL 407<br />
BELL 412EP<br />
BELL 412HP<br />
BELL 429<br />
AW109SP GN<br />
AW139<br />
S76C+<br />
The above chart provides a visual representation of the supply / demand ratio of each aircraft model relative to the overall market,<br />
resulting in a "Marketability" calculation of each particular model based on the following four market indicators:<br />
1. The percentage of aircraft for sale relative to its fleet size.<br />
2. The number of aircraft sold relative to the average number for sale.<br />
3. The average days for sale relative to the overall market average.<br />
4. The momentum of the marketplace (represented by the trend towards supply and demand market equilibrium portrayed earlier).<br />
FIRST QUARTER <strong>2023</strong> — GLOBAL SKY QUARTERLY | 67
REASONS TO<br />
CHOOSE ASIAN SKY GROUP<br />
AN INTERNATIONAL AIRCRAFT DEALERS ASSOCIATION (IADA) MEMBER<br />
01<br />
02<br />
03<br />
CHOOSE AN ACCREDITED AIRCRAFT DEALER<br />
<strong>Asian</strong> <strong>Sky</strong> Group is an International Aircraft Dealers<br />
Association (IADA) Accredited Dealer, regulated by<br />
independent accreditation, ensuring strict compliance<br />
with IADA’s 14-point Code of Ethics. With headquarters<br />
in Hong Kong and offices around Asia, we are uniquely<br />
qualified to advise & manage aircraft transactions in<br />
Asia.<br />
CHOOSE A TEAM OF CERTIFIED AIRCRAFT BROKERS<br />
<strong>Asian</strong> <strong>Sky</strong> Group’s team of IADA Certified Brokers each<br />
passed a written test administered by an independent<br />
consulting firm. IADA Certified Brokers are required to<br />
participate in regular continuing education and be<br />
re-certified every 5 years.<br />
CHOOSE A PARTNER WITH A PROVEN HISTORY OF SUCCESS<br />
IADA aircraft dealers are responsible for 40% of the<br />
world’s pre-owned sales. IADA Accredited Dealers buy<br />
and sell more aircraft by dollar volume than the rest of<br />
the world’s dealers combined, averaging over 700<br />
transactions and $6 Billion in volume per year. <strong>Asian</strong><br />
<strong>Sky</strong> Group is the only IADA member in Asia.<br />
04<br />
05<br />
CHOOSE A PARTNER THAT CAN ACCESS THE MOST<br />
EXCLUSIVE AND TRUSTED GLOBAL MARKETPLACE<br />
<strong>Asian</strong> <strong>Sky</strong> Group lists and sources aircraft from an<br />
exclusive global online marketplace. AircraftExchange.com<br />
is the exclusive online marketplace of<br />
IADA and is the industry’s most trusted source for the<br />
sale or lease of aircraft. IADA’s robust listing verification<br />
process ensures aircraft advertised are truly<br />
available for sale.<br />
CHOOSE A PARTNER THAT CAN ACCESS BEST-IN-<br />
CLASS PRODUCTS AND SERVICE PROVIDERS<br />
<strong>Asian</strong> <strong>Sky</strong> Group has exclusive access to IADA-verified<br />
products and service members. These members are<br />
industry leaders in their respective fields, including<br />
escrow, legal, financial services, maintenance and<br />
refurbishment, aircraft management and operation, and<br />
over 15 other specialties.<br />
DISCRETION<br />
EXPERIENCE<br />
TRANSPARENCY<br />
PROFESSIONALISM<br />
ACCESS<br />
GLOBAL NETWORK<br />
68 | GLOBAL SKY QUARTERLY — FIRST QUARTER <strong>2023</strong><br />
sales@asianskygroup.com
MARKET<br />
SUMMARY<br />
BUSINESS JETS<br />
<strong>Q1</strong> <strong>2023</strong><br />
FIRST QUARTER <strong>2023</strong> — GLOBAL SKY QUARTERLY | 69
MARKET SUMMARY: BUSINESS JETS<br />
AIRCRAFT POSITIONING<br />
ANNUAL OPERATING COST VS. CABIN VOLUME<br />
10<br />
9<br />
8<br />
CORP. AIRLINER<br />
LONG RANGE<br />
LARGE<br />
MEDIUM<br />
LIGHT<br />
VERY LIGHT<br />
BBJ MAX 7<br />
BBJ (2018)<br />
ACJ318 (2013)<br />
ACJ321 (2018)<br />
ACJ320 (2018)<br />
BBJ3 (2015)<br />
BBJ MAX 8 BBJ2 (2016)<br />
ACJ319 (2015)<br />
BBJ MAX 9<br />
ACJ320 NEO<br />
ACJ319 NEO<br />
ANNUAL OPERATING COST (MILLION USD)<br />
7<br />
6<br />
5<br />
4<br />
3<br />
2<br />
F50EX (2007)<br />
H4000 (2012)<br />
CIT. X+ (2018)<br />
CL3500 & CL350 (2021)<br />
CIT. X (2012)<br />
PRAETOR 600<br />
LINEAGE 1000E (2019)<br />
H850XP (2009)<br />
CIT. VII (2000)<br />
CIT. SOVEREIGN (2013)<br />
L45XR (2012)<br />
CIT. LATITUDE<br />
H800XP (2005)<br />
LEGACY 450 (2019) & PRAETOR 500<br />
L40XR (2012)<br />
CIT. SOVEREIGN+ (2021)<br />
G100 (2006)<br />
L75 (2021)<br />
H900XP (2012) & H800 (1995)<br />
G150 (2016)<br />
ASTRA SP (1995)<br />
L60XR (2013)<br />
L70 (2019)<br />
CIT. EXCEL (2004)<br />
CIT. XLS (2009)<br />
CIT. ULTRA (1999)<br />
CIT. XLS+<br />
H400XP (2010)<br />
CIT. ENCORE+ (2009)<br />
H400XPR (2018)<br />
CIT. ENCORE (2006)<br />
CIT. BRAVO (2006)<br />
PHENOM 300 (2020)<br />
CIT. CJ4 (2020)<br />
PHENOM 300E<br />
CIT. CJ4 GEN 2 NEXTANT 400XTI (2008)<br />
PC-24<br />
PREMIER IA (2012)<br />
CIT. CJ3 (2014)<br />
CIT. CJ1+ (2011)<br />
CIT. CJ2+ (2014)<br />
CIT. CJ1 (2005)<br />
CIT. M2<br />
F900EX (2003)<br />
F2000 (2007)<br />
CL604 (2007)<br />
GLOBAL EXPRESS XRS (2012)<br />
GLOBAL EXPRESS (2005)<br />
GLOBAL 5000<br />
G-V (2002) & G550 (2020)<br />
GLOBAL 5500<br />
F8X<br />
F7X<br />
CIT. CJ3+<br />
CIT. CJ2 (2006)<br />
F900LX<br />
CL650<br />
CL605 (2015)<br />
G650<br />
GLOBAL 7500<br />
GLOBAL 6000<br />
G650ER (2021)<br />
G600<br />
G500<br />
G350 (2012)<br />
G450 (2017)<br />
G300 (2004)<br />
G-IVSP (2002)<br />
G-IV (1992)<br />
LEGACY 650E (2019) & LEGACY 650 (2019)<br />
CL850 (2012) LEGACY 600 (2015)<br />
F900EX EASY (2010)<br />
F2000EX (2004) & F2000DX (2010)<br />
F2000LX (2013)<br />
F2000LXS & F2000S (2021)<br />
CL300 (2014)<br />
G280<br />
G200 (2011)<br />
CIT. LONGITUDE<br />
LEGACY 500 (2020)<br />
HONDAJET (2018)<br />
PHENOM 100E (2017)<br />
CIT. MUSTANG (2017)<br />
ECLIPSE 550 (2015)<br />
1<br />
VISION SF50 (2021)<br />
VISION SF50 G2<br />
200<br />
*Using Conklin & de Decker Asia-Pacific figures. Annual Operating Cost consist of Yearly Fixed Cost and Variable Cost under the assumption of 400 hours flight hours per year.<br />
(*Year) - Year aircraft model ceased production.<br />
500<br />
1,000<br />
MAXIMUM CABIN VOLUME (CU FT)<br />
2,000<br />
3,000<br />
4,000<br />
5,000<br />
6,000<br />
7,000<br />
8,000<br />
9,000<br />
10,000<br />
70 | GLOBAL SKY QUARTERLY — FIRST QUARTER <strong>2023</strong>
AIRCRAFT POSITIONING<br />
ANNUAL OPERATING COST VS. MAX RANGE<br />
OPERATING COST (MILLION USD)<br />
10<br />
9<br />
8<br />
7<br />
6<br />
5<br />
4<br />
3<br />
2<br />
CIT. CJ1 (2005)<br />
CIT. CJ1+ (2011)<br />
CORP. AIRLINER<br />
LONG RANGE<br />
LARGE<br />
MEDIUM<br />
LIGHT<br />
VERY LIGHT<br />
L45XR (2012)<br />
L75 (2021)<br />
CIT. VII (2000)<br />
CIT. EXCEL (2004)<br />
CIT. ULTRA (1999)<br />
H400XP (2010)<br />
CIT. BRAVO (2006)<br />
H400XPR (2018)<br />
NEXTANT 400XTI (2008)<br />
PREMIER IA (2012)<br />
CIT. M2<br />
L40XR (2012)<br />
L70 (2019)<br />
CIT. CJ2+ (2014)<br />
CIT. CJ2 (2006)<br />
L60XR (2013)<br />
ACJ319 (2015)<br />
GLOBAL EXPRESS XRS (2012)<br />
GLOBAL EXPRESS (2005)<br />
GLOBAL 6000<br />
GLOBAL 5000<br />
G-V(2002)<br />
GLOBAL 5500<br />
G450 (2017)<br />
G350 (2012)<br />
LEGACY 650E (2019) & LEGACY 650 (2019)<br />
G300 (2004)<br />
CL604 (2007)<br />
F2000EX (2004)<br />
LEGACY 600 (2015) F2000DX (2010)<br />
F2000 (2007)<br />
F50EX (2007) CL850 (2012)<br />
CIT. X+ (2018)<br />
H4000 (2012) CIT. X (2012)<br />
CL3500 & CL350 (2021) CL300 (2014)<br />
G280<br />
G200 (2011)<br />
CIT. LONGITUDE<br />
LEGACY 500 (2020)<br />
BBJ3 (2015)<br />
ACJ321 (2018)<br />
BBJ2 (2016)<br />
ACJ320 NEO<br />
BBJ (2018)<br />
LINEAGE 1000E (2019)<br />
CIT. XLS+<br />
CIT. XLS (2009)<br />
CIT. ENCORE (2006)<br />
CIT. ENCORE+ (2009)<br />
PHENOM 300 (2020)<br />
PHENOM 300E<br />
CIT. CJ4 GEN 2<br />
PC-24<br />
CIT. CJ3+<br />
CIT. CJ3 (2014)<br />
G500<br />
CIT. CJ4 (2020)<br />
MARKET SUMMARY: BUSINESS JETS<br />
GLOBAL 7500<br />
G650ER (2021)<br />
G-IVSP (2002)<br />
G-IV (1992)<br />
F900EX (2003)<br />
F900LX<br />
F900EX EASY (2010)<br />
CL650<br />
F2000LX (2013)<br />
CL605 (2015)<br />
F2000S (2021)<br />
F2000LXS<br />
PRAETOR 600<br />
H800XP (2005)<br />
H850XP (2009)<br />
CIT. LATITUDE<br />
LEGACY 450 (2019)<br />
CIT. SOVEREIGN (2013)<br />
CIT. SOVEREIGN+ (2021)<br />
PRAETOR 500<br />
H900XP (2012)<br />
H800 (1995)<br />
G150 (2016)<br />
G100 (2006)<br />
ASTRA SP (1995)<br />
ACJ320 (2018)<br />
BBJ MAX 9<br />
BBJ MAX 8<br />
BBJ MAX 7<br />
ACJ319 NEO<br />
ACJ318 (2013)<br />
G650<br />
G550 (2020)<br />
G600<br />
F8X<br />
F7X<br />
PHENOM 100E (2017)<br />
HONDAJET (2018)<br />
CIT. MUSTANG (2017)<br />
ECLIPSE 550 (2015)<br />
1<br />
VISION SF50 G2<br />
VISION SF50 (2021)<br />
1,000<br />
Max Range data source: Conklin & de Decker, this has adopted NBAA IFR rules and under Long Range Cruise Speed with maximum fuel on board, and four passengers with fuel reserve calculation<br />
for a 200 NM (365 Km) alternate.<br />
Some aircraft can be fitted with auxiliary fuel tanks, however we have used the baseline configuration for each aircraft type.<br />
2,000<br />
MAXIMUM CRUISE RANGE(NM)<br />
3,000<br />
4,000<br />
5,000<br />
6,000<br />
7,000<br />
8,000<br />
9,000<br />
FIRST QUARTER <strong>2023</strong> — GLOBAL SKY QUARTERLY | 71
MARKET SUMMARY: BUSINESS JETS<br />
MARKET SUMMARY PER MODEL<br />
INVENTORY LEVEL, PRICE TREND & TRANSACTIONS<br />
ACJ318, ACJ319 & ACJ320<br />
PERFORMANCE<br />
Max Range<br />
Max Speed<br />
Typ. Passengers<br />
ACJ318<br />
4,253 N.M. / 7,877 km<br />
Mach 0.82<br />
19<br />
ACJ319<br />
6,000 N.M. / 11,112 km<br />
Mach 0.82<br />
19<br />
ACJ320<br />
5,250 N.M. / 9,723 km<br />
Mach 0.82<br />
19<br />
SUPPLY<br />
No. for Sale<br />
Avg Asking Price<br />
Avg Days on Market<br />
Mar<br />
2 (11.1%)<br />
25.0M USD<br />
271<br />
Dec<br />
2 (11.1%)<br />
25.0M USD<br />
181<br />
Mar<br />
1 (1.4%)<br />
39.5M USD<br />
157<br />
Dec<br />
2 (2.8%)<br />
45.0M USD<br />
252<br />
Mar<br />
1 (3.8%)<br />
39.5M USD<br />
1,692<br />
Dec<br />
1 (4.8%)<br />
39.5M USD<br />
1,602<br />
TRANSACTION<br />
Past 12 Months<br />
Past 3 Months<br />
Mar<br />
0<br />
0<br />
Dec<br />
0<br />
0<br />
Mar<br />
2<br />
0<br />
Dec<br />
2<br />
1<br />
Mar<br />
1<br />
0<br />
Dec<br />
1<br />
0<br />
Average Asking Price (Million USD)<br />
ACJ318<br />
ACJ320<br />
ACJ319<br />
Average<br />
$45.0<br />
$39.5<br />
$39.5<br />
$39.5 $39.5 $39.5 $39.5<br />
$39.5<br />
$39.5 $39.5 $39.5<br />
$39.5<br />
$39.5<br />
$29.8<br />
$26.5 $26.5 $26.5<br />
$22.0<br />
$25.0 $25.0<br />
$23.5<br />
For Sale vs. Sold<br />
Sold For Sale<br />
1<br />
1<br />
1<br />
1<br />
1<br />
7 6 6 5 5 5 5 6 6 6 5 6 5 5 6 8 9 8 7 6 5 5 4 4 4<br />
Mar May Jul Sep Nov Jan Mar May Jul Sep Nov Jan Mar<br />
2021 2022 <strong>2023</strong><br />
Market Indicators (vs. Last Quarter)<br />
ACJ318<br />
Transaction Level (Past 12 Months)<br />
Inventory Level<br />
Average Asking Price<br />
Average Days on Market<br />
ACJ319<br />
Transaction Level (Past 12 Months)<br />
Inventory Level<br />
Average Asking Price<br />
Average Days on Market<br />
ACJ320<br />
Transaction Level (Past 12 Months)<br />
Inventory Level<br />
Average Asking Price<br />
Average Days on Market<br />
Source: AMSTAT & ASG<br />
72 | GLOBAL SKY QUARTERLY — FIRST QUARTER <strong>2023</strong>
MARKET SUMMARY: BUSINESS JETS<br />
BBJ & BBJ2<br />
PERFORMANCE<br />
Max Range<br />
Max Speed<br />
Typ. Passengers<br />
BBJ<br />
6,235 N.M. / 11,547 km<br />
Mach 0.82<br />
19<br />
BBJ2<br />
5,620 N.M. / 10,408 km<br />
Mach 0.82<br />
19<br />
SUPPLY<br />
No. for Sale<br />
Avg Asking Price<br />
Avg Days on Market<br />
Mar<br />
7 (5.2%)<br />
28.0M USD<br />
258<br />
Dec<br />
7 (5.4%)<br />
23.0M USD<br />
210<br />
Mar<br />
1 (4.3%)<br />
32.0M USD<br />
95<br />
Dec<br />
1 (4.8%)<br />
32.0M USD<br />
5<br />
TRANSACTION<br />
Past 12 Months<br />
Past 3 Months<br />
Mar<br />
7<br />
2<br />
Dec<br />
8<br />
1<br />
Mar<br />
2<br />
0<br />
Dec<br />
2<br />
0<br />
Average Asking Price (Million USD)<br />
BBJ2<br />
Market Indicators (vs. Last Quarter)<br />
$59.5<br />
BBJ<br />
Average<br />
BBJ<br />
$29.0 $29.0<br />
$38.0<br />
$33.5<br />
$32.0<br />
Transaction Level (Past 12 Months)<br />
Inventory Level<br />
$25.3<br />
$15.5 $15.5<br />
$29.0<br />
$29.0<br />
$23.0<br />
$28.0<br />
Average Asking Price<br />
Average Days on Market<br />
For Sale vs. Sold<br />
Sold For Sale<br />
2 4<br />
1<br />
2<br />
1 2 1<br />
2<br />
1<br />
1<br />
1<br />
1<br />
10 9 9 9 11 11 11 11 12 11 9 10 9 10 10 10 7 7 8 6 5 8 9 8 8<br />
Mar May Jul Sep Nov Jan Mar May Jul Sep Nov Jan Mar<br />
2021 2022 <strong>2023</strong><br />
FEATURED AIRCRAFT<br />
BBJ2<br />
Transaction Level (Past 12 Months)<br />
Inventory Level<br />
Average Asking Price<br />
Average Days on Market<br />
Source: AMSTAT & ASG<br />
BBJ MAX8<br />
TOTAL HOURS: DELIVERY HOURS<br />
• Green Delivery<br />
• Delivered Dec 2020<br />
• Valid Trasferable OEM Warranty<br />
• FAA N-registered<br />
• Located in the U.S.<br />
• 7 Auxiliary Fuel Tanks Installed<br />
• FAA Type Certificate and Certificate of Airworthiness<br />
• Valuable Goods, Services & Additional Training Credit<br />
FIRST QUARTER <strong>2023</strong> — GLOBAL SKY QUARTERLY | 73
MARKET SUMMARY: BUSINESS JETS<br />
CHALLENGER 300 & 350<br />
PERFORMANCE<br />
Max Range<br />
Max Speed<br />
Typ. Passengers<br />
CL300<br />
3,340 N.M. / 6,185 km<br />
Mach 0.82<br />
19<br />
CL350<br />
3,421 N.M. / 6,335 km<br />
Mach 0.82<br />
19<br />
SUPPLY<br />
No. for Sale<br />
Avg Asking Price<br />
Avg Days on Market<br />
Mar<br />
18 (4.0%)<br />
13.1M USD<br />
148<br />
Dec<br />
13 (2.9%)<br />
13.6M USD<br />
134<br />
Mar<br />
11 (2.5%)<br />
20.9M USD<br />
79<br />
Dec<br />
7 (1.6%)<br />
21.1M USD<br />
38<br />
TRANSACTION<br />
Past 12 Months<br />
Past 3 Months<br />
Mar<br />
41<br />
6<br />
Dec<br />
39<br />
12<br />
Mar<br />
24<br />
2<br />
Dec<br />
25<br />
8<br />
Average Asking Price (Million USD)<br />
CL350<br />
CL300<br />
Average<br />
$20.5<br />
$20.9<br />
$19.3<br />
$15.7<br />
$16.5 $16.9<br />
$12.4 $13.7 $13.6 $13.1<br />
$9.8<br />
$8.3 $8.9<br />
Market Indicators (vs. Last Quarter)<br />
CL300<br />
Transaction Level (Past 12 Months)<br />
Inventory Level<br />
Average Asking Price<br />
Average Days on Market<br />
For Sale vs. Sold<br />
Sold For Sale<br />
9<br />
13<br />
4<br />
9<br />
3 3<br />
5<br />
8<br />
6<br />
3<br />
2<br />
6 8<br />
6<br />
6<br />
1<br />
2<br />
5<br />
4<br />
6<br />
2 8 1<br />
2 2<br />
25 21 23 17 14 14 8 7 3 4 5 11 12 11 16 21 23 23 21 15 20 20 24 28 29<br />
Mar May Jul Sep Nov Jan Mar May Jul Sep Nov Jan Mar<br />
2021 2022 <strong>2023</strong><br />
CL350<br />
Transaction Level (Past 12 Months)<br />
Inventory Level<br />
Average Asking Price<br />
Average Days on Market<br />
Source: AMSTAT & ASG<br />
74 | GLOBAL SKY QUARTERLY — FIRST QUARTER <strong>2023</strong>
MARKET SUMMARY: BUSINESS JETS<br />
CHALLENGER 604, 605 & 650<br />
PERFORMANCE<br />
Max Range<br />
Max Speed<br />
Typ. Passengers<br />
CL604<br />
4,027 N.M. / 7,458 km<br />
Mach 0.82<br />
9<br />
CL605<br />
4,123 N.M. / 7,635 km<br />
Mach 0.82<br />
9<br />
CL650<br />
4,123 N.M. / 7,635 km<br />
Mach 0.82<br />
10<br />
SUPPLY<br />
No. for Sale<br />
Avg Asking Price<br />
Avg Days on Market<br />
Mar<br />
29 (8.3%)<br />
7.9M USD<br />
173<br />
Dec<br />
26 (7.4%)<br />
8.0M USD<br />
111<br />
Mar<br />
16 (5.6%)<br />
15.1M USD<br />
136<br />
Dec<br />
10 (3.5%)<br />
15.1M USD<br />
143<br />
Mar<br />
2 (1.5%)<br />
24.5M USD<br />
87<br />
Dec<br />
2 (1.5%)<br />
28.0M USD<br />
65<br />
TRANSACTION<br />
Past 12 Months<br />
Past 3 Months<br />
Mar<br />
36<br />
5<br />
Dec<br />
43<br />
10<br />
Mar<br />
28<br />
3<br />
Dec<br />
29<br />
7<br />
Mar<br />
13<br />
2<br />
Dec<br />
19<br />
3<br />
Average Asking Price (Million USD)<br />
$16.5<br />
$8.1<br />
$4.6<br />
$16.5<br />
$4.6<br />
For Sale vs. Sold<br />
Sold<br />
For Sale<br />
$18.0<br />
$6.9 $7.5<br />
$5.3<br />
$16.8<br />
$11.2<br />
CL650<br />
CL605<br />
CL604<br />
Average<br />
$28.0<br />
$23.7 $24.5<br />
$14.4 $12.8<br />
$15.1<br />
$7.9 $7.9 $8.2 $7.9<br />
Market Indicators (vs. Last Quarter)<br />
CL604<br />
Transaction Level (Past 12 Months)<br />
Inventory Level<br />
Average Asking Price<br />
Average Days on Market<br />
CL605<br />
Transaction Level (Past 12 Months)<br />
Inventory Level<br />
Average Asking Price<br />
Average Days on Market<br />
7 7 9<br />
7<br />
4 9<br />
8 8 9<br />
6 7<br />
10<br />
10<br />
11 10 6<br />
9<br />
2 7 4<br />
5 5<br />
47 45 42 39 38 34 22 16 17 13 15 15 18 17 20 30 32 31 30 30 35 38 43 45 47<br />
Mar May Jul Sep Nov Jan Mar May Jul Sep Nov Jan Mar<br />
2021 2022 <strong>2023</strong><br />
10 CL650<br />
3<br />
Transaction Level (Past 12 Months)<br />
Inventory Level<br />
Average Asking Price<br />
Average Days on Market<br />
Source: AMSTAT & ASG<br />
FIRST QUARTER <strong>2023</strong> — GLOBAL SKY QUARTERLY | 75
MARKET SUMMARY: BUSINESS JETS<br />
CHALLENGER 850<br />
Average Asking Price (Million USD)<br />
Market Indicators (vs. Last Quarter)<br />
$4.3<br />
For Sale vs. Sold<br />
Sold<br />
1<br />
7 6 6<br />
For Sale<br />
1 1 1<br />
$4.7 $4.7<br />
1<br />
1<br />
4<br />
2021 2022 <strong>2023</strong><br />
$7.0<br />
1 1<br />
1<br />
$6.5<br />
2<br />
1<br />
$7.0<br />
4<br />
$9.0<br />
1 1<br />
6 6 5 7 7 6 3 3 6 6 5 6 7 7 8 8 8 8 8 8 5 5<br />
Mar May Jul Sep Nov Jan Mar May Jul Sep Nov Jan Mar<br />
PERFORMANCE<br />
Max Range<br />
Max Speed<br />
Typ. Passengers<br />
SUPPLY<br />
No. for Sale<br />
Avg Asking Price<br />
Avg Days on Market<br />
TRANSACTION<br />
Past 12 Months<br />
Past 3 Months<br />
Transaction Level (Past 12 Months)<br />
Inventory Level<br />
Average Asking Price<br />
Average Days on Market<br />
6,750 N.M. / 12,501 km<br />
Mach 0.87<br />
18<br />
Mar<br />
5 (5.6%)<br />
9.0M USD<br />
348<br />
Mar<br />
10<br />
6<br />
Dec<br />
8 (8.9%)<br />
7.0M USD<br />
267<br />
Dec<br />
6<br />
1<br />
Source: AMSTAT & ASG<br />
76 | GLOBAL SKY QUARTERLY — FIRST QUARTER <strong>2023</strong>
MARKET SUMMARY: BUSINESS JETS<br />
GLOBAL EXPRESS, 5000, XRS & 6000<br />
PERFORMANCE<br />
Max Range<br />
Max Speed<br />
Typ. Passengers<br />
GLOBAL 5000<br />
5,350 N.M. / 9,908 km<br />
Mach 0.82<br />
13<br />
GLOBAL EXPRESS<br />
6,125 N.M. / 11,343 km<br />
Mach 0.82<br />
13<br />
GLOBAL XRS<br />
6,226 N.M. / 11,520 km<br />
Mach 0.82<br />
13<br />
GLOBAL 6000<br />
6,080 N.M. / 11,260 km<br />
Mach 0.82<br />
13<br />
SUPPLY<br />
No. for Sale<br />
Avg Asking Price<br />
Avg Days on Market<br />
Mar<br />
20 (8.6%)<br />
19.1M USD<br />
158<br />
Dec<br />
17 (7.3%)<br />
18.3M USD<br />
111<br />
Mar<br />
17 (12.3%)<br />
13.4M USD<br />
116<br />
Dec<br />
10 (7.2%)<br />
14.4M USD<br />
87<br />
Mar<br />
9 (5.6%)<br />
18.4M USD<br />
145<br />
Dec<br />
6 (3.7%)<br />
18.2M USD<br />
432<br />
Mar<br />
13 (4.0%)<br />
34.5M USD<br />
155<br />
Dec<br />
10 (3.1%)<br />
34.3M USD<br />
174<br />
TRANSACTION<br />
Past 12 Months<br />
Past 3 Months<br />
Mar<br />
22<br />
1<br />
Dec<br />
26<br />
9<br />
Mar<br />
21<br />
3<br />
Dec<br />
21<br />
3<br />
Mar<br />
15<br />
1<br />
Dec<br />
19<br />
3<br />
Mar<br />
25<br />
3<br />
Dec<br />
29<br />
9<br />
Average Asking Price (Million USD)<br />
$25.9<br />
$14.4<br />
$13.9<br />
$8.0<br />
3<br />
5<br />
5<br />
11<br />
$24.3<br />
$14.8<br />
For Sale vs. Sold<br />
Sold<br />
For Sale<br />
$14.8<br />
$14.4<br />
$14.0<br />
$11.0<br />
$8.5 $9.4<br />
10<br />
5<br />
11<br />
7<br />
$23.0<br />
$15.2 $16.1<br />
32<br />
$32.0<br />
GL EXPRESS<br />
GL XRS<br />
GL6000<br />
$31.5<br />
8 9 7<br />
11 11 12 4<br />
4<br />
4<br />
9<br />
$17.5 $18.2<br />
$16.5 $15.3<br />
79 73 71 63 56 52 47 41 32 21 25 23 26 26 24 23 24 23 33 44 47 43 52 56 59<br />
Mar May Jul Sep Nov Jan Mar May Jul Sep Nov Jan Mar<br />
2021 2022 <strong>2023</strong><br />
5<br />
GL5000<br />
Average<br />
$34.3<br />
15<br />
4<br />
3<br />
5<br />
$34.5<br />
$19.1<br />
$13.2 $14.2 $13.4<br />
$18.4<br />
Market Indicators (vs. Last Quarter)<br />
GLOBAL 5000<br />
Transaction Level (Past 12 Months)<br />
Inventory Level<br />
Average Asking Price<br />
Average Days on Market<br />
GLOBAL EXPRESS<br />
Transaction Level (Past 12 Months)<br />
Inventory Level<br />
Average Asking Price<br />
Average Days on Market<br />
GLOBAL XRS<br />
Transaction Level (Past 12 Months)<br />
Inventory Level<br />
Average Asking Price<br />
Average Days on Market<br />
GLOBAL 6000<br />
Transaction Level (Past 12 Months)<br />
Inventory Level<br />
Average Asking Price<br />
Average Days on Market<br />
Source: AMSTAT & ASG<br />
FIRST QUARTER <strong>2023</strong> — GLOBAL SKY QUARTERLY | 77
MARKET SUMMARY: BUSINESS JETS<br />
CITATION CJ3 & CJ4<br />
PERFORMANCE<br />
Max Range<br />
Max Speed<br />
Typ. Passengers<br />
Cit. CJ3<br />
1,891 N.M. / 3,502 km<br />
Mach 0.73<br />
6<br />
Cit. CJ4<br />
1,991 N.M. / 3,687 km<br />
Mach 0.77<br />
7<br />
SUPPLY<br />
No. for Sale<br />
Avg Asking Price<br />
Avg Days on Market<br />
Mar<br />
20 (3.1%)<br />
6.7M USD<br />
123<br />
Dec<br />
21 (3.3%)<br />
6.9M USD<br />
95<br />
Mar<br />
9 (2.3%)<br />
8.5M USD<br />
64<br />
Dec<br />
10 (2.6%)<br />
8.1M USD<br />
91<br />
TRANSACTION<br />
Past 12 Months<br />
Past 3 Months<br />
Mar<br />
75<br />
12<br />
Dec<br />
72<br />
23<br />
Mar<br />
38<br />
3<br />
Dec<br />
44<br />
13<br />
Average Asking Price (Million USD)<br />
Market Indicators (vs. Last Quarter)<br />
CJ4<br />
CJ3<br />
Average<br />
$10.3<br />
Cit. CJ3<br />
$6.8 $6.9<br />
$4.8 $4.7<br />
$7.8<br />
$6.1<br />
$8.7<br />
$7.9<br />
$5.4<br />
$8.8<br />
$7.0<br />
$8.5<br />
$6.7<br />
Transaction Level (Past 12 Months)<br />
Inventory Level<br />
Average Asking Price<br />
Average Days on Market<br />
For Sale vs. Sold<br />
Sold For Sale<br />
23<br />
19<br />
25<br />
10<br />
9<br />
3<br />
9 10<br />
14 12 9 7<br />
9<br />
12 8<br />
5 7 3<br />
8 4 7<br />
6<br />
6<br />
8<br />
4<br />
32 26 25 24 17 20 19 17 16 8 8 12 18 20 18 23 24 29 32 35 41 31 28 25 29<br />
Mar May Jul Sep Nov Jan Mar May Jul Sep Nov Jan Mar<br />
2021 2022 <strong>2023</strong><br />
Cit. CJ4<br />
Transaction Level (Past 12 Months)<br />
Inventory Level<br />
Average Asking Price<br />
Average Days on Market<br />
Source: AMSTAT & ASG<br />
78 | GLOBAL SKY QUARTERLY — FIRST QUARTER <strong>2023</strong>
MARKET SUMMARY: BUSINESS JETS<br />
CITATION LATITUDE<br />
Average Asking Price (Million USD)<br />
Market Indicators (vs. Last Quarter)<br />
$13.5<br />
$11.5<br />
$11.5<br />
$13.9<br />
$16.1<br />
$19.8<br />
Transaction Level (Past 12 Months)<br />
Inventory Level<br />
Average Asking Price<br />
Average Days on Market<br />
For Sale vs. Sold<br />
Sold For Sale<br />
2<br />
1<br />
3<br />
1 1<br />
1<br />
1<br />
1<br />
1<br />
1<br />
1<br />
3 2 2 1 1 2 1 1 1 1 3 2 4 4 1 1 2 2 3 3 3 3 5<br />
Mar May Jul Sep Nov Jan Mar May Jul Sep Nov Jan Mar<br />
2021 2022 <strong>2023</strong><br />
PERFORMANCE<br />
Max Range<br />
Max Speed<br />
Typ. Passengers<br />
SUPPLY<br />
No. for Sale<br />
Avg Asking Price<br />
Avg Days on Market<br />
TRANSACTION<br />
Past 12 Months<br />
Past 3 Months<br />
2,870N.M. / 5,315 km<br />
Mach 0.80<br />
9<br />
Mar<br />
5 (1.5%)<br />
19.8M USD<br />
83<br />
Mar<br />
6<br />
1<br />
Dec<br />
3 (0.9%)<br />
16.1M USD<br />
102<br />
Dec<br />
6<br />
1<br />
CITATION SOVEREIGN<br />
Average Asking Price (Million USD)<br />
Market Indicators (vs. Last Quarter)<br />
$5.9<br />
$6.3<br />
$12.5<br />
$8.0<br />
$8.3<br />
$10.2<br />
$9.0<br />
Transaction Level (Past 12 Months)<br />
Inventory Level<br />
Average Asking Price<br />
Average Days on Market<br />
For Sale vs. Sold<br />
4<br />
Sold<br />
5<br />
2<br />
For Sale<br />
1<br />
4<br />
1<br />
3<br />
3<br />
9<br />
3<br />
2<br />
23 21 20 17 16 14 12 10 8 4 3 4 7 6 5 7 8 9 10 16 16 16 15 18 18<br />
Mar May Jul Sep Nov Jan Mar May Jul Sep Nov Jan Mar<br />
2021 2022 <strong>2023</strong><br />
5<br />
3<br />
3<br />
3<br />
1<br />
4<br />
7<br />
2<br />
PERFORMANCE<br />
Max Range<br />
Max Speed<br />
Typ. Passengers<br />
SUPPLY<br />
No. for Sale<br />
Avg Asking Price<br />
Avg Days on on Market<br />
TRANSACTION<br />
Past 12 Months<br />
Past 3 Months<br />
3,010N.M. / 5,574 km<br />
Mach 0.80<br />
9<br />
Mar<br />
18 (4.0%)<br />
9.0M USD<br />
129<br />
Mar<br />
28<br />
2<br />
Dec<br />
16 (3.6%)<br />
10.4M USD<br />
94<br />
Dec<br />
28<br />
7<br />
Source: AMSTAT & ASG<br />
FIRST QUARTER <strong>2023</strong> — GLOBAL SKY QUARTERLY | 79
MARKET SUMMARY: BUSINESS JETS<br />
FALCON 900DX/EX/EX EASY/LX<br />
PERFORMANCE<br />
Max Range<br />
Max Speed<br />
Typ. Passengers<br />
F900DX<br />
4,100 N.M. / 7,593 km<br />
Mach 0.83<br />
12<br />
F900EX<br />
4,500 N.M. / 8,334 km<br />
Mach 0.83<br />
12<br />
F900EX EASy<br />
4,500 N.M. / 8,334 km<br />
Mach 0.83<br />
12<br />
F900LX<br />
4,750 N.M. / 8,800 km<br />
Mach 0.83<br />
12<br />
SUPPLY<br />
No. for Sale<br />
Avg Asking Price<br />
Avg Days on Market<br />
Mar<br />
1 (4.3%)<br />
15.6M USD<br />
95<br />
Dec<br />
1 (4.3%)<br />
15.6M USD<br />
5<br />
Mar<br />
8 (6.7%)<br />
10.1M USD<br />
105<br />
Dec<br />
9 (7.6%)<br />
12.0M USD<br />
105<br />
Mar<br />
4 (3.4%)<br />
16.6M USD<br />
102<br />
Dec<br />
4 (3.4%)<br />
15.5M USD<br />
61<br />
Mar<br />
0 (0.0%)<br />
0.0M USD<br />
0<br />
Dec<br />
0 (0.0%)<br />
0.0M USD<br />
0<br />
TRANSACTION<br />
Past 12 Months<br />
Past 3 Months<br />
Mar<br />
0<br />
0<br />
Dec<br />
0<br />
0<br />
Mar<br />
10<br />
0<br />
Dec<br />
13<br />
5<br />
Mar<br />
19<br />
2<br />
Dec<br />
19<br />
6<br />
Mar<br />
2<br />
0<br />
Dec<br />
3<br />
1<br />
Average Asking Price (Million USD)<br />
F900EX EASy<br />
F900DX<br />
F900LX<br />
Average<br />
F900EX<br />
$19.4<br />
$19.0<br />
$17.5 $17.5<br />
$14.9 $14.9<br />
$15.5 $16.6<br />
$13.2<br />
$12.8<br />
$15.6<br />
$12.3<br />
$13.8<br />
$12.1<br />
$10.5 $10.5<br />
$10.1<br />
$7.5 $7.6<br />
For Sale vs. Sold<br />
Sold For Sale<br />
3<br />
2<br />
4 5<br />
4 5 6<br />
1<br />
5<br />
4<br />
4<br />
2<br />
4 2<br />
5<br />
6<br />
3 2<br />
4<br />
1<br />
2<br />
20 19 20 18 13 15 18 16 15 11 5 4 4 6 6 4 6 7 8 13 12 14 14 14 13<br />
Mar May Jul Sep Nov Jan Mar May Jul Sep Nov Jan Mar<br />
2021 2022 <strong>2023</strong><br />
Market Indicators (vs. Last Quarter)<br />
F900DX<br />
Transaction Level (Past 12 Months)<br />
Inventory Level<br />
Average Asking Price<br />
Average Days on Market<br />
F900EX<br />
Transaction Level (Past 12 Months)<br />
Inventory Level<br />
Average Asking Price<br />
Average Days on Market<br />
F900EX EASy<br />
Transaction Level (Past 12 Months)<br />
Inventory Level<br />
Average Asking Price<br />
Average Days on Market<br />
F900LX<br />
Transaction Level (Past 12 Months)<br />
Inventory Level<br />
Average Asking Price<br />
Average Days on Market<br />
Source: AMSTAT & ASG<br />
80 | GLOBAL SKY QUARTERLY — FIRST QUARTER <strong>2023</strong>
MARKET SUMMARY: BUSINESS JETS<br />
FALCON 2000LX/LXS/S<br />
PERFORMANCE<br />
Max Range<br />
Max Speed<br />
Typ. Passengers<br />
F2000LX<br />
4,000 N.M. / 7,408 km<br />
Mach 0.83<br />
10<br />
F2000LXS<br />
4,000 N.M. / 7,408 km<br />
Mach 0.83<br />
10<br />
F2000S<br />
3,350 N.M. / 6,208 km<br />
Mach 0.83<br />
10<br />
SUPPLY<br />
No. for Sale<br />
Avg Asking Price<br />
Avg Days on Market<br />
Mar<br />
7 (5.5%)<br />
17.2M USD<br />
85<br />
Dec<br />
2 (1.5%)<br />
15.8M USD<br />
46<br />
Mar<br />
3 (2.3%)<br />
26.7M USD<br />
104<br />
Dec<br />
3 (2.4%)<br />
24.3M USD<br />
45<br />
Mar<br />
0 (0.0%)<br />
0.0M USD<br />
0<br />
Dec<br />
1 (2.1%)<br />
16.5M USD<br />
79<br />
TRANSACTION<br />
Past 12 Months<br />
Past 3 Months<br />
Mar<br />
8<br />
1<br />
Dec<br />
10<br />
2<br />
Mar<br />
5<br />
0<br />
Dec<br />
6<br />
2<br />
Mar<br />
2<br />
1<br />
Dec<br />
1<br />
0<br />
Average Asking Price (Million USD)<br />
$27.7<br />
$20.3<br />
$21.4<br />
$9.1 $9.1<br />
For Sale vs. Sold<br />
Sold<br />
4<br />
3<br />
For Sale<br />
2<br />
1<br />
4<br />
$23.9<br />
$21.4 $22.3<br />
$20.0<br />
$11.7<br />
9<br />
2<br />
2<br />
1<br />
$17.5<br />
1<br />
$14.7<br />
$16.5<br />
$15.0<br />
$26.7<br />
$17.2<br />
11 10 10 6 4 4 4 5 4 2 1 2 2 4 5 4 4 4 4 5 5 6 9 10 10<br />
Mar May Jul Sep Nov Jan Mar May Jul Sep Nov Jan Mar<br />
2021 2022 <strong>2023</strong><br />
1<br />
F2000S<br />
F2000LXS<br />
1<br />
3<br />
2<br />
2<br />
F2000LX<br />
Average<br />
1<br />
2<br />
$24.3<br />
1<br />
2<br />
Market Indicators (vs. Last Quarter)<br />
F2000LX<br />
Transaction Level (Past 12 Months)<br />
Inventory Level<br />
Average Asking Price<br />
Average Days on Market<br />
F2000LXS<br />
Transaction Level (Past 12 Months)<br />
Inventory Level<br />
Average Asking Price<br />
Average Days on Market<br />
F2000S<br />
Transaction Level (Past 12 Months)<br />
Inventory Level<br />
Average Asking Price<br />
Average Days on Market<br />
Source: AMSTAT & ASG<br />
FIRST QUARTER <strong>2023</strong> — GLOBAL SKY QUARTERLY | 81
MARKET SUMMARY: BUSINESS JETS<br />
FALCON 7X<br />
Average Asking Price (Million USD)<br />
Market Indicators (vs. Last Quarter)<br />
$22.6<br />
$20.6<br />
$21.5<br />
$23.5<br />
$23.0<br />
$26.7<br />
$26.1<br />
Transaction Level (Past 12 Months)<br />
Inventory Level<br />
Average Asking Price<br />
Average Days on Market<br />
For Sale vs. Sold<br />
Sold For Sale<br />
3<br />
1<br />
5<br />
1 2<br />
4<br />
1<br />
3<br />
2<br />
2<br />
4<br />
3<br />
2<br />
7<br />
2<br />
2<br />
3<br />
2<br />
3<br />
1 3<br />
1<br />
18 17 19 15 14 14 9 6 5 3 1 1 4 6 10 14 12 12 12 14 13 12 9 11 11<br />
Mar May Jul Sep Nov Jan Mar May Jul Sep Nov Jan Mar<br />
2021 2022 <strong>2023</strong><br />
PERFORMANCE<br />
Max Range<br />
Max Speed<br />
Typ. Passengers<br />
SUPPLY<br />
No. for Sale<br />
Avg Asking Price<br />
Avg Days on Market<br />
TRANSACTION<br />
Past 12 Months<br />
Past 3 Months<br />
5,950 N.M. / 11,018 km<br />
Mach 0.90<br />
12<br />
Mar<br />
11 (3.7%)<br />
26.1M USD<br />
162<br />
Mar<br />
27<br />
4<br />
Dec<br />
12 (4.0%)<br />
28.0M USD<br />
123<br />
Dec<br />
30<br />
5<br />
Source: AMSTAT & ASG<br />
82 | GLOBAL SKY QUARTERLY — FIRST QUARTER <strong>2023</strong>
MARKET SUMMARY: BUSINESS JETS<br />
PHENOM 300<br />
Average Asking Price (Million USD)<br />
Market Indicators (vs. Last Quarter)<br />
$7.2<br />
$6.3<br />
$8.0<br />
$8.1<br />
$9.3<br />
$8.5<br />
$8.5<br />
Transaction Level (Past 12 Months)<br />
Inventory Level<br />
Average Asking Price<br />
Average Days on Market<br />
For Sale vs. Sold<br />
Sold For Sale<br />
7<br />
7<br />
6<br />
2<br />
9<br />
6<br />
8<br />
6<br />
3 5<br />
6<br />
2 1<br />
5 7<br />
5 2<br />
2 5 2<br />
2<br />
2<br />
2<br />
3 1<br />
30 25 24 23 15 15 8 7 7 3 2 5 6 8 9 7 10 12 12 18 18 16 16 20 18<br />
Mar May Jul Sep Nov Jan Mar May Jul Sep Nov Jan Mar<br />
2021 2022 <strong>2023</strong><br />
PERFORMANCE<br />
Max Range<br />
Max Speed<br />
Typ. Passengers<br />
SUPPLY<br />
No. for Sale<br />
Avg Asking Price<br />
Avg Days on Market<br />
TRANSACTION<br />
Past 12 Months<br />
Past 3 Months<br />
1,242 N.M. / 2,300 km<br />
Mach 0.78<br />
5<br />
Mar<br />
18 (2.6%)<br />
8.5M USD<br />
191<br />
Mar<br />
45<br />
9<br />
Dec<br />
16 (2.3%)<br />
8.5M USD<br />
198<br />
Dec<br />
42<br />
17<br />
LEGACY 600/650<br />
Average Asking Price (Million USD)<br />
L650<br />
L600<br />
Market Indicators (vs. Last Quarter)<br />
$11.0<br />
$13.5<br />
$13.5<br />
$16.7<br />
Average<br />
$20.0 $20.0<br />
$15.3<br />
Transaction Level (Past 12 Months)<br />
Inventory Level<br />
Average Asking Price<br />
Average Days on Market<br />
L600<br />
L650<br />
$9.5<br />
$9.8<br />
$9.1<br />
$9.6<br />
$7.7 $7.4<br />
$7.5<br />
For Sale vs. Sold<br />
Sold For Sale<br />
1 1<br />
4<br />
2 3<br />
1<br />
3 2 2<br />
1<br />
2 4<br />
2 3<br />
1<br />
1<br />
1<br />
1 1 1 1<br />
15 15 15 11 12 10 10 9 8 4 4 4 4 7 10 11 11 12 11 9 11 11 10 9 11<br />
Mar May Jul Sep Nov Jan Mar May Jul Sep Nov Jan Mar<br />
2021 2022 <strong>2023</strong><br />
PERFORMANCE<br />
Max Range<br />
Max Speed<br />
Typ. Passengers<br />
SUPPLY<br />
No. for Sale<br />
Avg Asking Price<br />
Avg Days on Market<br />
TRANSACTION<br />
Past 12 Months<br />
Past 3 Months<br />
L600<br />
3,400 N.M.<br />
6,297 km<br />
Mach 0.80<br />
13<br />
Mar | Dec<br />
7 | 6<br />
9.6M USD<br />
9.9M USD<br />
167 | 100<br />
Mar | Dec<br />
10 | 9<br />
1 | 4<br />
L650<br />
3,640 N.M.<br />
7,112 km<br />
Mach 0.80<br />
13<br />
Mar | Dec<br />
4 | 5<br />
15.3M USD<br />
20.0M USD<br />
351 | 339<br />
Mar | Dec<br />
13 | 12<br />
4 | 1<br />
Source: AMSTAT & ASG<br />
FIRST QUARTER <strong>2023</strong> — GLOBAL SKY QUARTERLY | 83
MARKET SUMMARY: BUSINESS JETS<br />
LINEAGE 1000/E<br />
Average Asking Price (Million USD)<br />
Market Indicators (vs. Last Quarter)<br />
$22.5<br />
Transaction Level (Past 12 Months)<br />
Inventory Level<br />
$14.9 $14.9<br />
$14.9<br />
$16.0<br />
Average Asking Price<br />
Average Days on Market<br />
For Sale vs. Sold<br />
Sold For Sale<br />
1<br />
PERFORMANCE<br />
Max Range<br />
Max Speed<br />
Typ. Passengers<br />
SUPPLY<br />
No. for Sale<br />
Avg Asking Price<br />
Avg Days on Market<br />
4,400 N.M. / 8,149 km<br />
Mach 0.82<br />
19<br />
Mar<br />
1 (3.3%)<br />
22.5M USD<br />
116<br />
Dec<br />
1 (3.3%)<br />
22.5M USD<br />
26<br />
1<br />
4 4 4 2 2 2 2 2 2 2 2 2 2 1 1 1 1 1<br />
Mar May Jul Sep Nov Jan Mar May Jul Sep Nov Jan Mar<br />
2021 2022 <strong>2023</strong><br />
TRANSACTION<br />
Past 12 Months<br />
Past 3 Months<br />
Mar<br />
1<br />
0<br />
Dec<br />
1<br />
0<br />
Source: AMSTAT & ASG<br />
84 | GLOBAL SKY QUARTERLY — FIRST QUARTER <strong>2023</strong>
MARKET SUMMARY: BUSINESS JETS<br />
G200<br />
Average Asking Price (Million USD)<br />
Market Indicators (vs. Last Quarter)<br />
$6.0<br />
$6.2<br />
$6.5<br />
$5.9<br />
Transaction Level (Past 12 Months)<br />
Inventory Level<br />
Average Asking Price<br />
$3.6<br />
$3.5<br />
$3.7<br />
Average Days on Market<br />
For Sale vs. Sold<br />
Sold For Sale<br />
9<br />
3<br />
4<br />
2 3 2<br />
2<br />
4 3<br />
4<br />
1<br />
4<br />
5<br />
5<br />
8<br />
3<br />
3<br />
3<br />
1<br />
1<br />
2 2 1 5 4<br />
18 19 19 22 19 18 12 10 7 7 8 9 6 5 11 11 12 12 12 15 19 22 21 23 21<br />
Mar May Jul Sep Nov Jan Mar May Jul Sep Nov Jan Mar<br />
2021 2022 <strong>2023</strong><br />
PERFORMANCE<br />
Max Range<br />
Max Speed<br />
Typ. Passengers<br />
SUPPLY<br />
No. for Sale<br />
Avg Asking Price<br />
Avg Days on Market<br />
TRANSACTION<br />
Past 12 Months<br />
Past 3 Months<br />
3,050 N.M. / 5,651 km<br />
Mach 0.81<br />
8<br />
Mar<br />
21 (8.8%)<br />
5.9M USD<br />
114<br />
Mar<br />
39<br />
7<br />
Dec<br />
22 (9.2%)<br />
6.5M USD<br />
99<br />
Dec<br />
40<br />
15<br />
G280<br />
Average Asking Price (Million USD)<br />
Market Indicators (vs. Last Quarter)<br />
$11.1<br />
3<br />
Sold<br />
For Sale<br />
$13.2<br />
For Sale vs. Sold<br />
$18.5<br />
$19.9 $19.3<br />
2<br />
2 3<br />
6<br />
4<br />
3<br />
2<br />
2<br />
2<br />
1<br />
1<br />
2<br />
1<br />
1<br />
3<br />
4<br />
1<br />
1<br />
1<br />
1<br />
12 9 8 10 10 9 8 7 6 5 5 2 1 2 2 3 4 9 8 9 8 7 9<br />
Mar May Jul Sep Nov Jan Mar May Jul Sep Nov Jan Mar<br />
2021 2022 <strong>2023</strong><br />
$18.5<br />
PERFORMANCE<br />
Max Range<br />
Max Speed<br />
Typ. Passengers<br />
SUPPLY<br />
No. for Sale<br />
Avg Asking Price<br />
Avg Days on Market<br />
TRANSACTION<br />
Past 12 Months<br />
Past 3 Months<br />
Transaction Level (Past 12 Months)<br />
Inventory Level<br />
Average Asking Price<br />
Average Days on Market<br />
3,600 N.M. / 6,667 km<br />
Mach 0.84<br />
8<br />
Mar<br />
Dec<br />
9 (3.6%) 9 (3.7%)<br />
18.5M USD 19.3M USD<br />
128 76<br />
Mar<br />
17<br />
4<br />
Dec<br />
18<br />
6<br />
Source: AMSTAT & ASG<br />
FIRST QUARTER <strong>2023</strong> — GLOBAL SKY QUARTERLY | 85
MARKET SUMMARY: BUSINESS JETS<br />
G450<br />
Average Asking Price (Million USD)<br />
Market Indicators (vs. Last Quarter)<br />
$16.0<br />
$17.1<br />
$18.3<br />
Transaction Level (Past 12 Months)<br />
Inventory Level<br />
Average Asking Price<br />
$11.8<br />
$11.9<br />
$12.6<br />
$16.0<br />
Average Days on Market<br />
For Sale vs. Sold<br />
Sold For Sale<br />
5<br />
5<br />
2 3<br />
2 2 3<br />
5<br />
8<br />
8<br />
2 4<br />
2<br />
1 3 3 1<br />
3 1 1<br />
1<br />
2<br />
1<br />
1 2<br />
31 25 25 24 18 19 19 15 11 6 6 6 9 10 11 12 12 9 11 17 16 13 12 12 14<br />
Mar May Jul Sep Nov Jan Mar May Jul Sep Nov Jan Mar<br />
2021 2022 <strong>2023</strong><br />
PERFORMANCE<br />
Max Range<br />
Max Speed<br />
Typ. Passengers<br />
SUPPLY<br />
No. for Sale<br />
Avg Asking Price<br />
Avg Days on Market<br />
TRANSACTION<br />
Past 12 Months<br />
Past 3 Months<br />
4,350 N.M. / 8,056 km<br />
Mach 0.85<br />
13<br />
Mar<br />
14 (4.0%)<br />
18.3M USD<br />
151<br />
Mar<br />
28<br />
7<br />
Dec<br />
13 (3.7%)<br />
17.5M USD<br />
128<br />
Dec<br />
27<br />
7<br />
G550<br />
Average Asking Price (Million USD)<br />
Market Indicators (vs. Last Quarter)<br />
$28.8<br />
Transaction Level (Past 12 Months)<br />
$17.2<br />
$19.7<br />
$21.2<br />
$23.7<br />
$22.2<br />
$21.5<br />
Inventory Level<br />
Average Asking Price<br />
Average Days on Market<br />
For Sale vs. Sold<br />
Sold For Sale<br />
5<br />
5<br />
6<br />
23<br />
8<br />
7<br />
3<br />
5 7<br />
2<br />
8 3<br />
6<br />
4 2 3<br />
4<br />
4<br />
6<br />
5<br />
6<br />
4 6<br />
1 1<br />
43 47 42 31 30 30 20 24 23 8 8 7 5 8 10 14 16 20 24 30 29 26 29 27 33<br />
Mar May Jul Sep Nov Jan Mar May Jul Sep Nov Jan Mar<br />
2021 2022 <strong>2023</strong><br />
PERFORMANCE<br />
Max Range<br />
Max Speed<br />
Typ. Passengers<br />
SUPPLY<br />
No. for Sale<br />
Avg Asking Price<br />
Avg Days on Market<br />
TRANSACTION<br />
Past 12 Months<br />
Past 3 Months<br />
6,750 N.M. / 12,501 km<br />
Mach 0.87<br />
18<br />
Mar<br />
33 (5.4%)<br />
21.5M USD<br />
131<br />
Mar<br />
49<br />
7<br />
Dec<br />
26 (4.2%)<br />
22.7M USD<br />
123<br />
Dec<br />
53<br />
16<br />
Source: AMSTAT & ASG<br />
86 | GLOBAL SKY QUARTERLY — FIRST QUARTER <strong>2023</strong>
MARKET SUMMARY: BUSINESS JETS<br />
G650 & G650 ER<br />
Average Asking Price (Million USD)<br />
Market Indicators (vs. Last Quarter)<br />
$45.6<br />
$36.0<br />
G650ER<br />
G650<br />
Average<br />
$44.2<br />
$39.2<br />
For Sale vs. Sold<br />
Sold<br />
2<br />
2<br />
For Sale<br />
12 12 15 16 15 13<br />
1<br />
2<br />
5<br />
3<br />
1<br />
$50.1<br />
$41.1<br />
3<br />
5<br />
1<br />
1<br />
$52.7<br />
$49.0<br />
2<br />
$48.6<br />
$39.8<br />
Mar May Jul Sep Nov Jan Mar May Jul Sep Nov Jan Mar<br />
2021 2022 <strong>2023</strong><br />
3<br />
5<br />
1<br />
$43.5<br />
$60.0<br />
2<br />
3<br />
2 4 1<br />
$53.0<br />
$40.0<br />
10 5 7 9 9 11 13 12 9 10 11 13 16 19 16 14 17 17 17<br />
2<br />
3<br />
1<br />
ASIAN SKY CONSULTING<br />
Independent Business and General Aviation Consulting Services<br />
01<br />
02<br />
03<br />
04<br />
Transaction Level (Past 12 Months)<br />
Inventory Level<br />
Average Asking Price<br />
Average Days on Market<br />
PERFORMANCE<br />
Max Range<br />
Max Speed<br />
Typ. Passengers<br />
SUPPLY<br />
No. for Sale<br />
Avg Asking Price<br />
Avg Days on Market<br />
TRANSACTION<br />
Past 12 Months<br />
Past 3 Months<br />
TRANSACTIONAL ADVISORY<br />
Manage the engagement, drafting, review and<br />
negotiation of any aviation transactional<br />
documents, liaise, control and lead the transaction<br />
process to ensure the best terms and successful<br />
results are achieved.<br />
OPERATION ADVISORY<br />
Perform operational analysis, management selection<br />
and due diligence, recommend operational and<br />
aircraft ownership structure advisory.<br />
MARKET RESEARCH & STUDIES<br />
Perform aviation market research, appraisals,<br />
feasibility studies and aviation business planning.<br />
COMPLETION MANAGEMENT<br />
G650<br />
7,000 N.M.<br />
12,964 km<br />
Mach 0.90<br />
18<br />
Mar | Dec<br />
8 | 5<br />
40.0M USD<br />
39.8M USD<br />
108 | 130<br />
Mar | Dec<br />
7 | 7<br />
1 | 3<br />
G650<br />
Generate corporate airliner cabin definition, select the<br />
most suitable completion facility, handle green aircraft<br />
delivery, carry out completion oversight and conduct<br />
aircraft final delivery & compliance inspections.<br />
G650ER<br />
7,500 N.M.<br />
13,890 km<br />
Mach 0.90<br />
18<br />
Mar | Dec<br />
9 | 9<br />
53.0M USD<br />
41.0M USD<br />
155 | 110<br />
Mar | Dec<br />
20 | 19<br />
4 | 6<br />
G650ER<br />
Source: AMSTAT & ASG<br />
Please contact our sales team for more information<br />
Email: sales@asianskygroup.com<br />
Website: www.asianskygroup.com<br />
FIRST QUARTER <strong>2023</strong> — GLOBAL SKY QUARTERLY | 87
MARKET<br />
SUMMARY<br />
CIVIL HELICOPTERS<br />
<strong>Q1</strong> <strong>2023</strong><br />
88 | GLOBAL SKY QUARTERLY — FIRST QUARTER <strong>2023</strong>
AIRCRAFT POSITIONING<br />
TOTAL ANNUAL COST VS. MAX TAKEOFF WEIGHT<br />
TOTAL ANUUAL COST (MILLION USD)<br />
8<br />
4<br />
2<br />
1<br />
0.5<br />
HEAVY<br />
(SUPER) MEDIUM<br />
LIGHT TWIN<br />
SINGLE TURBINE<br />
PISTON<br />
BELL 407GXP (2018)<br />
MD600N<br />
H120 (2018)<br />
MD520N<br />
MD500E<br />
MD530F<br />
R66<br />
EN480B (2022)<br />
AW109 GRANDNEW<br />
MD902<br />
H135(T3)<br />
AW109 POWER (2020)<br />
R44 RAVEN II<br />
H175<br />
S-76D<br />
H155<br />
AW169<br />
AW119KX<br />
H130<br />
BELL 407 (2012)<br />
H125<br />
BELL 206L4 (2017)<br />
BELL 505<br />
BELL429<br />
MARKET SUMMARY: CIVIL HELICOPTERS<br />
S-92<br />
H225<br />
H215 C1E<br />
AW189<br />
AW139<br />
BELL 412EPI<br />
S-76C++ (2011)<br />
H145<br />
BELL430 (2008)<br />
TOTAL ANNUAL COST VS. MAX RANGE<br />
TOTAL ANNUAL COST (MILLION USD)<br />
8<br />
4<br />
2<br />
1<br />
0.5<br />
R22 BETA II<br />
0.25<br />
150 200 300 400<br />
500<br />
600<br />
MAX CRUISE RANGE (NM)<br />
TOTAL ANNUAL COST VS. CABIN VOLUME<br />
TOTAL ANNUAL COST (MILLION USD)<br />
0.25<br />
1,000<br />
8<br />
4<br />
2<br />
1<br />
0.5<br />
0.25<br />
20<br />
HEAVY<br />
(SUPER) MEDIUM<br />
LIGHT TWIN<br />
SINGLE TURBINE<br />
PISTON<br />
MD600N<br />
MD520N<br />
MD500E<br />
MD530F<br />
BELL 206L4 (2017)<br />
R66<br />
HEAVY<br />
(SUPER) MEDIUM<br />
LIGHT TWIN<br />
SINGLE TURBINE<br />
PISTON<br />
H125<br />
H120 (2018)<br />
MD520N<br />
MD530F<br />
MD500E<br />
EN480B (2022)<br />
R66<br />
R22 BETA II<br />
2,000 4,000 8,000 16,000 32,000<br />
MAXIMUM TAKE-OFF WEIGHT (LBS)<br />
BELL429<br />
H135(T3)<br />
MD902<br />
H155<br />
AW169<br />
S-76C++ (2011)<br />
BELL 412EPI<br />
MD902<br />
BELL429<br />
AW109 POWER (2020)<br />
H135(T3)<br />
BELL 407GXP (2018)<br />
R44 RAVEN II<br />
R22 BETA II<br />
R44 RAVEN II<br />
H145<br />
BELL430 (2008)<br />
H125<br />
H155<br />
AW139<br />
BELL 412EPI<br />
S-76D<br />
H145<br />
40 80 160 320 640 800<br />
CABIN VOLUME (CU. FT. )<br />
Source: Conklin & de Decker<br />
H225<br />
S-92<br />
H215 C1E<br />
H155<br />
H175<br />
AW109 GRANDNEW<br />
AW109 POWER (2020)<br />
AW119KX<br />
H130<br />
H120 (2018)<br />
BELL 505<br />
EN480B (2022)<br />
BELL 407GXP (2018)<br />
BELL 407 (2012)<br />
H215 C1E<br />
AW109 GRANDNEW<br />
BELL430 (2008)<br />
AW119KX<br />
MD600N<br />
BELL 407 (2012)<br />
BELL 206L4 (2017)<br />
H130<br />
BELL 505<br />
AW139<br />
S-92<br />
AW189<br />
H175<br />
AW189<br />
AW169<br />
S-76C++ (2011)<br />
H225<br />
FIRST QUARTER <strong>2023</strong> — GLOBAL SKY QUARTERLY | 89
MARKET SUMMARY: CIVIL HELICOPTERS<br />
MARKET SUMMARY PER MODEL<br />
INVENTORY LEVEL, PRICE TREND & TRANSACTIONS<br />
H125<br />
Average Asking Price (Million USD)<br />
Market Indicators (vs. Last Quarter)<br />
$3.3<br />
Transaction Level (Past 12 Months)<br />
$2.3<br />
$2.3 $2.4<br />
$2.6<br />
$2.8<br />
$2.8<br />
Inventory Level<br />
Average Asking Price<br />
Average Days on Market<br />
For Sale vs. Sold<br />
Sold<br />
6<br />
5<br />
25 24<br />
4<br />
24<br />
For Sale<br />
1<br />
2<br />
1<br />
15 14 15<br />
6<br />
8<br />
3 4 4 3<br />
1 7<br />
4<br />
2<br />
4<br />
1 3<br />
1<br />
15 19 18 19 20 19 17 14 13 13 13 13 17 20 21<br />
2<br />
7<br />
21 21 23<br />
Mar May Jul Sep Nov Jan Mar May Jul Sep Nov Jan Mar<br />
2021 2022 <strong>2023</strong><br />
1<br />
2<br />
2<br />
23<br />
PERFORMANCE<br />
Max Range<br />
Max Speed<br />
Typ. Passengers<br />
SUPPLY<br />
No. for Sale<br />
Avg Asking Price<br />
Avg Days on Market<br />
TRANSACTION<br />
Past 12 Months<br />
Past 3 Months<br />
340 N.M. / 630 km<br />
140 Knots<br />
6<br />
Mar<br />
23(2.0%)<br />
2.8M USD<br />
236<br />
Mar<br />
36<br />
11<br />
Dec<br />
21(1.9%)<br />
3.3M USD<br />
187<br />
Dec<br />
37<br />
5<br />
H130<br />
Average Asking Price (Million USD)<br />
Market Indicators (vs. Last Quarter)<br />
Transaction Level (Past 12 Months)<br />
$2.9<br />
$2.5<br />
$2.0<br />
$2.8<br />
$3.1<br />
$2.8<br />
$2.6<br />
Inventory Level<br />
Average Asking Price<br />
Average Days on Market<br />
For Sale vs. Sold<br />
Sold<br />
2<br />
For Sale<br />
5<br />
2<br />
5<br />
3<br />
1<br />
2<br />
1<br />
2<br />
8 7 5 5 5 5 5 5 4 4 4 7 6 5 6 6 7 7 7 9 11 10 13 13 14<br />
3<br />
3 3 1<br />
Mar May Jul Sep Nov Jan Mar May Jul Sep Nov Jan Mar<br />
2021 2022 <strong>2023</strong><br />
1<br />
3<br />
2<br />
1<br />
PERFORMANCE<br />
Max Range<br />
Max Speed<br />
Typ. Passengers<br />
SUPPLY<br />
No. for Sale<br />
Avg Asking Price<br />
Avg Days on Market<br />
TRANSACTION<br />
Past 12 Months<br />
Past 3 Months<br />
333 N.M. / 606km<br />
128 Knots<br />
7<br />
Mar<br />
14 (3.9%)<br />
2.6M USD<br />
179<br />
Mar<br />
17<br />
3<br />
Dec<br />
10(2.8%)<br />
2.8M USD<br />
138<br />
Dec<br />
18<br />
5<br />
Source: AMSTAT & ASG<br />
90 | GLOBAL SKY QUARTERLY — FIRST QUARTER <strong>2023</strong>
MARKET SUMMARY: CIVIL HELICOPTERS<br />
EC135P2 & T2<br />
Average Asking Price (Million USD)<br />
$2.3<br />
$2.0<br />
$1.7<br />
$1.7<br />
$1.7<br />
$1.7<br />
EC135T2<br />
EC135P2<br />
Average<br />
$2.9<br />
$2.9<br />
$2.6<br />
$2.2<br />
$1.7 $1.6<br />
$1.6 $1.6<br />
Market Indicators (vs. Last Quarter)<br />
Transaction Level (Past 12 Months)<br />
Inventory Level<br />
Average Asking Price<br />
Average Days on Market<br />
EC135P2 EC135T2<br />
For Sale vs. Sold<br />
Sold For Sale<br />
PERFORMANCE<br />
Max Range<br />
Max Speed<br />
Typ. Passengers<br />
EC135P2<br />
332 N.M.<br />
614 km<br />
127 Knots<br />
6<br />
EC135T2<br />
332 N.M.<br />
614 km<br />
127 Knots<br />
6<br />
1 1<br />
1<br />
1<br />
1 1<br />
2<br />
1<br />
2<br />
1<br />
1<br />
1<br />
3<br />
SUPPLY<br />
No. for Sale<br />
Avg Asking Price<br />
Avg Days on Market<br />
Mar | Dec<br />
3 | 4<br />
2.6M USD<br />
2.9M USD<br />
278 | 265<br />
Mar | Dec<br />
1 | 0<br />
1.6M USD<br />
0.0M USD<br />
12 | 0<br />
8 8 8 5 5 5 8 8 9 9 10 10 10 9 9 7 6 6 6 5 6 4 3 3 4<br />
Mar May Jul Sep Nov Jan Mar May Jul Sep Nov Jan Mar<br />
2021 2022 <strong>2023</strong><br />
TRANSACTION<br />
Past 12 Months<br />
Past 3 Months<br />
Mar | Dec<br />
3 | 5<br />
0 | 1<br />
Mar | Dec<br />
8 | 8<br />
0 | 4<br />
EC145<br />
Average Asking Price (Million USD)<br />
Market Indicators (vs. Last Quarter)<br />
$2.9<br />
$3.1<br />
$3.1<br />
Transaction Level (Past 12 Months)<br />
Inventory Level<br />
$2.4<br />
$2.2<br />
$2.2<br />
$2.1<br />
Average Asking Price<br />
Average Days on Market<br />
For Sale vs. Sold<br />
Sold<br />
For Sale<br />
PERFORMANCE<br />
Max Range<br />
Max Speed<br />
Typ. Passengers<br />
461 N.M. / 855 km<br />
131 Knots<br />
9<br />
2 1<br />
2<br />
1<br />
5<br />
2 1 1 1<br />
2<br />
2<br />
SUPPLY<br />
No. for Sale<br />
Avg Asking Price<br />
Avg Days on Market<br />
Mar<br />
8 (0.9%)<br />
2.1M USD<br />
168<br />
Dec<br />
12 (1.4%)<br />
2.2M USD<br />
443<br />
7 8 8 7 5 5 5 9 9 10 10 9 9 10 10 10 10 10 10 11 13 12 7 8 8<br />
Mar May Jul Sep Nov Jan Mar May Jul Sep Nov Jan Mar<br />
2021 2022 <strong>2023</strong><br />
TRANSACTION<br />
Past 12 Months<br />
Past 3 Months<br />
Mar<br />
7<br />
4<br />
Dec<br />
5<br />
0<br />
Source: AMSTAT & ASG<br />
FIRST QUARTER <strong>2023</strong> — GLOBAL SKY QUARTERLY | 91
MARKET SUMMARY: CIVIL HELICOPTERS<br />
H155 & EC155B<br />
Average Asking Price (Million USD)<br />
EC155B<br />
H155<br />
Market Indicators (vs. Last Quarter)<br />
Average<br />
H155<br />
EC155B<br />
$3.4 $3.2<br />
$3.7<br />
$3.6<br />
$4.0 $4.0<br />
$4.0 Transaction Level (Past 12 Months)<br />
Inventory Level<br />
Average Asking Price<br />
$2.6<br />
For Sale vs. Sold<br />
Sold For Sale<br />
$2.4<br />
$2.4<br />
$2.4<br />
$1.5<br />
Average Days on Market<br />
PERFORMANCE<br />
Max Range<br />
Max Speed<br />
Typ. Passengers<br />
H155<br />
516 N.M.<br />
955 km<br />
150 Knots<br />
13<br />
EC155B<br />
516 N.M.<br />
955 km<br />
135 Knots<br />
13<br />
2<br />
3<br />
1<br />
3<br />
3<br />
3<br />
1<br />
1<br />
1 2 1<br />
1<br />
1<br />
SUPPLY<br />
No. for Sale<br />
Avg Asking Price<br />
Avg Days on Market<br />
Mar | Dec<br />
9 | 8<br />
4.0M USD<br />
4.0M USD<br />
1,153 | 1,199<br />
Mar | Dec<br />
2 | 3<br />
1.5M USD<br />
2.4M USD<br />
242 | 198<br />
10 12 11 12 13 12 10 8 8 9 10 10 9 8 10 11 10 12 12 11 11 11 12 11 11<br />
Mar May Jul Sep Nov Jan Mar May Jul Sep Nov Jan Mar<br />
2021 2022 <strong>2023</strong><br />
TRANSACTION<br />
Past 12 Months<br />
Past 3 Months<br />
Mar | Dec<br />
6 | 6<br />
1 | 3<br />
Mar | Dec<br />
1 | 0<br />
1 | 0<br />
H225<br />
Average Asking Price (Million USD)<br />
$9.0 $9.0<br />
Market Indicators (vs. Last Quarter)<br />
Transaction Level (Past 12 Months)<br />
Inventory Level<br />
$5.0<br />
$5.0<br />
$3.9<br />
Average Asking Price<br />
Average Days on Market<br />
$3.8<br />
$3.8<br />
PERFORMANCE<br />
For Sale vs. Sold<br />
Sold<br />
For Sale<br />
Max Range<br />
Max Speed<br />
Typ. Passengers<br />
452 N.M. / 837 km<br />
142 Knots<br />
19<br />
10<br />
1<br />
2 2<br />
1<br />
1<br />
3<br />
1 2<br />
2 3<br />
12 12 12 11 11 11 11 11 11 11 13 10 9 8 8 8 8 8 7 7 6 5 5 6 6<br />
Mar May Jul Sep Nov Jan Mar May Jul Sep Nov Jan Mar<br />
2021 2022 <strong>2023</strong><br />
SUPPLY<br />
No. for Sale<br />
Avg Asking Price<br />
Avg Days onMarket<br />
TRANSACTION<br />
Past 12 Months<br />
Past 3 Months<br />
Mar<br />
6 (3.4%)<br />
9.0M USD<br />
314<br />
Mar<br />
10<br />
0<br />
Dec<br />
5 (2.8%)<br />
9.0M USD<br />
279<br />
Dec<br />
12<br />
5<br />
Source: AMSTAT & ASG<br />
92 | GLOBAL SKY QUARTERLY — FIRST QUARTER <strong>2023</strong>
MARKET SUMMARY: CIVIL HELICOPTERS<br />
BELL 206 JETRANGER / LONGRANGER<br />
Average Asking Price (Million USD)<br />
$0.8<br />
$0.8<br />
$0.7<br />
$0.9<br />
Bell 206 LongRanger<br />
Bell 206 JetRanger<br />
Average<br />
$0.9 $0.9<br />
$0.9<br />
Market Indicators (vs. Last Quarter)<br />
Transaction Level (Past 12 Months)<br />
Inventory Level<br />
Average Asking Price<br />
Bell 206J Bell 206L<br />
$0.8<br />
Average Days on Market<br />
$0.5<br />
$0.5<br />
For Sale vs. Sold<br />
Sold For Sale<br />
$0.5<br />
$0.6<br />
$0.6<br />
$0.7<br />
PERFORMANCE<br />
Max Range<br />
Max Speed<br />
Typ. Passengers<br />
Bell 206J<br />
374 N.M.<br />
693 km<br />
121 Knots<br />
4<br />
Bell 206L<br />
270 N.M.<br />
500 km<br />
105 Knots<br />
6<br />
25 25<br />
19<br />
24 14 21<br />
7 16 21<br />
12 23<br />
13 16 21 24<br />
16 12 15 21 19 19 20 14 14<br />
4<br />
SUPPLY<br />
No. for Sale<br />
Avg Asking Price<br />
Avg Days on Market<br />
Mar | Dec<br />
64 | 62<br />
0.8M USD<br />
0.7M USD<br />
552 | 627<br />
Mar | Dec<br />
39 | 41<br />
0.9M USD<br />
0.9M USD<br />
460 | 410<br />
209 209 191 177 171 164 163 156 145 141 139 119 111 105 100 107 109 113 111 109 111 103 101 108 103<br />
Mar May Jul Sep Nov Jan Mar May Jul Sep Nov Jan Mar<br />
TRANSACTION<br />
Past 12 Months<br />
Past 3 Months<br />
Mar | Dec<br />
136 | 149<br />
22 | 45<br />
Mar | Dec<br />
63 | 70<br />
10 | 18<br />
2021 2022 <strong>2023</strong><br />
BELL 407<br />
Average Asking Price (Million USD)<br />
Market Indicators (vs. Last Quarter)<br />
$2.1<br />
$2.1<br />
$2.2<br />
$2.3<br />
$2.5<br />
$2.7<br />
$3.1<br />
Transaction Level (Past 12 Months)<br />
Inventory Level<br />
Average Asking Price<br />
Average Days on Market<br />
For Sale vs. Sold<br />
Sold For Sale<br />
11<br />
6<br />
4 5<br />
9<br />
2 6 11<br />
6<br />
6<br />
6<br />
5<br />
4 7 11<br />
7 4 8<br />
4<br />
3 6 5<br />
7 4<br />
68 66 64 61 59 53 55 57 50 37 32 28 27 27 24 24 25 34 27 26 26 25 26 28 32<br />
Mar May Jul Sep Nov Jan Mar May Jul Sep Nov Jan Mar<br />
2021 2022 <strong>2023</strong><br />
PERFORMANCE<br />
Max Range<br />
Max Speed<br />
Typ. Passengers<br />
SUPPLY<br />
No. for Sale<br />
Avg Asking Price<br />
Avg Days on Market<br />
TRANSACTION<br />
Past 12 Months<br />
Past 3 Months<br />
323 N.M. / 598 km<br />
132 Knots<br />
7<br />
Mar<br />
32 (1.9%)<br />
3.1M USD<br />
274<br />
Mar<br />
71<br />
16<br />
Dec<br />
25 (1.5%)<br />
3.1M USD<br />
299<br />
Dec<br />
71<br />
17<br />
Source: AMSTAT & ASG<br />
FIRST QUARTER <strong>2023</strong> — GLOBAL SKY QUARTERLY | 93
MARKET SUMMARY: CIVIL HELICOPTERS<br />
BELL 412EP/412HP<br />
Average Asking Price (Million USD)<br />
$8.3<br />
Bell 412 HP<br />
Bell 412 EP<br />
Average<br />
Market Indicators (vs. Last Quarter)<br />
Bell 412EP Bell 412HP<br />
Transaction Level (Past 12 Months)<br />
$3.1<br />
$5.4<br />
$4.7<br />
$5.6<br />
$4.9<br />
$3.5<br />
Inventory Level<br />
Average Asking Price<br />
Average Days on Market<br />
$2.6<br />
$2.6<br />
For Sale vs. Sold<br />
Sold For Sale<br />
$2.6<br />
$2.6<br />
$2.6 $2.6<br />
$2.1<br />
PERFORMANCE<br />
Max Range<br />
Max Speed<br />
Typ. Passengers<br />
Bell 412EP<br />
356 N.M. /<br />
659 km<br />
140 Knots<br />
9<br />
Bell 412HP<br />
349 N.M. /<br />
646 km<br />
133 Knots<br />
14<br />
1<br />
2<br />
2<br />
3<br />
2<br />
1<br />
3<br />
1<br />
2<br />
1<br />
1<br />
3<br />
1<br />
2<br />
2 2<br />
1<br />
2 1 1<br />
SUPPLY<br />
No. for Sale<br />
Avg Asking Price<br />
Avg Days on Market<br />
Mar | Dec<br />
16 | 17<br />
3.5M USD<br />
4.7M USD<br />
510 | 467<br />
Mar | Dec<br />
1 | 2<br />
2.1M USD<br />
2.3M USD<br />
109 | 361<br />
23 22 21 23 24 24 22 22 21 20 22 23 21 20 21 21 22 20 19 19 20 19 16 18 17<br />
Mar May Jul Sep Nov Jan Mar May Jul Sep Nov Jan Mar<br />
TRANSACTION<br />
Past 12 Months<br />
Past 3 Months<br />
Mar | Dec<br />
16 | 15<br />
3 | 4<br />
Mar | Dec<br />
1 | 0<br />
1 | 0<br />
2021 2022 <strong>2023</strong><br />
BELL 429<br />
Average Asking Price (Million USD)<br />
Market Indicators (vs. Last Quarter)<br />
$6.7<br />
$6.1<br />
Transaction Level (Past 12 Months)<br />
Inventory Level<br />
Average Asking Price<br />
$4.2 $4.2 $4.3<br />
$4.0<br />
$5.2<br />
Average Days on Market<br />
For Sale vs. Sold<br />
Sold For Sale<br />
4<br />
3<br />
1<br />
2<br />
1 1<br />
1<br />
2<br />
2<br />
3 1 1<br />
1 1<br />
1 2<br />
2<br />
1<br />
9 8 8 8 6 5 5 5 4 3 3 3 5 6 6 5 4 6 5 10 11 8 10 10 8<br />
Mar May Jul Sep Nov Jan Mar May Jul Sep Nov Jan Mar<br />
2021 2022 <strong>2023</strong><br />
PERFORMANCE<br />
Max Range<br />
Max Speed<br />
Typ. Passengers<br />
SUPPLY<br />
No. for Sale<br />
Avg Asking Price<br />
Avg Days on Market<br />
TRANSACTION<br />
Past 12 Months<br />
Past 3 Months<br />
368 N.M. / 681 km<br />
130 Knots<br />
7<br />
Mar<br />
8 (1.8%)<br />
6.1M USD<br />
290<br />
Mar<br />
17<br />
6<br />
Dec<br />
8 (1.8%)<br />
6.8M USD<br />
246<br />
Dec<br />
13<br />
4<br />
Source: AMSTAT & ASG<br />
94 | GLOBAL SKY QUARTERLY — FIRST QUARTER <strong>2023</strong>
MARKET SUMMARY: CIVIL HELICOPTERS<br />
AW109SP GRANDNEW<br />
Average Asking Price (Million USD)<br />
Market Indicators (vs. Last Quarter)<br />
$4.5 $4.5 $4.6<br />
$4.8 $3.9 $3.9<br />
$4.4<br />
Transaction Level (Past 12 Months)<br />
Inventory Level<br />
Average Asking Price<br />
Average Days on Market<br />
For Sale vs. Sold<br />
Sold<br />
For Sale<br />
PERFORMANCE<br />
Max Range<br />
Max Speed<br />
Typ. Passengers<br />
480 N.M. / 889 km<br />
130 Knots<br />
7<br />
1<br />
2<br />
1<br />
1<br />
1<br />
4<br />
2<br />
1<br />
1<br />
1<br />
4<br />
2<br />
3<br />
2<br />
1<br />
1<br />
2<br />
SUPPLY<br />
No. for Sale<br />
Avg Asking Price<br />
Avg Days on Market<br />
Mar<br />
12 (5.4%)<br />
4.4M USD<br />
221<br />
Dec<br />
10 (4.6%)<br />
3.9M USD<br />
189<br />
13 15 14 10 8 7 7 6 6 10 10 9 7 7 7 10 12 14 14 11 10 10 11 11 12<br />
Mar May Jul Sep Nov Jan Mar May Jul Sep Nov Jan Mar<br />
2021 2022 <strong>2023</strong><br />
TRANSACTION<br />
Past 12 Months<br />
Past 3 Months<br />
Mar<br />
15<br />
3<br />
Dec<br />
14<br />
3<br />
AW139<br />
Average Asking Price (Million USD)<br />
Market Indicators (vs. Last Quarter)<br />
$7.5 $7.5 $7.5<br />
Transaction Level (Past 12 Months)<br />
$6.8<br />
$5.7<br />
$5.1<br />
$5.8<br />
Inventory Level<br />
Average Asking Price<br />
Average Days on Market<br />
For Sale vs. Sold<br />
Sold For Sale<br />
2<br />
5<br />
3<br />
2<br />
1 1<br />
2<br />
4<br />
3 3<br />
1<br />
1 2<br />
4<br />
3<br />
3<br />
3<br />
6<br />
2<br />
3 2 3<br />
30 32 31 29 32 31 33 31 30 27 28 20 17 15 13 13 14 15 17 17 17 32 33 34 35<br />
Mar May Jul Sep Nov Jan Mar May Jul Sep Nov Jan Mar<br />
2021 2022 <strong>2023</strong><br />
PERFORMANCE<br />
Max Range<br />
Max Speed<br />
Typ. Passengers<br />
SUPPLY<br />
No. for Sale<br />
Avg Asking Price<br />
Avg Days on Market<br />
TRANSACTION<br />
Past 12 Months<br />
Past 3 Months<br />
568 N.M. / 1,052 km<br />
140 Knots<br />
15<br />
Mar<br />
35 (3.2%)<br />
7.5M USD<br />
267<br />
Mar<br />
27<br />
4<br />
Dec<br />
32 (2.9%)<br />
7.5M USD<br />
201<br />
Dec<br />
32<br />
6<br />
Source: AMSTAT & ASG<br />
FIRST QUARTER <strong>2023</strong> — GLOBAL SKY QUARTERLY | 95
MARKET SUMMARY: CIVIL HELICOPTERS<br />
S-76C+ / S-76C++<br />
Average Asking Price (Million USD)<br />
$3.3<br />
S76C+<br />
S76C++<br />
Average<br />
Market Indicators (vs. Last Quarter)<br />
S76C+ S76C++<br />
Transaction Level (Past 12 Months)<br />
$1.9<br />
$2.5<br />
$1.9<br />
$2.5<br />
$1.9<br />
$2.1<br />
$1.9<br />
$2.5<br />
$2.5<br />
$2.5<br />
$1.9<br />
$2.5<br />
$1.9<br />
Inventory Level<br />
Average Asking Price<br />
Average Days on Market<br />
For Sale vs. Sold<br />
Sold<br />
For Sale<br />
PERFORMANCE<br />
Max Range<br />
Max Speed<br />
Typ. Passengers<br />
S-76C+<br />
335 N.M. /<br />
620 km<br />
155 Knots<br />
12<br />
S-76C++<br />
335 N.M. /<br />
620 km<br />
155 Knots<br />
12<br />
5<br />
1<br />
1<br />
3<br />
1<br />
2<br />
5<br />
2<br />
3<br />
1<br />
4<br />
3 2<br />
1 1<br />
4<br />
SUPPLY<br />
No. for Sale<br />
Avg Asking Price<br />
Avg Days on Market<br />
Mar | Dec<br />
5 | 7<br />
2.5M USD<br />
2.5M USD<br />
1292 | 936<br />
Mar | Dec<br />
2 | 6<br />
1.9M USD<br />
1.9M USD<br />
293 | 415<br />
24 23 23 22 22 23 22 22 22 21 23 21 20 19 15 16 14 15 13 12 14 13 14 9 7<br />
Mar May Jul Sep Nov Jan Mar May Jul Sep Nov Jan Mar<br />
2021 2022 <strong>2023</strong><br />
TRANSACTION<br />
Past 12 Months<br />
Past 3 Months<br />
Mar | Dec<br />
9 | 7<br />
3 | 2<br />
Mar | Dec<br />
12 | 14<br />
2 | 7<br />
Source: AMSTAT & ASG<br />
96 | GLOBAL SKY QUARTERLY — FIRST QUARTER <strong>2023</strong>
CONNECT YOUR BRAND WITH OUR AUDIENCE<br />
Global <strong>Sky</strong> Media readers are business decision-makers in the<br />
business jet and general aviation industry from across the<br />
world. Our market intelligence helps the drive strategies for<br />
achieving their business goals. Through Global <strong>Sky</strong> Media's<br />
channels, you can connect with your target audience.<br />
Contact us to find out how we can help you.<br />
PUBLICATION ADVERTISING<br />
DIGITAL ADVERTISING<br />
CONTENT MARKETING<br />
EVENT MANAGEMENT<br />
www.globalsky.media<br />
media@globalsky.media<br />
FIRST QUARTER <strong>2023</strong> — GLOBAL SKY QUARTERLY | 97
Helicopters <strong>2023</strong><br />
WHAT<br />
The Global <strong>Sky</strong> Forum – Helicopters <strong>2023</strong><br />
will explore the helicopter market in Australia<br />
and New Zealand through panel discussions<br />
and fireside chats with industry leaders.<br />
WHEN<br />
The Global <strong>Sky</strong> Forum –<br />
Helicopters <strong>2023</strong> will run for<br />
two full days from the 12th to<br />
the 13th of September, <strong>2023</strong>.<br />
WHERE<br />
The Global <strong>Sky</strong> Forum –<br />
Helicopters <strong>2023</strong> will be held at<br />
The Hilton Brisbane, Australia,<br />
located in the heart of the city.<br />
98 | GLOBAL SKY QUARTERLY — FIRST QUARTER <strong>2023</strong><br />
Registration is now open – www.theglobalskyforum.com