Asian Sky Quarterly 2023 Q4

Create successful ePaper yourself
Turn your PDF publications into a flip-book with our unique Google optimized e-Paper software.
4TH QUARTER <strong>2023</strong><br />
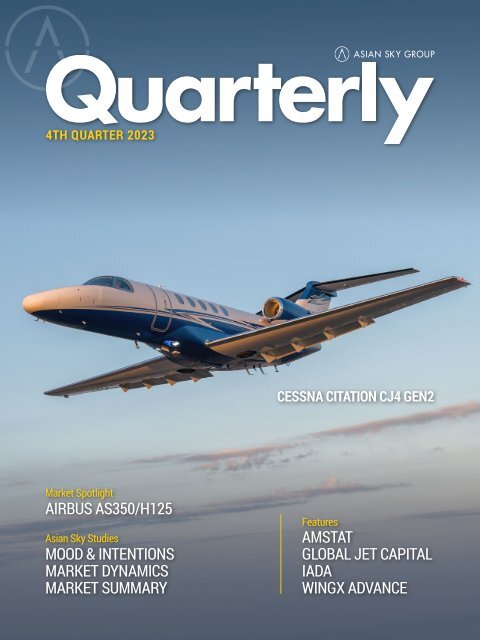
CESSNA CITATION CJ4 GEN2<br />
Market Spotlight<br />
AIRBUS AS350/H125<br />
<strong>Asian</strong> <strong>Sky</strong> Studies<br />
MOOD & INTENTIONS<br />
MARKET DYNAMICS<br />
MARKET SUMMARY<br />
Features<br />
AMSTAT<br />
GLOBAL JET CAPITAL<br />
IADA<br />
WINGX ADVANCE<br />
FOURTH QUARTER <strong>2023</strong> — ASIAN SKY QUARTERLY | I
EDITOR’S NOTE<br />
Balance, as any tightrope<br />
walker will tell you, is good.<br />
We use balance all of the<br />
time, from a balanced diet to<br />
ensure that we aren’t eating<br />
too unhealthily, to a work-life<br />
balance that ensures we get<br />
enough quality time away from<br />
the office.<br />
It is also good in the pre-owned private jet market, as it means<br />
that those that want to acquire an aircraft should be able to do so<br />
at a fair cost, whilst those selling should be able to get reasonable<br />
value during the sale. It also generally means that there is a<br />
reasonable number of aircraft available in the market, not too<br />
many, not too few, just the right amount.<br />
believe that the market balanced, we are likely to see new people<br />
coming into business aviation, and renewed interest from those<br />
that we put off by high prices and low demand that we saw over<br />
the past few years. And that’s a good thing for all of us.<br />
Of course, it’s not balanced across all models, but you’ll have to<br />
study the pages of this <strong>Quarterly</strong> yourself to find out which ones<br />
are, and which ones aren’t.<br />
But the fact that almost 50% of respondents now feel like we are<br />
in a balanced market is highly encouraging. In fact, it increased<br />
by a whopping 15% when compared to the previous quarter, with<br />
those feeling that we were in a sellers’ market declining by an<br />
even more whopping 23%. In fairness this percentage has been<br />
bouncing up and down over the past few quarters, much like a<br />
tightrope walker that has lost their balance.<br />
Having gone through the Covid years and seeing the market<br />
favor sellers, it looks like we are now entering a new phase, one<br />
that doesn’t favor sellers nor buyers. What this means is that we<br />
can start using a different term, one that is very rarely used in<br />
business aviation, and that term is ‘value’.<br />
Value of course is relative, and whilst to you and I it might seem<br />
alien to say that spending millions on a private jet is paying<br />
good value, prices of aircraft have come down from those Covid<br />
year highs we saw. Whether you call it stabilization or call it<br />
normalization doesn’t really matter, what matters is that if people<br />
In this <strong>Quarterly</strong> we have two Japanese features – the first on<br />
MRO Japan, which made its first foray into the world of corporate<br />
aviation when it won a maintenance contract for an EU registered<br />
Airbus ACJ318. The second is on a new FBO in Sapporo, Japan.<br />
Sapporo has been crying out for an FBO for many years, so we<br />
spoke with the airport authorities and Universal Aviation – which<br />
is managing the FBO – about the significance of its opening and<br />
the services that it offers.<br />
Elsewhere in this issue, and alongside the usual data and intel<br />
that you have come to rely on, our own Consultancy Services<br />
SPECIAL THANKS TO OUR CONTRIBUTORS AND SPONSORS<br />
II | ASIAN SKY QUARTERLY - FOURTH QUARTER <strong>2023</strong>
PUBLISHER<br />
Director Dennis Lau tackles the Airbus AS350/H125 family of<br />
helicopters, and take a deep dive into the aircraft’s current in<br />
service fleet, as well as taking a look into their value on the<br />
pre-owned market.<br />
To round off this <strong>Quarterly</strong> we have a feature from Dassault<br />
about the new Falcon 6X’s world tour. With the first few<br />
aircraft now in service, Dassault has been busy showing<br />
the aircraft to those that have already bought, as well as<br />
potential new customers. We were lucky enough to fly on<br />
the aircraft as it was positioning between cities on the tour,<br />
although you’ll have to wait for the Business Jet Fleet Report<br />
to read all about that. Spoiler alert, it was awesome!<br />
All the remains for me to do is to thank everybody that<br />
contributed to this report, especially AMSTAT, Global Jet<br />
Capital, IADA, WINGX and of course Textron, whose Citation<br />
CJ4 GEN2 beautifully graces the cover.<br />
EDITORIAL & MARKET RESEARCH<br />
Alud Davies<br />
Bowen Zhang<br />
Casper Zhuang<br />
Charlie Xu<br />
Cynthia Ning<br />
Dennis Lau<br />
Iris Lian<br />
Qianyun Zhou<br />
Samuel Gao<br />
Winny Cheng<br />
DESIGN<br />
Amy Liu-Lhuissier<br />
Zoe Xiao<br />
ADVERTISING/ENQUIRIES:<br />
Jerry Ho<br />
jerry@asianskygroup.com<br />
+852 9199 7751<br />
www.asianskygroup.com<br />
The materials and information provided by <strong>Asian</strong> <strong>Sky</strong> Group in<br />
this report are for reference only. While such information was<br />
compiled using the best available data as of December 31, <strong>2023</strong>, any<br />
information we provide about how we may interpret the data and<br />
market, or how certain issues may be addressed is provided generally<br />
without considering your specific circumstances. Such information<br />
should not be regarded as a substitute for professional advice.<br />
Independent professional advice should be sought before taking<br />
action on any matters to which information provided in this report may<br />
be relevant.<br />
Sincerely,<br />
Alud Davies<br />
Head of Research & Publications<br />
<strong>Asian</strong> <strong>Sky</strong> Group<br />
<strong>Asian</strong> <strong>Sky</strong> Group shall not be liable for any losses, damage, costs<br />
or expenses howsoever caused, arising directly or indirectly from<br />
the use of or inability to use this report or use of or reliance upon<br />
any information or material provided in this report or otherwise in<br />
connection with any representation, statement or information on or<br />
contained in this report.<br />
<strong>Asian</strong> <strong>Sky</strong> Group endeavors to ensure that the information contained<br />
in this report is accurate as at the date of publication, but does not<br />
guarantee or warrant its accuracy or completeness, or accept any<br />
liability of whatever nature for any losses, damage, costs or expenses<br />
howsoever caused, whether arising directly or indirectly from any error<br />
or omission in compiling such information. This report also uses third<br />
party information not compiled by <strong>Asian</strong> <strong>Sky</strong> Group. <strong>Asian</strong> <strong>Sky</strong> Group<br />
is not responsible for such information and makes no representation<br />
about the accuracy, completeness or any other aspect of information<br />
contained. The information, data, articles, or resources provided by<br />
any other parties do not in any way signify that <strong>Asian</strong> <strong>Sky</strong> Group<br />
endorses the same.<br />
FOURTH QUARTER <strong>2023</strong> — ASIAN SKY QUARTERLY | III
FUTURE<br />
FOCUSED<br />
On the ground and in the air, Gulfstream is<br />
innovating for a more sustainable future in flight.<br />
Follow our journey<br />
IV | ASIAN SKY QUARTERLY - FOURTH QUARTER <strong>2023</strong>
CONTENTS<br />
01<br />
ASIA-PACIFIC MOOD &<br />
INTENTIONS<br />
Results from our famous quarterly survey that<br />
asks respondents for their outlook on Asia-Pacific’s<br />
economic status, aircraft utilization, purchase and<br />
chartering intentions, and influencing factors shaping<br />
the current market.<br />
49<br />
FALCON 6X ENTERS SERVICE<br />
WITH BARNSTORMING<br />
WORLD TOUR<br />
DASSAULT AVIATION<br />
Dassualt's new Falcon 6X has now entered service,<br />
bringing with a raft of new comfort, safety and<br />
technology advancements.<br />
08<br />
ASIA-PACIFIC BUSINESS JET<br />
FLIGHT ACTIVITY<br />
WINGX ADVANCE<br />
51<br />
MRO JAPAN EXPANDS INTO<br />
CORPORATE AVIATION<br />
MRO JAPAN<br />
Asia-Pacific Business Jet Flight Activity <strong>2023</strong> <strong>Q4</strong> Review<br />
A look at MRO Japan and its business prospects for the<br />
corporate airliner market.<br />
17<br />
IADA MARKET REPORT<br />
The International Aircraft Dealer’s Association presents<br />
its fourth quarter market report.<br />
53<br />
SAPPORO OPENS LONG<br />
AWAITED FBO<br />
Sapporo Airport opened a new FBO to provide premium<br />
31<br />
AMSTAT GLOBAL PRE-OWNED<br />
MARKET UPDATE<br />
AMSTAT<br />
A review of the global market for pre-owned business<br />
jets and turboprops.<br />
55<br />
amenities for business aviation flights.<br />
MARKET DYNAMICS<br />
An analysis of global and Asia-Pacific inventory levels and<br />
market trends for the business jet and helicopter fleets.<br />
36<br />
GLOBAL BUSINESS AVIATION<br />
MARKET UPDATE<br />
GLOBAL JET CAPITAL<br />
66<br />
MARKET SUMMARY<br />
BUSINESS JETS<br />
41<br />
A quarterly market brief of global business jet market.<br />
MARKET SPOTLIGHT:<br />
AIRBUS AS350/H125<br />
A brief introduction to the Airbus AS350/H125 series, as<br />
86<br />
MARKET SUMMARY<br />
HELICOPTERS<br />
well as a comprehensive analysis of the in service fleet<br />
and pre-owned market.<br />
COVER IMAGE<br />
Cessna<br />
Citation CJ4 Gen2<br />
FOURTH QUARTER <strong>2023</strong> — ASIAN SKY QUARTERLY | V
ASIA-PACIFIC<br />
MOOD &<br />
INTENTIONS<br />
QUARTERLY SURVEY<br />
1 | ASIAN SKY QUARTERLY - FOURTH QUARTER <strong>2023</strong>
QUARTERLY SURVEY<br />
RESPONDENT BREAKDOWN<br />
Respondent's Business Location<br />
Oceania (11%)<br />
South Asia (11%)<br />
Rest of the World (21%)<br />
Top Business Operation Locations<br />
Singapore (4%)<br />
Germany (4%)<br />
Thailand (6%)<br />
Malaysia (6%)<br />
Indonesia (7%)<br />
Australia (10%)<br />
India (11%)<br />
72% of total<br />
respondents<br />
Middle East &<br />
North Africa (4%)<br />
Greater China (27%)<br />
Southeast &<br />
Northeast Asia (26%)<br />
Philippines (4%)<br />
Hong Kong SAR (19%)<br />
Mainland China (15%)<br />
United States (14%)<br />
<strong>Q4</strong> <strong>2023</strong> Survey Highlights<br />
MOOD & INTENTIONS: QUARTERLY SURVEY<br />
1. The overall percentage of respondents feeling optimistic about<br />
the regional economy has risen. Only Greater China and South<br />
Asia witnessed a decline in economic optimism.<br />
2. With the steady recovery of the regional economy, respondents<br />
that reported lower utilization has dropped. Southeast and<br />
Northeast Asia, South Asia, and Oceania saw an increase in<br />
aircraft utilization, while Greater China and the Middle East &<br />
North Africa saw lower utilization.<br />
3. Purchase intentions for new aircraft increased, whilst<br />
interest in pre-owned aircraft declined. Large jets were the<br />
most popular category for fixed-wing aircraft, with twin<br />
turbines for helicopters.<br />
4. The pre-owned aircraft market has reached balance to a<br />
certain extent, as half of respondents felt they were in a<br />
balanced market.<br />
5. The price of aircraft remained the top limiting factor that<br />
influenced purchasing decisions.<br />
6. Nearly half of the respondents said they will charter aircraft in the<br />
next three months.<br />
In <strong>Q4</strong> <strong>2023</strong>, almost 300 business aviation professionals<br />
participated in <strong>Asian</strong> <strong>Sky</strong> Group’s survey about the mood and<br />
intentions of the industry.<br />
The regions with the most respondents include:<br />
Respondent’s Related Aircraft Type<br />
Turbine Helicopter (19%)<br />
Business Turboprop<br />
(Such as King Air) (21%)<br />
Respondent’s Category<br />
Aircraft Owner /<br />
Charter User (16%)<br />
Piston Helicopter (7%)<br />
Business Jet (53%)<br />
Aircraft Operator /<br />
Management Company (32%)<br />
1. Greater China, mainly covering mainland China and Hong Kong<br />
SAR (27%)<br />
2. Southeast Asia and Northeast Asia (26%)<br />
3. Oceania (11%)<br />
4. South Asia (11%)<br />
5. Middle East and North Africa (4%)<br />
More than half (53%) of the respondents were from business jet<br />
related operations, while respondents related to business turboprops<br />
(21%) and turbine helicopters (19%) came second and third.<br />
A total of 32% of the respondents worked in an aircraft operator/<br />
management company, followed by services providers (FBO, MRO,<br />
etc.) (26%) and aircraft sales/charter broker (26%).<br />
Economic Outlook in the Region<br />
In <strong>Q4</strong> <strong>2023</strong>, the overall percentage of respondents that felt<br />
optimistic about the regional economies in Asia-Pacific, the Middle<br />
East and North Africa grew slightly to 79%.<br />
Aircraft Sales /<br />
Charter Broker (26%)<br />
73% of total<br />
respondents<br />
Service Providers 1<br />
(FBO, MRO, etc) (26%)<br />
In Asia-Pacific, the economic situation is challenging, with increased<br />
global demand for goods to services and monetary tightening<br />
across the region. Damage from global warming and natural<br />
disasters is increasing, especially for some of the vulnerable<br />
countries in Asia. Despite this, Asia-Pacific remains one of the most<br />
FOURTH QUARTER <strong>2023</strong> — ASIAN SKY QUARTERLY | 2
MOOD & INTENTIONS: QUARTERLY SURVEY<br />
dynamic regions in the world, and continues to contribute a large part<br />
of global growth. This growth is however slowing. China’s economy<br />
has a crucial impact on the whole region, and the pull effect of China's<br />
reopening for Asia-Pacific’s economy is weakening from its stronger<br />
position six months ago. In addition, China’s inflation remains low and<br />
well-below target, reflecting falling food and fuel prices. Across the<br />
region in South Asia, the risks of defaults and borrowing costs is rising<br />
whilst global demand is reducing, which weigh on its economic activity.<br />
Therefore, it can be seen from the survey that Greater China and South<br />
Asia were the only two subregions that showed a decline in economic<br />
optimism, dropping from 78% to 70%, and 92% to 89%, respectively. At<br />
the same time, Southeast & Northeast Asia, the Middle East & North<br />
Africa, and Oceania all saw a significant increase in optimism.<br />
Aircraft Utilization in the Region<br />
Overall, 64% of respondents stated that their aircraft utilization in <strong>Q4</strong><br />
<strong>2023</strong> had increased, with 26% reporting increased utilization of 20%<br />
or more, and 38% reporting an increased utilization of less than 20%.<br />
The respondents that stated a lower utilization dropped significantly to<br />
17% compared to previous quarters, with only 4% reporting decreased<br />
utilization of 20% or less. Economic recovery proceeded slowly but<br />
steadily, which stimulated the utilization of business aircraft.<br />
Purchase and Charter Intentions<br />
Although the overall intention of buying an aircraft did not see any<br />
significant changes from Q3, it is worth mentioning that as the<br />
regional economy improved, the number of respondents who intend<br />
to purchase new aircraft directly from an OEM increased to 29%, while<br />
those who preferred pre-owned aircraft dropped from 38% in Q3, to<br />
34% in <strong>Q4</strong>.<br />
Regarding the purchase intention of fixed wing aircraft, the most<br />
popular category were Large jets, of which 47% of respondents from<br />
Greater China and 38% of respondents from Middle East & North<br />
Africa were willing to buy. Medium Jets took second place, with 39%<br />
of respondents from South Asia selecting them as their first choice.<br />
When it came to rotary purchase intentions, Twin turbine helicopters<br />
were the most preferred category.<br />
According to the survey, about half of all respondents felt that the<br />
market is evenly balanced, with this percentage increasing sharply<br />
when compared to Q3. The respondents that considered themselves in<br />
a buyer’s market dropped to 21%, whilst the seller’s market increased<br />
to 26%, which indicates that the market has reached balance to a<br />
certain extent.<br />
Southeast and Northeast Asia, South Asia, and Oceania showed a<br />
growing optimistic trend of aircraft utilization, while Greater China<br />
and Middle East & North Africa lowered their optimistic levels.<br />
Forty eight percent of respondents plan to charter aircraft in the next<br />
three months, while 29% said that they would consider, and only 23%<br />
indicated that they will not be chartering an aircraft.<br />
ECONOMIC STATUS<br />
What is the Current Economic Situation where your Business Operates?<br />
27%<br />
30%<br />
41%<br />
40%<br />
40% 44%<br />
41%<br />
40%<br />
Past Low Point<br />
Optimistic<br />
55% 56% 46% 51%<br />
53%<br />
41%<br />
54%<br />
42%<br />
45%<br />
46%<br />
32%<br />
31%<br />
29%<br />
31% 24%<br />
27% 26%<br />
At Low Point<br />
26%<br />
Pessimistic<br />
32%<br />
16%<br />
17%<br />
15%<br />
14%<br />
24%<br />
28% 31%<br />
14%<br />
20%<br />
27% 23%<br />
21%<br />
Not Reached Low Point<br />
<strong>Q4</strong> 2020 Q1 2021 Q2 2021 Q3 2021 <strong>Q4</strong> 2021 Q1 2022 Q2 2022 Q3 2022 <strong>Q4</strong> 2022 Q1 <strong>2023</strong> Q2 <strong>2023</strong> Q3 <strong>2023</strong> <strong>Q4</strong> <strong>2023</strong><br />
3 | ASIAN SKY QUARTERLY - FOURTH QUARTER <strong>2023</strong>
MOOD & INTENTIONS: QUARTERLY SURVEY<br />
ECONOMIC STATUS<br />
Optimism Level Since <strong>Q4</strong> 2020 Regional Difference 2<br />
Greater China Southeast & Northeast Asia Middle East & North Africa Oceania South Asia Overall<br />
100%<br />
100% 100%<br />
90%<br />
80%<br />
70%<br />
77%<br />
75%<br />
89%<br />
84% 86%<br />
85%<br />
83%<br />
73%<br />
87%<br />
81%<br />
80%<br />
69%<br />
85%<br />
83%<br />
81%<br />
73%<br />
89%<br />
77%<br />
67%<br />
83%<br />
72%<br />
67%<br />
92%<br />
88%<br />
85%<br />
82%<br />
80%<br />
73%<br />
69% 69%<br />
88%<br />
83%<br />
75%<br />
83%<br />
70%<br />
92%<br />
78%<br />
73%<br />
72% 71%<br />
70%<br />
89%<br />
87%<br />
83%<br />
77%<br />
70%<br />
60%<br />
60%<br />
60%<br />
56%<br />
59%<br />
60%<br />
50%<br />
50%<br />
40%<br />
30%<br />
20%<br />
<strong>Q4</strong> 2020 Q1 2021 Q2 2021 Q3 2021 <strong>Q4</strong> 2021 Q1 2022 Q2 2022 Q3 2022 <strong>Q4</strong> 2022 Q1 <strong>2023</strong> Q2 <strong>2023</strong> Q3 <strong>2023</strong><br />
<strong>Q4</strong> <strong>2023</strong><br />
Rank the following factors that you think are critical to the future of business aviation:<br />
Cabin Sanitation<br />
Carbon Emissions<br />
Value for Price Paid<br />
Flexibility / Punctuality<br />
Customer Service<br />
Privacy<br />
Maintenance Support<br />
Factors<br />
Overall Rank<br />
Score<br />
(the lower the better)<br />
Value for Price Paid 1 2.6<br />
Flexibility / Punctuality 2 2.7<br />
Customer Service 3 2.8<br />
Maintenance Support 4 3.0<br />
Privacy 5 3.5<br />
Carbon Emissions 6 4.9<br />
Cabin Sanitation 7 5.2<br />
FOURTH QUARTER <strong>2023</strong> — ASIAN SKY QUARTERLY | 4
MOOD & INTENTIONS: QUARTERLY SURVEY<br />
PURCHASE AND CHARTER INTENTIONS<br />
Where do We Currently Stand in the Pre-owned Aircraft Market?<br />
Buyer’s Market Balanced Market Seller’s Market I’m not sure<br />
63%<br />
52%<br />
58%<br />
58%<br />
55%<br />
53%<br />
58%<br />
46%<br />
49%<br />
47%<br />
43%<br />
44%<br />
34%<br />
30%<br />
29%<br />
30%<br />
28% 26% 28%<br />
26%<br />
24%<br />
24%<br />
26%<br />
26%<br />
17%<br />
15% 19%<br />
18%<br />
20%<br />
23%<br />
15%<br />
16%<br />
16%<br />
16%<br />
15%<br />
10%<br />
8%<br />
11%<br />
8%<br />
8% 10%<br />
7%<br />
0% 0% 0%<br />
4%<br />
3%<br />
<strong>Q4</strong> 2020 Q1 2021 Q2 2021 Q3 2021 <strong>Q4</strong> 2021 Q1 2022 Q2 2022 Q3 2022 <strong>Q4</strong> 2022 Q1 <strong>2023</strong> Q2 <strong>2023</strong> Q3 <strong>2023</strong><br />
25%<br />
21%<br />
5%<br />
<strong>Q4</strong> <strong>2023</strong><br />
Purchase Intentions <strong>Q4</strong> 2020 - <strong>Q4</strong> <strong>2023</strong> 3<br />
Yes, a new aircraft Yes, a pre-owned aircraft No/I’m not sure<br />
56%<br />
55%<br />
55%<br />
52%<br />
53%<br />
46%<br />
43%<br />
23%<br />
22%<br />
22%<br />
22%<br />
26%<br />
22%<br />
24%<br />
23%<br />
23%<br />
22%<br />
30% 30%<br />
24%<br />
27%<br />
39%<br />
32%<br />
29%<br />
36%<br />
33%<br />
31%<br />
37%<br />
33%<br />
30%<br />
39% 39%<br />
38%<br />
34%<br />
27%<br />
23%<br />
37%<br />
34%<br />
29%<br />
<strong>Q4</strong> 2020 Q1 2021 Q2 2021 Q3 2021 <strong>Q4</strong> 2021 Q1 2022 Q2 2022 Q3 2022 <strong>Q4</strong> 2022 Q1 <strong>2023</strong> Q2 <strong>2023</strong> Q3 <strong>2023</strong><br />
<strong>Q4</strong> <strong>2023</strong><br />
5 | ASIAN SKY QUARTERLY - FOURTH QUARTER <strong>2023</strong>
MOOD & INTENTIONS: QUARTERLY SURVEY<br />
Purchase Intention - Regional Differences (Fixed Wing)<br />
Corporate Airliner<br />
Large Jet<br />
Medium Jet<br />
Small Jet<br />
Turboprop / Piston Fixed Wing<br />
Greater China<br />
18% 47%<br />
22%<br />
9% 4%<br />
Oceania<br />
14% 27% 23% 9%<br />
27%<br />
Southeast &<br />
Northeast Asia<br />
13% 32% 21%<br />
21%<br />
13%<br />
Middle East &<br />
North Africa<br />
25% 38%<br />
12%<br />
12%<br />
13%<br />
South Asia<br />
13%<br />
9% 39% 13% 26%<br />
Aircraft Purchase Intention - Fixed Wing<br />
Corporate Airliner<br />
(Such as ACJ, BBJ)<br />
Aircraft Purchase Intention - Rotary<br />
Twin Turbine Helicopter<br />
(Such as EC145/H145, AW139)<br />
Most Preferred<br />
Turboprop/<br />
Piston Fixed Wing<br />
(Such as King Air Series)<br />
Large Jet<br />
(Such as G650,<br />
Falcon 8X)<br />
Most Preferred<br />
Small Jet<br />
(Such as Citation Series,<br />
Hawker Series)<br />
Medium Jet<br />
(Such as Challenger 650)<br />
Piston Helicopter<br />
(Such as Robinson R22/R44)<br />
Single Turbine Helicopter<br />
(Such as AS350/H125, Bell 505)<br />
Purchase Decisions - Influencing Factors<br />
(Outer means more limited)<br />
Charter Intentions in Next Three Months<br />
Greater China<br />
Southeast & Northeast Asia<br />
Oceania<br />
Grand Total<br />
Government /<br />
Public Opinion<br />
No (23%)<br />
Inconvenient to use<br />
(limited operation)<br />
Availability of<br />
latest / sought after<br />
aircraft types<br />
Not sure/<br />
Considering (29%) Yes (48%)<br />
Necessity<br />
Price<br />
FOURTH QUARTER <strong>2023</strong> — ASIAN SKY QUARTERLY | 6
MOOD & INTENTIONS: QUARTERLY SURVEY<br />
FLEET UTILIZATION<br />
Aircraft Utilization Compared to 12 Months Ago 4<br />
100%<br />
Up by<br />
20% and more<br />
(>20%)<br />
17%<br />
28%<br />
32% 30%<br />
37% 35%<br />
39%<br />
29%<br />
26%<br />
50%<br />
0%<br />
Up by<br />
less than 20%<br />
(0 - 20%)<br />
The same (0%)<br />
Down by<br />
less than 20%<br />
(-20 - 0%)<br />
Down by<br />
20% or more<br />
(
ASIA-PACIFIC<br />
BUSINESS JET<br />
FLIGHT ACTIVITY<br />
<strong>Q4</strong> <strong>2023</strong> REVIEW<br />
Analysis by Samuel Gao<br />
WINGX is a data research and consulting company which provides actionable<br />
market intelligence to the global business aviation industry. Their interactive<br />
web-hosted dashboards provide their customers with the data-visualization they<br />
need to stay alert to market trends, keep tabs on market share, identify competitive<br />
threats and spot new sales opportunities. WINGX customers include aircraft<br />
operators, airframe, engine and avionics OEMs, airlines, maintenance providers,<br />
airports, fixed-based operators, satcom providers, fuel providers, legal advisors,<br />
leasing companies, banks, regulators, investors and private jet users.<br />
For further information and a free demo of their dashboards, please contact:<br />
Richard or Christoph at office@wingx-advance.com<br />
WINGX Data Source: ADSB and ATCs<br />
DATA BY<br />
FOURTH QUARTER <strong>2023</strong> — ASIAN SKY QUARTERLY | 8
FLIGHT ACTIVITY<br />
Asia-Pacific's business aircraft flight activity continued to<br />
increase in the final quarter of <strong>2023</strong>. It's encouraging to see more<br />
people traveling for business and going on vacation, indicating<br />
that the economy has not stagnated. Looking at the entire year,<br />
<strong>Q4</strong> of <strong>2023</strong> saw the highest number of business jet flights in<br />
Asia-Pacific in the whole year especially between October to<br />
December, which saw more than 8,000 departures each month.<br />
When compared to the full year of 2019, business jet departures<br />
in Asia-Pacific in <strong>2023</strong> increased by over 43%, and compared<br />
to the fourth quarter of 2019 it increased by around 40%. The<br />
average monthly number of business jet flights in <strong>2023</strong> was<br />
7,586, while in 2019 it was 5,297. Overall, the number of business<br />
jet flights in Asia-Pacific were more than 2,000 more per month<br />
on average in <strong>2023</strong> when compared to 2019.<br />
DEPARTURES FROM ASIA-PACIFIC<br />
2022 <strong>2023</strong><br />
YoY%<br />
9,000<br />
8,000<br />
51.1%<br />
7,000<br />
6,000<br />
5,000<br />
4,000<br />
3,000<br />
23.5%<br />
22.7%<br />
14.7%<br />
20.2% 19.7%<br />
14.7%<br />
2,000<br />
1,000<br />
0<br />
12.0%<br />
4.1%<br />
Jan Feb Mar Apr<br />
May Jun<br />
7.2%<br />
Jul<br />
Aug<br />
Sep<br />
Oct<br />
9.0%<br />
Nov<br />
6.7%<br />
Dec<br />
DEPARTURES BY WEEK<br />
2021 2022 <strong>2023</strong><br />
2,500<br />
2,000<br />
1,500<br />
1,000<br />
500<br />
0<br />
Jan Feb Mar Apr May Jun Jul<br />
Aug Sep<br />
Oct Nov<br />
Dec<br />
9 | ASIAN SKY QUARTERLY - FOURTH QUARTER <strong>2023</strong>
FLIGHT ACTIVITY<br />
In the fourth quarter of <strong>2023</strong>, business jet flights in Asia-Pacific mainly<br />
connected cities within the region, accounting for 69% of the total <strong>Q4</strong><br />
flight volume. Flights with a duration between 30 minutes and two<br />
hours accounted for over 60% of total <strong>Q4</strong> flights, compared to around<br />
58% in the previous quarter. Many of these flights were between cities<br />
in Southeast Asia, where frequent connections contributed to the<br />
overall increase in flights. While business jet flights departing from<br />
Asia-Pacific to other regions accounted for a small percentage, they<br />
still increased by approximately 3% compared to the previous quarter<br />
and by approximately 10% compared to the same period in 2022.<br />
INTERNATIONAL VS. DOMESTIC FLIGHTS<br />
FLIGHT DURATION, <strong>2023</strong> <strong>Q4</strong><br />
Domestic Flights<br />
International Flights<br />
More than 5 hours (8%)<br />
4 to 5 hours (3%) Max 30 min (9%)<br />
2022 <strong>Q4</strong><br />
69%, 15,391 31%, 6,872<br />
3 to 4 hours (7%)<br />
2 to 3 hours (13%)<br />
30 min to 1 hour (25%)<br />
<strong>2023</strong> <strong>Q4</strong><br />
69%, 16,922<br />
31%, 7,574<br />
1 to 2 hours (35%)<br />
0 5,000 10,000<br />
15,000 20,000<br />
25,000<br />
FOURTH QUARTER <strong>2023</strong> — ASIAN SKY QUARTERLY | 10
C<br />
M<br />
Y<br />
CM<br />
MY<br />
CY<br />
CMY<br />
K<br />
11 | ASIAN SKY QUARTERLY - FOURTH QUARTER <strong>2023</strong><br />
6X_Brighter_420x280_AS_uk.indd 1
FOURTH QUARTER <strong>2023</strong> — ASIAN SKY QUARTERLY | 12<br />
29/02/2024 18:11
FLIGHT ACTIVITY<br />
TOP 10 ROUTES WITHIN ASIA-PACIFIC, <strong>Q4</strong> <strong>2023</strong><br />
Beijing<br />
10<br />
Shanghai<br />
Ahmedabad<br />
Jamnagar<br />
7<br />
9<br />
3<br />
4<br />
Mumbai<br />
New Delhi<br />
6<br />
Jaipur<br />
Popularity Highest to Lowest<br />
Bangkok<br />
8<br />
Phuket<br />
Kuala Lumpur<br />
5<br />
1<br />
Singapore<br />
Jakarta<br />
TOP 10 DESTINATIONS OUTSIDE APAC<br />
Ranking Arrival City Country<br />
1 Dubai United Arab Emirates<br />
2 Honolulu United States<br />
3 Anchorage United States<br />
4 London United Kingdom<br />
5 Los Angeles United States<br />
6 San Francisco United States<br />
7 Almaty Kazakhstan<br />
8 Riyadh Saudi Arabia<br />
9 Abu Dhabi United Arab Emirates<br />
INCREASING POPULARITY<br />
Melbourne<br />
Sydney<br />
2<br />
10 Istanbul Turkey<br />
Note: The route map is for illustrative purposes only and may differ from the actual flight path.<br />
The most popular business jet routes in Asia-Pacific were<br />
concentrated in two areas: Southeast Asia and India. The proportion<br />
of business jet routes in India has been increasing year by year, and<br />
the market has remained relatively active. The Southeast Asia region,<br />
mainly led by Singapore, was also a concentrated area for business<br />
jet activity, with major routes including Singapore to Jakarta and<br />
Kuala Lumpur. Compared to the top business jet routes in Q3, we<br />
were surprised to see the Beijing to Shanghai route rejoin the top 10.<br />
Business jet routes in mainland China were dominant in Asia-Pacific<br />
before 2020, however due to the impact of the COVID-19 pandemic<br />
the recovery of the business jet industry within mainland China has<br />
been slower than in other parts of Asia-Pacific. With the continuous<br />
recovery of trade exchanges after the pandemic, business jet flights in<br />
mainland China should continue to increase in 2024.<br />
13 | ASIAN SKY QUARTERLY - FOURTH QUARTER <strong>2023</strong>
FLIGHT ACTIVITY<br />
The most popular destinations outside Asia-Pacific did not change<br />
much from Q3, with flights mainly heading out of the region to the<br />
Middle East and the United States. Anchorage, USA, as a midpoint<br />
between Asia and North America, is often used as a refueling stop<br />
for many business jets heading to the East Coast of North America.<br />
Additionally, the route from Maldives to Dubai is the most popular<br />
international business jet route from Asia-Pacific, with a flight time<br />
of approximately three to four hours.<br />
DEPARTURES BY OEM, <strong>Q4</strong> <strong>2023</strong><br />
Airbus (
FLIGHT ACTIVITY<br />
DEPARTURES BY COUNTRY<br />
Australia India Mainland China Japan Indonesia Thailand<br />
2,250<br />
2,000<br />
1,750<br />
1,500<br />
1,250<br />
1,000<br />
750<br />
500<br />
250<br />
0<br />
Jan<br />
23<br />
Feb<br />
23<br />
Mar<br />
23<br />
Apr<br />
23<br />
May<br />
23<br />
Jun<br />
23<br />
Jul<br />
23<br />
Aug<br />
23<br />
Sep<br />
23<br />
Oct<br />
23<br />
Nov<br />
23<br />
Dec<br />
23<br />
Australia and India were the most active countries for business jets<br />
in Asia-Pacific in <strong>2023</strong>. Business jet flights in these two countries<br />
began to increase from July and peaked in November. Mainland<br />
China experienced a small wave of growth in business jet activity<br />
in Q3 of <strong>2023</strong>, seeing its highest number of business jet flights for<br />
the whole year. Japan, Indonesia, and Thailand, while experiencing<br />
relatively stable changes throughout the year, still maintained leading<br />
positions in Asia-Pacific.<br />
TOP CITY FLIGHT ACTIVITY TRENDS<br />
In <strong>2023</strong>, Singapore was undoubtedly the most noteworthy city<br />
in Asia-Pacific. Situated close to the midpoint of the region, it is<br />
incredibly convenient for travel to Australia, East Asia, and even<br />
India. Its frequent connections with cities in Southeast Asia made<br />
it the city with the highest frequency of business jet activity,<br />
with a total of 4,521 departures throughout the year. Most of the<br />
business jet flights depart and land at Seletar (XSP) airport due<br />
to its excellent FBO and MRO services for business jets. Sydney<br />
also had a significant number of business jet flights, primarily for<br />
domestic routes within Australia, such as Melbourne, and flights<br />
to New Zealand. Mumbai and New Delhi remain on the list, making<br />
India the only country in Asia-Pacific with two cities in the top ten<br />
for business jet activity. Bangkok, Tokyo, and Hong Kong had similar<br />
numbers of business jet departures throughout the year, with around<br />
2,800 departures. Jakarta closely followed, with its main business jet<br />
destinations being Singapore, Surabaya, and Denpasar.<br />
Number of Departures YoY %<br />
Singapore (Seletar, Changi)<br />
Sydney (Kingsford Smith, Bankstown)<br />
153.3%<br />
121.4%<br />
83.7%<br />
24.0%<br />
18.8%<br />
385<br />
372<br />
428<br />
-2.9%<br />
401<br />
0.6%<br />
352<br />
8.5% 12.7%<br />
420 436<br />
370<br />
335<br />
-19.0% -6.2% -16.9%<br />
358 363<br />
301<br />
310<br />
316<br />
-3.5%<br />
329<br />
-11.4% -10.9%<br />
281<br />
277<br />
-19.9%<br />
262<br />
-3.1% -3.7% -0.9%<br />
338 319<br />
282<br />
8.9%<br />
378<br />
320<br />
342<br />
Jan<br />
23<br />
Feb<br />
23<br />
Mar<br />
23<br />
Apr<br />
23<br />
May<br />
23<br />
Jun<br />
23<br />
Jul<br />
23<br />
Aug<br />
23<br />
Sep<br />
23<br />
Oct<br />
23<br />
Nov<br />
23<br />
Dec<br />
23<br />
Jan<br />
23<br />
Feb<br />
23<br />
Mar<br />
23<br />
Apr<br />
23<br />
May<br />
23<br />
Jun<br />
23<br />
Jul<br />
23<br />
Aug<br />
23<br />
Sep<br />
23<br />
Oct<br />
23<br />
Nov<br />
23<br />
Dec<br />
23<br />
15 | ASIAN SKY QUARTERLY - FOURTH QUARTER <strong>2023</strong>
FLIGHT ACTIVITY<br />
Mumbai (Chhatrapati Shivaji)<br />
New Delhi (Indira Gandhi)<br />
147.6%<br />
67.9%<br />
36.4%<br />
32.0% 26.9%<br />
-2.9%<br />
359<br />
54.7%<br />
331<br />
30.6%<br />
337<br />
4.3%<br />
340<br />
32.1%<br />
325<br />
14.1%<br />
235<br />
45.8%<br />
258<br />
5.6%<br />
244<br />
21.2%<br />
269<br />
11.3%<br />
316<br />
26.5% 18.4%<br />
344<br />
354<br />
272<br />
322<br />
354<br />
268<br />
11.0% 9.5%<br />
242<br />
230<br />
-7.3%<br />
202<br />
292<br />
25.2%<br />
308<br />
27.5%<br />
334<br />
18.1%<br />
353<br />
-3.5%<br />
278<br />
Jan<br />
23<br />
Feb<br />
23<br />
Mar<br />
23<br />
Apr<br />
23<br />
May<br />
23<br />
Jun<br />
23<br />
Jul<br />
23<br />
Aug<br />
23<br />
Sep<br />
23<br />
Oct<br />
23<br />
Nov<br />
23<br />
Dec<br />
23<br />
Jan<br />
23<br />
Feb<br />
23<br />
Mar<br />
23<br />
Apr<br />
23<br />
May<br />
23<br />
Jun<br />
23<br />
Jul<br />
23<br />
Aug<br />
23<br />
Sep<br />
23<br />
Oct<br />
23<br />
Nov<br />
23<br />
Dec<br />
23<br />
Bangkok (Don Mueang, Suvarnabhumi)<br />
Tokyo (Haneda, Narita)<br />
107.0%<br />
74.1%<br />
44.2%<br />
29.2%<br />
17.9% 17.1%<br />
12.5%<br />
14.0%<br />
39.2%<br />
21.6%<br />
1.8%<br />
171.3%<br />
145.9%<br />
132.8% 134.1%<br />
70.3%<br />
52.9%<br />
34.0%<br />
65.7%<br />
22.9%<br />
-7.1%<br />
19.5% 19.9% -5.3%<br />
265<br />
249<br />
261<br />
239<br />
224<br />
205<br />
216<br />
236<br />
231<br />
236<br />
224<br />
278<br />
217<br />
209<br />
270<br />
309<br />
218<br />
208<br />
217<br />
232<br />
209<br />
270<br />
235<br />
266<br />
Jan<br />
23<br />
Feb<br />
23<br />
Mar<br />
23<br />
Apr<br />
23<br />
May<br />
23<br />
Jun<br />
23<br />
Jul<br />
23<br />
Aug<br />
23<br />
Sep<br />
23<br />
Oct<br />
23<br />
Nov<br />
23<br />
Dec<br />
23<br />
Jan<br />
23<br />
Feb<br />
23<br />
Mar<br />
23<br />
Apr<br />
23<br />
May<br />
23<br />
Jun<br />
23<br />
Jul<br />
23<br />
Aug<br />
23<br />
Sep<br />
23<br />
Oct<br />
23<br />
Nov<br />
23<br />
Dec<br />
23<br />
Hong Kong (Hong Kong Intl.)<br />
Jakarta (Halim Perdanakusuma, Soekarno-Hatta)<br />
229.1%<br />
164.3%<br />
154.2%<br />
277.9%<br />
61.1%<br />
91.2%<br />
128.8% 130.9% 198.8%<br />
67.7%<br />
73.8%<br />
-3.8%<br />
-9.3%<br />
23.7%<br />
-12.9% -15.3%<br />
-3.4%<br />
-11.7%<br />
-17.6%<br />
17.7%<br />
-9.4%<br />
-2.1%<br />
16.9%<br />
10.4%<br />
283<br />
222<br />
272<br />
291<br />
174<br />
218<br />
183<br />
224<br />
245<br />
223<br />
259<br />
227<br />
176<br />
188<br />
229<br />
194<br />
200<br />
226<br />
234<br />
239<br />
252<br />
238<br />
263<br />
233<br />
Jan<br />
23<br />
Feb<br />
23<br />
Mar<br />
23<br />
Apr<br />
23<br />
May<br />
23<br />
Jun<br />
23<br />
Jul<br />
23<br />
Aug<br />
23<br />
Sep<br />
23<br />
Oct<br />
23<br />
Nov<br />
23<br />
Dec<br />
23<br />
Jan<br />
23<br />
Feb<br />
23<br />
Mar<br />
23<br />
Apr<br />
23<br />
May<br />
23<br />
Jun<br />
23<br />
Jul<br />
23<br />
Aug<br />
23<br />
Sep<br />
23<br />
Oct<br />
23<br />
Nov<br />
23<br />
Dec<br />
23<br />
FOURTH QUARTER <strong>2023</strong> — ASIAN SKY QUARTERLY | 16
IADA MARKET REPORT<br />
FOURTH QUARTER <strong>2023</strong><br />
Once again, I’m pleased to present the Fourth Quarter IADA Market<br />
Report. The IADA Market Report has very quickly become an essential<br />
guide to the business aircraft marketplace.<br />
For that, I’m very proud.<br />
It’s essential because it combines the qualitative perspectives of IADA<br />
members from around the globe and the quantitative sales data from our<br />
Accredited Dealers and Certified Brokers, who buy and sell more business<br />
aircraft by dollar volume than the rest of the world’s dealers combined.<br />
In this report, you’ll discover that the market continues to follow<br />
the stabilization trajectory we’ve experienced throughout <strong>2023</strong>. Our<br />
quantitative and proprietary sales data shows that buyers and sellers<br />
are coming together on asking and offering prices, a change from the<br />
overheated conditions we’ve seen since the onset of the pandemic.<br />
While it’s been a solid quarter for our dealers and brokers, supply chains<br />
are still problematic. Some transactions are on hold because of a<br />
shortage of parts and lack of pre-buy slots, though the openings are<br />
growing. This will affect the first quarter of 2024, as we will see a<br />
backlog carryover.<br />
Projections for the next six months are affected by disruptions caused by<br />
global unrest, coupled with the traditional uncertainty associated with a<br />
U.S. presidential election year.<br />
I hope you find this Market Report as valuable as I do. It’s my pleasure to<br />
present it to you, and I look forward to doing so again in the first quarter<br />
of 2024.<br />
Onward and upward,<br />
WAYNE STARLING<br />
Executive Director, IADA<br />
17 | ASIAN SKY QUARTERLY - FOURTH QUARTER <strong>2023</strong>
IADA MARKET REPORT<br />
BACKGROUND ON RESPONDENTS<br />
IADA Products and Services Members are part of our collective<br />
network and represent a breadth of members that provide<br />
comprehensive services, including transactions, operation,<br />
maintenance, insurance, and financing and leasing. Together, they<br />
offer a unique perspective on the current state of the industry as well<br />
as an informed point of view on projections for the next six months.<br />
CURRENT ROLE OF SURVEY RESPONDENTS<br />
CURRENT SALES MARKET OF SURVEY RESPONDENTS<br />
DEALER/BROKER<br />
FINANCE/LEASE PROVIDER<br />
INSURANCE PROVIDER<br />
ESCROW AGENT<br />
LEGAL/TRUST/TAX/TITLE<br />
PRE-OWNED AIRCRAFT SALES<br />
BOTH NEW AND<br />
PRE-OWNED AIRCRAFT SALES<br />
OPERATION<br />
MAINTENANCE<br />
MARKETS THAT MEMBERS DO BUSINESS IN<br />
96% of IADA dealers<br />
do business in<br />
NORTH AMERICA<br />
72% of IADA dealers<br />
do business in<br />
EUROPE<br />
46% of IADA dealers<br />
do business in<br />
ASIA AND PACIFIC<br />
61% of IADA dealers<br />
do business in<br />
LATIN AMERICA/CARIBBEAN<br />
46% of IADA dealers<br />
do business in<br />
AFRICA<br />
46% of IADA dealers<br />
do business in<br />
MIDDLE EAST<br />
WHO IS DRIVING TODAY’S MARKET<br />
Based on survey responses<br />
SELLERS<br />
BUYERS<br />
FOURTH QUARTER <strong>2023</strong> — ASIAN SKY QUARTERLY | 18
IADA MARKET REPORT<br />
GENERAL MARKET CONDITIONS<br />
The following charts provide insights into IADA members’<br />
assessments of the current and projected market conditions<br />
and are derived from our proprietary online quarterly surveys.<br />
Responses are aggregated and reported on a 1- 5 scale, with a<br />
score of 1 representing “Worst Ever” and 5 representing “Best Ever.”<br />
OVERALL MARKET CONDITIONS | <strong>Q4</strong> YEAR OVER YEAR<br />
On a 1-5 scale, with 1 meaning “worst ever” and 5 meaning “best ever”<br />
<strong>Q4</strong> <strong>2023</strong> <strong>Q4</strong> 2022<br />
What is your assessment of the current<br />
business aircraft sales market?<br />
3.2<br />
3.6<br />
What is your projection for the business<br />
aircraft sales market six months from now?<br />
3.0<br />
3.0<br />
What is your projection for the business aircraft<br />
finance/leasing market six months from now?<br />
2.5<br />
2.7<br />
What is your projection for the business aircraft<br />
insurance market six months from now? (This is a new survey question as of Q1 <strong>2023</strong>)<br />
2.6<br />
CURRENT MARKET<br />
ASSESSMENT OF THE CURRENT BUSINESS AIRCRAFT SALES MARKET<br />
On a 1-5 scale, with 1 meaning “worst ever” and 5 meaning “best ever”<br />
BEST EVER<br />
5<br />
4<br />
3.6<br />
3.6<br />
3.8<br />
3.3<br />
3.2<br />
NORMAL<br />
3<br />
2<br />
WORST EVER<br />
1<br />
<strong>Q4</strong> 2022 Q1 <strong>2023</strong> Q2 <strong>2023</strong> Q3 <strong>2023</strong> <strong>Q4</strong> <strong>2023</strong><br />
19 | ASIAN SKY QUARTERLY - FOURTH QUARTER <strong>2023</strong>
IADA MARKET REPORT<br />
AIRCRAFT SALES MARKET PROJECTIONS 6 MONTHS FROM NOW<br />
On a 1-5 scale, with 1 meaning “worst ever” and 5 meaning “best ever”<br />
SALES<br />
BEST EVER<br />
5<br />
4<br />
3.6<br />
NORMAL<br />
3<br />
3<br />
3.2<br />
3 3<br />
2<br />
WORST EVER<br />
1<br />
<strong>Q4</strong> 2022 Q1 <strong>2023</strong> Q2 <strong>2023</strong> Q3 <strong>2023</strong> <strong>Q4</strong> <strong>2023</strong><br />
AIRCRAFT FINANCE/LEASING MARKET PROJECTIONS 6 MONTHS FROM NOW<br />
On a 1-5 scale, with 1 meaning “worst ever” and 5 meaning “best ever”<br />
FINANCE/LEASING<br />
BEST EVER<br />
5<br />
4<br />
3.3<br />
NORMAL<br />
3<br />
2.6<br />
2.9<br />
2.6<br />
2.7<br />
2<br />
WORST EVER<br />
1<br />
<strong>Q4</strong> 2022 Q1 <strong>2023</strong> Q2 <strong>2023</strong> Q3 <strong>2023</strong> <strong>Q4</strong> <strong>2023</strong><br />
AIRCRAFT INSURANCE MARKET PROJECTIONS 6 MONTHS FROM NOW<br />
(This is a new survey question as of Q1 <strong>2023</strong>)<br />
On a 1-5 scale, with 1 meaning “worst ever” and 5 meaning “best ever”<br />
BEST EVER<br />
5<br />
INSURANCE<br />
4<br />
3.3<br />
NORMAL<br />
3<br />
2.9<br />
2.9<br />
2.5<br />
2.6<br />
2<br />
WORST EVER<br />
1<br />
<strong>Q4</strong> 2022 Q1 <strong>2023</strong> Q2 <strong>2023</strong> Q3 <strong>2023</strong> <strong>Q4</strong> <strong>2023</strong><br />
FOURTH QUARTER <strong>2023</strong> — ASIAN SKY QUARTERLY | 20
IADA MEMBER INSIGHTS<br />
Brokers/Consultants are as busy as ever working to put<br />
together deals; now we just need buyers willing to pull<br />
the trigger and buy. In short, we have a pricing chasm<br />
between most buyers and most sellers. Most buyers are<br />
not in a hurry because they are waiting for lower prices<br />
or even the big “correction,” and most sellers are not in a<br />
hurry because they are under no financial duress to sell<br />
and don’t feel the need to lower their expectations.<br />
FRANK JANIK<br />
LEADING EDGE SOLUTIONS // IADA ACCREDITED DEALER<br />
Certain markets are more balanced; some markets continue<br />
to be low inventory and more seller-driven, but in general<br />
a much more balanced market is coming into place.<br />
LEE ROHDE<br />
ESSEX AVIATION // IADA ACCREDITED DEALER<br />
After 2022, when the industry saw an unsustainable<br />
number of business and transactions, we have begun to<br />
shift back to a normal market. The market is teetering<br />
on whether it’s a buyer’s market or a seller’s market.<br />
However, instability doesn’t help our business either.<br />
KYLE WAGMAN<br />
LEADING EDGE AVIATION SOLUTIONS // IADA ACCREDITED DEALER<br />
21 | ASIAN SKY QUARTERLY - FOURTH QUARTER <strong>2023</strong>
IADA MARKET REPORT<br />
6-MONTH MARKET SECTOR OUTLOOK<br />
The following charts are derived from a series of questions seeking<br />
IADA members’ perspectives on specific sectors of the pre-owned<br />
aircraft market. Responses regarding the outlook for the next<br />
six months are aggregated and reported on a 1-5 scale, with 1<br />
representing “Significant Decrease,” and 5 representing “Significant<br />
Increase.”<br />
PRICING<br />
PRICING PROJECTIONS FOR THE NEXT 6 MONTHS<br />
On a 1-5 scale, with 1 meaning “significant decrease” and 5 meaning “significant increase”<br />
TURBOPROP<br />
LIGHT JET<br />
MIDSIZE JET<br />
LARGE JET+<br />
5<br />
SIGNIFICANT<br />
INCREASE<br />
0%<br />
0% 0% 0%<br />
4<br />
SLIGHT<br />
INCREASE<br />
3%<br />
4% 4%<br />
2%<br />
30%<br />
18% 20%<br />
3<br />
STABLE<br />
41%<br />
2<br />
SLIGHT<br />
DECREASE<br />
55%<br />
65% 71% 57%<br />
1<br />
SIGNIFICANT<br />
DECREASE<br />
1% 2%<br />
7%<br />
21%<br />
PRICING PROJECTIONS OVER THE LAST YEAR, BY QUARTER<br />
All averages fall between 2 (“slight decrease”) and 4 (“slight increase”).<br />
4<br />
SLIGHT<br />
INCREASE<br />
<strong>Q4</strong> '22 Q1 '23 Q2 '23 Q3 '23 <strong>Q4</strong> '23<br />
TURBOPROP<br />
LIGHT JET<br />
3<br />
STABLE<br />
MIDSIZE JET<br />
2.5<br />
2<br />
SLIGHT<br />
DECREASE<br />
2.3<br />
2.2<br />
2.0<br />
LARGE &<br />
ULTRA - LONG -<br />
RANGE JET<br />
FOURTH QUARTER <strong>2023</strong> — ASIAN SKY QUARTERLY | 22
IADA MARKET REPORT<br />
SUPPLY<br />
SUPPLY PROJECTIONS FOR THE NEXT 6 MONTHS<br />
On a 1-5 scale, with 1 meaning “significant decrease” and 5 meaning “significant increase”<br />
TURBOPROP LIGHT JET MIDSIZE JET LARGE JET+<br />
5<br />
SIGNIFICANT<br />
INCREASE<br />
5%<br />
7%<br />
9%<br />
15%<br />
4<br />
SLIGHT<br />
INCREASE<br />
64% 74% 70% 61%<br />
28%<br />
12%<br />
12%<br />
19%<br />
3<br />
STABLE<br />
2<br />
SLIGHT<br />
DECREASE<br />
3%<br />
6%<br />
9%<br />
5%<br />
1<br />
SIGNIFICANT<br />
DECREASE<br />
0%<br />
0% 0% 0%<br />
SUPPLY PROJECTIONS OVER THE LAST YEAR, BY QUARTER<br />
All averages fall between 2 (“slight decrease”) and 4 (“slight increase”).<br />
<strong>Q4</strong> '22 Q1 '23 Q2 '23 Q3 '23 <strong>Q4</strong> '23<br />
4<br />
SLIGHT<br />
INCREASE<br />
3.9<br />
3.8<br />
3.8<br />
3.7<br />
TURBOPROP<br />
LIGHT JET<br />
3<br />
STABLE<br />
MIDSIZE JET<br />
2<br />
SLIGHT<br />
DECREASE<br />
LARGE &<br />
ULTRA - LONG -<br />
RANGE JET<br />
23 | ASIAN SKY QUARTERLY - FOURTH QUARTER <strong>2023</strong>
WILLINGNESS TO INVENTORY PROJECTIONS FOR THE NEXT 6 MONTHS<br />
On a 1-5 scale, with 1 meaning “significant decrease” and 5 meaning “significant increase”<br />
IADA MARKET REPORT<br />
WILLINGNESS TO INVENTORY<br />
TURBOPROP LIGHT JET MIDSIZE JET LARGE JET+<br />
SIGNIFICANT<br />
5 0%<br />
INCREASE<br />
0%<br />
0%<br />
0%<br />
4<br />
SLIGHT<br />
INCREASE<br />
14%<br />
12%<br />
13%<br />
10%<br />
3<br />
STABLE<br />
48% 47% 36% 39%<br />
2<br />
SLIGHT<br />
DECREASE<br />
34% 38% 42%<br />
42%<br />
1<br />
SIGNIFICANT<br />
DECREASE<br />
3%<br />
3%<br />
9%<br />
10%<br />
WILLINGNESS TO INVENTORY PROJECTIONS OVER THE LAST YEAR, BY QUARTER<br />
All averages fall between 2 (“slight decrease”) and 4 (“slight increase”).<br />
<strong>Q4</strong> '22 Q1 '23 Q2 '23 Q3 '23 <strong>Q4</strong> '23<br />
4<br />
SLIGHT<br />
INCREASE<br />
TURBOPROP<br />
LIGHT JET<br />
3<br />
STABLE<br />
2.7<br />
2.7<br />
2.5<br />
2.5<br />
MIDSIZE JET<br />
2<br />
SLIGHT<br />
DECREASE<br />
LARGE &<br />
ULTRA - LONG -<br />
RANGE JET<br />
FOURTH QUARTER <strong>2023</strong> — ASIAN SKY QUARTERLY | 24
IADA MARKET REPORT<br />
DEMAND<br />
DEMAND PROJECTIONS FOR THE NEXT 6 MONTHS<br />
On a 1-5 scale, with 1 meaning “significant decrease” and 5 meaning “significant increase”<br />
TURBOPROP LIGHT JET MIDSIZE JET LARGE JET+<br />
5<br />
SIGNIFICANT<br />
INCREASE<br />
0% 0%<br />
0% 0%<br />
4<br />
SLIGHT<br />
INCREASE<br />
16%<br />
16%<br />
15% 9%<br />
3<br />
STABLE<br />
58% 52% 49% 44%<br />
2<br />
SLIGHT<br />
DECREASE<br />
26%<br />
33% 35%<br />
44%<br />
1<br />
SIGNIFICANT<br />
DECREASE<br />
0% 0%<br />
1% 4%<br />
DEMAND PROJECTIONS OVER THE LAST YEAR, BY QUARTER<br />
All averages fall between 2 (“slight decrease”) and 4 (“slight increase”).<br />
<strong>Q4</strong> '22 Q1 '23 Q2 '23 Q3 '23 <strong>Q4</strong> '23<br />
4<br />
SLIGHT<br />
INCREASE<br />
TURBOPROP<br />
LIGHT JET<br />
3<br />
STABLE<br />
2.9<br />
2.8*<br />
2.8*<br />
2.6<br />
MIDSIZE JET<br />
2<br />
SLIGHT<br />
DECREASE<br />
LARGE &<br />
ULTRA - LONG -<br />
RANGE JET<br />
*Note: Light and Midsize Jet data results are identical.<br />
25 | ASIAN SKY QUARTERLY - FOURTH QUARTER <strong>2023</strong>
IADA MARKET REPORT<br />
MONTHLY ACTIVITY REPORTS<br />
The Year <strong>2023</strong> closed out much as expected, with the typical seasonal<br />
surge of deal activity. With some 60 IADA dealers reporting, the<br />
number of Closed Deals grew to 554 aircraft in <strong>Q4</strong> <strong>2023</strong>, up 18%<br />
year over year with 289 deals recorded in December alone. Closed<br />
Deals in <strong>Q4</strong> <strong>2023</strong> represented 39% of the full year’s activity, up<br />
somewhat from 34% in 2022 and 37% in 2021. For the full year <strong>2023</strong>,<br />
deal volume was essentially flat year over year, with the market<br />
providing additional inventory for consideration, some of it at lower<br />
prices than has been the norm over the past few years. In general,<br />
we believe that this reflects the rebalancing of demand and supply<br />
forces in an ever evolving but healthy marketplace.<br />
IADA DEALER ACTIVITY REPORT<br />
<strong>Q4</strong> <strong>2023</strong> Q3 <strong>2023</strong> Q2 <strong>2023</strong> Q1 <strong>2023</strong> <strong>Q4</strong> 2022<br />
NEW ACQUISITION AGREEMENTS<br />
127<br />
118<br />
128<br />
166<br />
169<br />
127<br />
IN <strong>Q4</strong> <strong>2023</strong><br />
RETAINED TO SELL EXCLUSIVELY<br />
204<br />
229<br />
216<br />
197<br />
212<br />
204<br />
IN <strong>Q4</strong> <strong>2023</strong><br />
LOWERED PRICE<br />
76<br />
67<br />
73<br />
52<br />
45<br />
76<br />
IN <strong>Q4</strong> <strong>2023</strong><br />
FELL APART<br />
52<br />
44<br />
55<br />
53<br />
48<br />
52<br />
IN <strong>Q4</strong> <strong>2023</strong><br />
UNDER CONTRACT<br />
258<br />
262<br />
236<br />
206<br />
227<br />
258<br />
IN <strong>Q4</strong> <strong>2023</strong><br />
CLOSED DEALS<br />
239<br />
324<br />
305<br />
470<br />
554<br />
554<br />
IN <strong>Q4</strong> <strong>2023</strong><br />
0 100 200 300 400 500 600<br />
FOURTH QUARTER <strong>2023</strong> — ASIAN SKY QUARTERLY | 26
IADA MARKET REPORT<br />
IADA DEALER ACTIVITY YEAR TOTAL COMPARISON<br />
<strong>Q4</strong> 2022 YEAR TOTAL<br />
<strong>Q4</strong> <strong>2023</strong> YEAR TOTAL<br />
NEW ACQUISITION AGREEMENTS<br />
688<br />
539<br />
RETAINED TO SELL EXCLUSIVELY<br />
723<br />
846<br />
LOWERED PRICE<br />
104<br />
268<br />
FELL APART<br />
175<br />
108<br />
UNDER CONTRACT<br />
972<br />
962<br />
CLOSED DEALS<br />
1399<br />
1422<br />
27 | ASIAN SKY QUARTERLY - FOURTH QUARTER <strong>2023</strong>
IADA MARKET REPORT<br />
TOTAL CLOSED DEALS BY QUARTER<br />
2020 2021 2022 <strong>2023</strong><br />
554<br />
501<br />
470<br />
554<br />
124<br />
213<br />
288<br />
239<br />
174<br />
316 310 305<br />
283<br />
340 331 324<br />
Q1 Q2 Q3 <strong>Q4</strong><br />
TOTAL CLOSED DEALS BY QUARTER, YEAR OVER YEAR<br />
124<br />
213<br />
554<br />
2020<br />
1,135<br />
174<br />
501<br />
2021<br />
1,370<br />
316<br />
283<br />
34<br />
Q1 Q2 Q3 <strong>Q4</strong><br />
Q1 Q2 Q3 <strong>Q4</strong><br />
288<br />
239<br />
470<br />
2022<br />
1,399<br />
310<br />
554<br />
<strong>2023</strong><br />
1,422<br />
305<br />
331<br />
324<br />
Q1 Q2 Q3 <strong>Q4</strong><br />
Q1 Q2 Q3 <strong>Q4</strong><br />
FOURTH QUARTER <strong>2023</strong> — ASIAN SKY QUARTERLY | 28
CONCLUDING THOUGHTS<br />
In <strong>2023</strong>, the pre-owned business aircraft market<br />
continued to transition toward a Great Rebalancing<br />
of supply and demand. Today, prospective customers<br />
convinced of the value of pre-owned business aircraft<br />
are encouraged by freshly available inventory at prices<br />
off of recent historical highs. Much needed capacity<br />
within the maintenance, repair and overhaul (MRO)<br />
industry has become available for timely pre-purchase<br />
inspections, providing additional peace of mind for all<br />
parties in the aircraft transactions process.<br />
With healthy OEM order backlogs, strong flight<br />
operations activity and significant investments<br />
in MRO capacity expansion, the stage is set for<br />
continued growth in the pre-owned business aircraft<br />
market. As the world’s only accredited aircraft dealers<br />
and certified brokers, IADA members are exceptionally<br />
well positioned to service customers at the forefront<br />
of the growing business aviation industry.<br />
29 | ASIAN SKY QUARTERLY - FOURTH QUARTER <strong>2023</strong>
FOURTH QUARTER <strong>2023</strong> — ASIAN SKY QUARTERLY | 30
GLOBAL<br />
PRE-OWNED<br />
MARKET UPDATE<br />
Andrew Young, AMSTAT General Manager said, “Pre-owned inventories continue to head back to historical norms and so do pre-owned<br />
transactions, causing median values to trend downward. This has been most pronounced in the Super-Mid Jets.”<br />
31 | ASIAN SKY QUARTERLY - FOURTH QUARTER <strong>2023</strong>
GLOBAL PRE-OWNED MARKET UPDATE<br />
Using data derived from their Premier+ and Aircraft Valuation Tool<br />
services, AMSTAT provides an update on the pre-owned business<br />
aircraft market. Important note: the timing of this update is such that<br />
transaction data for the end of <strong>2023</strong> is still coming in. While most of<br />
the data has been received, it is likely that transaction counts will go<br />
up slightly once all the data is in. There were 17% fewer transactions<br />
recorded in <strong>2023</strong> than in 2022 and this transaction count is 11%<br />
below the 5-year average. Pre-owned inventory is up 27% year-overyear<br />
but remains below 10-year average levels. Higher supply and<br />
slowing demand continue to put downward pressure on values and<br />
the short-term median value for business aircraft has dropped 6%<br />
year-over-year and 8% over the last six months.<br />
BUSINESS JETS - RESALE RETAIL TRANSACTIONS<br />
2021 2022 <strong>2023</strong><br />
600<br />
500<br />
400<br />
Pending final <strong>2023</strong> data, the pre-owned business jets<br />
transaction count for <strong>2023</strong> was 15% lower than 2022 and<br />
10% below the 5-year average. <strong>2023</strong> pre-owned transaction<br />
levels will likely end in line with 2019 and 2020.<br />
300<br />
200<br />
100<br />
0<br />
Jan Feb Mar Apr May Jun Jul Aug Sep Oct Nov Dec*<br />
BUSINESS TURBOPROPS - RESALE RETAIL TRANSACTIONS<br />
250<br />
200<br />
2021 2022 <strong>2023</strong><br />
The pre-owned business turboprop transaction count for <strong>2023</strong><br />
was 20% lower than 2022 and 13% below the 5-year average.<br />
<strong>2023</strong> pre-owned transaction levels will likely end in line with<br />
2019 and 2020.<br />
150<br />
100<br />
50<br />
0<br />
Jan Feb Mar Apr May Jun Jul Aug Sep Oct Nov Dec*<br />
BUSINESS JETS & TURBOPROPS FOR SALE / LEASE<br />
Jets<br />
1,800<br />
1,600<br />
1,400<br />
1,200<br />
1,000<br />
800<br />
600<br />
400<br />
Jan<br />
<strong>2023</strong><br />
*Preliminary Data<br />
Turboprop<br />
Feb Mar Apr May Jun Jul Aug Sep Oct Nov Dec Jan<br />
2024<br />
The inventory of pre-owned<br />
business jets for sale is up 29%<br />
year-over-year. While this change<br />
is significant, only 6.1% of the<br />
active fleet is for sale compared<br />
to a 10-year average of 8.8%.<br />
The inventory of pre-owned<br />
turboprops for sale is up 24%<br />
year-over-year. Today, 4% of the<br />
active fleet of turboprops is<br />
for sale, compared to a 10-year<br />
average of 6.6%.<br />
FOURTH QUARTER <strong>2023</strong> — ASIAN SKY QUARTERLY | 32
GLOBAL PRE-OWNED MARKET UPDATE<br />
HEAVY JETS - SHORT TERM MEDIAN VALUE CHANGE<br />
35%<br />
Increase Decrease Total<br />
30%<br />
25%<br />
20%<br />
15%<br />
10%<br />
5%<br />
0%<br />
Jan1<br />
Jan15<br />
Feb1<br />
Feb15<br />
Mar1<br />
Mar15<br />
Apr1<br />
Apr15<br />
May1<br />
May15<br />
Jun1<br />
Jun15<br />
Jul1<br />
Jul15<br />
Aug1<br />
Aug15<br />
Sep1<br />
Sep15<br />
Oct1<br />
Oct15<br />
Nov1<br />
Nov15<br />
Dec1<br />
Dec15<br />
Jan1<br />
Jan15<br />
Feb1<br />
Feb15<br />
Mar1<br />
Mar15<br />
Apr1<br />
Apr15<br />
May1<br />
May15<br />
Jun1<br />
Jun15<br />
Jul1<br />
Jul15<br />
Aug1<br />
Aug15<br />
Sep1<br />
Sep15<br />
Oct1<br />
Oct15<br />
Nov1<br />
Nov15<br />
Dec1<br />
Dec15<br />
Jan1<br />
Jan15<br />
Year-over year, the median value of pre-owned Heavy Jets is<br />
down 9% and over the last 3 months this metric is down 5%. This<br />
recent decline is due to a slowdown in pre-owned transaction<br />
activity. Heavy Jet resale retail transactions in <strong>2023</strong> were down<br />
14% compared to 2022. This count of transactions falls 11% short<br />
of a 5-year average and will likely end in line with 2019 and 2020.<br />
Pre-owned availability in the Heavy Jet segment is up 35% yearover-year.<br />
6.1% of the active Heavy Jets are for sale, compared<br />
to a 10-year average of 7.6%. The Heavy Jet pre-owned inventory<br />
fell 7% in December with <strong>Q4</strong> transaction activity outperforming all<br />
other quarters in <strong>2023</strong>.<br />
SUPER-MID JETS - SHORT TERM MEDIAN VALUE CHANGE<br />
50%<br />
Increase Decrease Total<br />
40%<br />
30%<br />
20%<br />
10%<br />
0%<br />
Jan1<br />
Jan15<br />
Feb1<br />
Feb15<br />
Mar1<br />
Mar15<br />
Apr1<br />
Apr15<br />
May1<br />
May15<br />
Jun1<br />
Jun15<br />
Jul1<br />
Jul15<br />
Aug1<br />
Aug15<br />
Sep1<br />
Sep15<br />
Oct1<br />
Oct15<br />
Nov1<br />
Nov15<br />
Dec1<br />
Dec15<br />
Jan1<br />
Jan15<br />
Feb1<br />
Feb15<br />
Mar1<br />
Mar15<br />
Apr1<br />
Apr15<br />
May1<br />
May15<br />
Jun1<br />
Jun15<br />
Jul1<br />
Jul15<br />
Aug1<br />
Aug15<br />
Sep1<br />
Sep15<br />
Oct1<br />
Oct15<br />
Nov1<br />
Nov15<br />
Dec1<br />
Dec15<br />
Jan1<br />
Jan15<br />
The median value of pre-owned Super-Mid Jets is down 11%<br />
year-over year and down 6% in the last 3 months. Super-Mid<br />
Jet demand has slowed, with resale retail transactions in <strong>2023</strong><br />
down 27% versus 2022 and 14% below the 5-year average.<br />
Transaction counts will end up ahead of 2019 and in line with<br />
2020. Availability in this market is up 41% year-over-year. 6.6% of<br />
the fleet is for resale compared to a 10-year average of 7.7%. Of<br />
all the business aircraft segments, the Super-Mid Jet market saw<br />
the greatest year-over-year decline in pre-owned transactions and<br />
the greatest increase in pre-owned inventory. These factors likely<br />
also caused this market segment to have the greatest decline in<br />
median value year-over-year.<br />
33 | ASIAN SKY QUARTERLY - FOURTH QUARTER <strong>2023</strong>
GLOBAL PRE-OWNED MARKET UPDATE<br />
MEDIUM JETS - SHORT TERM MEDIAN VALUE CHANGE<br />
Increase Decrease Total<br />
60%<br />
50%<br />
40%<br />
30%<br />
20%<br />
10%<br />
0%<br />
Jan1<br />
Jan15<br />
Feb1<br />
Feb15<br />
Mar1<br />
Mar15<br />
Apr1<br />
Apr15<br />
May1<br />
May15<br />
Jun1<br />
Jun15<br />
Jul1<br />
Jul15<br />
Aug1<br />
Aug15<br />
Sep1<br />
Sep15<br />
Oct1<br />
Oct15<br />
Nov1<br />
Nov15<br />
Dec1<br />
Dec15<br />
Jan1<br />
Jan15<br />
Feb1<br />
Feb15<br />
Mar1<br />
Mar15<br />
Apr1<br />
Apr15<br />
May1<br />
May15<br />
Jun1<br />
Jun15<br />
Jul1<br />
Jul15<br />
Aug1<br />
Aug15<br />
Sep1<br />
Sep15<br />
Oct1<br />
Oct15<br />
Nov1<br />
Nov15<br />
Dec1<br />
Dec15<br />
Jan1<br />
Jan15<br />
The median value of pre-owned Medium Jets fell only 1% year-overyear<br />
but is down 11% in the last 6 months. Pre-owned transaction<br />
activity in <strong>2023</strong> was 23% below 2022 and 21% below the 5-year<br />
average. Transaction activity in this segment will likely end in line<br />
with 2019 but not reach 2020 levels. Availability in this segment<br />
is up 30% year-over-year with 5.9% of the fleet for sale versus a<br />
10-year average of 8.9%. A drop in demand for pre-owned aircraft in<br />
this segment seems to have had an impact on the value trend.<br />
LIGHT JETS - SHORT TERM MEDIAN VALUE CHANGE<br />
35%<br />
Increase Decrease Total<br />
30%<br />
25%<br />
20%<br />
15%<br />
10%<br />
5%<br />
0%<br />
Jan1<br />
Jan15<br />
Feb1<br />
Feb15<br />
Mar1<br />
Mar15<br />
Apr1<br />
Apr15<br />
May1<br />
May15<br />
Jun1<br />
Jun15<br />
Jul1<br />
Jul15<br />
Aug1<br />
Aug15<br />
Sep1<br />
Sep15<br />
Oct1<br />
Oct15<br />
Nov1<br />
Nov15<br />
Dec1<br />
Dec15<br />
Jan1<br />
Jan15<br />
Feb1<br />
Feb15<br />
Mar1<br />
Mar15<br />
Apr1<br />
Apr15<br />
May1<br />
May15<br />
Jun1<br />
Jun15<br />
Jul1<br />
Jul15<br />
Aug1<br />
Aug15<br />
Sep1<br />
Sep15<br />
Oct1<br />
Oct15<br />
Nov1<br />
Nov15<br />
Dec1<br />
Dec15<br />
Jan1<br />
Jan15<br />
The median value change in this pre-owned segment is down 5%<br />
year-over-year but down 10% from the summer <strong>2023</strong>. As with other<br />
jet segments, resale transactions activity in this market in <strong>2023</strong><br />
was lower than 2022 (by 9%) but fell only 2% short of the 5-year<br />
average and ahead of 2019 and 2020. Availability in this market is<br />
up 23% year-over-year. 6.2% of the fleet is for sale compared to a<br />
10-year average of 9.6%.<br />
FOURTH QUARTER <strong>2023</strong> — ASIAN SKY QUARTERLY | 34
GLOBAL PRE-OWNED MARKET UPDATE<br />
TURBOPROPS - SHORT TERM MEDIAN VALUE CHANGE<br />
30%<br />
Increase Decrease Total<br />
25%<br />
20%<br />
15%<br />
10%<br />
5%<br />
0%<br />
-5%<br />
Jan1<br />
Jan15<br />
Feb1<br />
Feb15<br />
Mar1<br />
Mar15<br />
Apr1<br />
Apr15<br />
May1<br />
May15<br />
Jun1<br />
Jun15<br />
Jul1<br />
Jul15<br />
Aug1<br />
Aug15<br />
Sep1<br />
Sep15<br />
Oct1<br />
Oct15<br />
Nov1<br />
Nov15<br />
Dec1<br />
Dec15<br />
Jan1<br />
Jan15<br />
Feb1<br />
Feb15<br />
Mar1<br />
Mar15<br />
Apr1<br />
Apr15<br />
May1<br />
May15<br />
Jun1<br />
Jun15<br />
Jul1<br />
Jul15<br />
Aug1<br />
Aug15<br />
Sep1<br />
Sep15<br />
Oct1<br />
Oct15<br />
Nov1<br />
Nov15<br />
Dec1<br />
Dec15<br />
Jan1<br />
Jan15<br />
The median value of pre-owned Turboprops is down 4% year-overyear<br />
and down 7% since October <strong>2023</strong>. Pre-owned transactions<br />
for <strong>2023</strong> fell 20% short of 2022 and were 13% below the 5-year<br />
average. Four percent of the active fleet is for sale compared to a<br />
10-year average of 6.6% in this pre-owned segment.<br />
Data Source: AMSTAT<br />
Commentary by Andrew Young<br />
IMPORTANT NOTE: The chart above uses aggregated data. The changes in values this year within individual make and model markets, and for specific serial numbers, may vary to a<br />
greater or lesser degree from these trends.<br />
35 | ASIAN SKY QUARTERLY - FOURTH QUARTER <strong>2023</strong>
GLOBAL<br />
BUSINESS<br />
AVIATION<br />
MARKET<br />
UPDATE<br />
By Global Jet Capital<br />
Business jet flight operations were down year-over-year, inventory<br />
levels climbed from an early 2022 low point, supply chain and labor<br />
constraints held back new deliveries, and pre-owned transactions<br />
slowed from recent high levels. Furthermore, while the economy<br />
proved resilient in <strong>2023</strong>, many consumers, businesses, and economists<br />
remained uncertain about the future. Still, the business jet market had<br />
a positive finish to <strong>2023</strong>: flight operations were strong, backlogs and<br />
lead-times at major OEMs were up, and inventory remained low, leaving<br />
the industry well positioned to weather any future economic downturn.<br />
• The global economy remained resilient in <strong>2023</strong> despite headwinds,<br />
but uncertainty remains moving into 2024.<br />
• Flight operations declined 1 percent year-over-year in <strong>Q4</strong> <strong>2023</strong> but<br />
were 17 percent above <strong>Q4</strong> 2019 levels, demonstrating systemic<br />
expansion in the user base for business aviation.<br />
• OEM book-to-bill ratios were around 1-to-1 in <strong>Q4</strong> with backlogs<br />
remaining at high levels, placing OEMs in a position to weather an<br />
economic downturn.<br />
• Transactions declined in <strong>2023</strong> due to slower-than-expected new<br />
deliveries (attributable to ongoing supply chain and labor issues)<br />
and price driven inertia between buyers and sellers in the pre-owned<br />
market.<br />
• As more sellers publicly listed their aircraft, business jet inventory<br />
levels increased in <strong>2023</strong>, although levels for the overall fleet remained<br />
below historical averages.<br />
• Most aircraft models reverted to historical depreciation profiles in <strong>Q4</strong><br />
<strong>2023</strong>, albeit from a higher starting point following a firming in values<br />
over 2021-22.<br />
FOURTH QUARTER <strong>2023</strong> — ASIAN SKY QUARTERLY | 36
GLOBAL BUSINESS AVIATION MARKET UPDATE<br />
GLOBAL ECONOMY<br />
Global GDP Percent Change<br />
6.0%<br />
5.0%<br />
4.0%<br />
3.0%<br />
2.0%<br />
1.0%<br />
0.0%<br />
<strong>Q4</strong> 2021 Q1 2022 Q2 2022<br />
Q3 2022<br />
<strong>Q4</strong> 2022<br />
Q1 <strong>2023</strong><br />
Q2 <strong>2023</strong> Q3 <strong>2023</strong><br />
<strong>Q4</strong> <strong>2023</strong><br />
i<br />
The global economy was more resilient in <strong>2023</strong> than many<br />
economists expected. By the end of the year, it became clear that<br />
growth, driven by strong consumer spending, continued at a solid<br />
pace in most of the world even as inflation gradually declined ii .<br />
Despite stronger-than-expected growth in <strong>2023</strong>, headwinds<br />
continued to build heading in 2024. Wars in Ukraine and Israel,<br />
relatively high interest rates (despite plans by many central banks<br />
to reduce them in 2024), continued de-globalization and trade<br />
conflicts, major elections in countries making up 38.1 percent of<br />
global GDP, structural growth challenges in China, and disruptions<br />
in Europe may all contribute to slower growth in 2024. iii<br />
Still, the likelihood of a “soft landing” has increased, even as slow<br />
growth or a mild recession remains a possibility. Central banks are<br />
expected to shift their focus from rate increases to rate decreases iv<br />
and the job market remains tight, v factors that will support<br />
economic stability in 2024.<br />
FLIGHT OPERATIONS<br />
Global Business Jet Flights Operations<br />
North America<br />
Rest of World<br />
929,319<br />
891,231<br />
24.0% 27.9%<br />
975,748 946,572<br />
907,035<br />
23.5%<br />
22.7% 25.4%<br />
857,802<br />
917,861 920,319<br />
28.1% 23.4% 24.0%<br />
899,302<br />
26.3%<br />
76.0% 72.1% 76.5% 77.3% 74.6% 71.9% 76.6% 76.0%<br />
73.7%<br />
<strong>Q4</strong> 2021 Q1 2022 Q2 2022 Q3 2022 <strong>Q4</strong> 2022 Q1 <strong>2023</strong> Q2 <strong>2023</strong> Q3 <strong>2023</strong><br />
<strong>Q4</strong> <strong>2023</strong><br />
vi<br />
In <strong>Q4</strong> <strong>2023</strong>, flight operations declined 0.9 percent from a year earlier.<br />
Both the U.S. and Europe experienced declines following strong<br />
growth in the immediate post-COVID recovery. Charter operations<br />
also experienced a decline from post-COVID highs. At the same time,<br />
flight operations in regions outside North America and Europe grew,<br />
demonstrating strong global demand for business aviation.<br />
Even as departures declined year-over-year, demand remained<br />
above pre-COVID levels. <strong>Q4</strong> <strong>2023</strong> departures were 17 percent higher<br />
than in <strong>Q4</strong> 2019. In the full year <strong>2023</strong>, departures were 15.1 percent<br />
higher than in 2019. Some passengers who utilized business jets<br />
in the post-COVID recovery period began to return to commercial<br />
airlines as health and safety concerns diminished. It was widely<br />
expected that many of the new users of business aviation would<br />
return to commercial airlines as the world normalized. vii However,<br />
due to the industry’s inherent value proposition – including<br />
personal safety, flexibility, productivity, and comfort – a substantial<br />
proportion of new users continued to utilize business aviation in<br />
<strong>2023</strong>, demonstrating a systemic expansion of the user base. As<br />
such, flight operations were lower than the peak witnessed in 2022,<br />
but higher than pre-pandemic levels with steady and sustainable<br />
growth expected going forward.<br />
37 | ASIAN SKY QUARTERLY - FOURTH QUARTER <strong>2023</strong>
GLOBAL BUSINESS AVIATION MARKET UPDATE<br />
OEM BACKLOGS<br />
<strong>Q4</strong> Backlog at Major Business Jet OEMs<br />
USD Millions<br />
$32,178<br />
Bombardier Gulfstream Cessna<br />
$40,277 $40,957<br />
<strong>Q4</strong> 2021 <strong>Q4</strong> 2022 <strong>Q4</strong> <strong>2023</strong><br />
viii<br />
Dassault and Embraer have not report quarterly result, so is not include in this graph.<br />
OEM backlogs increased 1.7 percent year-over-year in <strong>Q4</strong> <strong>2023</strong> to<br />
USD 41.00 billion (excluding Dassault and Embraer). Orders were<br />
lower than the high levels seen in late 2021 and early 2022 but were<br />
in line with <strong>Q4</strong> 2022 and pre-COVID levels. Supply chain and labor<br />
constraints continued to prevent OEMs from increasing production<br />
levels in <strong>Q4</strong>, even as revenue increased due to strong pricing. Stable<br />
orders and the inability to increase production resulted in a bookto-bill<br />
ratio of 1-to-1 in <strong>Q4</strong> and OEMs expect book-to-bill ratios to<br />
remain around 1-to-1 in 2024.<br />
TRANSACTIONS ($ VOLUME)<br />
$32.3B<br />
(3,964 Units)<br />
YTD Business Jet Transactions<br />
New Pre-Owned Total<br />
$36.4B<br />
(3,543 Units)<br />
$32.2B<br />
(3,006 Units)<br />
Volume<br />
$16.7B<br />
(3,243 Units)<br />
$20.3B<br />
(2,851 Units)<br />
$16.4B<br />
(2,304 Units)<br />
$15.6B<br />
(721 Units)<br />
$16.1B<br />
(692 Units)<br />
$15.8B<br />
(702 Units)<br />
<strong>Q4</strong> 2021 <strong>Q4</strong> 2022 <strong>Q4</strong> <strong>2023</strong><br />
YoY % Chg<br />
21.6%<br />
12.7%<br />
3.2%<br />
-1.8%<br />
-19.3%<br />
<strong>Q4</strong> 2022 <strong>Q4</strong> <strong>2023</strong><br />
Note that <strong>Q4</strong> <strong>2023</strong> figures reflect preliminary data and may increase as more transactions are reported to the FAA and data providers.<br />
-11.6%<br />
ix<br />
Both the new and pre-owned markets declined in <strong>2023</strong> compared<br />
to previous year levels. In the new aircraft market, manufacturers<br />
worked to resolve supply chain and labor constraints to boost<br />
production. Despite overcoming many issues, challenges persist<br />
in acquiring key components and hiring enough labor to meet<br />
demand. As a result, unit volume ticked up slightly, but not at<br />
the rate manufacturers planned, and dollar volume declined.<br />
While these constraints have lowered overall transaction volume,<br />
fewer new deliveries may help limit inventory growth and support<br />
healthier values for the market.<br />
Much of the decline in the pre-owned segment was expected as<br />
economic uncertainty increased and growth slowed while the business<br />
jet market normalized following a strong 2021 and 2022. In addition,<br />
inertia between sellers looking to maintain post-pandemic value gains<br />
and buyers waiting for values to return to historical depreciation levels<br />
slowed transaction volume in the pre-owned market. Relatively steep<br />
inclines in interest rates also suppressed demand. Heading into 2024,<br />
new deliveries may increase with the certification of new aircraft<br />
models while pre-owned transactions should remain largely stable as<br />
buyers and sellers continue to acclimate to a new market dynamic.<br />
FOURTH QUARTER <strong>2023</strong> — ASIAN SKY QUARTERLY | 38
GLOBAL BUSINESS AVIATION MARKET UPDATE<br />
FOR SALE INVENTORY<br />
Aircraft Listed for Sale(YTD)<br />
2,715<br />
2,279<br />
2022 <strong>2023</strong><br />
x<br />
Aircraft listings increased in <strong>2023</strong>, continuing a trend that started<br />
in the latter half of 2022. The increases were, at least in part,<br />
attributable to unfavorable comparisons with 2021 and 2022 when<br />
listings dipped to historical lows. Many aircraft sales in 2021<br />
and the first half of 2022 involved unlisted aircraft. As a result,<br />
listings in 2021 were 24.2 percent below 2019 levels and listings in<br />
2022 were 6.3 percent below 2019 levels. In <strong>2023</strong>, aircraft sellers<br />
resumed publicly listing their aircraft for sale, contributing to<br />
increases. Listings may continue to rise as new deliveries pick up in<br />
2024 but should eventually stabilize.<br />
Percent of Business Jet Fleet for Sale<br />
Total<br />
0-12 Years<br />
13+ Years<br />
10.0%<br />
8.0%<br />
6.0%<br />
4.0%<br />
2.0%<br />
0.0%<br />
<strong>Q4</strong> 2021 Q1 2022 Q2 2022 Q3 2022 <strong>Q4</strong> 2022 Q1 <strong>2023</strong> Q2 <strong>2023</strong> Q3 <strong>2023</strong><br />
<strong>Q4</strong> <strong>2023</strong><br />
xi<br />
By the end of <strong>Q4</strong> <strong>2023</strong>, inventory stood at 6.9 percent of the total<br />
fleet. Inventory for the whole fleet is higher than the historical low<br />
point of 3.1 percent at the end of Q1 2022 but still below average<br />
levels of around 10 to 11 percent over the last decade. The increase<br />
in inventory was largely driven by older aircraft. Although all age<br />
groups experienced increases, inventory of aircraft older than 12<br />
years stood at 8.2 percent at year-end. The inventory of aircraft<br />
younger than 13 years old (typically seen as more desirable) stood<br />
at 4.8 percent of the global fleet, an increase from the 4.7 percent<br />
seen at the end of Q3 <strong>2023</strong>.<br />
Inventory is expected to continue to gradually increase through<br />
2024 as the market returns to more normal conditions but should<br />
not reach the historical average of 10 to 11 percent due to limited<br />
new deliveries from OEMs in 2024.<br />
39 | ASIAN SKY QUARTERLY - FOURTH QUARTER <strong>2023</strong>
GLOBAL BUSINESS AVIATION MARKET UPDATE<br />
RESIDUAL VALUE<br />
YoY % Change in Values<br />
0-12 Years 13+ Years Total<br />
-2.9%<br />
-0.2%<br />
11.8%<br />
17.8%<br />
13.0%<br />
16.8%<br />
32.4%<br />
20.1%<br />
23.5%<br />
50.0%<br />
29.3%<br />
28.7%<br />
67.6%<br />
37.2%<br />
21.4%<br />
58.1%<br />
29.5%<br />
14.5%<br />
39.9%<br />
20.9%<br />
8.1%<br />
21.4%<br />
11.5%<br />
3.9%<br />
7.4%<br />
4.8%<br />
0.8%<br />
<strong>Q4</strong> 2021 Q1 2022 Q2 2022 Q3 2022 <strong>Q4</strong> 2022 Q1 <strong>2023</strong> Q2 <strong>2023</strong> Q3 <strong>2023</strong><br />
<strong>Q4</strong> <strong>2023</strong><br />
xii<br />
The above chart compares the year-over-year percentage change<br />
in the bluebook value of like-aged aircraft over time (e.g., the<br />
difference between the value of an eight-year-old aircraft from one<br />
year to the next). Global Jet Capital analyzes a basket of aircraft<br />
as a proxy for the overall market. Observed increases or decreases<br />
in value are not necessarily applicable to any specific aircraft<br />
make/model. For the value of a specific aircraft, please contact a<br />
licensed aircraft appraiser.<br />
Average business jet bluebook values declined 0.2 percent in<br />
<strong>Q4</strong> <strong>2023</strong> compared to <strong>Q4</strong> 2022, following two years of value<br />
increases. As inventory increased, price negotiations between<br />
buyers and sellers became more balanced in <strong>2023</strong> than in 2021<br />
and 2022.<br />
Values varied on a model-by-model basis and, on average, younger<br />
aircraft performed better than older aircraft. In <strong>Q4</strong> <strong>2023</strong> values on<br />
13-year-old and older aircraft were down 2.9 percent compared<br />
to a 0.8 percent increase for 12-year-old and younger aircraft.<br />
This is a reversal from the trend during the earlier post-pandemic<br />
period, when older aircraft outperformed younger aircraft as<br />
many buyers chose to acquire older aircraft during the peak of<br />
the market, reducing supply. At the peak of the market in Q3 2022,<br />
bluebook values for older aircraft were up 67.6 percent year-overyear,<br />
compared to only 28.7 percent for younger aircraft. Before<br />
the COVID-19 pandemic, younger aircraft were considered more<br />
desirable to most buyers, leading to better performance in the<br />
marketplace. As the market normalized in <strong>2023</strong>, these historical<br />
trends re-emerged, leading to more stable values for younger<br />
aircraft.<br />
It’s worth noting that business jets are depreciating assets and a<br />
steady decline in the price of an aircraft over its lifespan is to be<br />
expected. The consensus among industry players is that a stable<br />
pricing environment will reemerge as supply and demand come<br />
into balance.<br />
CONCLUSION<br />
With many economists expecting slow growth in 2024, the<br />
business jet market faces some headwinds leading into the new<br />
year. Still, flight operations remain above pre-COVID levels as<br />
many new users who entered the market in the COVID-19 era<br />
continued to utilize business aircraft. In addition, OEM backlogs<br />
and lead times remained high and pre-owned inventory was below<br />
historical averages. These factors place the business jet market in<br />
a strong position to remain resilient during any potential economic<br />
disruptions that occur in 2024.<br />
Notes<br />
i<br />
Oxford Economics, ii Wells Fargo, iii Wells Fargo, iv Wells Fargo, v Wells Fargo, vi WingX and Global Jet Capital Analysis, vii AIN, viii Company financial reports. Dassault does not report its quarterly<br />
results therefore data is based on reports from Cessna, Bombardier, Embraer, and Gulfstream., ix JetNet and Global Jet Capital Analysis. Units are in parentheses., x AMSTAT and<br />
Global Jet Capital Analysis, xi JetNet and Global Jet Capital Analysis, xii Aircraft Bluebook and Global Jet Capital Analysis<br />
FOURTH QUARTER <strong>2023</strong> — ASIAN SKY QUARTERLY | 40
MARKET SPOTLIGHT:<br />
AIRBUS AS350/H125<br />
41 | ASIAN SKY QUARTERLY - FOURTH QUARTER <strong>2023</strong>
MARKET SPOTLIGHT<br />
FLEET SUMMARY<br />
MODEL AS350B2 AS350B3 H125<br />
Total Aircraft in Operation Worldwide<br />
Total Aircraft in Operation in Asia-Pacific<br />
Engine Model<br />
Max. Takeoff Weight<br />
Max. Takeoff Weight with External Load<br />
Max. Cruise Speed<br />
Rate of Climb<br />
Service Ceiling<br />
Maximum Range (30 Min Reserve)<br />
1,148<br />
208<br />
Safran Arriel 1D1<br />
4,960 lb<br />
5,512 lb<br />
133 kts<br />
1,675 ft/min<br />
15,100 ft<br />
312 nm<br />
1,037<br />
128<br />
Safran Arriel 2B<br />
4,960 lb<br />
6,172 lb<br />
137 kts<br />
1,959 ft/min<br />
14,950 ft<br />
300 nm<br />
1,237<br />
221<br />
Safran Arriel 2D<br />
5,225 lb<br />
6,172 lb<br />
133 kts<br />
1,959 ft/min<br />
17,250 ft<br />
300 nm<br />
Internal Cabin Length<br />
Internal Cabin Height<br />
Internal Cabin Width<br />
Cabin Internal Volumn (Excl. Pilot's Area)<br />
Typ. Passengers<br />
Hourly Cost<br />
(Fuel, Maintenance, etc)<br />
6.56 ft.<br />
4.26 ft.<br />
5.41 ft.<br />
106 cu.ft.<br />
4-6 Pax<br />
$814/hr<br />
6.56 ft.<br />
4.26 ft.<br />
5.41 ft.<br />
106 cu.ft.<br />
4-6 Pax<br />
$791/hr<br />
6.56 ft.<br />
4.26 ft.<br />
5.41 ft.<br />
106 cu.ft.<br />
4-6 Pax<br />
$752/hr<br />
Annual Fixed Cost<br />
(Crew, Hangar, Insurance, etc.)<br />
$409,051<br />
$404,491<br />
$458,251<br />
Data Source: Airbus, AMSTAT, Conklin & de Decker, ASG<br />
Note: Using Conklin & de Decker data under the assumption of 400 flight hours per year. The number of total aircraft in operation are from AMSTAT and ASG, which might differ from<br />
Airbus's official numbers.<br />
A Proven and Versatile Single Turbine<br />
Helicopter Family<br />
The Single engine Airbus AS350/H125 family of helicopters<br />
(previously with Aerospatiale and Eurocopter) first entered service<br />
in 1978 as the Ecureuil (Squirrel) and has become the most<br />
popular model in its class. More than 7,200 units used in civilian<br />
and military roles have been delivered to date in 137 countries to<br />
more than 2,600 operators. Together, the AS350/H125 family has<br />
accumulated more than 39 million flight hours to date.<br />
The four-to-six seat AS350/H125, a successor to the Aerospatiale<br />
Alouette II, was designed to be versatile, robust, reliable,<br />
economical to operate, easy to maintain and feature good<br />
hot-and-high performance, and has remained a best seller for<br />
almost 50 years. Following the acquisition of the Aerospatiale<br />
and Eurocopter product lines by Airbus, the current in production<br />
model is designated as the H125 (previously AS350 B3e). While<br />
numerous upgraded versions have been introduced over the<br />
years, the basic design has remained largely unchanged from the<br />
original AS350B.<br />
Today, the AS350/H125 is a highly proven type in all regions,<br />
covering a wide range of missions. It is also the most traded<br />
Single engine turbine helicopter, with strong demand for preowned<br />
examples, which boosts residual values. Older models<br />
such as the B2 and B3 are also in high demand, as availability of<br />
the newest H125 has remained extremely low.<br />
The type is highly popular with operators of all scales, from start-up<br />
companies taking on their first turbine helicopter, to government<br />
organizations and corporate operators. While the majority of the<br />
AS350/H125 fleet is configured in utility or “multi-mission” layout<br />
for passenger transportation, the type is also highly popular in<br />
some specific missions such as powerline inspection, police law<br />
enforcement, agriculture and forestry, news coverage and as<br />
corporate shuttles. Despite its proven hot-and-high performance, the<br />
single engine configuration of the AS350/H125 does limit its ability<br />
to perform longer range and more demanding missions such as<br />
offshore support, search & rescue and firefighting.<br />
The original AS350 Ecureuil (Squirrel) prototype first flew in June<br />
1974, powered by a Lycoming LTS101 engine. A second prototype<br />
followed in 1975 with a Turbomeca Arriel engine. The Lycoming<br />
version was exclusively for the North American market, known as<br />
the AStar (AS350 C and AS350 D) while the Arriel-powered AS350 B<br />
was sold in all other markets.<br />
Deliveries of the AS350 B began in March 1978. A hot-and-high B1<br />
version with the Arriel 1D engine was introduced in 1986 and the B2<br />
with the 732 shp (546 kW) Turbomeca Arriel 1D1 engine and uprated<br />
rotor blades and transmission in 1990. It was marketed in North<br />
America as the "Superstar". The AS350 BA was a special version with<br />
the 1B engine and the main rotor blades of the B2.<br />
Numerous upgrades were introduced for the B2 over the years,<br />
including from 2007 a large instrument panel similar to the one of the<br />
FOURTH QUARTER <strong>2023</strong> — ASIAN SKY QUARTERLY | 42
MARKET SPOTLIGHT<br />
AS350 B3 that includes the VEMD (Vehicle and Engine Multifunction<br />
Display), integrated instrumentation, which allows the pilot to see<br />
at one glance the main parameters of the helicopter and its engine,<br />
presented on a dual LCD screen. The AS350 B2 is able to carry an<br />
external load of more than one ton (2,200 lbs.).<br />
In March 1997, a first flight of the new AS350 B3 variant was made,<br />
which uses the 847 SHP (632 kW) Arriel 2B engine and a wide chord<br />
tail rotor, full authority digital engine control (FADEC) and improved<br />
gearboxes for even better hot-and-high performance. The AS350<br />
B3 also introduced a new glass cockpit with dual color flat-panel<br />
displays. The AS350 B3 broke records when a standard production<br />
aircraft landed on top of Mount Everest in 2005 at an altitude of<br />
29,029 ft (8,848 m). The B3 variant is marketed in North America as<br />
the B3 AStar.<br />
two pilots and up to six passengers. The H125 also incorporates the<br />
Garmin G500H TXi avionics suite and Vehicle & Engine Multifunction<br />
Display (VEMD), and uses composite materials for the airframe,<br />
rotors blades and main rotor head.<br />
Engine, equipment and avionics upgrades from numerous<br />
suppliers are offered for the AS350/H125, which enhances<br />
performance and extends the service life of older examples.<br />
These include “StableLight” – the industry’s first four-axis<br />
autopilot available for retrofit on the AS350, developed by<br />
StandardAero and Thales. Van Horn Aviation has developed a<br />
new tail rotor assembly with new composite blades and titanium<br />
rotor hub. In June 2022, EASA certificated the new Garmin<br />
GFC600H flight control system which can be retrofitted to most<br />
AS350 variants.<br />
The AS350 B3e (H125) was introduced from late 2011 and is<br />
equipped with the Arriel 2D engine, with similar power ratings to the<br />
Arriel 2B, but with dual FADEC, an engine data recorder, and other<br />
enhancements to improve reliability and reduce maintenance costs.<br />
The H125 also featured updated cockpit avionics, flight controls,<br />
and hydraulic system. It has a maximum take-off weight (MTOW) of<br />
5,225 lb. (6,172 lb. with external load). It can accommodate one or<br />
The AS350/H125’s nearest competitors include the smaller and<br />
lighter Bell 206, the Bell 407 and the Leonardo AW119. Airbus has<br />
yet to announce an all-new replacement for the AS350/H125, and<br />
with high demand for the type, new deliveries will continue into<br />
the 2030s. Although retirements of older examples are expected<br />
to gradually increase in the coming years, the majority of the<br />
AS350/H125 fleet will remain in service for many years to come.<br />
Presence In Asia-Pacific<br />
There were 557 AS350 B2, B3 and H125 helicopters operating<br />
in Asia-Pacific at the end of <strong>Q4</strong> <strong>2023</strong>, with the H125 being most<br />
popular with a fleet of 221, surpassing the B2 model. China<br />
accounted for the largest fleet of H125s with a fleet share of<br />
almost 50%. New Zealand had the largest AS350/H125 fleet<br />
overall with 135 in operation, the majority (68%) of which were<br />
the older B2s. The B2 fleet in Asia-Pacific comprised a total of<br />
208 units in operation, with the majority delivered in the 1990s.<br />
There were also 128 AS350 B3s in operation in the region at the<br />
end of <strong>2023</strong>.<br />
The top five AS350 B2/B3/H125 fleets by country in Asia-<br />
Pacific accounted for more than 80% of the total in the region.<br />
New Zealand, China, and Australia had the three largest fleets,<br />
each with more than 100 units in operation. Of the 557 units in<br />
operation, some 55% were configured for utility / multi-mission<br />
use, reinforcing the popularity of the AS350/H125 as a versatile<br />
helicopter. The most popular dedicated missions included<br />
charter, cargo lifting and powerline inspections.<br />
At the end of <strong>2023</strong>, the top 18 operators in Asia-Pacific accounted<br />
for 27% of the total AS350 B2/B3/H125 fleet. China-based State<br />
Grid GA, which performs powerline surveys and inspections, was<br />
the largest operator with a fleet of 15. This was followed by the<br />
two largest Japanese operators of the type – Aero Asahi and<br />
Nakanihon Air, both of which fly a mix of missions.<br />
Fleet in Operation by Model & Delivery Year in <strong>Q4</strong> <strong>2023</strong> in Asia-Pacific<br />
AS350B2 AS350B3 H125<br />
40<br />
35<br />
No. of Aircraft in Operation<br />
30<br />
25<br />
20<br />
15<br />
10<br />
5<br />
0<br />
1982<br />
1983<br />
1987<br />
1988<br />
1989<br />
1990<br />
1991<br />
1992<br />
1993<br />
1994<br />
1995<br />
1996<br />
1997<br />
1998<br />
1999<br />
2000<br />
2001<br />
2002<br />
2003<br />
2004<br />
2005<br />
2006<br />
2007<br />
2008<br />
2009<br />
2010<br />
2011<br />
2012<br />
2013<br />
2014<br />
2015<br />
2016<br />
2017<br />
2018<br />
2019<br />
2020<br />
2021<br />
2022<br />
<strong>2023</strong><br />
Data Source: ASG Helicopter Fleet Report <strong>2023</strong><br />
43 | ASIAN SKY QUARTERLY - FOURTH QUARTER <strong>2023</strong>
MARKET SPOTLIGHT<br />
Fleet in Operation by Model & Top Country in <strong>Q4</strong> <strong>2023</strong> in Asia-Pacific<br />
Country AS350B2<br />
AS350B3 H125<br />
Total<br />
New Zealand<br />
93<br />
22<br />
20<br />
135<br />
China<br />
7<br />
15<br />
106<br />
128<br />
Australia<br />
52<br />
46<br />
17<br />
115<br />
Japan<br />
12<br />
20<br />
25<br />
57<br />
India<br />
8<br />
13<br />
21<br />
Total<br />
164<br />
111<br />
181<br />
456<br />
Data Source: ASG Helicopter Fleet Report <strong>2023</strong><br />
Fleet in Operation by Model & Mission in <strong>Q4</strong> <strong>2023</strong> in Asia-Pacific<br />
Fleet in Operation by Top Operator in <strong>Q4</strong> <strong>2023</strong> in Asia-Pacific<br />
With more than five AS350/H125 helicopters in Asia-Pacific<br />
Mission AS350B2 AS350B3 H125 Total<br />
STATE GRID GA<br />
Primary Business<br />
Powerline<br />
15<br />
Multi-Mission<br />
89<br />
66<br />
150<br />
305<br />
AERO ASAHI<br />
Varied<br />
14<br />
Charter<br />
Cargo Lifting<br />
Powerline<br />
36<br />
22<br />
1<br />
16<br />
11<br />
7<br />
24<br />
4<br />
19<br />
76<br />
37<br />
27<br />
NAKANIHON AIR<br />
THE HELICOPTER LINE<br />
Varied<br />
Air Tour<br />
12<br />
12<br />
Corporate<br />
Private<br />
Agriculture<br />
12<br />
9<br />
9<br />
5<br />
5<br />
2<br />
4<br />
1<br />
4<br />
21<br />
15<br />
15<br />
HUBEI TONGCHENG GA<br />
AVIATION UTILITIES<br />
Varied<br />
Varied<br />
10<br />
11<br />
Forestry<br />
Survey<br />
SAR<br />
8<br />
4<br />
4<br />
1<br />
3<br />
1<br />
3<br />
9<br />
8<br />
7<br />
MICROFLITE HELICOPTER<br />
FLYING DRAGON GAC<br />
Varied<br />
Varied<br />
8<br />
8<br />
Aero Photography<br />
3<br />
4<br />
7<br />
HONGIK AIR SERVICE<br />
Varied<br />
8<br />
News Reporting<br />
Law Enforcement<br />
3<br />
2<br />
2<br />
3<br />
1<br />
6<br />
5<br />
HELI WEST<br />
Varied<br />
7<br />
TOP 10 OPERATORS<br />
Fire Fighting<br />
1<br />
3<br />
4<br />
LHASA SNOW EAGLE GA<br />
Varied<br />
6<br />
EMS<br />
Training<br />
2<br />
1<br />
1<br />
3<br />
4<br />
3<br />
TASMANIAN HELICOPTERS<br />
Agriculture/<br />
Forestry<br />
6<br />
Offshore O&G<br />
1<br />
2<br />
3<br />
TOHO AIR<br />
Varied<br />
6<br />
Air Tour<br />
Marine Pilot Transfer<br />
1<br />
2<br />
1<br />
2<br />
2<br />
HIMALAYAN HELI<br />
Varied<br />
5<br />
Onshore<br />
Total<br />
208<br />
Data Source: ASG Helicopter Fleet Report <strong>2023</strong><br />
Note: Helicopters used for multi-mission operations can be deployed in a mix of usages.<br />
These helicopters are mostly outfitted in a "utility" configuration and adapted for specific<br />
missions as required. These missions can include: Onshore Oil and Gas Mining, Cargo<br />
Lifting, Forestry (surveying, logging and protection), Fire Fighting, Aero Photography, Air<br />
Tours, Agriculture and Pest Control, Powerline Repair and Survey and Media Industry.<br />
1<br />
128<br />
221<br />
1<br />
557<br />
HELICOPTERS QUEENSTOWN<br />
SKYWORK HELICOPTERS<br />
HELI GLENORCHY<br />
TE ANAU HELICOPTER SERVICES<br />
Data Source: ASG Helicopter Fleet Report <strong>2023</strong><br />
Air Tour<br />
Varied<br />
Air Tour<br />
Air Tour<br />
5<br />
5<br />
5<br />
5<br />
TOP 18<br />
OPERATORS =<br />
27% OF<br />
TOTAL FLEET<br />
FOURTH QUARTER <strong>2023</strong> — ASIAN SKY QUARTERLY | 44
MARKET SPOTLIGHT<br />
PRE-OWNED MARKET ANALYSIS<br />
Market Value (Million USD)<br />
4<br />
1995 AS350B2 2008 AS350B3 2020 H125 <strong>2023</strong> H125<br />
3.5 $3.32<br />
$3.35<br />
3<br />
$2.70<br />
$2.80<br />
$2.89<br />
2.5<br />
2<br />
1.5<br />
1<br />
$1.54 $1.52<br />
$0.86<br />
$0.93<br />
$1.74<br />
$1.87<br />
$1.07 $1.07<br />
0.5<br />
0<br />
Dec<br />
20<br />
Mar<br />
21<br />
Jun<br />
21<br />
Sep<br />
21<br />
Dec<br />
21<br />
Mar<br />
22<br />
Jun<br />
22<br />
Sep<br />
22<br />
Dec<br />
22<br />
Mar<br />
23<br />
Jun<br />
23<br />
Sep<br />
23<br />
Dec<br />
23<br />
Data Source: VREF & ASG<br />
Aircraft for Sale<br />
As one of the most liquid and the most traded models<br />
AS350B2 AS350B3 H125<br />
180<br />
160<br />
140<br />
120<br />
100<br />
80<br />
60<br />
40<br />
20<br />
in the global pre-owned market, the AS350/H125 family<br />
of helicopters has experienced significant changes<br />
in their supply-demand ratio over the past three<br />
years. Demand has increased year-on-year, which can<br />
be reflected in the annual transaction volume. The<br />
recorded global retail transaction volume increased<br />
from 174 transactions in 2021 to 204 transactions in<br />
<strong>2023</strong>, representing a growth rate of 17.2%. However,<br />
supply for the AS350/H125 helicopters in the<br />
0<br />
Dec Mar Jun<br />
20 21 21<br />
Data Source: AMSTAT<br />
Sep<br />
21<br />
Dec<br />
21<br />
Mar<br />
22<br />
Jun<br />
22<br />
Sep<br />
22<br />
Dec<br />
22<br />
Mar<br />
23<br />
Jun<br />
23<br />
Sep<br />
23<br />
Dec<br />
23<br />
secondary market has shown a downward trend yearon-year,<br />
with the average percentage of helicopters for<br />
sale declining from 4.7% at the end of <strong>Q4</strong> 2020 to 2.1%<br />
Percentage for Sale<br />
AS350B2<br />
AS350B3<br />
H125<br />
at the end of <strong>Q4</strong> <strong>2023</strong>. The average days on the market<br />
for pre-owned AS350/H125 decreased by approximately<br />
360 days in three years.<br />
7%<br />
6%<br />
5%<br />
These market trends further reinforces the dominant<br />
position of the AS350/H125 family in its class. The<br />
large, well-spread fleet both geographically and<br />
4%<br />
among operator categories boosts liquidity and value<br />
3%<br />
2%<br />
retention. There is also an abundance of AS350/H125<br />
qualified pilots, engineers, mechanics, spare parts,<br />
engineering support and overall experience with the<br />
1%<br />
type. Together with its reliability, flexibility, cost-<br />
0<br />
Dec<br />
20<br />
Mar<br />
21<br />
Jun<br />
21<br />
Data Source: AMSTAT<br />
Sep<br />
21<br />
Dec<br />
21<br />
Mar<br />
22<br />
Jun<br />
22<br />
Sep<br />
22<br />
Dec<br />
22<br />
Mar<br />
23<br />
Jun<br />
23<br />
Sep<br />
23<br />
Dec<br />
23<br />
effectiveness and capability, the AS350/H125 family<br />
continues to be the helicopter of choice in the Single<br />
turbine engine category.<br />
45 | ASIAN SKY QUARTERLY - FOURTH QUARTER <strong>2023</strong>
MARKET SPOTLIGHT<br />
Avg. Days on Market<br />
AS350B2<br />
AS350B3<br />
H125<br />
Average<br />
1,000<br />
900<br />
800<br />
700<br />
600<br />
500<br />
400<br />
300<br />
200<br />
100<br />
0<br />
Dec<br />
20<br />
Data Source: AMSTAT<br />
Mar<br />
21<br />
Jun<br />
21<br />
Sep<br />
21<br />
Dec<br />
21<br />
Mar<br />
22<br />
Jun<br />
22<br />
Sep<br />
22<br />
Dec<br />
22<br />
Mar<br />
23<br />
Jun<br />
23<br />
Sep<br />
23<br />
Dec<br />
23<br />
Aircraft Transactions<br />
AS350B2 AS350B3 H125<br />
30<br />
25<br />
20<br />
15<br />
10<br />
5<br />
0<br />
Dec<br />
20<br />
Mar<br />
21<br />
Data Source: AMSTAT & ASG<br />
Note: Preliminary data for Dec <strong>2023</strong>.<br />
Jun<br />
21<br />
Sep<br />
21<br />
Dec<br />
21<br />
Mar<br />
22<br />
Jun<br />
22<br />
Sep<br />
22<br />
Dec<br />
22<br />
Mar<br />
23<br />
Jun<br />
23<br />
Sep<br />
23<br />
Dec<br />
23<br />
The older AS350 B2 model recorded the most sales activity in recent<br />
years. Availability has declined since the end of 2020, and only 33<br />
(2.9% of the fleet) were listed for sale at the end of <strong>2023</strong>, which is<br />
relatively low considering the overall fleet size. Demand remains<br />
high for the B2 model, despite its age, and 90 retail transactions<br />
were recorded during <strong>2023</strong>. With low availability of the newer<br />
models, the B2 remained a popular choice in the pre-owned market.<br />
Availability of the newer B3 model has also declined by 48% since<br />
the end of 2022 and reached just 13 units, or 1.3% of the fleet by<br />
the end of <strong>2023</strong>. There were 61 recorded retail transactions in <strong>2023</strong>,<br />
an increase of just four transactions from the previous year. While<br />
FOURTH QUARTER <strong>2023</strong> — ASIAN SKY QUARTERLY | 46
MARKET SPOTLIGHT<br />
Market Availability<br />
4.5<br />
4<br />
AS350B2<br />
AS350B3<br />
H125<br />
Trendline<br />
YOD, AFTT<br />
2019, 225<br />
2021, 260<br />
2021, 125<br />
3.5<br />
3<br />
2013, 1295<br />
Asking Price (Million USD)<br />
2.5<br />
2<br />
2011, 1598<br />
2008, 1123<br />
2015, 1504<br />
2020, 2100<br />
<strong>2023</strong>, 8<br />
1.5<br />
1<br />
1979, 17255<br />
1987, 9926<br />
1989, 11930<br />
1994, 10139<br />
1991, 12861<br />
1995, 12222<br />
1997, 8895<br />
2004, 14599<br />
2006, 2003<br />
2001, 3600<br />
2011, 4050<br />
2010, 7457<br />
2008, 4792<br />
2005, 20459<br />
2013, 1571<br />
1997, 10585<br />
0.5<br />
0<br />
1975 1980 1985 1990 1995 2000 2005 2010<br />
2015 2020<br />
2025<br />
Delivery Year<br />
Data Source: AMSTAT & ASG<br />
Note: The market availability chart only shows aircraft for sale that have asking prices.<br />
availability of H125s increased through <strong>2023</strong>, the number of<br />
transactions was also up by 32.5% year-on-year to reach 53,<br />
with the average number of days on market was the lowest<br />
among all models.<br />
There were around 60 AS350/H125 helicopters listed for<br />
sale at the end of <strong>2023</strong>, of which 25 had asking prices. North<br />
America was the largest market for pre-owned transactions,<br />
followed by Northern Europe. While the B2 and H125 models<br />
are most preferred in North America, the B3 model is prevalent<br />
in Northern Europe.<br />
Market Availability By Location<br />
Northern Africa (1, 4%)<br />
South America (1, 4%)<br />
Western Europe (3, 12%)<br />
Oceania (3, 12%)<br />
Northern Europe (4, 16%)<br />
Southern Europe (1, 4%)<br />
Northern America (12, 48%)<br />
Data Source: AMSTAT & ASG<br />
Note: The market availability chart only shows aircraft for sale that have asking prices.<br />
47 | ASIAN SKY QUARTERLY - FOURTH QUARTER <strong>2023</strong>
FOURTH QUARTER <strong>2023</strong> — ASIAN SKY QUARTERLY | 48
SPONSORED CONTENT<br />
FALCON 6X ENTERS SERVICE<br />
WITH BARNSTORMING<br />
WORLD TOUR<br />
The all-new Falcon 6X entered service at the end of <strong>2023</strong> and now customers and operators around the world are<br />
getting their first opportunity to take it for a whirl. Early accounts say they are excited about the newest and most<br />
advanced Falcon, both for its comfort features, reliability, and its fighter inspired handling and performance.<br />
“Passengers love the power,” says Chief Test Pilot Philippe Duchateau, who has conducted some of the demo<br />
flights. “They invariably ask for a max performance takeoff.” He notes the 6X has the same quick acceleration as<br />
a fighter—one definitely feels the push into the seatback. Initial climb is 30 degrees. Corporate pilots know that<br />
strong climb performance enhances safety.<br />
Big airplane, big performer<br />
While the 6X can rocket off the runway, pilots will typically provide<br />
smooth takeoffs enhanced by the aircraft’s fly-by-wire system. In fact,<br />
the company is certificating follow-on upgrades to the autothrottle<br />
system that will provide a pre-set “soft go-around” setting that will<br />
smooth this maneuver for passengers, and ease workload for pilots in<br />
case they have to break off an approach because of ATC instructions,<br />
or because they are below minimum weather.<br />
“By incorporating the latest digital flight control technology from<br />
our fighters and also refinements the systems already aboard the<br />
8X, we improve comfort, but more importantly, enhance safety,” says<br />
Duchateau, who leads flight testing of Rafale fighters and business<br />
jets for the company.<br />
For example, the flight control system of the 6X uses all flying<br />
surfaces, but especially new flaperons (combining the capabilities<br />
of flaps and ailerons) to damp turbulence and provide a smoother<br />
ride in a way that has been clearly noticeable to demo passengers,<br />
he says.<br />
Moreover, speed brake deployment to help configure the aircraft for<br />
landing approach is not accompanied by the vibrations felt on other<br />
aircraft, nor is there a strong pitch change when they are deployed.<br />
The benefit is more passenger comfort in this phase of flight and<br />
easier handling for pilots who do not need to compensate for a strong<br />
pitching moment.<br />
It should be noted here that Dassault is a leader in digital design and<br />
digital flight control technology. Its Falcon 7X, first flown in 2005, was<br />
business aviation’s first fly-by-wire jet. It drew on decades of digital<br />
flight control technology from Dassault fighters. Today, Dassault<br />
is the only company that builds fighters and business jets and the<br />
only business jet company that builds the entire digital flight control<br />
system in-house, for the best integration with the airframe.<br />
A last word on flight handling: pilots are noticing the smooth landing<br />
qualities of the aircraft, what pilots call “greasers,” and excellent<br />
manners in strong crosswinds.<br />
Falcon 6X takes on the world, reliably<br />
Since December <strong>2023</strong>, the Dassault 6X demonstration aircraft has been<br />
traveling the world to give customers their first ride in the plane. In late<br />
February it made its first appearance at the Singapore Air Show. As of<br />
this writing in early March, the aircraft has made over 150 flights on the<br />
demo tour, visiting 72 airports in Europe, the U.S., and South America.<br />
Some days, the aircraft would make four demo flights for corporate<br />
pilots and executives. There have been no cancellations, which speaks<br />
to the maturity of the design at this early stage.<br />
49 | ASIAN SKY QUARTERLY - FOURTH QUARTER <strong>2023</strong>
SPONSORED CONTENT<br />
Long legs across mid-Atlantic<br />
The aircraft has also demonstrated better than book range<br />
performance. For its South American tour, it flew a positioning flight<br />
with crew only (reducing payload) from Paris to São Paulo in 12 hours,<br />
43 minutes against unexpectedly strong headwinds. It cruised mainly<br />
at 43,000 feet at its long-range cruise setting, Mach 0.80. The 6X flew<br />
5,646 air miles versus published range of 5,500 nm, landing with more<br />
than the required fuel reserves.<br />
The biggest benefit of all—the cabin<br />
Passengers, however, are the ultimate beneficiaries of Dassault’s<br />
ability to build a big airplane that is efficient and able to operate from<br />
short runways—a traditional Dassault strong suit. The 6X has the<br />
largest cabin cross section in a purpose-built business jet, with a<br />
cabin height of 1.98 m and width of 2.58 m. It’s a new level of personal<br />
space, capable of seating up to 16 comfortably.<br />
In photos, the cabin looks big, because it is, but Dassault’s inhouse<br />
design team enhanced the feeling of spaciousness with a<br />
contemporary design including more rounded surfaces and flowing<br />
lines, accentuating spaciousness. This trendsetting design won<br />
two major industrial design awards: the Red Dot award and the<br />
International Yacht and Aviation award.<br />
On the demo tour, passengers commented on the bright and pleasant<br />
interior illumination thanks to 30 windows, each larger than on<br />
predecessor Falcons. The cabin even has a unique skylight in the<br />
galley area, a part of the plane that usually lacks natural light.<br />
At night, passengers can infinitely<br />
adjust the lighting color palette, even<br />
commanding simulated sunrises and<br />
sunsets through the Ambiance cabin<br />
management system.”<br />
Ambiance is at every passenger’s fingertips through personal<br />
electronic devices or interior touch panels.<br />
High speed WIFI is available throughout and extensive testing prior<br />
to the tour showed that multiple passengers could engage in high<br />
resolution live-stream video chats with colleagues around the world.<br />
Lastly, passengers commented on the aircraft’s extreme quietness.<br />
The 6X follows in the footsteps of the Falcon 8X, acknowledged by<br />
many as the quietest business jet in the sky. Both have sound levels<br />
below 50 dB, equivalent to a suburban living room.<br />
The Falcon 6X is supported throughout Asia by Dassault’s network of<br />
factory service centers, including ExecuJet MRO’s brand-new regional<br />
flagship facility in Kuala Lumpur, Malaysia. ExecuJet MRO Services is<br />
a fully owned subsidiary of Dassault Aviation. The KL facility is also<br />
home to its regional sales headquarters, should anyone want to seek<br />
more information on the 6X.<br />
www.dassaultfalcon.com<br />
FOURTH QUARTER <strong>2023</strong> — ASIAN SKY QUARTERLY | 50
MRO JAPAN<br />
MRO JAPAN<br />
EXPANDS INTO<br />
CORPORATE AVIATION<br />
By Alud Davies<br />
Japan has built one of the most impressive domestic airline networks in the world. Stretching 1,700 miles from<br />
Painushima Ishigaki Airport in the south, right the way up to Wakkanai Airport in the north, Japanese airlines<br />
regularly ply routes between futuristic megacities and beautifully peaceful islands.<br />
It is also a relatively unique Market. Unlike the US or Europe where you’ll see single aisle and commuter<br />
aircraft flying domestic services, Japan utilises many widebody aircraft on domestic routes. That’s not to say<br />
that smaller aircraft don’t fly these routes, they do, but you’re just as likely to see a domestic flight operated by<br />
an Airbus A350 or a Boeing 777 as you are an Airbus A320 or Boeing 737.<br />
With so many aircraft flying to outposts far away from the main Tokyo<br />
and Osaka bases, there was a clearly defined need for maintenance<br />
facilities at some of the destinations that the airlines regularly fly into.<br />
This was especially true for some of the domestic trunk routes, which<br />
are regularly served from various different parts of the country.<br />
So, in 2015, a new MRO company was formed with the aim of<br />
providing MRO services in one of Japan’s busiest airports outside<br />
of Osaka or Tokyo. Two years prior to that, the Okinawa Prefecture,<br />
an island south of the mainland that’s closer to Taiwan than it is to<br />
Japan, had set up a tender procedure for companies to potentially<br />
set up an MRO facility at Naha Airport. Japan’s biggest commercial<br />
operator, All Nippon Airways (ANA), made a bid to run the facilities,<br />
and was subsequently named as the winner.<br />
The new company, MRO Japan, would be owned 45% by ANA, with<br />
51 | ASIAN SKY QUARTERLY - FOURTH QUARTER <strong>2023</strong>
MRO JAPAN<br />
25% owned by Japanese aircraft interiors expert JAMCO, 20% owned<br />
by Mitsubishi Heavy Industries, and the remaining smaller percentages<br />
held by Japanese banks and the Okinawa Promotion and Development<br />
Finance Corporation.<br />
The company initially began operations at Itami Airport in Osaka, and<br />
quickly grew to having 180 employees. But in 2019 a second round of<br />
funding was completed that would see a number of manufacturing and<br />
associated companies making investments into MRO Japan, and soon<br />
after, the company completed relocated its business and all of its staff<br />
to Naha Airport on Okinawa Island.<br />
Since then, the company has been in growth mode, and today includes<br />
433 employees, of which 90% are from Okinawa itself.<br />
The company has traditionally focussed on maintenance services to the<br />
aircraft types most prevalent in Japan, ranging from Dash-8 Turboprops,<br />
right the way up to the Boeing 747-8, which it recently received<br />
approvals for. Its team of engineers can perform maintenance up to C<br />
Checks, and can also perform structural repairs, engine changes as well<br />
as various other major maintenance procedures.<br />
The company’s facilities at Naha Airport were completed in November<br />
2018 and are amongst the largest in Japan and were built with the future<br />
in mind. The hangar buildings, which can double as aircraft parking bays<br />
during adverse weather conditions such as typhoons, can hold a Boeing<br />
747-8 as well as several smaller aircraft at the same time.<br />
The hangar complex also includes a paint bay. The company became<br />
well known in both Japan and Taiwan when it painted several special<br />
Pokémon schemes on ANA and China Airlines aircraft.<br />
Looking to the future, MRO Japan wants to expand its lease return side<br />
of the business, as well as its work on corporate aircraft, saying that it<br />
is expecting to be busy in the future due to new aircraft deliveries and<br />
existing leased aircraft leaving Japan.<br />
Says Takashi Takahashi, President, MRO Japan. “In the future, aviation<br />
demand will grow, as in addition to the maintenance of existing aircraft<br />
due to the recovery, demand is expected to increase further due to<br />
the active introduction of new aircraft in Asia and the maintenance of<br />
lease returns.”<br />
Even during the coronavirus<br />
pandemic, the demand for<br />
maintenance remained steady<br />
due to the need for refurbishment<br />
of cargo planes and preservation<br />
maintenance.”<br />
Taking its first tentative steps into the corporate aviation world, the<br />
company recently completed its first check on a Philippines-based Airbus<br />
ACJ318, during which time the aircraft’s engines, landing gear and other<br />
systems were inspected. Registered in Europe, MRO Japan first had to<br />
seek out European Aviation Safety Agency (EASA) approvals before it<br />
could do the work. The approvals were received mid-way through <strong>2023</strong>,<br />
following what the company says was many months of hard work.<br />
But it’s an area that the company wants to expand further into, noting<br />
that there is a sizable number of corporate airliners both based, and<br />
operating to, the Asia-Pacific region.<br />
The corporate airliner market is the perfect market for MRO Japan to<br />
take its first tentative steps into corporate aviation, as the company<br />
already holds approvals to work on the Airbus A320 and Boeing 737<br />
families that the majority of corporate airliners are based on. The<br />
EASA approvals are already in place, and the company is looking into<br />
obtaining approvals from other regulatory authorities to allow them to<br />
work on overseas registered aircraft.<br />
Overall, MRO Japan’s expansion into lease returns and corporate<br />
aviation fits perfectly into Okinawa’s plan to form an aviation cluster in<br />
and around Naha Airport. Although the plan for the cluster was originally<br />
drawn up in 2018, in October <strong>2023</strong> a Cluster Formation Acceleration<br />
Council was formed and held its first meeting.<br />
Takahashi says that in 2024 MRO Japan will work towards realizing<br />
the action plan that was formulated in 2018, working together with the<br />
governor of Okinawa to make recommendations on how the aviation<br />
cluster can grow and operate.<br />
“We support the safety of the skies through our MRO business and<br />
contribute to the development of the aviation industry as well as local<br />
communities.” Says Takahashi. “We aim to become Asia’s leading MRO.”<br />
mrojpn.co.jp/en<br />
FOURTH QUARTER <strong>2023</strong> — ASIAN SKY QUARTERLY | 52
SAPPORO OPENS NEW FBO<br />
SAPPORO OPENS<br />
LONG AWAITED FBO<br />
By Alud Davies<br />
Sapporo is a city of contrasts. Nestled in the north of Japan on second biggest island, it is known in spring for<br />
its beautiful cherry blossoms that can rival the Sakura Season displays in Tokyo, and in winter for being an icy<br />
wonderland, which culminates with its own snow festival.<br />
Visitors flock to the city during the winter from Japan and the rest of Asia. For some it will be their first glimpse<br />
of snow, but for others it is an annual ritual as they look to hone their skiing or snowboarding skills. During this<br />
winter season, which normally lasts between early December and the end of March, the number of visitors to the<br />
city swell so much that airline schedules almost double. But it is not just commercial aircraft that use the airport,<br />
a decent number of private jets do as well.<br />
Without proper facilities, visiting aircraft would have to park on<br />
the end of the international terminal and, if the arrivals came from<br />
outside of Japan, the passengers would then need to go into the<br />
terminal itself to be processed through the normal immigration<br />
channels in the airport.<br />
Not exactly the most premium of solutions, especially as those<br />
private jets arriving are normally large, long range jets, the<br />
passengers of which no doubt staying at the more upmarket hotels<br />
and resorts around the city and its surroundings.<br />
But in December <strong>2023</strong> the airport got what it desperately needed;<br />
its own FBO.<br />
Nestled towards the end of the international terminal, the FBO<br />
was built from the ground up in seven months to not only create<br />
a feeling of calm and space, but also to have a logical flow for<br />
passengers passing through the facility. The facility does house<br />
Customs, Immigration and Quarantine (CIQ) facilities, although the<br />
staff that perform these functions are shared with the neighbouring<br />
international terminal and come across to the FBO as and when<br />
they are needed. The FBO also features a pilot’s lounge and<br />
dedicated lounge spaces for passengers.<br />
Although an opening ceremony for the FBO was held on December<br />
9th, the new facility was officially opened a day earlier on December<br />
8th, when an Airbus ACJ arrived from Clark in the Philippines.<br />
Overall, the airport says that the FBO is in response to an increase<br />
in the number of business aircraft visiting the airport, which<br />
regularly tops 400 movements per year. This, the Hokkaido Airport<br />
Authority’s Managing Executive Officer Takayuki Yamamoto adds,<br />
53 | ASIAN SKY QUARTERLY - FOURTH QUARTER <strong>2023</strong>
SAPPORO OPENS NEW FBO<br />
is largely seasonal, with many of the movements taking place<br />
during the winter months, during which time the Hokkaido region is<br />
known for snow.<br />
The opening of the FBO is the culmination of four years of hard<br />
work by the Hokkaido Airport Authority, during which time it not<br />
only tendered for the management of the FBO but also made visits<br />
to various FBOs around the world. Hokkaido Airport Authority<br />
itself was only set up four years ago, however opening an FBO at<br />
Sapporo was always in its plans, with Yamamoto stating that the<br />
Japanese government provided subsidies, and that plans had to be<br />
put on hold during the COVID-19 pandemic.<br />
“The Japanese government does provide some subsidies for<br />
creating this type of facility to encourage more international<br />
passengers to visit Japan. So, we decided to make use of those<br />
subsidies” says Yamamoto.<br />
Before COVID-19 we had around<br />
400 business aviation flights, but at<br />
that time arriving passengers had to<br />
queue in the international terminal<br />
with other passengers.”<br />
Early on during the FBO design process the airport put out a tender<br />
for the management of the FBO. Although several companies<br />
submitted proposals, it would be Universal Aviation, a company that<br />
the airport already knew very well, that eventually won.<br />
“Their reputation is very good. Before the opening of the FBO it was<br />
Universal that was supporting the business aircraft that visited<br />
Sapporo,” says Yamamoto.<br />
Although the FBO is officially open from 08:00 to 20:00, with prior<br />
agreement visiting aircraft can be accommodated at any time. “This<br />
airport is open 24/7, so if we have advance notice, we can arrange<br />
for CIQ facilities to be open at any time, including the nighttime,”<br />
says Universal Aviation’s Hiroshi Higashiyama. “But that only<br />
applies to flights ending in Sapporo, currently tech stops are not<br />
allowed outside of the FBO hours. Only those aircraft that have<br />
business in Hokkaido will be accepted between 22:00 and 07:00 the<br />
next day.”<br />
“Of course, a diversion will be accepted at any time,” adds<br />
Higashiyama. “We would not turn them away.”<br />
Part of the reason behind not accepting tech stops at night is that<br />
the airport is shared with the Japan Air Self Defence Force, which<br />
has its own facilities along one side of the airport. Although it does<br />
have its own runway, which during the day is often used by fighter<br />
jets, transports and special missions’ aircraft, Air Traffic Control<br />
(ATC) is shared with the commercial side of the airport.<br />
FOURTH QUARTER <strong>2023</strong> — ASIAN SKY QUARTERLY | 54
MARKET<br />
DYNAMICS<br />
BUSINESS JET AND<br />
CIVIL HELICOPTER<br />
PRE-OWNED MARKET<br />
<strong>Q4</strong> <strong>2023</strong><br />
55 | ASIAN SKY QUARTERLY - FOURTH QUARTER <strong>2023</strong>
MARKET DYNAMICS: BUSINESS JETS<br />
PRE-OWNED BUSINESS JETS MARKET <strong>Q4</strong> <strong>2023</strong><br />
GLOBAL INVENTORY VALUE (MILLION USD) 1, 2<br />
Corp. Airliner Long Range Large Medium Light<br />
10,000<br />
8,000<br />
6,000<br />
4,000<br />
2,000<br />
0<br />
<strong>Q4</strong> 2020 Q1 2021 Q2 2021 Q3 2021 <strong>Q4</strong> 2021 Q1 2022 Q2 2022 Q3 2022 <strong>Q4</strong> 2022 Q1 <strong>2023</strong> Q2 <strong>2023</strong> Q3 <strong>2023</strong> <strong>Q4</strong> <strong>2023</strong><br />
APAC INVENTORY VALUE (MILLION USD) 1, 2<br />
Corp. Airliner Long Range Large Medium Light<br />
1,000<br />
800<br />
600<br />
400<br />
200<br />
0<br />
<strong>Q4</strong> 2020 Q1 2021 Q2 2021 Q3 2021 <strong>Q4</strong> 2021 Q1 2022 Q2 2022 Q3 2022 <strong>Q4</strong> 2022 Q1 <strong>2023</strong> Q2 <strong>2023</strong> Q3 <strong>2023</strong> <strong>Q4</strong> <strong>2023</strong><br />
The global inventory value at the end of <strong>Q4</strong> <strong>2023</strong> declined to USD<br />
8.30 billion after reaching a peak of USD 8.80 billion in October,<br />
representing a 33.6% year-over-year increase compared to the end of<br />
2022, and a 162% increase from the end of December 2021. Global<br />
inventory growth was not significant compared to the previous<br />
quarter. The models with the largest changes in market value were<br />
the Large Gulfstream G450 which added eight new listings (up<br />
USD 124 million), and <strong>2023</strong>s best-selling model – the Long Range<br />
Gulfstream G550 (down USD 280 million).<br />
A total of eight Corporate Airliners (three ACJs, three BBJs and two<br />
Lineage 1000s) were sold during the fourth quarter, resulting in a<br />
decrease in the total inventory value from USD 679 million to USD<br />
571 million. This led to a decline in the inventory value of Corporate<br />
1. <strong>Asian</strong> <strong>Sky</strong> Group's Business Jet Inventory Value by size category is calculated by taking the total number of aircraft for sale from a selection of 44 models, multiplied by their average asking price.<br />
2. Historical inventory value and transactions are subject to change based on latest market information updates.<br />
FOURTH QUARTER <strong>2023</strong> — ASIAN SKY QUARTERLY | 56
MARKET DYNAMICS: BUSINESS JETS<br />
Airliners. On the other hand, the Large Jet inventory value rose<br />
by USD 138 million during the quarter. Aside from Large Jets, the<br />
inventory value of the Long Range Jet and Medium Jet categories<br />
both saw growth of less than 5% compared to last quarter, whilst the<br />
Light Jet inventory value decreased from USD 632 million in Q3 <strong>2023</strong><br />
to USD 531 million at the end of <strong>2023</strong>.<br />
Long Range Jets still accounted for the highest global inventory value,<br />
with the Gulfstream G550, Bombardier Global 6000 and Gulfstream<br />
G650ER as the top three models, sharing combined 40% in this<br />
category. The G450 remained the most popular model in the Large Jet<br />
category, with the Challenger 350 leading the Medium Jet catgeory.<br />
Unlike the global market, Asia-Pacific's pre-owned market inventory<br />
value showed a different growth trend. The total inventory value<br />
of Corporate Airliners and Light Jets in APAC remained unchanged<br />
from the past quarter. The Long Range Jets’ inventory value nearly<br />
doubled as three G650ERs from Greater China entered the preowned<br />
market (one each from mainland China, Hong Kong and<br />
Taiwan respectively). The inventory value of the Large Jet and<br />
Medium Jet categories increased by USD 64 million and USD 17<br />
million, respectively.<br />
AIRCRAFT TRANSACTIONS 2 WORLDWIDE<br />
Corp. Airliner Long Range Large Medium Light<br />
200<br />
180<br />
160<br />
140<br />
120<br />
100<br />
80<br />
60<br />
40<br />
20<br />
0<br />
Q1 2021 Q2 2021 Q3 2021 <strong>Q4</strong> 2021 Q1 2022 Q2 2022 Q3 2022 <strong>Q4</strong> 2022 Q1 <strong>2023</strong> Q2 <strong>2023</strong> Q3 <strong>2023</strong> <strong>Q4</strong> <strong>2023</strong><br />
The global retail transactions of business jets reached a peak at<br />
the end of <strong>2023</strong>, with a total of 245 transactions recorded in <strong>Q4</strong><br />
<strong>2023</strong>, an increase of 7.5% compared to <strong>Q4</strong> 2022. Some 31% of all<br />
transactions were Long Range Jets, led by the Gulfstream G550<br />
(22 transactions) and Bombardier Global 6000 (ten). There were<br />
58 transactions for Medium Jets and Light Jets respectively,<br />
each accounting for 25% of the total volume. The most popular<br />
Light Jets were the Citation CJ 3 (25) and Embraer Phenom 300/E<br />
(21), while Medium Jet transactions were led by the Bombardier<br />
Challenger 300 (14) and Gulfstream G200 (13). The fourth<br />
quarter is always the busiest period for transactions of Corporate<br />
Airliners, and a total of eight Corporate Airliners were sold during<br />
this quarter, accounting for over 60% of all Corporate Airliner<br />
transactions in <strong>2023</strong>.<br />
57 | ASIAN SKY QUARTERLY - FOURTH QUARTER <strong>2023</strong>
MARKET DYNAMICS: BUSINESS JETS<br />
% OF FLEET FOR SALE<br />
Corp. Airliner Long Range Large Medium Light APAC<br />
8%<br />
7%<br />
6%<br />
5%<br />
4%<br />
3%<br />
2%<br />
1%<br />
0<br />
<strong>Q4</strong> 2020 Q1 2021 Q2 2021 Q3 2021 <strong>Q4</strong> 2021 Q1 2022 Q2 2022 Q3 2022 <strong>Q4</strong> 2022 Q1 <strong>2023</strong> Q2 <strong>2023</strong> Q3 <strong>2023</strong> <strong>Q4</strong> <strong>2023</strong><br />
After a spate of transactions at the end of the year, there was a decline<br />
in the global percentage of aircraft for sale from 5.3% to 5%. The<br />
models with the largest changes in the fleet for sale were all from<br />
Gulfstream, including 12 Long Range G550s (12 left the pre-owned<br />
market), and the Large G450 (eight new to the market). Despite the<br />
large number of aircraft sold over the winter, the number of aircraft for<br />
sale globally continued to trend upward. Compared to the same period<br />
in 2022, there were 137 more aircraft for sale at the end of <strong>Q4</strong> <strong>2023</strong>, with<br />
the ratio of fleet for sale increasing by one-third. The historical trend<br />
of aircraft for sale in Asia-Pacific has been less pronounced than the<br />
growth trend in the global market. During this quarter, the ratio of aircraft<br />
for sale in Asia-Pacific rose from 4.4% to 5.7%, and the number of aircraft<br />
for sale increased from 23 to 35, which was on par with the number of<br />
aircraft for sale at the end of 2021.<br />
AVERAGE DAYS ON MARKET<br />
Corp. Airliner Long Range Large Medium Light APAC<br />
700<br />
600<br />
500<br />
400<br />
300<br />
200<br />
100<br />
0<br />
<strong>Q4</strong> 2020 Q1 2021 Q2 2021 Q3 2021 <strong>Q4</strong> 2021 Q1 2022 Q2 2022 Q3 2022 <strong>Q4</strong> 2022 Q1 <strong>2023</strong> Q2 <strong>2023</strong> Q3 <strong>2023</strong> <strong>Q4</strong> <strong>2023</strong><br />
The global average days on market (DOM) for all size categories<br />
remained generally stable, with a slight increase compared to Q3 <strong>2023</strong>.<br />
The average DOM for Corporate Airliners rose from 282 in <strong>Q4</strong> 2022 to<br />
428 in <strong>2023</strong>, with the DOM of Corporate Airliners sold in <strong>2023</strong> ranging<br />
from three months to more than a year. The average DOM for other size<br />
categories at the end of <strong>2023</strong> was 166 days. The addition of 28 aircraft<br />
from APAC entering the pre-owned market during <strong>Q4</strong> was one factor<br />
which led to the average DOM for the Asia-Pacific region declining from<br />
174 days to 166 in the fourth quarter.<br />
The global market value has remained on a slow upward trend during<br />
<strong>2023</strong>, while the demand for business jets did not show a significant rise<br />
over the past year, and the average number of days on the market has<br />
remained stable across all size categories. According to our Mood and<br />
Intentions Survey earlier in this publication, the current business jet<br />
market will likely remain a balanced market.<br />
FOURTH QUARTER <strong>2023</strong> — ASIAN SKY QUARTERLY | 58
MARKET DYNAMICS: BUSINESS JETS<br />
SUPPLY / DEMAND INDICATORS<br />
BUSINESS JETS<br />
Corp. Airliner Long Range Large Medium Light<br />
SUPPLY VS. DEMAND RATIO<br />
AVERAGE DAYS ON MARKET<br />
SUPPLY<br />
> DEMAND<br />
DAYS ON MARKET<br />
AVERAGE<br />
% OF FLEET<br />
FOR SALE<br />
MODEL<br />
AVERAGE<br />
NO TRANSACTION<br />
16.7%<br />
ACJ318<br />
4.1%<br />
ACJ319<br />
3.8%<br />
ACJ320<br />
5.9%<br />
BBJ<br />
NO TRANSACTION<br />
9.1%<br />
BBJ2<br />
4.5%<br />
CL300<br />
3.7%<br />
CL350<br />
7.5%<br />
CL604<br />
7.3%<br />
CL605<br />
4.2%<br />
CL650<br />
6.7%<br />
CL850<br />
16.9%<br />
GL Express<br />
7.5%<br />
GL XRS<br />
8.2%<br />
GL5000<br />
5.2%<br />
GL6000<br />
4.2%<br />
CIT. CJ3<br />
4.1%<br />
CIT. CJ4<br />
1.1%<br />
CIT. Latitude<br />
3.4%<br />
CIT. Sovereign<br />
NO TRANSACTION<br />
13.0%<br />
F900DX<br />
13.4%<br />
F900EX<br />
5.9%<br />
F900EXe<br />
2.2%<br />
F900LX<br />
5.3%<br />
F2000LX<br />
2.9%<br />
F2000LXS<br />
6.4%<br />
F2000S<br />
5.4%<br />
F7X<br />
3.1%<br />
F8X<br />
3.2%<br />
Phenom 300<br />
3.7%<br />
L600<br />
2.8%<br />
L650<br />
0.0%<br />
L1000<br />
13.0%<br />
G200<br />
2.6%<br />
G280<br />
8.8%<br />
G450<br />
4.8%<br />
G500<br />
5.4%<br />
G550<br />
4.1%<br />
G650<br />
2.0%<br />
G650ER<br />
250% 200%<br />
150%<br />
100% 50%<br />
0<br />
Average AC for sale / Total sold in last 12 months<br />
5.0%<br />
Average<br />
0 200 400 600 800 1000<br />
The above chart reflects where certain aircraft models are positioned in<br />
terms of supply and demand (based on a ratio of completed transactions<br />
compared to the number of sellers and the average number of days on the<br />
market for a transaction to take place).<br />
For some model types, given the market indicators shown on the previous<br />
page, the stabilization in pre-owned asking prices and decline in inventory<br />
level appear to have stimulated increased demand, leading to an increase<br />
in transactions and a more balanced state of supply and demand.<br />
These indications do not necessarily mean that prices will be higher in the<br />
future, but it does indicate that sellers of these particular models are more<br />
likely to find willing buyers in a shorter period of time than on average.<br />
This can be seen the most with certain Gulfstream (G200, G450, G550,<br />
G650), Bombardier (Challenger 604/605 & Global 5000) and Dassault<br />
Falcon models (2000 Series and 7X), where more transactions are<br />
occurring relative to the number for sale, and transactions are requiring<br />
less time on the market for sellers to complete.<br />
59 | ASIAN SKY QUARTERLY - FOURTH QUARTER <strong>2023</strong>
MARKET DYNAMICS: BUSINESS JETS<br />
MARKET POSITIONING<br />
BUSINESS JETS<br />
Corp. Airliner Long Range Large Medium Light<br />
INCREASED SUPPLY<br />
Balanced<br />
Supply & Demand<br />
INCREASED DEMAND<br />
ACJ318<br />
ACJ319<br />
ACJ320<br />
BBJ<br />
BBJ 2<br />
CL300<br />
CL350<br />
CL604<br />
CL605<br />
CL650<br />
CL850<br />
GL Express<br />
GL XRS<br />
GL5000<br />
GL6000<br />
CIT. CJ3<br />
CIT. CJ4<br />
CIT. Latitude<br />
CIT. Sovereign<br />
F900DX<br />
F900EX<br />
F900EXe<br />
F900LX<br />
F2000LX<br />
F2000LXS<br />
F2000S<br />
F7X<br />
F8X<br />
Phenom 300<br />
L600<br />
L650<br />
L1000<br />
G200<br />
G280<br />
G450<br />
G500<br />
G550<br />
G650<br />
G650ER<br />
The above chart provides a visual representation of the supply /<br />
demand ratio of each aircraft model relative to the overall market,<br />
and is based on a "Marketability" calculation for each particular<br />
model including the following four market indicators:<br />
1. The percentage of aircraft for sale relative to its fleet size.<br />
2. The number of aircraft sold relative to the average number for sale.<br />
3. The average days for sale relative to the overall market average.<br />
4. The momentum of the marketplace (represented by the trend<br />
towards supply and demand market equilibrium portrayed earlier).<br />
When taking into account these four factors, most of the large<br />
and medium sized jets, such as the Challenger 600, Falcon 2000<br />
& 900 Series, as well as various Gulfstream models, appear<br />
better positioned to find buyers available, compared to corporate<br />
airliner models.<br />
<strong>Asian</strong> <strong>Sky</strong> Group expanded its market research scope in Q3 2019<br />
to include 39 business jet models including light jet models as<br />
described in the report.<br />
FOURTH QUARTER <strong>2023</strong> — ASIAN SKY QUARTERLY | 60
MARKET DYNAMICS: HELICOPTERS<br />
PRE-OWNED HELICOPTERS MARKET <strong>Q4</strong> <strong>2023</strong> 1<br />
GLOBAL INVENTORY VALUE (MILLION USD) 2,3<br />
Heavy Medium Twin Light Twin Single<br />
1,600<br />
1,400<br />
1,200<br />
1,000<br />
800<br />
600<br />
400<br />
200<br />
0<br />
<strong>Q4</strong> 2020 Q1 2021 Q2 2021 Q3 2021 <strong>Q4</strong> 2021 Q1 2022 Q2 2022 Q3 2022 <strong>Q4</strong> 2022 Q1 <strong>2023</strong> Q2 <strong>2023</strong> Q3 <strong>2023</strong> <strong>Q4</strong> <strong>2023</strong><br />
Heavy Medium Twin Light Twin Single<br />
250<br />
200<br />
150<br />
100<br />
50<br />
APAC INVENTORY VALUE (MILLION USD) 2,3<br />
0<br />
Q3 2021 <strong>Q4</strong> 2021 Q1 2022 Q2 2022<br />
<strong>Q4</strong> 2020 Q1 2021 Q2 2021 Q3 2022 <strong>Q4</strong> 2022 Q1 <strong>2023</strong> Q2 <strong>2023</strong> Q3 <strong>2023</strong> <strong>Q4</strong> <strong>2023</strong><br />
The global helicopter inventory value gradually reduced after a sharp<br />
rise in October <strong>2023</strong> and reached USD 1,006 million at the end of <strong>Q4</strong><br />
<strong>2023</strong>. Compared to the end of Q3 <strong>2023</strong> and <strong>Q4</strong> 2022, it increased by<br />
USD 64 million and USD 80 million respectively, corresponding to<br />
growth rates of 6.8% and 8.6%. In <strong>2023</strong>, the average annual inventory<br />
value amounted to USD 987 million, with two peak values recorded at<br />
the end of April (USD 1,074 million) and October (USD 1,068 million). In<br />
addition, by the end of the year <strong>2023</strong>, the Leonardo AW139 stood out<br />
as the model with the highest inventory value (USD 144 million), while<br />
the Airbus EC155B accounted for the lowest inventory value (USD 3).<br />
Although the Medium Twin and Single turbine categories accounted<br />
for the highest inventory value at USD 300 million and USD 395 million<br />
respectively at the end of <strong>Q4</strong>, the Light Twin category witnessed the<br />
greatest growth during this quarter. At the end of October <strong>2023</strong>, the<br />
Light Twin and Medium Twin categories recorded the highest growth<br />
1. Super Medium Helicopters were not included in Market Dynamics due to insufficient available data.<br />
2. <strong>Asian</strong> <strong>Sky</strong> Group's Helicopter Inventory Value by size category is calculated by taking the total number of aircraft for sale from a selection of 29 models, multiplied by their average asking price.<br />
3. Historical inventory value and transactions are subject to change based on latest market information updates.<br />
61 | ASIAN SKY QUARTERLY - FOURTH QUARTER <strong>2023</strong>
MARKET DYNAMICS: HELICOPTERS<br />
rates compared to the end of September, reaching 27.9% and 15.6%<br />
respectively, mainly due to the increase in inventory value of AW109SP<br />
Grandnew, AW109S Grand, AW139 and AW169. The AW139 saw the<br />
largest value growth, rising from USD 138 million to USD 167 million in<br />
just one month. Interestingly, the quarter-on-quarter increase in the Single<br />
turbine category (with a growth rate of 8.3%) surpassed the Medium Twin<br />
category to become the second highest growth category after the Light<br />
Twin category (with a growth rate of 18.7%). The top five models with<br />
the biggest quarter-over-quarter rise in inventory value all fell under the<br />
Light Twin and Single turbine categories, including Bell 429, EC135, H130,<br />
H125 and EC130B4. In particular, the Bell 429 observed a value increase<br />
of up to USD 20 million. The Heavy category was the only category that<br />
experienced a value drop (down USD 9 million) at the end of <strong>Q4</strong> compared<br />
to the previous quarter, because of a decrease in the value of the H225,<br />
which was the largest decline among all models tracked.<br />
The Asia-Pacific helicopter market showed a different market value<br />
trend from the global market. The overall inventory value witnessed<br />
a continuous decline, falling from USD 126 million at the end of Q3<br />
to USD 98 million at the end of <strong>Q4</strong>, signifying a quarterly decrease of<br />
22.5%. In a year-on-year comparison, it experienced an USD 8 million<br />
drop, representing a 7.8% decrease.<br />
When looking at the performance of different size categories in the<br />
Asia-Pacific market in <strong>Q4</strong> compared to Q3, except for the Heavy<br />
category, which maintained an unchanged inventory value, the Medium<br />
Twin, Light Twin and Single turbine categories saw respective value<br />
declines of USD 25 million, USD 2 million, and USD 1 million. The sharp<br />
decrease in the inventory value of the Medium Twin category can<br />
be attributed to the reduced values of AW139, S76C+ and S76C++.<br />
Notably, AW139 recorded the most significant drop, with its value<br />
decreasing from USD 24 million to USD 7 million, as a result of the sale<br />
of two units during <strong>Q4</strong>.<br />
Considering the changes in the inventory value levels, the global<br />
helicopter market is undergoing an adjustment between a buyerfavourable<br />
environment and an equilibrium state, while the Asia-Pacific<br />
market is further moving towards a balanced market.<br />
AIRCRAFT TRANSACTIONS 3 WORLDWIDE<br />
Heavy Medium Twin Light Twin Single<br />
90<br />
80<br />
70<br />
60<br />
50<br />
40<br />
30<br />
20<br />
10<br />
0<br />
Q1 2021 Q2 2021 Q3 2021 <strong>Q4</strong> 2021 Q1 2022 Q2 2022 Q3 2022 <strong>Q4</strong> 2022 Q1 <strong>2023</strong> Q2 <strong>2023</strong> Q3 <strong>2023</strong> <strong>Q4</strong> <strong>2023</strong><br />
In <strong>Q4</strong> <strong>2023</strong>, there were 151 recorded retail transactions in total,<br />
down 16.6% compared to Q3. The average percentage of all<br />
helicopters sold in <strong>Q4</strong> was around 0.4%. Although the Heavy<br />
category accounted for only 4% of total transactions, it was the only<br />
category to see an increase in transaction volume in <strong>Q4</strong>, rising from<br />
three to six transactions. Among all categories, the Heavy category<br />
also recorded the highest average percentage of helicopters sold<br />
in <strong>Q4</strong>, standing at 0.4%. The most popular Heavy helicopter was<br />
the Sikorsky S-92A, with four units sold in <strong>Q4</strong>. Conversely, the <strong>Q4</strong><br />
transaction volume of the Single turbine category (accounting for<br />
69% of transactions), Medium Twin category (13%), and Light Twin<br />
category (14%) decreased by 15, 14, and four units, respectively.<br />
In the Single turbine category, the most popular models were the<br />
Bell 206B-3 Jetranger (21) and AS350B2 (20). The AW139 (13) and<br />
H145 (5) were the most traded models in the Medium Twin category<br />
and Light Twin category. The model that experienced the highest<br />
quarter-over-quarter increase in transaction volume was the Bell<br />
206L-3 Longranger, up by seven units, while the models with the<br />
largest transaction volume decrease were the H125 and S76C++,<br />
down by seven units each.<br />
FOURTH QUARTER <strong>2023</strong> — ASIAN SKY QUARTERLY | 62
MARKET DYNAMICS: HELICOPTERS<br />
% OF FLEET FOR SALE<br />
Heavy Medium Twin Light Twin Single APAC<br />
6%<br />
5%<br />
4%<br />
3%<br />
2%<br />
1%<br />
0<br />
<strong>Q4</strong> 2020 Q1 2021 Q2 2021 Q3 2021 <strong>Q4</strong> 2021 Q1 2022 Q2 2022 Q3 2022 <strong>Q4</strong> 2022 Q1 <strong>2023</strong> Q2 <strong>2023</strong> Q3 <strong>2023</strong> <strong>Q4</strong> <strong>2023</strong><br />
At the end of <strong>2023</strong>, the number of pre-owned helicopters listed for sale<br />
in the global market rose to 387, representing a 10.3% increase from<br />
the end of previous quarter and a 13.5% increase compared to a year<br />
earlier. Among them, 61% were Single turbine helicopters, led by the<br />
Bell 206B-3 Jetranger (55 units) and AS350B2 (33). Compared to Q3,<br />
the number of helicopters for sale in the Single turbine category and<br />
Light Twin category increased by 20 units and 19 units respectively,<br />
with no substantial changes in the Heavy and Medium Twin category.<br />
Single turbine Bell 206B-3 Jetranger (up ten units), Light Twin EC135<br />
(up six), Light Twin AW109SP Grandnew (up five) and Single turbine<br />
EC130B4 (up five) saw the largest quarter-over-quarter increase in the<br />
fleet for sale. The global percentage of helicopters available for sale<br />
also increased from 2.4% at the end of Q3 to 2.7% at the end of <strong>Q4</strong>.<br />
Among the different categories, the Medium Twin category had the<br />
highest percentage for sale in <strong>Q4</strong> at 3%, while the Light Twin category<br />
experienced the largest percentage increase (up 0.8%) and the Heavy<br />
category witnessed the greatest percentage decrease (down 0.2%).<br />
The changes in the Asia-Pacific market were not as significant as<br />
those in the global market. By the end of the year, the total number of<br />
helicopters for sale increased by just one unit to 46, with the ratio of<br />
aircraft for sale at 1.9%. The model with the highest number for sale in<br />
<strong>Q4</strong> in Asia-Pacific was the Airbus AS350B2 (11 units).<br />
AVERAGE DAYS ON MARKET<br />
Heavy Medium Twin Light Twin Single APAC<br />
800<br />
700<br />
600<br />
500<br />
400<br />
300<br />
200<br />
100<br />
0<br />
<strong>Q4</strong> 2020 Q1 2021 Q2 2021 Q3 2021 <strong>Q4</strong> 2021 Q1 2022 Q2 2022 Q3 2022 <strong>Q4</strong> 2022 Q1 <strong>2023</strong> Q2 <strong>2023</strong> Q3 <strong>2023</strong> <strong>Q4</strong> <strong>2023</strong><br />
The average days on the market (DOM) for the global helicopter fleet<br />
for sale dropped slightly from 388 days at the end of Q3 to 376 days<br />
at the end of <strong>Q4</strong>. The Medium Twin category had the highest number<br />
of average days on the market, reaching 549 days by the end of the<br />
year, as the average DOM for H155 and S76C+ both stood at more<br />
than 1,000 days. The Heavy category saw the largest increase in<br />
average days on market from the previous quarter, with an increase<br />
of 57 days, mainly due to low demand for Heavy helicopters and<br />
buyers’ preference for helicopters that had not been on the market<br />
for a long period. By contrast, the Light Twin category experienced<br />
the greatest quarter-over-quarter decrease, reducing by 30 days,<br />
which can be attributed to the increased number of newly listed<br />
aircraft for sale. Compared to Q3, the AW109S Grand and EC135<br />
witnessed the most substantial reduction in DOM in the Light Twin<br />
category, down 91 and 75 days, respectively. The significant addition<br />
of pre-owned AS350B2s in the Asia-Pacific market was the primary<br />
reason for the decrease in average DOM for the region, which fell by<br />
seven days to 310 days in <strong>Q4</strong>.<br />
63 | ASIAN SKY QUARTERLY - FOURTH QUARTER <strong>2023</strong>
MARKET DYNAMICS: HELICOPTERS<br />
SUPPLY / DEMAND INDICATORS<br />
HELICOPTERS<br />
Single Light Twin Medium Twin Heavy<br />
SUPPLY VS. DEMAND RATIO<br />
SUPPLY / DEMAND INDICATORS<br />
SUPPLY<br />
> DEMAND<br />
DAYS ON MARKET<br />
AVERAGE<br />
% FOR SALE MODEL<br />
AVERAGE<br />
2.9%<br />
AS350B2<br />
1.3%<br />
AS350B3<br />
4.7%<br />
EC130B4<br />
2.3%<br />
H125<br />
3.1%<br />
H130<br />
3.4%<br />
EC135<br />
1.1%<br />
EC145<br />
0.7%<br />
H145<br />
5.1%<br />
EC155B<br />
5.7%<br />
H155<br />
2.8%<br />
H225<br />
3.2%<br />
BELL 206B-3<br />
4.1%<br />
BELL 206L-3<br />
2.1%<br />
BELL 206L-4<br />
1.5%<br />
BELL 407<br />
5.1%<br />
BELL 505<br />
2.8%<br />
BELL 429<br />
1.8%<br />
BELL 412EP<br />
9.8%<br />
AW109Grand<br />
6.1%<br />
AW109SP GN<br />
2.2%<br />
AW139<br />
4.9%<br />
S76C+<br />
3.9%<br />
S76C++<br />
350% 300% 250% 200% 150% 100% 50% 0 2.67%<br />
0 100 200 300 400 500 600 700 800<br />
Average<br />
Average AC for sale / Total sold in last 12 months<br />
Average Days for Sale on Market<br />
The above chart reflects where certain aircraft models are positioned<br />
in terms of supply and demand (based on a ratio of completed<br />
transactions compared to the number of sellers, and average number<br />
of days on the market for a transaction to take place).<br />
FOURTH QUARTER <strong>2023</strong> — ASIAN SKY QUARTERLY | 64
MARKET DYNAMICS: HELICOPTERS<br />
MARKET POSITIONING<br />
HELICOPTERS<br />
Single Light Twin Medium Twin Heavy<br />
INCREASED SUPPLY<br />
Balanced<br />
Supply & Demand<br />
INCREASED DEMAND<br />
AS350B2<br />
AS350B3<br />
EC130B4<br />
H125<br />
H130<br />
EC135<br />
EC145<br />
H145<br />
EC155B<br />
H155<br />
H225<br />
BELL 206B-3<br />
BELL 206L-3<br />
BELL 206L-4<br />
BELL 407<br />
BELL 505<br />
BELL 429<br />
BELL 412EP<br />
AW109Grand<br />
AW109SP GN<br />
AW139<br />
S76C+<br />
S76C++<br />
The above chart provides a visual representation of the supply / demand ratio of each aircraft model relative to the overall market,<br />
resulting in a "Marketability" calculation of each particular model based on the following four market indicators:<br />
1. The percentage of aircraft for sale relative to its fleet size.<br />
2. The number of aircraft sold relative to the average number for sale.<br />
3. The average days for sale relative to the overall market average.<br />
4. The momentum of the marketplace (represented by the trend towards supply and demand market equilibrium portrayed earlier).<br />
Data Source: AMSTAT & ASG<br />
65 | ASIAN SKY QUARTERLY - FOURTH QUARTER <strong>2023</strong>
MARKET<br />
SUMMARY<br />
BUSINESS JETS<br />
<strong>Q4</strong> <strong>2023</strong><br />
FOURTH QUARTER <strong>2023</strong> — ASIAN SKY QUARTERLY | 66
MARKET SUMMARY: BUSINESS JETS<br />
AIRCRAFT POSITIONING<br />
ANNUAL OPERATING COST VS. CABIN VOLUME<br />
ANNUAL OPERATING COST (MILLION USD)<br />
10<br />
9<br />
8<br />
7<br />
6<br />
5<br />
4<br />
3<br />
2<br />
CORP. AIRLINER<br />
LONG RANGE<br />
LARGE<br />
MEDIUM<br />
LIGHT<br />
VERY LIGHT<br />
CIT. VII<br />
L45XR<br />
L40XR<br />
L75<br />
G100<br />
L70<br />
CIT. ULTRA<br />
H400XP<br />
H400XPR<br />
CIT. BRAVO<br />
CIT. CJ4<br />
CIT. CJ4 GEN 2<br />
PREMIER IA<br />
CIT. CJ1+<br />
CIT. CJ1<br />
CIT. M2<br />
IN PRODUCTION<br />
CEASED PRODUCTION<br />
ASTRA SP<br />
GLOBAL EXPRESS XRS & GLOBAL EXPRESS & GLOBAL 6000<br />
F900EX & F900EX EASY<br />
CL3500<br />
F50EX<br />
CIT. X<br />
CIT. X+<br />
CIT. LONGITUDE<br />
LEGACY 500<br />
CL604<br />
F2000<br />
PRAETOR 600<br />
H4000<br />
GLOBAL 5500<br />
F8X<br />
GLOBAL 5000<br />
F7X<br />
G200<br />
CIT. EXCEL<br />
CIT. XLS+<br />
CIT. ENCORE+<br />
CIT. ENCORE<br />
PHENOM 300E<br />
PC-24<br />
CIT. CJ3<br />
CIT. CJ2+<br />
CIT. CJ3+<br />
CIT. CJ2<br />
G-V<br />
CL650<br />
CL605<br />
G280<br />
CL350 & CL300<br />
ACJ319<br />
PHENOM 300<br />
NEXTANT 400XTI<br />
BBJ MAX 7<br />
ACJ318<br />
H850XP & H800XP<br />
CIT. SOVEREIGN<br />
CIT. XLS<br />
BBJ3<br />
ACJ319 NEO<br />
ACJ321<br />
ACJ320 NEO<br />
ACJ320<br />
BBJ2<br />
BBJ MAX 8<br />
BBJ<br />
G650ER<br />
GLOBAL 7500<br />
G650<br />
G550<br />
G600<br />
G500<br />
G450<br />
LEGACY 650E & LEGACY 650<br />
LEGACY 600<br />
F900LX<br />
G300<br />
G350<br />
G-IVSP<br />
CL850<br />
LINEAGE 1000E<br />
G-IV<br />
CIT. LATITUDE<br />
LEGACY 450 & PRAETOR 500<br />
CIT. SOVEREIGN+<br />
H900XP & H800<br />
G150<br />
L60XR<br />
BBJ MAX 9<br />
F2000LXS & F2000S F2000EX & F2000DX & F2000LX<br />
HONDAJET<br />
PHENOM 100E<br />
CIT. MUSTANG<br />
ECLIPSE 550<br />
1<br />
VISION SF50<br />
VISION SF50 G2<br />
200<br />
500<br />
1,000<br />
2,000<br />
3,000<br />
4,000<br />
5,000<br />
MAXIMUM CABIN VOLUME (CU FT)<br />
*Using data from Conklin & de Decker. Annual Operating Cost consist of Yearly Fixed Cost and Variable Cost under the assumption of 400 hours flight hours per year.<br />
6,000<br />
7,000<br />
8,000<br />
9,000<br />
10,000<br />
67 | ASIAN SKY QUARTERLY - FOURTH QUARTER <strong>2023</strong>
AIRCRAFT POSITIONING<br />
ANNUAL OPERATING COST VS. MAX RANGE<br />
OPERATING COST (MILLION USD)<br />
10<br />
9<br />
8<br />
7<br />
6<br />
5<br />
4<br />
3<br />
2<br />
CORP. AIRLINER<br />
LONG RANGE<br />
LARGE<br />
MEDIUM<br />
LIGHT<br />
VERY LIGHT<br />
CL3500 & CL350<br />
PREMIER IA<br />
CIT. CJ2+<br />
CIT. CJ2<br />
CIT. CJ1<br />
CIT. CJ1+<br />
IN PRODUCTION<br />
CEASED PRODUCTION<br />
CL300<br />
L75<br />
H4000<br />
L70<br />
CIT. EXCEL<br />
CIT. ULTRA<br />
H400XP<br />
CIT. BRAVO<br />
H400XPR<br />
CIT. X<br />
NEXTANT 400XTI<br />
L45XR<br />
CIT. VII<br />
L40XR<br />
CIT. M2<br />
F2000DX<br />
LEGACY 600<br />
CIT. X+<br />
LEGACY 500<br />
CIT. LONGITUDE<br />
L60XR<br />
CIT. XLS<br />
CIT. XLS+<br />
BBJ3<br />
ACJ321<br />
PC-24<br />
CIT. CJ3+<br />
CIT. CJ3<br />
CIT. ENCORE<br />
CIT. ENCORE+<br />
PHENOM 300<br />
PHENOM 300E<br />
CIT. CJ4 GEN 2<br />
G100<br />
ASTRA SP<br />
CIT. CJ4<br />
MARKET SUMMARY: BUSINESS JETS<br />
BBJ2<br />
BBJ MAX 9<br />
ACJ320 BBJ MAX 8<br />
BBJ<br />
ACJ319<br />
BBJ MAX 7<br />
ACJ320 NEO<br />
ACJ319 NEO<br />
GLOBAL EXPRESS XRS & GLOBAL 6000<br />
ACJ318<br />
LINEAGE 1000E<br />
GLOBAL 7500<br />
G650<br />
GLOBAL 5000<br />
GLOBAL EXPRESS<br />
G650ER<br />
G-V<br />
G550<br />
GLOBAL 5500<br />
G600<br />
G350<br />
G500<br />
F8X<br />
G300<br />
G450<br />
F7X<br />
LEGACY 650E & LEGACY 650<br />
G-IV<br />
G-IVSP<br />
F2000EX<br />
F2000<br />
CL604 F900EX EASY & F900EX<br />
F50EX<br />
CL850<br />
F900LX<br />
F2000LX<br />
CL650<br />
CL605<br />
G200<br />
F2000LXS<br />
PRAETOR 600<br />
G280<br />
F2000S<br />
H800XP<br />
H850XP<br />
CIT. LATITUDE<br />
H800<br />
LEGACY 450<br />
CIT. SOVEREIGN<br />
CIT. SOVEREIGN+<br />
PRAETOR 500<br />
H900XP<br />
G150<br />
PHENOM 100E<br />
HONDAJET<br />
CIT. MUSTANG<br />
ECLIPSE 550<br />
1<br />
VISION SF50 G2<br />
VISION SF50<br />
1,000<br />
2,000<br />
MAXIMUM CRUISE RANGE(CU FT)<br />
Max Range data source: Conklin & de Decker, this has adopted NBAA IFR rules and under Long Range Cruise Speed with maximum fuel on board, and four passengers with fuel reserve calculation<br />
for a 200 NM (365 Km) alternate.<br />
3,000<br />
4,000<br />
5,000<br />
6,000<br />
7,000<br />
8,000<br />
9,000<br />
FOURTH QUARTER <strong>2023</strong> — ASIAN SKY QUARTERLY | 68
MARKET SUMMARY: BUSINESS JETS<br />
AIRCRAFT POSITIONING<br />
MAX RANGE VS. CABIN VOLUME<br />
MAXIMUM CRUISE RANGE (NM)<br />
8,000<br />
7,000<br />
6,000<br />
5,000<br />
4,000<br />
3,000<br />
2,000<br />
1,000<br />
PRAETOR 500<br />
CIT. SOVEREIGN+<br />
G100<br />
ASTRA SP<br />
H850XP<br />
H800XP<br />
H800<br />
PHENOM 300E & PHENOM 300<br />
CIT. CJ4 GEN 2 & CIT. CJ4<br />
H400XPR<br />
CIT. M2<br />
CIT. CJ3<br />
CIT. BRAVO<br />
CIT. CJ2+<br />
CIT. CJ2<br />
CORP. AIRLINER<br />
LONG RANGE<br />
LARGE<br />
MEDIUM<br />
LIGHT<br />
VERY LIGHT<br />
NEXTANT 400XTI<br />
CIT. CJ3+<br />
CIT. CJ1+<br />
CIT. MUSTANG<br />
HONDAJET<br />
HONDAJET ELITE<br />
IN PRODUCTION<br />
CEASED PRODUCTION<br />
G280<br />
CIT. LONGITUDE<br />
CIT. X+<br />
F50EX<br />
CIT. X<br />
G150<br />
L70<br />
L45XR<br />
GLOBAL EXPRESS XRS & GLOBAL 6000<br />
PRAETOR 600<br />
CIT. CJ1<br />
GLOBAL 5500<br />
F2000LX<br />
PHENOM 100E<br />
CL605 & CL650<br />
F2000LXS<br />
G200<br />
L75<br />
PREMIER IA<br />
G600<br />
L60XR<br />
CIT. XLS+<br />
PC-24<br />
CIT. XLS<br />
CIT. EXCEL<br />
CIT. VII<br />
G550<br />
G-V<br />
F8X<br />
F7X<br />
GLOBAL 7500<br />
G650ER<br />
G650<br />
CL604<br />
F900LX<br />
F900EX<br />
F2000S<br />
G350<br />
G300<br />
F2000S<br />
CL350 & CL3500<br />
F2000DX<br />
F2000<br />
CL300<br />
LEGACY 500<br />
H4000<br />
CIT. ENCORE+<br />
CIT. ENCORE<br />
L40XR<br />
CIT. ULTRA<br />
H400XP<br />
BBJ MAX 7<br />
GLOBAL EXPRESS BBJ<br />
ACJ318<br />
ACJ319<br />
F6X<br />
G500<br />
GLOBAL 5000<br />
G450<br />
G-IV<br />
G-IVSP<br />
LEGACY 600<br />
LEGACY 450<br />
CIT. LATITUDE<br />
CIT. SOVEREIGN<br />
H900XP<br />
BBJ2<br />
ACJ320<br />
ACJ320 NEO<br />
LINEAGE 1000E<br />
ACJ321<br />
BBJ MAX 8<br />
ACJ319 NEO<br />
BBJ MAX 9<br />
BBJ3<br />
LEGACY 650 & LEGACY 650E<br />
ECLIPSE 550<br />
VISION SF50 G2<br />
VISION SF50<br />
500<br />
50<br />
200<br />
500<br />
1,000<br />
MAXIMUM CABIN VOLUME (CU FT)<br />
2,000<br />
3,000<br />
4,000<br />
5,000<br />
6,000<br />
7,000<br />
8,000<br />
9,000<br />
10,000<br />
69 | ASIAN SKY QUARTERLY - FOURTH QUARTER <strong>2023</strong>
MARKET SUMMARY<br />
INVENTORY LEVEL, PRICE TREND & TRANSACTIONS<br />
ACJ318 & ACJ319<br />
MARKET SUMMARY: BUSINESS JETS<br />
PERFORMANCE<br />
Max Range<br />
Max Speed<br />
Typ. Passengers<br />
ACJ318<br />
4,253 N.M. / 7,877 km<br />
Mach 0.82<br />
19<br />
ACJ319<br />
6,000 N.M. / 11,112 km<br />
Mach 0.82<br />
19<br />
MARKET<br />
No. for Sale (% of fleet)<br />
Avg Asking Price (USD)<br />
Avg Days on Market<br />
Past 12 Months<br />
Past 3 Months<br />
Sep-23<br />
4 (22.2%)<br />
26.50M<br />
282<br />
0<br />
0<br />
Dec-23<br />
3 (16.7%)<br />
23.00M<br />
271<br />
0<br />
0<br />
Sep-23<br />
4 (5.4%)<br />
45.00M<br />
187<br />
3<br />
1<br />
Dec-23<br />
3 (4.1%)<br />
45.00M<br />
242<br />
3<br />
1<br />
Average Asking Price (Million USD)<br />
$39.50<br />
ACJ318<br />
ACJ319<br />
$45.00 $45.00<br />
$26.50 $25.00 $23.00<br />
Dec<br />
Mar<br />
2021 2022<br />
Jun<br />
Sep<br />
Dec Mar Jun Sep<br />
2022 2022 2022 <strong>2023</strong> <strong>2023</strong> <strong>2023</strong><br />
Dec<br />
<strong>2023</strong><br />
Market Indicators (vs. Last Quarter)<br />
ACJ318<br />
Transaction Level (Past 12 Months)<br />
Inventory Level<br />
Average Asking Price<br />
Average Days on Market<br />
For Sale vs. Sold<br />
Sold For Sale<br />
1<br />
1<br />
1<br />
5 4 7 6 4 3 7<br />
1 1<br />
8 6<br />
ACJ319<br />
Transaction Level (Past 12 Months)<br />
Inventory Level<br />
Average Asking Price<br />
Average Days on Market<br />
Dec<br />
Mar<br />
2021 2022<br />
Jun<br />
Sep<br />
Dec Mar Jun Sep<br />
2022 2022 2022 <strong>2023</strong> <strong>2023</strong> <strong>2023</strong><br />
Dec<br />
<strong>2023</strong><br />
Source: AMSTAT & ASG<br />
FOURTH QUARTER <strong>2023</strong> — ASIAN SKY QUARTERLY | 70
MARKET SUMMARY: BUSINESS JETS<br />
BBJ & BBJ2<br />
PERFORMANCE<br />
Max Range<br />
Max Speed<br />
Typ. Passengers<br />
BBJ<br />
6,600 N.M. / 12,200 km<br />
Mach 0.79<br />
19<br />
BBJ2<br />
6,465 N.M. / 11,970 km<br />
Mach 0.79<br />
19<br />
MARKET<br />
No. for Sale (% of fleet)<br />
Avg Asking Price (USD)<br />
Avg Days on Market<br />
Past 12 Months<br />
Past 3 Months<br />
Sep-23<br />
9 (7.5%)<br />
37.33M<br />
286<br />
6<br />
2<br />
Dec-23<br />
7 (5.9%)<br />
39.75M<br />
413<br />
7<br />
2<br />
Sep-23<br />
1 (4.2%)<br />
32.00M<br />
278<br />
0<br />
0<br />
Dec-23<br />
2 (9.1%)<br />
32.00M<br />
229<br />
0<br />
0<br />
Average Asking Price (Million USD)<br />
BBJ<br />
BBJ2<br />
Market Indicators (vs. Last Quarter)<br />
$29.00<br />
$32.00<br />
$39.75<br />
$32.00<br />
BBJ<br />
Transaction Level (Past 12 Months)<br />
Inventory Level<br />
$26.75<br />
$23.00<br />
Average Asking Price<br />
Average Days on Market<br />
Dec<br />
Mar<br />
2021 2022<br />
Jun<br />
Sep<br />
Dec Mar Jun Sep<br />
2022 2022 2022 <strong>2023</strong> <strong>2023</strong> <strong>2023</strong><br />
Dec<br />
<strong>2023</strong><br />
For Sale vs. Sold<br />
Sold For Sale<br />
4<br />
1 2 1<br />
2<br />
1<br />
2<br />
1<br />
1<br />
1<br />
1<br />
1<br />
1<br />
2<br />
BBJ2<br />
Transaction Level (Past 12 Months)<br />
Inventory Level<br />
Average Asking Price<br />
Average Days on Market<br />
11 9 10 8 8 8 7<br />
10 9<br />
Dec<br />
Mar<br />
2021 2022<br />
Jun<br />
Sep<br />
Dec Mar Jun Sep<br />
2022 2022 2022 <strong>2023</strong> <strong>2023</strong> <strong>2023</strong><br />
Dec<br />
<strong>2023</strong><br />
Source: AMSTAT & ASG<br />
71 | ASIAN SKY QUARTERLY - FOURTH QUARTER <strong>2023</strong>
MARKET SUMMARY: BUSINESS JETS<br />
CHALLENGER 300 & 350<br />
PERFORMANCE<br />
Max Range<br />
Max Speed<br />
Typ. Passengers<br />
CL300<br />
3,340 N.M. / 6,185 km<br />
Mach 0.82<br />
19<br />
CL350<br />
3,421 N.M. / 6,335 km<br />
Mach 0.82<br />
19<br />
MARKET<br />
No. for Sale (% of fleet)<br />
Avg Asking Price (USD)<br />
Avg Days on Market<br />
Past 12 Months<br />
Past 3 Months<br />
Sep-23<br />
26 (5.8%)<br />
11.69M<br />
181<br />
35<br />
12<br />
Dec-23<br />
20 (4.5%)<br />
11.88M<br />
209<br />
37<br />
14<br />
Sep-23<br />
15 (3.3%)<br />
19.65M<br />
132<br />
21<br />
5<br />
Dec-23<br />
16 (3.7%)<br />
19.09M<br />
120<br />
20<br />
7<br />
Average Asking Price (Million USD)<br />
CL300<br />
CL350<br />
Market Indicators (vs. Last Quarter)<br />
$20.50<br />
$19.09<br />
CL300<br />
Transaction Level (Past 12 Months)<br />
$12.30<br />
$13.60<br />
$11.88<br />
Inventory Level<br />
Average Asking Price<br />
Average Days on Market<br />
Dec<br />
Mar<br />
2021 2022<br />
Jun<br />
Sep<br />
Dec Mar Jun Sep<br />
2022 2022 2022 <strong>2023</strong> <strong>2023</strong> <strong>2023</strong><br />
Dec<br />
<strong>2023</strong><br />
For Sale vs. Sold<br />
Sold For Sale<br />
6<br />
5 5<br />
7 9<br />
6<br />
4<br />
3<br />
9<br />
9 13<br />
6<br />
1<br />
4<br />
8<br />
3<br />
6 1<br />
1<br />
2<br />
4 6<br />
1<br />
2 2<br />
4 12 21 21 20 29 33<br />
41 36<br />
Dec<br />
Mar<br />
2021 2022<br />
Jun<br />
Sep<br />
Dec Mar Jun Sep<br />
2022 2022 2022 <strong>2023</strong> <strong>2023</strong> <strong>2023</strong><br />
Dec<br />
<strong>2023</strong><br />
CL350<br />
Transaction Level (Past 12 Months)<br />
Inventory Level<br />
Average Asking Price<br />
Average Days on Market<br />
Source: AMSTAT & ASG<br />
FOURTH QUARTER <strong>2023</strong> — ASIAN SKY QUARTERLY | 72
MARKET SUMMARY: BUSINESS JETS<br />
CHALLENGER 604, 605 & 650<br />
PERFORMANCE<br />
Max Range<br />
Max Speed<br />
Typ. Passengers<br />
CL604<br />
4,027 N.M. / 7,458 km<br />
Mach 0.82<br />
9<br />
CL605<br />
4,123 N.M. / 7,635 km<br />
Mach 0.82<br />
9<br />
CL650<br />
4,123 N.M. / 7,635 km<br />
Mach 0.82<br />
10<br />
MARKET Sep-23 Dec-23 Sep-23 Dec-23 Sep-23<br />
Dec-23<br />
No. for Sale (% of fleet)<br />
Avg Asking Price (USD)<br />
Avg Days on Market<br />
Past 12 Months<br />
Past 3 Months<br />
30 (8.6%)<br />
6.58M<br />
243<br />
28<br />
8<br />
26 (7.5%)<br />
6.42M<br />
262<br />
26<br />
8<br />
20 (7.0%)<br />
13.11M<br />
188<br />
21<br />
7<br />
21 (7.3%)<br />
11.96M<br />
220<br />
19<br />
5<br />
4 (2.9%)<br />
21.07M<br />
56<br />
8<br />
2<br />
6 (4.2%)<br />
25.90M<br />
65<br />
8<br />
3<br />
Average Asking Price (Million USD)<br />
$16.83<br />
$7.50<br />
$4.55<br />
CL604<br />
Dec<br />
Mar<br />
2021 2022<br />
For Sale vs. Sold<br />
Sold<br />
For Sale<br />
CL605<br />
CL650<br />
$28.00<br />
$15.13<br />
$8.04<br />
Jun<br />
Sep<br />
Dec Mar Jun Sep<br />
2022 2022 2022 <strong>2023</strong> <strong>2023</strong> <strong>2023</strong><br />
$25.90<br />
$11.96<br />
$6.42<br />
Dec<br />
<strong>2023</strong><br />
Market Indicators (vs. Last Quarter)<br />
CL604<br />
Transaction Level (Past 12 Months)<br />
Inventory Level<br />
Average Asking Price<br />
Average Days on Market<br />
CL605<br />
Transaction Level (Past 12 Months)<br />
Inventory Level<br />
Average Asking Price<br />
Average Days on Market<br />
7<br />
4<br />
11<br />
9<br />
10 6<br />
13 18 30 30 38 47 55<br />
54 53<br />
Dec<br />
Mar<br />
2021 2022<br />
8 8 9<br />
6 7<br />
10<br />
6 2 1<br />
3<br />
Jun<br />
Sep<br />
Dec Mar Jun Sep<br />
2022 2022 2022 <strong>2023</strong> <strong>2023</strong> <strong>2023</strong><br />
4<br />
4<br />
3 7 5 7<br />
5 5<br />
4<br />
Dec<br />
<strong>2023</strong><br />
CL650<br />
Transaction Level (Past 12 Months)<br />
Inventory Level<br />
Average Asking Price<br />
Average Days on Market<br />
Source: AMSTAT & ASG<br />
73 | ASIAN SKY QUARTERLY - FOURTH QUARTER <strong>2023</strong>
MARKET SUMMARY: BUSINESS JETS<br />
CHALLENGER 850<br />
Average Asking Price (Million USD)<br />
Market Indicators (vs. Last Quarter)<br />
$9.50<br />
Transaction Level (Past 12 Months)<br />
$7.00<br />
Inventory Level<br />
$5.70<br />
Average Asking Price<br />
Average Days on Market<br />
Dec<br />
Mar<br />
2021 2022<br />
For Sale vs. Sold<br />
Sold<br />
For Sale<br />
Jun<br />
Sep<br />
Dec Mar Jun Sep<br />
2022 2022 2022 <strong>2023</strong> <strong>2023</strong> <strong>2023</strong><br />
Dec<br />
<strong>2023</strong><br />
PERFORMANCE<br />
Max Range<br />
Max Speed<br />
Typ. Passengers<br />
2,946 N.M. / 5,456 km<br />
Mach 0.80<br />
18<br />
3<br />
2<br />
1<br />
2 2<br />
1<br />
1 1<br />
2<br />
1<br />
1<br />
1<br />
3 6 7 8 8 5 7 8 6<br />
MARKET<br />
No. for Sale (% of fleet)<br />
Avg Asking Price (USD)<br />
Avg Days on Market<br />
Sold in Past 12 Months<br />
Sold in Past 3 Months<br />
Sep-23<br />
8 (8.9%)<br />
6.90M<br />
344<br />
10<br />
3<br />
Dec-23<br />
6 (6.7%)<br />
9.50M<br />
371<br />
12<br />
3<br />
Dec<br />
Mar<br />
2021 2022<br />
Jun<br />
Sep<br />
Dec Mar Jun Sep<br />
2022 2022 2022 <strong>2023</strong> <strong>2023</strong> <strong>2023</strong><br />
Dec<br />
<strong>2023</strong><br />
Source: AMSTAT & ASG<br />
FOURTH QUARTER <strong>2023</strong> — ASIAN SKY QUARTERLY | 74
MARKET SUMMARY: BUSINESS JETS<br />
GLOBAL 5000 & 6000<br />
PERFORMANCE<br />
Max Range<br />
Max Speed<br />
Typ. Passengers<br />
GLOBAL 5000<br />
5,350 N.M. / 9,908 km<br />
Mach 0.82<br />
13<br />
GLOBAL EXPRESS<br />
6,125 N.M. / 11,343 km<br />
Mach 0.82<br />
13<br />
GLOBAL XRS<br />
6,226 N.M. / 11,520 km<br />
Mach 0.82<br />
13<br />
GLOBAL 6000<br />
6,080 N.M. / 11,260 km<br />
Mach 0.82<br />
13<br />
MARKET<br />
No. for Sale (% of fleet)<br />
Avg Asking Price (USD)<br />
Avg Days on Market<br />
Past 12 Months<br />
Past 3 Months<br />
Sep-23<br />
19 (8.2%)<br />
17.99M<br />
177<br />
23<br />
6<br />
Dec-23<br />
19 (8.2%)<br />
15.20M<br />
163<br />
19<br />
5<br />
Sep-23<br />
23 (16.9%)<br />
12.23M<br />
191<br />
14<br />
2<br />
Dec-23<br />
23 (16.9%)<br />
11.68M<br />
233<br />
16<br />
5<br />
Sep-23<br />
16 (10.0%)<br />
17.17M<br />
138<br />
14<br />
6<br />
Dec-23<br />
12 (7.5%)<br />
16.31M<br />
145<br />
15<br />
4<br />
Sep-23<br />
18 (5.5%)<br />
28.75M<br />
133<br />
29<br />
6<br />
Dec-23<br />
17 (5.2%)<br />
30.15M<br />
168<br />
29<br />
9<br />
Average Asking Price (Million USD)<br />
GL5000<br />
Dec<br />
Mar<br />
2021 2022<br />
Dec<br />
Mar<br />
2021 2022<br />
GL EXPRESS<br />
8<br />
9 7<br />
11 11 12<br />
4<br />
9<br />
4<br />
Jun<br />
Sep<br />
Dec Mar Jun Sep<br />
2022 2022 2022 <strong>2023</strong> <strong>2023</strong> <strong>2023</strong><br />
4<br />
GL XRS<br />
$34.00 $34.25<br />
$14.78<br />
$14.00<br />
$6.50<br />
For Sale vs. Sold<br />
Sold<br />
For Sale<br />
5<br />
$18.30<br />
$14.39<br />
GL6000<br />
$18.17<br />
15 7 3<br />
4<br />
4<br />
9 7 4<br />
21 26 23 33 43 59 61 76 71<br />
Jun<br />
Sep<br />
Dec Mar Jun Sep<br />
2022 2022 2022 <strong>2023</strong> <strong>2023</strong> <strong>2023</strong><br />
8<br />
5 9<br />
12 10<br />
$30.15<br />
$16.31<br />
$11.68<br />
Dec<br />
<strong>2023</strong><br />
1<br />
Dec<br />
<strong>2023</strong><br />
$15.20<br />
Market Indicators (vs. Last Quarter)<br />
GLOBAL 5000<br />
Transaction Level (Past 12 Months)<br />
Inventory Level<br />
Average Asking Price<br />
Average Days on Market<br />
GLOBAL EXPRESS<br />
Transaction Level (Past 12 Months)<br />
Inventory Level<br />
Average Asking Price<br />
Average Days on Market<br />
GLOBAL XRS<br />
Transaction Level (Past 12 Months)<br />
Inventory Level<br />
Average Asking Price<br />
Average Days on Market<br />
GLOBAL 6000<br />
Transaction Level (Past 12 Months)<br />
Inventory Level<br />
Average Asking Price<br />
Average Days on Market<br />
Source: AMSTAT & ASG<br />
75 | ASIAN SKY QUARTERLY - FOURTH QUARTER <strong>2023</strong>
MARKET SUMMARY: BUSINESS JETS<br />
CITATION CJ3 & CJ4<br />
PERFORMANCE<br />
Max Range<br />
Max Speed<br />
Typ. Passengers<br />
Cit. CJ3<br />
1,891 N.M. / 3,502 km<br />
Mach 0.73<br />
6<br />
Cit. CJ4<br />
1,991 N.M. / 3,687 km<br />
Mach 0.77<br />
7<br />
MARKET<br />
No. for Sale (% of fleet)<br />
Avg Asking Price (USD)<br />
Avg Days on Market<br />
Past 12 Months<br />
Past 3 Months<br />
Sep-23<br />
32 (4.8%)<br />
6.57M<br />
131<br />
55<br />
9<br />
Dec-23<br />
28 (4.2%)<br />
6.09M<br />
135<br />
53<br />
21<br />
Sep-23<br />
20 (4.9%)<br />
9.46M<br />
126<br />
36<br />
9<br />
Dec-23<br />
17 (4.1%)<br />
8.94M<br />
182<br />
33<br />
10<br />
Average Asking Price (Million USD)<br />
CJ3<br />
CJ4<br />
Market Indicators (vs. Last Quarter)<br />
$6.93<br />
$4.69<br />
$8.15<br />
$6.86<br />
$8.94<br />
$6.09<br />
Citation CJ3<br />
Transaction Level (Past 12 Months)<br />
Inventory Level<br />
Average Asking Price<br />
Average Days on Market<br />
Dec<br />
Mar<br />
2021 2022<br />
Jun<br />
Sep<br />
Dec Mar Jun Sep<br />
2022 2022 2022 <strong>2023</strong> <strong>2023</strong> <strong>2023</strong><br />
Dec<br />
<strong>2023</strong><br />
For Sale vs. Sold<br />
6<br />
Sold<br />
4<br />
8<br />
For Sale<br />
6<br />
Dec<br />
Mar<br />
2021 2022<br />
14 12<br />
12 8<br />
9<br />
7<br />
3<br />
23<br />
10<br />
4<br />
Jun<br />
Sep<br />
Dec Mar Jun Sep<br />
2022 2022 2022 <strong>2023</strong> <strong>2023</strong> <strong>2023</strong><br />
10<br />
6<br />
5<br />
6<br />
6<br />
3<br />
8<br />
7<br />
12 18 1<br />
8 18 23 32 31 29 48 52 45<br />
Dec<br />
<strong>2023</strong><br />
Citation CJ4<br />
Transaction Level (Past 12 Months)<br />
Inventory Level<br />
Average Asking Price<br />
Average Days on Market<br />
Source: AMSTAT & ASG<br />
FOURTH QUARTER <strong>2023</strong> — ASIAN SKY QUARTERLY | 76
MARKET SUMMARY: BUSINESS JETS<br />
CITATION LATITUDE<br />
Average Asking Price (Million USD)<br />
Market Indicators (vs. Last Quarter)<br />
$11.50<br />
$16.09<br />
$19.40<br />
Transaction Level (Past 12 Months)<br />
Inventory Level<br />
Average Asking Price<br />
Average Days on Market<br />
Dec<br />
Mar<br />
2021 2022<br />
For Sale vs. Sold<br />
Sold<br />
For Sale<br />
Jun<br />
Sep<br />
Dec Mar Jun Sep<br />
2022 2022 2022 <strong>2023</strong> <strong>2023</strong> <strong>2023</strong><br />
Dec<br />
<strong>2023</strong><br />
PERFORMANCE<br />
Max Range<br />
Max Speed<br />
Typ. Passengers<br />
2,870N.M. / 5,315 km<br />
Mach 0.80<br />
9<br />
1<br />
Dec<br />
Mar<br />
2021 2022<br />
1<br />
2<br />
1<br />
1<br />
Jun<br />
Sep<br />
Dec Mar Jun Sep<br />
2022 2022 2022 <strong>2023</strong> <strong>2023</strong> <strong>2023</strong><br />
1<br />
1<br />
1<br />
1 1<br />
1 3<br />
4 2 3 5 4 3<br />
4<br />
4<br />
2<br />
Dec<br />
<strong>2023</strong><br />
MARKET<br />
No. for Sale (% of fleet)<br />
Avg Asking Price (USD)<br />
Avg Days on Market<br />
Sold in Past 12 Months<br />
Sold in Past 3 Months<br />
Sep-23<br />
3 (0.8%)<br />
17.57M<br />
119<br />
10<br />
6<br />
Dec-23<br />
4 (1.1%)<br />
19.40M<br />
53<br />
11<br />
2<br />
CITATION SOVEREIGN<br />
Average Asking Price (Million USD)<br />
Market Indicators (vs. Last Quarter)<br />
$10.36<br />
$8.00<br />
$8.28<br />
Transaction Level (Past 12 Months)<br />
Inventory Level<br />
Average Asking Price<br />
Average Days on Market<br />
Dec<br />
Mar<br />
2021 2022<br />
Jun<br />
Sep<br />
Dec Mar Jun Sep<br />
2022 2022 2022 <strong>2023</strong> <strong>2023</strong> <strong>2023</strong><br />
Dec<br />
<strong>2023</strong><br />
For Sale vs. Sold<br />
3<br />
Sold<br />
2<br />
For Sale<br />
Dec<br />
Mar<br />
2021 2022<br />
5<br />
3<br />
3<br />
3 1<br />
4<br />
7<br />
4 7 7 10 16 18 20 15<br />
15<br />
Jun<br />
Sep<br />
Dec Mar Jun Sep<br />
2022 2022 2022 <strong>2023</strong> <strong>2023</strong> <strong>2023</strong><br />
2<br />
5<br />
5 4 3<br />
8<br />
5<br />
2<br />
5<br />
2 3<br />
Dec<br />
<strong>2023</strong><br />
PERFORMANCE<br />
Max Range<br />
Max Speed<br />
Typ. Passengers<br />
MARKET<br />
No. for Sale (% of fleet)<br />
Avg Asking Price (USD)<br />
Avg Days on Market<br />
Sold in Past 12 Months<br />
Sold in Past 3 Months<br />
3,010N.M. / 5,574 km<br />
Mach 0.80<br />
9<br />
Sep-23<br />
15 (3.4%)<br />
7.95M<br />
127<br />
41<br />
15<br />
Dec-23<br />
15 (3.4%)<br />
8.28M<br />
149<br />
44<br />
10<br />
Source: AMSTAT & ASG<br />
77 | ASIAN SKY QUARTERLY - FOURTH QUARTER <strong>2023</strong>
MARKET SUMMARY: BUSINESS JETS<br />
FALCON 900 FAMILY<br />
PERFORMANCE<br />
Max Range<br />
Max Speed<br />
Typ. Passengers<br />
F900DX<br />
4,100 N.M. / 7,593 km<br />
Mach 0.83<br />
12<br />
F900EX<br />
4,500 N.M. / 8,334 km<br />
Mach 0.83<br />
12<br />
F900EX EASy<br />
4,500 N.M. / 8,334 km<br />
Mach 0.83<br />
12<br />
F900LX<br />
4,750 N.M. / 8,800 km<br />
Mach 0.83<br />
12<br />
MARKET<br />
No. for Sale (% of fleet)<br />
Avg Asking Price (USD)<br />
Avg Days on Market<br />
Past 12 Months<br />
Past 3 Months<br />
Sep-23<br />
2 (8.7%)<br />
17.44M<br />
186<br />
0<br />
0<br />
Dec-23<br />
3 (13.0%)<br />
13.50M<br />
103<br />
0<br />
0<br />
Sep-23<br />
14 (11.8%)<br />
11.84M<br />
103<br />
11<br />
3<br />
Dec-23<br />
16 (13.4%)<br />
10.93M<br />
165<br />
7<br />
1<br />
Sep-23<br />
5 (4.2%)<br />
17.75M<br />
83<br />
19<br />
4<br />
Dec-23<br />
7 (5.9%)<br />
16.25M<br />
95<br />
18<br />
5<br />
Sep-23<br />
1 (1.1%)<br />
24.50M<br />
123<br />
4<br />
0<br />
Dec-23<br />
2 (2.2%)<br />
27.75M<br />
62<br />
4<br />
1<br />
Average Asking Price (Million USD)<br />
$19.44<br />
$14.85<br />
$10.50<br />
F900DX<br />
Dec<br />
Mar<br />
2021 2022<br />
For Sale vs. Sold<br />
5<br />
Sold<br />
5<br />
For Sale<br />
1<br />
Dec<br />
Mar<br />
2021 2022<br />
3<br />
F900EX<br />
6<br />
F900EX EASy<br />
$11.98<br />
$15.50<br />
F900LX<br />
Jun<br />
Sep<br />
Dec Mar Jun Sep<br />
2022 2022 2022 <strong>2023</strong> <strong>2023</strong> <strong>2023</strong><br />
2<br />
2<br />
4<br />
4 4<br />
$15.55<br />
4 4 3<br />
3<br />
3<br />
2<br />
Jun<br />
Sep<br />
Dec Mar Jun Sep<br />
2022 2022 2022 <strong>2023</strong> <strong>2023</strong> <strong>2023</strong><br />
$27.75<br />
$16.25<br />
11 4 4 8 14 13 15 22 28<br />
3<br />
2<br />
2<br />
2<br />
3<br />
$10.93<br />
Dec<br />
<strong>2023</strong><br />
2<br />
Dec<br />
<strong>2023</strong><br />
$13.50<br />
Market Indicators (vs. Last Quarter)<br />
F900DX<br />
Transaction Level (Past 12 Months)<br />
Inventory Level<br />
Average Asking Price<br />
Average Days on Market<br />
F900EX<br />
Transaction Level (Past 12 Months)<br />
Inventory Level<br />
Average Asking Price<br />
Average Days on Market<br />
F900EX EASy<br />
Transaction Level (Past 12 Months)<br />
Inventory Level<br />
Average Asking Price<br />
Average Days on Market<br />
F900LX<br />
Transaction Level (Past 12 Months)<br />
Inventory Level<br />
Average Asking Price<br />
Average Days on Market<br />
Source: AMSTAT & ASG<br />
FOURTH QUARTER <strong>2023</strong> — ASIAN SKY QUARTERLY | 78
MARKET SUMMARY: BUSINESS JETS<br />
FALCON 2000 FAMILY<br />
PERFORMANCE<br />
Max Range<br />
Max Speed<br />
Typ. Passengers<br />
F2000LX<br />
4,000 N.M. / 7,408 km<br />
Mach 0.83<br />
10<br />
F2000LXS<br />
4,000 N.M. / 7,408 km<br />
Mach 0.83<br />
10<br />
F2000S<br />
3,350 N.M. / 6,208 km<br />
Mach 0.83<br />
10<br />
MARKET Sep-23 Dec-23 Sep-23 Dec-23 Sep-23<br />
Dec-23<br />
No. for Sale (% of fleet)<br />
Avg Asking Price (USD)<br />
Avg Days on Market<br />
Past 12 Months<br />
Past 3 Months<br />
10 (7.6%)<br />
15.15M<br />
112<br />
9<br />
4<br />
7 (5.3%)<br />
14.78M<br />
188<br />
13<br />
6<br />
5 (3.8%)<br />
28.50M<br />
135<br />
7<br />
3<br />
4 (2.9%)<br />
26.00M<br />
114<br />
7<br />
2<br />
2 (4.3%)<br />
18.67M<br />
97<br />
2<br />
0<br />
3 (6.4%)<br />
21.62M<br />
78<br />
5<br />
3<br />
Average Asking Price (Million USD)<br />
F2000LX<br />
F2000LXS F2000S<br />
$23.88<br />
$24.25<br />
$16.50<br />
$17.07<br />
$15.75<br />
$26.00<br />
$21.62<br />
$14.78<br />
Market Indicators (vs. Last Quarter)<br />
F2000LX<br />
Transaction Level (Past 12 Months)<br />
Inventory Level<br />
Average Asking Price<br />
Average Days on Market<br />
Dec<br />
Mar<br />
2021 2022<br />
For Sale vs. Sold<br />
Sold<br />
For Sale<br />
Dec<br />
Mar<br />
2021 2022<br />
Jun<br />
Sep<br />
Dec Mar Jun Sep<br />
2022 2022 2022 <strong>2023</strong> <strong>2023</strong> <strong>2023</strong><br />
3<br />
2 1<br />
1<br />
2 2 1<br />
2<br />
1<br />
2 1 1<br />
2 2 4 4 6 10 12 17 14<br />
2<br />
1 1<br />
Jun<br />
Sep<br />
Dec Mar Jun Sep<br />
2022 2022 2022 <strong>2023</strong> <strong>2023</strong> <strong>2023</strong><br />
3<br />
3<br />
1<br />
3 3 4<br />
Dec<br />
<strong>2023</strong><br />
4<br />
Dec<br />
<strong>2023</strong><br />
F2000LXS<br />
Transaction Level (Past 12 Months)<br />
Inventory Level<br />
Average Asking Price<br />
Average Days on Market<br />
F2000S<br />
Transaction Level (Past 12 Months)<br />
Inventory Level<br />
Average Asking Price<br />
Average Days on Market<br />
Source: AMSTAT & ASG<br />
79 | ASIAN SKY QUARTERLY - FOURTH QUARTER <strong>2023</strong>
MARKET SUMMARY: BUSINESS JETS<br />
FALCON 7X<br />
Average Asking Price (Million USD)<br />
Market Indicators (vs. Last Quarter)<br />
$28.00<br />
Transaction Level (Past 12 Months)<br />
$23.50<br />
$21.44<br />
Inventory Level<br />
Average Asking Price<br />
Average Days on Market<br />
Dec<br />
Mar<br />
2021 2022<br />
For Sale vs. Sold<br />
Sold<br />
For Sale<br />
Jun<br />
Sep<br />
Dec Mar Jun Sep<br />
2022 2022 2022 <strong>2023</strong> <strong>2023</strong> <strong>2023</strong><br />
Dec<br />
<strong>2023</strong><br />
PERFORMANCE<br />
Max Range<br />
Max Speed<br />
Typ. Passengers<br />
5,950 N.M. / 11,018 km<br />
Mach 0.90<br />
12<br />
Dec<br />
Mar<br />
2021 2022<br />
3<br />
5<br />
4<br />
2<br />
3<br />
2 2<br />
2<br />
3<br />
1 3<br />
1<br />
3 4 14 12 12 11 11 11<br />
16<br />
2<br />
Jun<br />
Sep<br />
Dec Mar Jun Sep<br />
2022 2022 2022 <strong>2023</strong> <strong>2023</strong> <strong>2023</strong><br />
3<br />
2<br />
5<br />
4<br />
2<br />
6<br />
4<br />
3<br />
2<br />
1<br />
Dec<br />
<strong>2023</strong><br />
MARKET<br />
No. for Sale (% of fleet)<br />
Avg Asking Price (USD)<br />
Avg Days on Market<br />
Sold in Past 12 Months<br />
Sold in Past 3 Months<br />
Sep-23<br />
11 (3.7%)<br />
22.33M<br />
100<br />
33<br />
12<br />
Dec-23<br />
16 (5.4%)<br />
21.44M<br />
135<br />
34<br />
6<br />
Source: AMSTAT & ASG<br />
FOURTH QUARTER <strong>2023</strong> — ASIAN SKY QUARTERLY | 80
MARKET SUMMARY: BUSINESS JETS<br />
PHENOM 300<br />
Average Asking Price (Million USD)<br />
Market Indicators (vs. Last Quarter)<br />
$7.37<br />
$8.50 $8.68<br />
Transaction Level (Past 12 Months)<br />
Inventory Level<br />
Average Asking Price<br />
Average Days on Market<br />
Dec<br />
Mar<br />
2021 2022<br />
For Sale vs. Sold<br />
Sold<br />
For Sale<br />
Jun<br />
Sep<br />
Dec Mar Jun Sep<br />
2022 2022 2022 <strong>2023</strong> <strong>2023</strong> <strong>2023</strong><br />
Dec<br />
<strong>2023</strong><br />
PERFORMANCE<br />
Max Range<br />
Max Speed<br />
Typ. Passengers<br />
1,242 N.M. / 2,300 km<br />
Mach 0.78<br />
5<br />
6 8<br />
5 7<br />
3<br />
6 6<br />
9<br />
3<br />
6<br />
3 5<br />
4<br />
3<br />
6<br />
5 2<br />
5 2<br />
2 2<br />
3 1<br />
2<br />
3 6 7 12 16 18 29 27 24<br />
MARKET<br />
No. for Sale (% of fleet)<br />
Avg Asking Price (USD)<br />
Avg Days on Market<br />
Sold in Past 12 Months<br />
Sold in Past 3 Months<br />
Sep-23<br />
27 (3.7%)<br />
8.60M<br />
184<br />
57<br />
19<br />
Dec-23<br />
24 (3.2%)<br />
8.68M<br />
125<br />
57<br />
17<br />
Dec<br />
Mar<br />
2021 2022<br />
Jun<br />
Sep<br />
Dec Mar Jun Sep<br />
2022 2022 2022 <strong>2023</strong> <strong>2023</strong> <strong>2023</strong><br />
Dec<br />
<strong>2023</strong><br />
LEGACY 600/650<br />
Average Asking Price (Million USD)<br />
L600<br />
L650<br />
$19.95 $20.00<br />
$13.50<br />
$10.98<br />
$9.87<br />
$8.63<br />
Market Indicators (vs. Last Quarter)<br />
L600 L650<br />
Transaction Level (Past 12 Months)<br />
Inventory Level<br />
Average Asking Price<br />
Average Days on Market<br />
Dec<br />
Mar<br />
2021 2022<br />
For Sale vs. Sold<br />
Sold<br />
For Sale<br />
Jun<br />
Sep<br />
Dec Mar Jun Sep<br />
2022 2022 2022 <strong>2023</strong> <strong>2023</strong> <strong>2023</strong><br />
Dec<br />
<strong>2023</strong><br />
PERFORMANCE<br />
Max Range<br />
Max Speed<br />
Typ. Passengers<br />
L600<br />
3,400 N.M.<br />
6,297 km<br />
Mach 0.80<br />
13<br />
L650<br />
3,640 N.M.<br />
7,112 km<br />
Mach 0.80<br />
13<br />
2<br />
2<br />
3<br />
4 4 11 11 11 11 10<br />
Dec<br />
Mar<br />
2021 2022<br />
2<br />
3<br />
4<br />
4<br />
4<br />
4 4<br />
3<br />
2<br />
1<br />
Jun<br />
Sep<br />
Dec Mar Jun Sep<br />
2022 2022 2022 <strong>2023</strong> <strong>2023</strong> <strong>2023</strong><br />
2<br />
2<br />
3<br />
5<br />
3<br />
4<br />
1<br />
13 10<br />
Dec<br />
<strong>2023</strong><br />
MARKET<br />
No. for Sale<br />
Avg Asking Price (USD)<br />
Avg Days on Market<br />
Sold in Past 12 Months<br />
Sold in Past 3 Months<br />
Sep-23 | Dec-23 Sep-23 | Dec-23<br />
8 | 7<br />
10.98M<br />
10.98M<br />
207 | 319<br />
16 | 8<br />
2 | 0<br />
5 | 3<br />
15.56M<br />
20.00M<br />
351 | 543<br />
13 | 13<br />
2 | 1<br />
Source: AMSTAT & ASG<br />
81 | ASIAN SKY QUARTERLY - FOURTH QUARTER <strong>2023</strong>
MARKET SUMMARY: BUSINESS JETS<br />
LINEAGE 1000<br />
Average Asking Price (Million USD)<br />
Market Indicators (vs. Last Quarter)<br />
$14.90<br />
$22.50<br />
Transaction Level (Past 12 Months)<br />
Inventory Level<br />
Average Asking Price<br />
Average Days on Market<br />
Dec<br />
Mar<br />
2021 2022<br />
For Sale vs. Sold<br />
Sold<br />
For Sale<br />
Jun<br />
Sep<br />
Dec Mar Jun Sep<br />
2022 2022 2022 <strong>2023</strong> <strong>2023</strong> <strong>2023</strong><br />
Dec<br />
<strong>2023</strong><br />
PERFORMANCE<br />
Max Range<br />
Max Speed<br />
Typ. Passengers<br />
4,400 N.M. / 8,149 km<br />
Mach 0.82<br />
19<br />
2 2<br />
1 1 1<br />
1<br />
1<br />
1<br />
MARKET<br />
No. for Sale (% of fleet)<br />
Avg Asking Price (USD)<br />
Avg Days on Market<br />
Sold in Past 12 Months<br />
Sold in Past 3 Months<br />
Sep-23<br />
0 (0.0%)<br />
0.00M<br />
0<br />
1<br />
1<br />
Dec-23<br />
0 (0.0%)<br />
0.00M<br />
0<br />
2<br />
1<br />
Dec<br />
Mar<br />
2021 2022<br />
Jun<br />
Sep<br />
Dec Mar Jun Sep<br />
2022 2022 2022 <strong>2023</strong> <strong>2023</strong> <strong>2023</strong><br />
Dec<br />
<strong>2023</strong><br />
Source: AMSTAT & ASG<br />
FOURTH QUARTER <strong>2023</strong> — ASIAN SKY QUARTERLY | 82
MARKET SUMMARY: BUSINESS JETS<br />
G200<br />
Average Asking Price (Million USD)<br />
Market Indicators (vs. Last Quarter)<br />
$6.50<br />
$5.85<br />
Transaction Level (Past 12 Months)<br />
Inventory Level<br />
Average Asking Price<br />
$3.68<br />
Average Days on Market<br />
Dec<br />
Mar<br />
2021 2022<br />
For Sale vs. Sold<br />
Sold<br />
For Sale<br />
Jun<br />
Sep<br />
Dec Mar Jun Sep<br />
2022 2022 2022 <strong>2023</strong> <strong>2023</strong> <strong>2023</strong><br />
Dec<br />
<strong>2023</strong><br />
PERFORMANCE<br />
Max Range<br />
Max Speed<br />
Typ. Passengers<br />
3,050 N.M. / 5,651 km<br />
Mach 0.81<br />
8<br />
2 2 1 5 4<br />
1<br />
5<br />
3 3 1<br />
4<br />
9<br />
1<br />
7 6 11 12 22 21 26 38 31<br />
4<br />
4<br />
4<br />
1<br />
1<br />
2<br />
3 5<br />
5<br />
MARKET<br />
No. for Sale (% of fleet)<br />
Avg Asking Price (USD)<br />
Avg Days on Market<br />
Sold in Past 12 Months<br />
Sold in Past 3 Months<br />
Sep-23<br />
38 (16.0%)<br />
6.18M<br />
143<br />
33<br />
5<br />
Dec-23<br />
31 (13.0%)<br />
5.85M<br />
200<br />
29<br />
10<br />
Dec<br />
Mar<br />
2021 2022<br />
Jun<br />
Sep<br />
Dec Mar Jun Sep<br />
2022 2022 2022 <strong>2023</strong> <strong>2023</strong> <strong>2023</strong><br />
Dec<br />
<strong>2023</strong><br />
G280<br />
Average Asking Price (Million USD)<br />
Market Indicators (vs. Last Quarter)<br />
$18.50 $19.25<br />
$16.15<br />
Transaction Level (Past 12 Months)<br />
Inventory Level<br />
Average Asking Price<br />
Average Days on Market<br />
Dec<br />
Mar<br />
2021 2022<br />
For Sale vs. Sold<br />
Sold<br />
For Sale<br />
Dec<br />
Mar<br />
2021 2022<br />
Jun<br />
Sep<br />
Dec Mar Jun Sep<br />
2022 2022 2022 <strong>2023</strong> <strong>2023</strong> <strong>2023</strong><br />
2<br />
4<br />
1<br />
1<br />
3 2<br />
2<br />
1<br />
1<br />
1<br />
3<br />
4<br />
1<br />
1<br />
1<br />
1<br />
5 2 4<br />
9<br />
9 6<br />
6<br />
7<br />
Jun<br />
Sep<br />
Dec Mar Jun Sep<br />
2022 2022 2022 <strong>2023</strong> <strong>2023</strong> <strong>2023</strong><br />
2<br />
2<br />
2<br />
1<br />
5<br />
Dec<br />
<strong>2023</strong><br />
Dec<br />
<strong>2023</strong><br />
PERFORMANCE<br />
Max Range<br />
Max Speed<br />
Typ. Passengers<br />
MARKET<br />
No. for Sale (% of fleet)<br />
Avg Asking Price (USD)<br />
Avg Days on Market<br />
Sold in Past 12 Months<br />
Sold in Past 3 Months<br />
3,600 N.M. / 6,667 km<br />
Mach 0.84<br />
8<br />
Sep-23<br />
6 (2.3%)<br />
17.42M<br />
130<br />
21<br />
6<br />
Dec-23<br />
7 (2.6%)<br />
16.15M<br />
87<br />
21<br />
6<br />
Source: AMSTAT & ASG<br />
83 | ASIAN SKY QUARTERLY - FOURTH QUARTER <strong>2023</strong>
MARKET SUMMARY: BUSINESS JETS<br />
G450<br />
Average Asking Price (Million USD)<br />
Market Indicators (vs. Last Quarter)<br />
$12.80<br />
$17.50<br />
$16.10<br />
Transaction Level (Past 12 Months)<br />
Inventory Level<br />
Average Asking Price<br />
Average Days on Market<br />
Dec<br />
Mar<br />
2021 2022<br />
For Sale vs. Sold<br />
2<br />
Sold<br />
1<br />
2<br />
For Sale<br />
Dec<br />
Mar<br />
2021 2022<br />
Jun<br />
Sep<br />
Dec Mar Jun Sep<br />
2022 2022 2022 <strong>2023</strong> <strong>2023</strong> <strong>2023</strong><br />
8<br />
1<br />
2<br />
3 1<br />
1<br />
1<br />
2<br />
4<br />
4<br />
2 3 1 1<br />
6 9 12 11 13 14 16 23 31<br />
Jun<br />
Sep<br />
Dec Mar Jun Sep<br />
2022 2022 2022 <strong>2023</strong> <strong>2023</strong> <strong>2023</strong><br />
1<br />
1<br />
4<br />
1<br />
3<br />
3 1<br />
Dec<br />
<strong>2023</strong><br />
Dec<br />
<strong>2023</strong><br />
PERFORMANCE<br />
Max Range<br />
Max Speed<br />
Typ. Passengers<br />
MARKET<br />
No. for Sale (% of fleet)<br />
Avg Asking Price (USD)<br />
Avg Days on Market<br />
Sold in Past 12 Months<br />
Sold in Past 3 Months<br />
4,350 N.M. / 8,056 km<br />
Mach 0.85<br />
13<br />
Sep-23<br />
23 (6.5%)<br />
16.30M<br />
105<br />
24<br />
6<br />
Dec-23<br />
31 (8.8%)<br />
16.10M<br />
124<br />
25<br />
7<br />
G550<br />
Average Asking Price (Million USD)<br />
Market Indicators (vs. Last Quarter)<br />
Transaction Level (Past 12 Months)<br />
$20.50<br />
$22.72<br />
$21.25<br />
Inventory Level<br />
Average Asking Price<br />
Average Days on Market<br />
Dec<br />
Mar<br />
2021 2022<br />
For Sale vs. Sold<br />
Sold<br />
For Sale<br />
Jun<br />
Sep<br />
Dec Mar Jun Sep<br />
2022 2022 2022 <strong>2023</strong> <strong>2023</strong> <strong>2023</strong><br />
Dec<br />
<strong>2023</strong><br />
PERFORMANCE<br />
Max Range<br />
Max Speed<br />
Typ. Passengers<br />
6,750 N.M. / 12,501 km<br />
Mach 0.87<br />
18<br />
6 9<br />
4 4<br />
8<br />
9<br />
6<br />
5 7<br />
4 5<br />
1<br />
6<br />
5 2 2<br />
4<br />
5 4<br />
6 4 6 6<br />
1<br />
1<br />
8 5 14 24 26 33 37<br />
45 33<br />
Dec<br />
Mar<br />
2021 2022<br />
Jun<br />
Sep<br />
Dec Mar Jun Sep<br />
2022 2022 2022 <strong>2023</strong> <strong>2023</strong> <strong>2023</strong><br />
Dec<br />
<strong>2023</strong><br />
MARKET<br />
No. for Sale (% of fleet)<br />
Avg Asking Price (USD)<br />
Avg Days on Market<br />
Sold in Past 12 Months<br />
Sold in Past 3 Months<br />
Sep-23<br />
45 (7.4%)<br />
21.80M<br />
125<br />
58<br />
14<br />
Dec-23<br />
33 (5.4%)<br />
21.25M<br />
176<br />
60<br />
19<br />
Source: AMSTAT & ASG<br />
FOURTH QUARTER <strong>2023</strong> — ASIAN SKY QUARTERLY | 84
MARKET SUMMARY: BUSINESS JETS<br />
G650 & G650 ER<br />
Average Asking Price (Million USD)<br />
G650<br />
G650ER<br />
$52.70<br />
$40.97<br />
$49.00<br />
$39.75<br />
$55.00<br />
$38.98<br />
Market Indicators (vs. Last Quarter)<br />
G650 G650ER<br />
Transaction Level (Past 12 Months)<br />
Inventory Level<br />
Average Asking Price<br />
Average Days on Market<br />
Dec<br />
Mar<br />
2021 2022<br />
For Sale vs. Sold<br />
Sold<br />
For Sale<br />
Jun<br />
Sep<br />
Dec Mar Jun Sep<br />
2022 2022 2022 <strong>2023</strong> <strong>2023</strong> <strong>2023</strong><br />
Dec<br />
<strong>2023</strong><br />
PERFORMANCE<br />
Max Range<br />
Max Speed<br />
Typ. Passengers<br />
G650<br />
7,000 N.M.<br />
12,964 km<br />
Mach 0.90<br />
18<br />
G650ER<br />
7,500 N.M.<br />
13,890 km<br />
Mach 0.90<br />
18<br />
5<br />
1<br />
1<br />
2<br />
Dec<br />
Mar<br />
2021 2022<br />
3<br />
5<br />
1<br />
2<br />
2<br />
2<br />
3<br />
3<br />
9 13 10 16 14 17 12 12 14<br />
1<br />
Jun<br />
Sep<br />
Dec Mar Jun Sep<br />
2022 2022 2022 <strong>2023</strong> <strong>2023</strong> <strong>2023</strong><br />
4<br />
2<br />
2<br />
1<br />
2 3 2 1<br />
4<br />
Dec<br />
<strong>2023</strong><br />
MARKET<br />
No. for Sale<br />
Avg Asking Price (USD)<br />
Avg Days on Market<br />
Sold in Past 12 Months<br />
Sold in Past 3 Months<br />
Sep-23 | Dec-23 Sep-23 | Dec-23<br />
4 | 6<br />
37.50M<br />
38.98M<br />
212 | 122<br />
6 | 6<br />
2 | 2<br />
8 | 8<br />
53.90M<br />
55.00M<br />
188 | 201<br />
19 | 16<br />
5 | 3<br />
ASIAN SKY CONSULTING<br />
Independent Business and General Aviation Consulting Services<br />
01<br />
02<br />
03<br />
04<br />
TRANSACTIONAL ADVISORY<br />
Manage the engagement, drafting, review and<br />
negotiation of any aviation transactional<br />
documents, liaise, control and lead the transaction<br />
process to ensure the best terms and successful<br />
results are achieved.<br />
OPERATION ADVISORY<br />
Perform operational analysis, management selection<br />
and due diligence, recommend operational and<br />
aircraft ownership structure advisory.<br />
MARKET RESEARCH & STUDIES<br />
Perform aviation market research, appraisals,<br />
feasibility studies and aviation business planning.<br />
COMPLETION MANAGEMENT<br />
Generate corporate airliner cabin definition, select the<br />
most suitable completion facility, handle green aircraft<br />
delivery, carry out completion oversight and conduct<br />
aircraft final delivery & compliance inspections.<br />
Source: AMSTAT & ASG<br />
Please contact our sales team for more information<br />
Email: sales@asianskygroup.com<br />
Website: www.asianskygroup.com<br />
85 | ASIAN SKY QUARTERLY - FOURTH QUARTER <strong>2023</strong>
MARKET<br />
SUMMARY<br />
CIVIL HELICOPTERS<br />
<strong>Q4</strong> <strong>2023</strong><br />
FOURTH QUARTER <strong>2023</strong> — ASIAN SKY QUARTERLY | 86
MARKET SUMMARY: CIVIL HELICOPTERS<br />
AIRCRAFT POSITIONING 1<br />
PAYLOAD 2 WITH FULL FUEL VS. MAX RANGE 3<br />
700<br />
600<br />
500<br />
HEAVY<br />
SUPERM MEDIUM<br />
MEDIUM TWIN<br />
LIGHT TWIN<br />
SINGLE TURBINE<br />
IN PRODUCTION<br />
CEASED PRODUCTION<br />
H175<br />
AW139<br />
AW189<br />
AW109 POWER<br />
AW119KX<br />
H155<br />
S-92<br />
MAX RANGE (NM)<br />
400<br />
300<br />
EN480B<br />
H120<br />
BELL 206L4<br />
R66<br />
MD600N<br />
BELL429<br />
BELL505<br />
H130<br />
H125<br />
MD530F<br />
AW109 GRANDNEW<br />
AW169<br />
H145<br />
BELL 407GXP<br />
BELL 407<br />
H135(T3)<br />
S-76D<br />
BELL430<br />
S-76C++<br />
BELL 412EPI<br />
H225<br />
AS332 L2<br />
MD500E<br />
MD902<br />
200<br />
MD520N<br />
150<br />
300<br />
600<br />
1,000<br />
PAYLOAD WITH FULL FUEL (LB)<br />
2,000<br />
3,000<br />
4,000<br />
5,000<br />
6,000<br />
7,000<br />
CABIN VOLUME VS. MAX RANGE 3<br />
650<br />
600<br />
500<br />
HEAVY<br />
SUPERM MEDIUM<br />
MEDIUM TWIN<br />
LIGHT TWIN<br />
SINGLE TURBINE<br />
IN PRODUCTION<br />
CEASED PRODUCTION<br />
AW139<br />
AW189<br />
H175<br />
AW119KX<br />
AW109 POWER<br />
H155 S-92<br />
MAX RANGE (NM)<br />
400<br />
300<br />
EN480B<br />
R66<br />
MD530F<br />
H120<br />
H130<br />
BELL 505<br />
H125<br />
AW109 GRANDNEW<br />
H145<br />
BELL 407GXP<br />
BELL 407<br />
BELL429<br />
BELL 206L4<br />
H135(T3)<br />
MD600N<br />
BELL430<br />
AW169<br />
S-76D<br />
S-76C++<br />
BELL 412EPI<br />
AS332 L2<br />
H225<br />
MD500E<br />
MD902<br />
200<br />
MD520N<br />
150<br />
25<br />
50<br />
100<br />
Notes:<br />
MAXIMUM CABIN VOLUME (CU FT)<br />
1.Data Source: Conklin & de Decker<br />
2.Payload: It is the payload with full fuel in Utility configuration<br />
3.Max Range: It is the maximum VFR range of the aircraft with the maximum fuel on board and no passengers. This uses a fuel reserve of 30 minutes at cruise speed and altitude.<br />
200<br />
300<br />
400<br />
500<br />
600<br />
700<br />
800<br />
900<br />
1,000<br />
87 | ASIAN SKY QUARTERLY - FOURTH QUARTER <strong>2023</strong>
MARKET SUMMARY<br />
INVENTORY LEVEL, VALUE TREND & TRANSACTIONS<br />
AIRBUS AS350/H125<br />
Market Value (Million USD)<br />
$2.70<br />
$1.52<br />
$0.93<br />
Dec<br />
2021<br />
1995 AS350 B2 2008 AS350 B3 2020 AS350 B3e/H125<br />
For Sale vs. Sold<br />
Sold<br />
For Sale<br />
17<br />
13 13 25<br />
9 26<br />
20<br />
13<br />
16 10<br />
21 10<br />
$1.74<br />
<strong>2023</strong> AS350 B3e/H125<br />
$2.80 $2.89<br />
$1.07 $1.07<br />
21<br />
25 15 25<br />
10<br />
14 19 23<br />
19 21<br />
12<br />
10 11<br />
102 89<br />
70<br />
68<br />
74<br />
78<br />
81<br />
72<br />
74<br />
Dec<br />
2021<br />
Mar Jun Sep<br />
Dec<br />
Mar Jun Sep<br />
2022 2022 2022 2022 <strong>2023</strong> <strong>2023</strong> <strong>2023</strong><br />
Mar Jun Sep<br />
Dec<br />
Mar Jun Sep<br />
2022 2022 2022 2022 <strong>2023</strong> <strong>2023</strong> <strong>2023</strong><br />
$3.35<br />
$1.87<br />
Dec<br />
<strong>2023</strong><br />
Dec<br />
<strong>2023</strong><br />
MARKET SUMMARY: CIVIL HELICOPTERS<br />
Market Indicators (vs. Last Quarter)<br />
MARKET<br />
Transaction Level (Past 12 Months)<br />
Inventory Level<br />
Average Asking Price<br />
Average Days on Market<br />
No. for Sale (% of fleet)<br />
Avg Asking Price (USD)<br />
Avg Days on Market<br />
Sold in Past 12 Months<br />
Sold in Past 3 Months<br />
Sep-23<br />
72 (2.1%)<br />
1.89M<br />
295<br />
214<br />
56<br />
Dec-23<br />
74 (2.2%)<br />
1.92M<br />
296<br />
204<br />
42<br />
The proven AS350/H125 remains the most<br />
transacted turbine helicopter type on the market.<br />
Availability (2% of the fleet) continues to be low<br />
considering a fleet of more than 3,500 in service.<br />
Older models are still sought after and values have<br />
largely remained stable. Low availability of newer<br />
models means high value retention. Highly popular<br />
as a small multi-mission or corporate helicopter<br />
worldwide, with no direct replacement announced.<br />
AIRBUS EC130/H130<br />
Market Value (Million USD)<br />
$2.89<br />
$1.60<br />
$1.27<br />
Dec<br />
2021<br />
For Sale vs. Sold<br />
Sold<br />
16<br />
Dec<br />
2021<br />
2005 EC130 B4 2012 EC130 B4 2019 H130/EC130 T2 <strong>2023</strong> H130/EC130 T2<br />
Mar Jun Sep<br />
Dec<br />
Mar Jun Sep<br />
2022 2022 2022 2022 <strong>2023</strong> <strong>2023</strong> <strong>2023</strong><br />
For Sale<br />
6<br />
2 1 2 4 1 3<br />
5 4<br />
3<br />
$3.34<br />
3 4<br />
5 4<br />
3 2<br />
4 4<br />
Mar Jun Sep<br />
Dec<br />
Mar Jun Sep<br />
2022 2022 2022 2022 <strong>2023</strong> <strong>2023</strong> <strong>2023</strong><br />
2<br />
3<br />
Dec<br />
<strong>2023</strong><br />
14 17 19 17 21 22<br />
26 31<br />
5<br />
$3.99<br />
$3.00<br />
$1.82 $1.83<br />
$1.45 $1.50<br />
Dec<br />
<strong>2023</strong><br />
Market Indicators (vs. Last Quarter)<br />
MARKET<br />
Transaction Level (Past 12 Months)<br />
Inventory Level<br />
Average Asking Price<br />
Average Days on Market<br />
No. for Sale (% of fleet)<br />
Avg Asking Price (USD)<br />
Avg Days on Market<br />
Sold in Past 12 Months<br />
Sold in Past 3 Months<br />
Sep-23<br />
26 (3.3%)<br />
2.00M<br />
247<br />
35<br />
4<br />
Dec-23<br />
31 (3.9%)<br />
2.19M<br />
233<br />
32<br />
With more cabin space than its competitors,<br />
the EC130/H130 has proven popular in the<br />
corporate and sightseeing roles. Availability<br />
increased during the second half of <strong>2023</strong><br />
while number of transactions was fairly<br />
consistent, while market values remain stable<br />
following reductions in Q3 <strong>2023</strong>.<br />
7<br />
Source: AMSTAT & ASG<br />
FOURTH QUARTER <strong>2023</strong> — ASIAN SKY QUARTERLY | 88
MARKET SUMMARY: CIVIL HELICOPTERS<br />
AIRBUS EC135/H135<br />
Market Value (Million USD)<br />
1998 EC135 P1 2008 EC135 P2<br />
2020 H135 <strong>2023</strong> H135<br />
$5.85 $5.65<br />
$3.27<br />
$2.86<br />
$7.05<br />
$5.28<br />
$2.98<br />
Market Indicators (vs. Last Quarter)<br />
Transaction Level (Past 12 Months)<br />
Inventory Level<br />
Average Asking Price<br />
Average Days on Market<br />
$0.98 $1.12 $1.06<br />
Dec<br />
2021<br />
For Sale vs. Sold<br />
Sold<br />
Mar Jun Sep<br />
Dec<br />
Mar Jun Sep<br />
2022 2022 2022 2022 <strong>2023</strong> <strong>2023</strong> <strong>2023</strong><br />
For Sale<br />
Dec<br />
<strong>2023</strong><br />
MARKET<br />
No. for Sale (% of fleet)<br />
Avg Asking Price (USD)<br />
Avg Days on Market<br />
Sold in Past 12 Months<br />
Sold in Past 3 Months<br />
Sep-23<br />
4 (1.4%)<br />
2.58M<br />
245<br />
9<br />
0<br />
Dec-23<br />
10 (3.4%)<br />
2.36M<br />
170<br />
4<br />
0<br />
9 10 7 6 4 4<br />
4 4 10<br />
Dec<br />
2021<br />
1 1<br />
2<br />
1<br />
2<br />
1<br />
1<br />
1<br />
3<br />
Mar Jun Sep<br />
Dec<br />
Mar Jun Sep<br />
2022 2022 2022 2022 <strong>2023</strong> <strong>2023</strong> <strong>2023</strong><br />
1<br />
2<br />
1<br />
Dec<br />
<strong>2023</strong><br />
The Twin engine EC135/H135 is a proven type<br />
in a variety of missions, especially EMS, law<br />
enforcement and corporate. Inventory level has<br />
increased slightly but still at very low levels.<br />
Values decreased by around 4% based on market<br />
activity. There is a well spread fleet globally and<br />
across numerous missions, and the 135 has been a<br />
popular choice for operators upgrading from Single<br />
engine turbine helicopters.<br />
Note: Only EC135T2, EC135P2 were included in Market Indicators and For Sale vs. Sold.<br />
AIRBUS EC145/H145<br />
Market Value (Million USD)<br />
$5.38<br />
$3.30<br />
Dec<br />
2021<br />
2<br />
Sold<br />
Dec<br />
2021<br />
2009 EC145 T1 2015 EC145 T2<br />
2<br />
Mar Jun Sep<br />
Dec<br />
Mar Jun Sep<br />
2022 2022 2022 2022 <strong>2023</strong> <strong>2023</strong> <strong>2023</strong><br />
For Sale vs. Sold<br />
For Sale<br />
1<br />
1<br />
2<br />
2022 EC145 T3 <strong>2023</strong> EC145 T3<br />
$9.75<br />
$5.87<br />
$3.60<br />
3<br />
1 1 1<br />
2<br />
12 11 12 12 13 11<br />
9 9 10<br />
Mar Jun Sep<br />
Dec<br />
Mar Jun Sep<br />
2022 2022 2022 2022 <strong>2023</strong> <strong>2023</strong> <strong>2023</strong><br />
Note: EC145T3 was not included in Market Indicators and For Sale vs. Sold.<br />
2<br />
4 4<br />
6<br />
1<br />
5<br />
3<br />
$9.94<br />
$8.80<br />
$5.02<br />
$3.08<br />
Dec<br />
<strong>2023</strong><br />
Dec<br />
<strong>2023</strong><br />
Market Indicators (vs. Last Quarter)<br />
Transaction Level (Past 12 Months)<br />
Inventory Level<br />
Average Asking Price<br />
Average Days on Market<br />
MARKET<br />
Sep-23<br />
Dec-23<br />
No. for Sale (% of fleet) 9 (0.9%) 10 (1.0%)<br />
Avg Asking Price (USD) 3.58M 2.86M<br />
Avg Days on Market 206 242<br />
Sold in Past 12 Months 23<br />
31<br />
Sold in Past 3 Months 11<br />
8<br />
Successful model in the corporate, EMS and law<br />
enforcement sectors. Inventory levels have been fairly<br />
consistent since Q3 <strong>2023</strong>, although the higher proportion<br />
of older builds mean a reduced average asking price, but<br />
market values are generally stable. The D3 five blade<br />
variant is in service, with upgrades offered for T2 models<br />
for increased performance and extended service life.<br />
Despite newer competition on the market, the proven<br />
EC145/H145 is expected to maintain its popularity and<br />
market share.<br />
Source: AMSTAT & ASG<br />
89 | ASIAN SKY QUARTERLY - FOURTH QUARTER <strong>2023</strong>
MARKET SUMMARY: CIVIL HELICOPTERS<br />
AIRBUS EC155/H155<br />
Market Value (Million USD)<br />
Market Indicators (vs. Last Quarter)<br />
2000 EC155 B 2010 H155/EC155 B1<br />
2020 H155/EC155 B1<br />
$7.50<br />
$7.00<br />
Transaction Level<br />
Inventory Level<br />
$4.35<br />
$4.79<br />
$3.24<br />
Average Asking Price<br />
Average Days on Market<br />
$1.62 $1.78<br />
Dec<br />
2021<br />
For Sale vs. Sold<br />
Sold<br />
Mar Jun Sep<br />
Dec<br />
Mar Jun Sep<br />
2022 2022 2022 2022 <strong>2023</strong> <strong>2023</strong> <strong>2023</strong><br />
For Sale<br />
$1.26<br />
Dec<br />
<strong>2023</strong><br />
MARKET<br />
No. for Sale (% of fleet)<br />
Avg Asking Price (USD)<br />
Avg Days on Market<br />
Sold in Past 12 Months<br />
Sold in Past 3 Months<br />
Sep-23<br />
10 (5.6%)<br />
3.41M<br />
1,169<br />
9<br />
3<br />
Dec-23<br />
10 (5.6%)<br />
3.37M<br />
1,184<br />
7<br />
1<br />
3 1<br />
1<br />
9<br />
Dec<br />
2021<br />
1<br />
1<br />
2 1<br />
1 1<br />
9 11 12 11 11 11 10 10<br />
Mar Jun Sep<br />
Dec<br />
Mar Jun Sep<br />
2022 2022 2022 2022 <strong>2023</strong> <strong>2023</strong> <strong>2023</strong><br />
3<br />
1<br />
Dec<br />
<strong>2023</strong><br />
The 155 sits in a very competitive Medium Twin<br />
market and is nearing the end of production.<br />
Availability remains stable at around 5.5% of<br />
the fleet, although there have been very few<br />
transactions during <strong>2023</strong>. The type is relatively<br />
popular in the corporate sector, but other options<br />
are widely available, including the Sikorsky S-76<br />
in the pre-owned market and also the Leonardo<br />
AW169 for new builds.<br />
AIRBUS EC225/H225<br />
Market Value (Million USD)<br />
2007 EC225LP 2012 EC225LP 2017 EC225LP<br />
$8.15 $8.15<br />
$7.46<br />
$6.99 $6.99<br />
$6.53<br />
$5.93<br />
Market Indicators (vs. Last Quarter)<br />
Transaction Level<br />
Inventory Level<br />
Average Asking Price<br />
Average Days on Market<br />
$5.54<br />
Dec<br />
2021<br />
For Sale vs. Sold<br />
Sold<br />
Mar Jun Sep<br />
Dec<br />
Mar Jun Sep<br />
2022 2022 2022 2022 <strong>2023</strong> <strong>2023</strong> <strong>2023</strong><br />
For Sale<br />
$5.93<br />
Dec<br />
<strong>2023</strong><br />
MARKET<br />
No. for Sale (% of fleet)<br />
Avg Asking Price (USD)<br />
Avg Days on Market<br />
Sold in Past 12 Months<br />
Sold in Past 3 Months<br />
Sep-23<br />
6 (3.4%)<br />
8.95M<br />
324<br />
9<br />
1<br />
Dec-23<br />
5 (2.8%)<br />
8.95M<br />
373<br />
6<br />
2<br />
1<br />
11<br />
Dec<br />
2021<br />
1<br />
1<br />
3<br />
2<br />
2 3 2 1<br />
9 8 7 5 6<br />
Mar Jun Sep<br />
Dec<br />
Mar Jun Sep<br />
2022 2022 2022 2022 <strong>2023</strong> <strong>2023</strong> <strong>2023</strong><br />
7<br />
1<br />
1<br />
1<br />
6 5<br />
Dec<br />
<strong>2023</strong><br />
While the heavy EC225/H225 still has a small presence<br />
in the offshore sector, redundant/surplus examples<br />
have been adapted for multi-role/utility/heavy lift<br />
use and inventory level has been fairly stable. Unlike<br />
the S-92, the EC225/H225 is more suited to these<br />
alternative missions. Some secondary markets now<br />
emerging. Overall market and demand, as well as<br />
values, remain generally stable.<br />
Source: AMSTAT & ASG<br />
FOURTH QUARTER <strong>2023</strong> — ASIAN SKY QUARTERLY | 90
MARKET SUMMARY: CIVIL HELICOPTERS<br />
BELL 206<br />
Market Value (Million USD)<br />
$1.45<br />
$0.72<br />
$0.55<br />
Dec<br />
2021<br />
For Sale vs. Sold<br />
Sold<br />
8<br />
Dec<br />
2021<br />
1992 BELL 206L-3 2004 BELL 206B-3<br />
16<br />
10<br />
Mar Jun Sep<br />
Dec<br />
Mar Jun Sep<br />
2022 2022 2022 2022 <strong>2023</strong> <strong>2023</strong> <strong>2023</strong><br />
For Sale<br />
13<br />
12<br />
14<br />
7<br />
2016 BELL 206L-4<br />
$1.61<br />
$0.80<br />
9<br />
16 14 13 21 11 12 19 17 22<br />
8 8 12 15 15 15<br />
114 86 83 87 80 75<br />
Mar Jun Sep<br />
Dec<br />
Mar Jun Sep<br />
2022 2022 2022 2022 <strong>2023</strong> <strong>2023</strong> <strong>2023</strong><br />
Dec<br />
<strong>2023</strong><br />
72 70 82<br />
8<br />
$1.86<br />
$0.84<br />
$0.80 $0.80<br />
Dec<br />
<strong>2023</strong><br />
Market Indicators (vs. Last Quarter)<br />
Transaction Level (Past 12 Months)<br />
Inventory Level<br />
Average Asking Price<br />
Average Days on Market<br />
MARKET<br />
Sep-23<br />
Dec-23<br />
No. for Sale (% of fleet) 70 (2.7%) 82 (3.2%)<br />
Avg Asking Price (USD) 917.46K 891.92K<br />
Avg Days on Market 614 554<br />
Sold in Past 12 Months 173 151<br />
Sold in Past 3 Months 42<br />
23<br />
The ageing but proven Bell 206 remains a popular<br />
choice as an entry level Single turbine helicopter,<br />
mostly for corporate or multi-role use. Inventory<br />
level has increased slightly and transaction volumes<br />
were down year-on-year. Values have remained<br />
largely stable. Availability and retirements of older<br />
examples are expected to increase, which would<br />
negatively affect values.<br />
BELL 407<br />
Market Value (Million USD)<br />
$2.29<br />
$1.78<br />
$1.69<br />
Dec<br />
2021<br />
2010 BELL 407 2014 BELL 407GX<br />
For Sale vs. Sold<br />
Sold<br />
Mar Jun Sep<br />
Dec<br />
Mar Jun Sep<br />
2022 2022 2022 2022 <strong>2023</strong> <strong>2023</strong> <strong>2023</strong><br />
For Sale<br />
2018 BELL 407GXP<br />
$2.95<br />
$2.45<br />
$2.58<br />
$3.35<br />
$2.76<br />
$2.54<br />
Dec<br />
<strong>2023</strong><br />
Market Indicators (vs. Last Quarter)<br />
Transaction Level (Past 12 Months)<br />
Inventory Level<br />
Average Asking Price<br />
Average Days on Market<br />
MARKET<br />
Sep-23<br />
Dec-23<br />
No. for Sale (% of fleet) 26 (1.5%) 27 (1.5%)<br />
Avg Asking Price (USD) 2.99M 2.93M<br />
Avg Days on Market 139 172<br />
Sold in Past 12 Months 69<br />
61<br />
Sold in Past 3 Months 16<br />
10<br />
6<br />
6<br />
4 7 11<br />
5<br />
10 7<br />
6 7 4 4 8<br />
8<br />
3 7 6 9<br />
4<br />
4 3 4<br />
1 2<br />
3<br />
37 27 24 27 25 32 24 26 27<br />
Derived from the Bell 206, the 407 has gained<br />
market presence in a number of missions, including<br />
EMS, law enforcement and multi-role. Inventory<br />
level and asking prices remains largely consistent.<br />
Availability of the more desirable newer models<br />
(GXP and GXi) is low and values have increased<br />
gradually over the past year and remain unchanged.<br />
Dec<br />
2021<br />
Mar Jun Sep<br />
Dec<br />
Mar Jun Sep<br />
2022 2022 2022 2022 <strong>2023</strong> <strong>2023</strong> <strong>2023</strong><br />
Dec<br />
<strong>2023</strong><br />
Source: AMSTAT & ASG<br />
91 | ASIAN SKY QUARTERLY - FOURTH QUARTER <strong>2023</strong>
MARKET SUMMARY: CIVIL HELICOPTERS<br />
BELL 505 JET RANGER X<br />
Market Value (Million USD)<br />
2017 BELL 505 2020 BELL 505<br />
<strong>2023</strong> BELL 505<br />
Market Indicators (vs. Last Quarter)<br />
Transaction Level (Past 12 Months)<br />
$1.67<br />
$1.65<br />
Inventory Level<br />
$1.30<br />
$1.40<br />
$1.49<br />
$1.25<br />
Average Asking Price<br />
Average Days on Market<br />
$1.00<br />
Dec<br />
2021<br />
For Sale vs. Sold<br />
Sold<br />
Mar Jun Sep<br />
Dec<br />
Mar Jun Sep<br />
2022 2022 2022 2022 <strong>2023</strong> <strong>2023</strong> <strong>2023</strong><br />
For Sale<br />
Dec<br />
<strong>2023</strong><br />
MARKET<br />
No. for Sale (% of fleet)<br />
Avg Asking Price (USD)<br />
Avg Days on Market<br />
Sold in Past 12 Months<br />
Sold in Past 3 Months<br />
Sep-23<br />
24 (5.3%)<br />
1.46M<br />
269<br />
28<br />
8<br />
Dec-23<br />
24 (5.1%)<br />
1.39M<br />
319<br />
27<br />
4<br />
Dec<br />
2021<br />
3 1<br />
2 2<br />
3<br />
2<br />
2<br />
6 2<br />
2<br />
1<br />
15 13 15 17 20 23 24 24 24<br />
Mar Jun Sep<br />
Dec<br />
Mar Jun Sep<br />
2022 2022 2022 2022 <strong>2023</strong> <strong>2023</strong> <strong>2023</strong><br />
1<br />
1<br />
4<br />
3 3<br />
3<br />
5<br />
3 2 1 1<br />
Dec<br />
<strong>2023</strong><br />
Pre-owned examples of the Bell 505 are still<br />
much sought after and with limited supply. With<br />
an increase in inventory during <strong>2023</strong>, asking<br />
prices and market values have reduced and<br />
remain relatively stable going into 2024. Much<br />
of the inventory is corporate configured with low<br />
time and high specifications, and transaction<br />
volume has been consistent year-on-year.<br />
BELL 412<br />
Market Value (Million USD)<br />
1991 BELL 412SP 2006 BELL 412EP 2021 BELL 412EPI <strong>2023</strong> BELL 412EPI<br />
$12.53<br />
$10.50<br />
$9.63<br />
$4.04 $4.45 $4.18<br />
Market Indicators (vs. Last Quarter)<br />
Transaction Level (Past 12 Months)<br />
Inventory Level<br />
Average Asking Price<br />
Average Days on Market<br />
$1.67 $1.75 $1.85<br />
Dec<br />
2021<br />
For Sale vs. Sold<br />
Sold<br />
Mar Jun Sep<br />
Dec<br />
Mar Jun Sep<br />
2022 2022 2022 2022 <strong>2023</strong> <strong>2023</strong> <strong>2023</strong><br />
For Sale<br />
Dec<br />
<strong>2023</strong><br />
MARKET<br />
No. for Sale (% of fleet)<br />
Avg Asking Price (USD)<br />
Avg Days on Market<br />
Sold in Past 12 Months<br />
Sold in Past 3 Months<br />
Sep-23<br />
17 (2.5%)<br />
2.64M<br />
563<br />
19<br />
3<br />
Dec-23<br />
16 (2.4%)<br />
2.70M<br />
620<br />
17<br />
2<br />
1<br />
20 22 22 22 21<br />
21<br />
Dec<br />
2021<br />
2<br />
3 1 3<br />
1 1<br />
1 2 2<br />
4<br />
1 3 3<br />
2 1<br />
Mar Jun Sep<br />
Dec<br />
Mar Jun Sep<br />
2022 2022 2022 2022 <strong>2023</strong> <strong>2023</strong> <strong>2023</strong><br />
Note: Only BELL 412EP, BELL 412SP were included in Market Indicators and For Sale vs. Sold.<br />
1<br />
20<br />
1<br />
1<br />
17 16<br />
Dec<br />
<strong>2023</strong><br />
As a flexible and rugged utility helicopter, the 412 is<br />
still used in many markets despite the availability of<br />
newer models. Availability, transactions and values<br />
have all remained fairly stable going into 2024.<br />
Upgrade packages are available for older models<br />
to extend service life, and new deliveries to civilian<br />
operators will continue but with low volumes.<br />
Source: AMSTAT & ASG<br />
FOURTH QUARTER <strong>2023</strong> — ASIAN SKY QUARTERLY | 92
MARKET SUMMARY: CIVIL HELICOPTERS<br />
BELL 429<br />
Market Value (Million USD)<br />
$5.60<br />
$4.41<br />
$3.10<br />
Dec<br />
2021<br />
For Sale vs. Sold<br />
Sold<br />
2<br />
Dec<br />
2021<br />
2010 BELL 429 2015 BELL 429 2020 BELL 429 <strong>2023</strong> BELL 429<br />
1<br />
Mar Jun Sep<br />
Dec<br />
Mar Jun Sep<br />
2022 2022 2022 2022 <strong>2023</strong> <strong>2023</strong> <strong>2023</strong><br />
For Sale<br />
1 1<br />
1 1 2<br />
2<br />
$7.18<br />
$6.42<br />
$4.51<br />
3 3 1 4<br />
3<br />
1<br />
3 5 5 5 8 8 12<br />
10 13<br />
Mar Jun Sep<br />
Dec<br />
Mar Jun Sep<br />
2022 2022 2022 2022 <strong>2023</strong> <strong>2023</strong> <strong>2023</strong><br />
1<br />
1 2 1 1<br />
$7.70<br />
$6.81<br />
$6.08<br />
$4.28<br />
Dec<br />
<strong>2023</strong><br />
Dec<br />
<strong>2023</strong><br />
Market Indicators (vs. Last Quarter)<br />
Transaction Level (Past 12 Months)<br />
Inventory Level<br />
Average Asking Price<br />
Average Days on Market<br />
MARKET<br />
Sep-23<br />
Dec-23<br />
No. for Sale (% of fleet) 10 (2.2%) 13 (2.8%)<br />
Avg Asking Price (USD) 4.63M 5.13M<br />
Avg Days on Market 183 210<br />
Sold in Past 12 Months 18<br />
16<br />
Sold in Past 3 Months 7<br />
2<br />
The Bell 429 has gained much popularity and fleet<br />
share in the EMS and law enforcement roles. Its<br />
larger cabin volume and twin engine configuration<br />
mean the 429 is more suitable for longer range EMS<br />
missions. Availability has increased slightly during<br />
<strong>Q4</strong> <strong>2023</strong>, and asking prices were also slightly up.<br />
Market values remain stable for all years of build, in<br />
line with the overall market trend for this type.<br />
LEONARDO AW109<br />
Market Value (Million USD)<br />
$3.42<br />
$2.17<br />
Dec<br />
2021<br />
Mar Jun Sep<br />
Dec<br />
Mar Jun Sep<br />
2022 2022 2022 2022 <strong>2023</strong> <strong>2023</strong> <strong>2023</strong><br />
For Sale vs. Sold<br />
Sold<br />
2006 AW109S Grand 2014 AW109SP Grandnew<br />
For Sale<br />
$7.55<br />
$4.45<br />
$2.53<br />
2021 AW109SP Grandnew<br />
$6.33<br />
$3.48<br />
$2.19<br />
Dec<br />
<strong>2023</strong><br />
Market Indicators (vs. Last Quarter)<br />
Transaction Level (Past 12 Months)<br />
Inventory Level<br />
Average Asking Price<br />
Average Days on Market<br />
MARKET<br />
Sep-23<br />
Dec-23<br />
No. for Sale (% of fleet) 21 (5.4%) 30 (7.7%)<br />
Avg Asking Price (USD) 4.41M 3.32M<br />
Avg Days on Market 370 295<br />
Sold in Past 12 Months 25<br />
24<br />
Sold in Past 3 Months 5<br />
3<br />
2 1 3 6<br />
6<br />
4 3 4<br />
4<br />
2<br />
2<br />
1 1<br />
2 3 3<br />
3 1 3<br />
1<br />
1<br />
26 26 23 26 22 25<br />
20 21 30<br />
Dec<br />
2021<br />
Mar Jun Sep<br />
Dec<br />
Mar Jun Sep<br />
2022 2022 2022 2022 <strong>2023</strong> <strong>2023</strong> <strong>2023</strong><br />
2 1<br />
Dec<br />
<strong>2023</strong><br />
One of the most popular models in its class, the<br />
AW109 serves a range of missions globally. There<br />
is a high concentration of corporate configured<br />
examples, which could affect values and<br />
transactions should demand in that market decline.<br />
Inventory level increased towards the end of <strong>2023</strong>,<br />
and asking prices reduced. Market values were<br />
further reduced by 2% in <strong>Q4</strong> <strong>2023</strong> based on recent<br />
asking prices and overall market trend.<br />
Source: AMSTAT & ASG<br />
93 | ASIAN SKY QUARTERLY - FOURTH QUARTER <strong>2023</strong>
MARKET SUMMARY: CIVIL HELICOPTERS<br />
LEONARDO AW139<br />
Market Value (Million USD)<br />
$5.70<br />
$3.47<br />
Dec<br />
2021<br />
Dec<br />
2021<br />
2009 AW139 2015 AW139 2021 AW139 <strong>2023</strong> AW139<br />
For Sale vs. Sold<br />
Sold<br />
1<br />
1<br />
2<br />
$13.75<br />
$7.89<br />
$4.80<br />
Mar Jun Sep<br />
Dec<br />
Mar Jun Sep<br />
2022 2022 2022 2022 <strong>2023</strong> <strong>2023</strong> <strong>2023</strong><br />
For Sale<br />
4<br />
3<br />
3<br />
3<br />
6<br />
2<br />
3 2 3 1<br />
27 17 13 17 18 21 23 25 25<br />
Mar Jun Sep<br />
Dec<br />
Mar Jun Sep<br />
2022 2022 2022 2022 <strong>2023</strong> <strong>2023</strong> <strong>2023</strong><br />
1<br />
2<br />
8 3 5<br />
3<br />
4 6<br />
$15.90<br />
$12.19<br />
$7.12<br />
$4.10<br />
Dec<br />
<strong>2023</strong><br />
Dec<br />
<strong>2023</strong><br />
Market Indicators (vs. Last Quarter)<br />
Transaction Level (Past 12 Months)<br />
Inventory Level<br />
Average Asking Price<br />
Average Days on Market<br />
MARKET<br />
Sep-23<br />
Dec-23<br />
No. for Sale (% of fleet) 25 (2.2%) 25 (2.2%)<br />
Avg Asking Price (USD) 5.50M 5.75M<br />
Avg Days on Market 306 290<br />
Sold in Past 12 Months 28<br />
32<br />
Sold in Past 3 Months 11<br />
10<br />
Highly popular Medium Twin on the market with<br />
more than 900 in service worldwide in a wide range<br />
of missions. There is little interest in the older,<br />
short nose models but newer builds are in high<br />
demand. Values were reduced slightly in <strong>Q4</strong> <strong>2023</strong>,<br />
based on latest market trends. With early build<br />
offshore and corporate machines being replaced,<br />
availability of pre-owned AW139s is expected<br />
to increase in the next few years and secondary<br />
markets for the type will emerge.<br />
SIKORSKY S-76<br />
Market Value (Million USD)<br />
$2.86<br />
Dec<br />
2021<br />
For Sale vs. Sold<br />
Sold<br />
2<br />
Dec<br />
2021<br />
1996 S76C+ 2004 S76C+<br />
Mar Jun Sep<br />
Dec<br />
Mar Jun Sep<br />
2022 2022 2022 2022 <strong>2023</strong> <strong>2023</strong> <strong>2023</strong><br />
For Sale<br />
5<br />
2<br />
3<br />
1<br />
2012 S76C++<br />
2 2<br />
21 20 16 13 13 7<br />
1<br />
3<br />
4<br />
$3.15<br />
$1.71 $1.74<br />
$1.54 $1.57<br />
Mar Jun Sep<br />
Dec<br />
Mar Jun Sep<br />
2022 2022 2022 2022 <strong>2023</strong> <strong>2023</strong> <strong>2023</strong><br />
4<br />
1<br />
5<br />
3<br />
11<br />
5<br />
2 2<br />
$2.54<br />
$1.49<br />
$1.33<br />
Dec<br />
<strong>2023</strong><br />
15 13<br />
Dec<br />
<strong>2023</strong><br />
Market Indicators (vs. Last Quarter)<br />
Transaction Level (Past 12 Months)<br />
Inventory Level<br />
Average Asking Price<br />
Average Days on Market<br />
MARKET<br />
Sep-23<br />
Dec-23<br />
No. for Sale (% of fleet) 15 (4.9%) 13 (4.2%)<br />
Avg Asking Price (USD) 2.25M 2.26M<br />
Avg Days on Market 593 658<br />
Sold in Past 12 Months 33<br />
24<br />
Sold in Past 3 Months 9<br />
0<br />
While the S-76 has reached the end of its production<br />
life, the type remains popular in offshore support<br />
and corporate markets. Low values make the<br />
type attractive for pre-owned buyers. Market<br />
values decreased by around 5% during <strong>Q4</strong> <strong>2023</strong>,<br />
based on market activity. There were no recorded<br />
sales transactions during <strong>Q4</strong>. The type has been<br />
superseded in the offshore market by newer models,<br />
and some lower time offshore examples being<br />
converted to corporate use.<br />
Source: AMSTAT & ASG<br />
FOURTH QUARTER <strong>2023</strong> — ASIAN SKY QUARTERLY | 94
REASONS TO<br />
CHOOSE ASIAN SKY GROUP<br />
AN INTERNATIONAL AIRCRAFT DEALERS ASSOCIATION (IADA) MEMBER<br />
01<br />
CHOOSE AN ACCREDITED AIRCRAFT DEALER<br />
<strong>Asian</strong> <strong>Sky</strong> Group is an International Aircraft Dealers<br />
Association (IADA) Accredited Dealer, regulated by<br />
independent accreditation, ensuring strict compliance<br />
with IADA’s 14-point Code of Ethics. With headquarters in<br />
Hong Kong and offices around Asia, we are uniquely<br />
qualified to advise & manage aircraft transactions in Asia.<br />
04<br />
CHOOSE A PARTNER THAT CAN ACCESS THE MOST<br />
EXCLUSIVE AND TRUSTED GLOBAL MARKETPLACE<br />
<strong>Asian</strong> <strong>Sky</strong> Group lists and sources aircraft from an<br />
exclusive global online marketplace. AircraftExchange.com<br />
is the exclusive online marketplace of IADA and is the<br />
industry’s most trusted source for the sale or lease of<br />
aircraft. IADA’s robust listing verification process ensures<br />
aircraft advertised are truly available for sale.<br />
02<br />
03<br />
CHOOSE A TEAM OF CERTIFIED AIRCRAFT BROKERS<br />
<strong>Asian</strong> <strong>Sky</strong> Group’s team of IADA Certified Brokers each<br />
passed a written test administered by an independent<br />
consulting firm. IADA Certified Brokers are required to<br />
participate in regular continuing education and be<br />
re-certified every 5 years.<br />
CHOOSE A PARTNER WITH A PROVEN HISTORY OF SUCCESS<br />
IADA aircraft dealers are responsible for 40% of the<br />
world’s pre-owned sales. IADA Accredited Dealers buy<br />
and sell more aircraft by dollar volume than the rest of<br />
the world’s dealers combined, averaging over 700<br />
transactions and USD 6 Billion in volume per year.<br />
<strong>Asian</strong> <strong>Sky</strong> Group is the only IADA member in Asia.<br />
05<br />
CHOOSE A PARTNER THAT CAN ACCESS BEST-IN-<br />
CLASS PRODUCTS AND SERVICE PROVIDERS<br />
<strong>Asian</strong> <strong>Sky</strong> Group has exclusive access to IADA-verified<br />
products and service members. These members are<br />
industry leaders in their respective fields, including<br />
escrow, legal, financial services, maintenance and<br />
refurbishment, aircraft management and operation, and<br />
over 15 other specialties.<br />
DISCRETION<br />
EXPERIENCE<br />
TRANSPARENCY<br />
PROFESSIONALISM<br />
KNOWLEDGE<br />
GLOBAL NETWORK<br />
95 | ASIAN SKY QUARTERLY - FOURTH QUARTER <strong>2023</strong><br />
sales@asianskygroup.com
ASIAN SKY GROUP - AIRCRAFT AVAILABILITY<br />
2022 ACJ319neo SN10673<br />
• Delivered in July 2022 with Very Low Hours<br />
• 19 Passengers Configuration<br />
• Increased MTOW 77.3 t, MLW 63.9 t & MZFW 60.3 t<br />
• Asking Price: Make Offer<br />
2006 GULFSTREAM G200 SN142<br />
• Total Hours: 3,924 Since New<br />
• ESP, AOS, CASP & JSSI<br />
• ADS-B Out, CVR, FDR, & SATCOM<br />
• Asking Price: USD 5.60M<br />
2009 GULFSTREAM G550 SN5243<br />
• Executive 14 Pax Seating Configuration<br />
• One Owner Since New and No Damage History<br />
• N-Reg Aircraft<br />
• Asking Price: Make Offer<br />
2018 BELL 505 SN65154<br />
• Always Hangered and Meticulously Maintained<br />
• 1 Pilot + 4 Passengers Configuration<br />
• Integrated Garmin G1000H Flight Deck with Twin<br />
10.4” LCD Screens<br />
• Asking Price: Make Offer<br />
2014 AIRBUS VIP EC145 SN9669<br />
• Very Low Hours<br />
• Mercedes Benz Style Interior<br />
• Multi VIP Configuration Layout<br />
• Asking Price: Make Offer<br />
2009 BELL 206L-4 Long Ranger SN52398<br />
• Freshly Refurbished: New Paint and Interior<br />
• One Pilot + Six Passengers Configuration<br />
• Dual Control & Garmin GTN 635HXI GPS/Com<br />
• Asking Price: Make Offer<br />
Website: www.asianskygroup.com<br />
Email: sales@asianskygroup.com<br />
FOURTH QUARTER <strong>2023</strong> — ASIAN SKY QUARTERLY | 96