Asian Sky Quarterly 2022 Q3

You also want an ePaper? Increase the reach of your titles
YUMPU automatically turns print PDFs into web optimized ePapers that Google loves.
3RD QUARTER <strong>2022</strong><br />
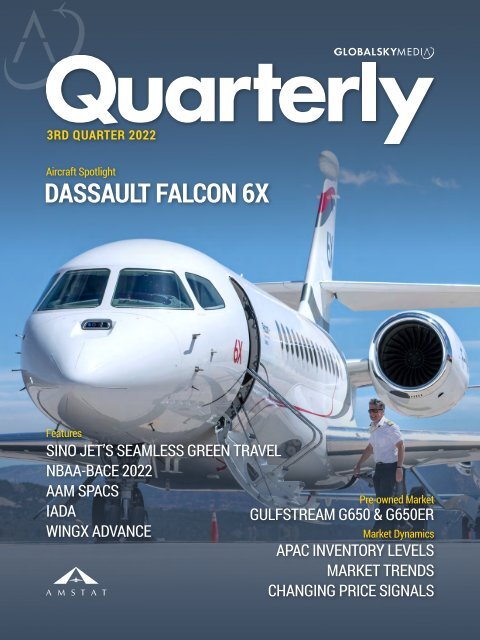
Aircraft Spotlight<br />
DASSAULT FALCON 6X<br />
Features<br />
SINO JET’S SEAMLESS GREEN TRAVEL<br />
NBAA-BACE <strong>2022</strong><br />
AAM SPACS<br />
IADA<br />
WINGX ADVANCE<br />
Pre-owned Market<br />
GULFSTREAM G650 & G650ER<br />
Market Dynamics<br />
APAC INVENTORY LEVELS<br />
MARKET TRENDS<br />
CHANGING PRICE SIGNALS<br />
THIRD QUARTER <strong>2022</strong> — GLOBAL SKY QUARTERLY | I
CONTENTS<br />
05<br />
ASIA-PACIFIC BUSINESS JET<br />
FLIGHT ACTIVITY<br />
WINGX ADVANCE<br />
36<br />
CAPITALIZING ON THE FUTURE<br />
A report on why an increasing number of eVTOL<br />
companies are choosing to raise capital by merging with<br />
Asia-Pacific Business Jet Flight Activity <strong>2022</strong> <strong>Q3</strong> Review<br />
special purpose acquisition companies.<br />
13<br />
ASIA-PACIFIC<br />
MOOD & INTENTIONS<br />
QUARTERLY SURVEY<br />
Results of our survey regarding the Asia-Pacific region’s<br />
40<br />
GLOBAL PRE-OWNED<br />
MARKET UPDATE<br />
AMSTAT<br />
A review of the global market for pre-owned business<br />
outlook on the COVID-19 pandemic, economic status,<br />
jets and turboprops.<br />
20<br />
aircraft utilization purchase intentions, and influencing<br />
factors.<br />
RECENT WORLD TOUR PREPARES<br />
WIDE-BODY FALCON 6X FOR<br />
SERVICE ENTRY<br />
DASSAULT AVIATION<br />
How Dassault’s new Falcon 6X has performed in the<br />
final flight test campaigns.<br />
45<br />
51<br />
PRE-OWNED<br />
MARKET SPOTLIGHT:<br />
GULFSTREAM G650 & G650ER<br />
An in-depth analysis of how Gulfstream’s G650 and<br />
G650ER have fared in the pre-owned market.<br />
MARKET DYNAMICS<br />
An analysis of APAC inventory levels, market trends<br />
24<br />
SINO JET INTRODUCES<br />
SEAMLESS GREEN TRAVEL<br />
EXPERIENCE<br />
SINO JET<br />
61<br />
and the changing price signals for the business jet and<br />
helicopter fleets.<br />
MARKET SUMMARY<br />
BUSINESS JETS<br />
How Sino Jet plans to integrate sustainability into its<br />
operations with the goal of going fully carbon neutral by<br />
2035.<br />
78<br />
MARKET SUMMARY<br />
HELICOPTERS<br />
27<br />
IADA MARKET REPORT<br />
The International Aircraft Dealer’s Association presents<br />
its third quarter market report.<br />
34<br />
NBAA-BACE ROLLS OUT<br />
OF ORLANDO<br />
A look at the business jets and eVTOLs on display at this<br />
year’s NBAA-BACE in Orlando, Florida.<br />
COVER IMAGE<br />
Dassault<br />
Falcon 6X<br />
THIRD QUARTER <strong>2022</strong> — GLOBAL SKY QUARTERLY | 1
EDITOR’S NOTE<br />
There are many ways and<br />
methods that you could use to<br />
predict the direction that your<br />
country's economy is heading.<br />
For some, it is the sales of trucks;<br />
for others it is the sales of coffee<br />
from fancy coffee shops. But<br />
one of the ways that the newer<br />
generation of owners use is the<br />
state of the sneaker market.<br />
For the uninitiated, the global sneaker market was worth<br />
USD$131.1 billion in 2021 according to online statistics<br />
database Statista. The value comes mostly from the resale<br />
market, with some of the more limited and coveted pairs –<br />
mostly collaborations with the likes of rapper Travis Scott, the<br />
late fashion designer Virgil Abloh’s Off-White, Tokyo streetwear<br />
designer Fragment, or an exclusive pair released at a special<br />
event – worth thousands of dollars, which is a big jump up from<br />
the USD$200 or so that they would have cost at retail.<br />
It is this exclusivity and scarcity that drives up values. Take the<br />
Jordan 5 Retro Tokyo T23s as an example. At retail, the sneakers<br />
would have cost around USD$200, however, they were only<br />
released to celebrate the opening of the Jordan Tokyo 23 store<br />
in Japan in 2011. The current value? USD$2,800, for a pair of<br />
size US 11s sold in October <strong>2022</strong> by online clothing and sneaker<br />
reseller StockX. Seems a lot for a pair of almost regular sneakers,<br />
especially as the only discernible difference is a Japanese<br />
stylized number “23” stamped on the heel. But, perhaps most<br />
shockingly, is that the USD$2,800 resale price is one of the lowest<br />
seen in recent years. The highest? USD$5,249.<br />
This is where we can start linking the sneaker market back to the<br />
global economy. Whilst our economic expectations were high<br />
during the first half of 2021, by last month, the grim reality had<br />
set in. But why is the sneaker market so important, and why does<br />
it matter? Vista’s big boss Thomas Flohr used to frequently wear<br />
white Converse to meetings and events, and I’m willing to bet a<br />
Chrome Hearts gift card that you’re more likely to see private jet<br />
owners wearing Off-White Jordan 1 Chicagos these days, rather<br />
than what my mother would call a pair of "proper" shoes.<br />
As the most recent sale of a pair of Jordan 5 Retro Tokyo T23s<br />
alludes to, the bottom has fallen out of the sneaker market in<br />
recent months. Much like with trucks, or coffee from fancy coffee<br />
shops, when we have to tighten our belts, we also stop buying<br />
things that aren’t essential to us. Fancy coffee? You can make<br />
your own less fancy one at home. USD$5,000 sneakers? Maybe<br />
those can wait. Because less people are buying, prices have gone<br />
down. What we were willing to pay when times are great is not<br />
the same price we are willing to pay when times aren’t as good.<br />
We have also seen this in the pre-owned private jet market, which,<br />
much like the sneaker market, is backing down from historical<br />
highs. This is something that we hinted at in the previous Global<br />
<strong>Sky</strong> <strong>Quarterly</strong>, with data from the International Aircraft Dealers<br />
Association (IADA) suggesting that we had seen the top of the<br />
market, and that prices were going to begin stabilizing.<br />
SPECIAL THANKS TO OUR CONTRIBUTORS AND SPONSORS<br />
2 | GLOBAL SKY QUARTERLY — THIRD QUARTER <strong>2022</strong>
PUBLISHER<br />
This quarterly also includes the latest IADA market report,<br />
which suggests that whilst the market is slowing, many<br />
transactions are forecast to take place before the end of<br />
the year. Though the last quarter of the year is usually the<br />
busiest quarter for transactions, we are unlikely to witness<br />
the same record level of transactions seen in the past two<br />
years.<br />
Alongside all the usual hard data and intel that you have<br />
come to expect, we have a feature contributed by Dassault<br />
about the Falcon 6X’s world tour. We look back on the <strong>2022</strong><br />
NBAA-BACE which was held in Orlando, Florida in October,<br />
whilst our senior reporter Jeremy Chan covers advanced air<br />
mobility (AAM) companies that have gone public through a<br />
special purpose acquisition company (SPAC). Last, but very<br />
much not least, we zone in on the pre-owned Gulfstream<br />
G650/G650ER market.<br />
EDITORIAL & MARKET RESEARCH<br />
Alud Davies<br />
Bowen Zhang<br />
Casper Zhuang<br />
Jeremy Chan<br />
Liana Liu<br />
Mia Yao<br />
Silvia Huang<br />
Qianyun Zhou<br />
DESIGN<br />
Amy Liu-Lhuissier<br />
Luna Huang<br />
ADVERTISING/ENQUIRIES:<br />
Joey Wong<br />
jwong@globalsky.media<br />
(852) 9582 0117<br />
www.globalsky.media<br />
As always, we would like to take this opportunity to thank<br />
everybody that contributed to this issue of Global <strong>Sky</strong><br />
<strong>Quarterly</strong>.<br />
Global <strong>Sky</strong> Media is part of <strong>Asian</strong> <strong>Sky</strong> Group. The materials and<br />
information provided by Global <strong>Sky</strong> Media in this report are for<br />
reference only. While such information was compiled using the best<br />
available data as of September 30, <strong>2022</strong>, any information we provide<br />
about how we may interpret the data and market, or how certain<br />
issues may be addressed is provided generally without considering<br />
your specific circumstances. Such information should not be regarded<br />
as a substitute for professional advice. Independent professional<br />
advice should be sought before taking action on any matters to which<br />
information provided in this report may be relevant.<br />
Sincerely,<br />
Alud Davies<br />
Editor-in-Chief<br />
Global <strong>Sky</strong> Media<br />
Global <strong>Sky</strong> Media shall not be liable for any losses, damage, costs<br />
or expenses howsoever caused, arising directly or indirectly from<br />
the use of or inability to use this report or use of or reliance upon<br />
any information or material provided in this report or otherwise in<br />
connection with any representation, statement or information on or<br />
contained in this report.<br />
Global <strong>Sky</strong> Media endeavors to ensure that the information contained<br />
in this report is accurate as at the date of publication, but does not<br />
guarantee or warrant its accuracy or completeness, or accept any<br />
liability of whatever nature for any losses, damage, costs or expenses<br />
howsoever caused, whether arising directly or indirectly from any error<br />
or omission in compiling such information. This report also uses third<br />
party information not compiled by Global <strong>Sky</strong> Media. Global <strong>Sky</strong> Media<br />
is not responsible for such information and makes no representation<br />
about the accuracy, completeness or any other aspect of information<br />
contained. The information, data, articles, or resources provided by<br />
any other parties do not in any way signify that Global <strong>Sky</strong> Media<br />
endorses the same.<br />
THIRD QUARTER <strong>2022</strong> — GLOBAL SKY QUARTERLY | 3
Connecting The World<br />
to Your Dream<br />
Dedicated to Service Excellence<br />
Striving for excellence with over 10 years business aviation<br />
management services in Asia Pacific<br />
Commitment on Asset Management<br />
Providing a full life cycle management service for business jet owners,<br />
offering a seamless and safe travel experience<br />
Personal Bespoke Services<br />
Creating memorable and delightful In-flight<br />
experiences for our passengers<br />
Take your business travel to the next level.<br />
www.sinojet.org<br />
Aircraft Delivery | Business Jet Management | Air Charter | Maintenance | FBO | Premium Travel Services | Ground Handling<br />
Beijing • Hong Kong • Shanghai • Hangzhou • Guangzhou • Shenzhen • Chengdu • Xiamen • Zhuhai • Macau • Singapore
ASIA-PACIFIC<br />
BUSINESS JET<br />
FLIGHT ACTIVITY<br />
<strong>2022</strong> <strong>Q3</strong> REVIEW<br />
Analysis by Liana Liu<br />
WINGX is a data research and consulting company, which provides actionable<br />
market intelligence to the global business aviation industry. Their interactive<br />
web-hosted dashboards provide their customers with the data-visualization they<br />
need to stay alert to market trends, keep tabs on market share, identify competitive<br />
threats and spot new sales opportunities. WINGX customers include aircraft<br />
operators, airframe, engine and avionics OEMs, airlines, maintenance providers,<br />
airports, fixed-based operators, satcom providers, fuel providers, legal advisors,<br />
leasing companies, banks, regulators, investors and private jet users.<br />
For further information and a free demo of their dashboards, please contact:<br />
Richard or Christoph at office@wingx-advance.com<br />
WINGX Data Source: ADSB and ATC<br />
DATA BY<br />
THIRD QUARTER <strong>2022</strong> — GLOBAL SKY QUARTERLY | 5
FLIGHT ACTIVITY<br />
FLIGHTS DEPARTING FROM APAC<br />
Number of Departures<br />
YoY Trend<br />
3,526<br />
4,041<br />
4,582<br />
3,850 3,887<br />
4,149<br />
4,730<br />
4,946<br />
4,439<br />
4,573 4,534 4,586 4,643<br />
12.6%<br />
17.5%<br />
4.5%<br />
11.9%<br />
0.8%<br />
14.3%<br />
12.6%<br />
20.3%<br />
26.0%<br />
31.6%<br />
22.1%<br />
30.8% 29.7%<br />
Sep<br />
21<br />
Oct<br />
21<br />
Nov<br />
21<br />
Dec<br />
21<br />
Jan<br />
22<br />
Feb<br />
22<br />
Mar<br />
22<br />
Apr<br />
22<br />
May<br />
22<br />
Jun<br />
22<br />
Jul<br />
22<br />
Aug<br />
22<br />
Sep<br />
22<br />
Continuing on from the trend we saw in Q2 <strong>2022</strong>, business aviation<br />
flights saw 30% year-on-year growth in <strong>Q3</strong> <strong>2022</strong>, with an average<br />
of 4,588 monthly flights. The focus of countries around the world<br />
has revolved around stimulating their economies over the past few<br />
months. However, global economic growth has recently started to<br />
slow down, as the International Monetary Fund pointed out in the<br />
latest world economic outlook. Flight activity in the Asia-Pacific<br />
region has subsided compared to the last two quarters.<br />
Southeast <strong>Asian</strong> countries, namely Singapore and Malaysia, are still<br />
taking the lead in Asia-Pacific flights. Long-range and international<br />
became the two keywords for the activity seen in the <strong>2022</strong> third<br />
quarter. Emerging markets not only stimulated business activity but<br />
also attracted overseas travelers and investors, and thus, saw an<br />
increase in business jet flight activity.<br />
DEPARTURES BY DATE<br />
Sep 2019-Sep 2020 Sep 2020-Sep 2021 Sep 2021-Sep <strong>2022</strong><br />
250<br />
234<br />
228<br />
200<br />
150<br />
100<br />
50<br />
0<br />
Sep Oct Nov Dec Jan Feb Mar Apr May Jun<br />
Jul<br />
Aug<br />
Sep<br />
A total of 228 departures were recorded on September 29 for the<br />
third quarter of <strong>2022</strong>, which, however, still did not surpass the highest<br />
number seen in the previous quarter. Although flight activity in the<br />
third quarter of <strong>2022</strong> did not see an upward trend as at the beginning<br />
of the year, daily departures did observe a noticeable increase<br />
compared to the same timeframe last year and the year before. The<br />
average daily flight departures from Asia-Pacific in the third quarter<br />
of 2020 and 2021 were 117 and 149, respectively. Ultra high-networth<br />
individuals are the primary users of business jets. In addition<br />
to leisure travel, these flights may indicate a renewed interest from<br />
entrepreneurs to continue doing business or expand their business<br />
within the Asia-Pacific region.<br />
6 | GLOBAL SKY QUARTERLY — THIRD QUARTER <strong>2022</strong>
FLIGHT ACTIVITY<br />
FLIGHT DURATIONS<br />
6,000<br />
5,000<br />
More than five hours<br />
4,000<br />
Four to five hours<br />
Three to four hours<br />
Two to three hours<br />
3,000<br />
One to two hours<br />
2,000<br />
1,000<br />
30 min to one hour<br />
0<br />
Max 30 min<br />
Sep<br />
21<br />
Oct<br />
21<br />
Nov<br />
21<br />
Dec<br />
21<br />
Jan<br />
22<br />
Feb<br />
22<br />
Mar<br />
22<br />
Apr<br />
22<br />
May<br />
22<br />
Jun<br />
22<br />
Jul<br />
22<br />
Aug<br />
22<br />
Sep<br />
22<br />
Flights started to lean towards<br />
international flights compared to the<br />
third quarter of 2021, with opened<br />
borders and relaxed quarantines<br />
being the main reason for this shift.<br />
American travelers and investors are<br />
the main contributors to the longrange<br />
flights observed in the Asia-<br />
Pacific region. Flights that last more<br />
than five hours increased by 114%<br />
versus the same quarter in 2021.<br />
DOMESTIC VS. INTERNATIONAL FLIGHTS<br />
2021 <strong>Q3</strong><br />
<strong>2022</strong> <strong>Q3</strong><br />
Domestic Flights<br />
0 2,000<br />
International Flights<br />
79%, 8,449 21%, 2,285<br />
63%, 8,730<br />
4,000<br />
37%, 5,033<br />
6,000 8,000<br />
10,000 12,000 14,000<br />
Routes between Southeast <strong>Asian</strong><br />
countries have gained popularity<br />
since the beginning of <strong>2022</strong> with<br />
eight of the top connections within<br />
this subregion. One main driver of<br />
business activity is Singapore's asset<br />
management industry, which grew<br />
to record size in 2021, outpacing<br />
global growth in the sector as many<br />
entrepreneurs and investors moved<br />
their funds to the city-state. Total<br />
assets increased by 16% in 2021<br />
to S$5.4 trillion, according to the<br />
Monetary Authority of Singapore.<br />
BUSIEST INTERNATIONAL ROUTES, <strong>Q3</strong> <strong>2022</strong><br />
Indonesia - Singapore<br />
Singapore - Indonesia<br />
Malaysia - Singapore<br />
Singapore - Malaysia<br />
199<br />
187<br />
India - United Arab Emirates<br />
167<br />
Japan - United States<br />
119<br />
Thailand - Singapore<br />
86<br />
Singapore - Thailand<br />
85<br />
Malaysia - Indonesia<br />
74<br />
Thailand - Cambodia<br />
71<br />
366<br />
363<br />
THIRD QUARTER <strong>2022</strong> — GLOBAL SKY QUARTERLY | 7
FLIGHT ACTIVITY<br />
FLIGHT ACTIVITY<br />
All countries/subregions with<br />
Greater China Japan India Malaysia Singapore Thailand<br />
a comparably large number<br />
of departures saw year-on-<br />
1,600<br />
year growth in business jet<br />
1,400<br />
flight activity, except for<br />
Greater China. Flight activity<br />
1,200<br />
in Japan started to slow<br />
down, but the country is<br />
1,000<br />
still seeing overall growth.<br />
As the Japanese Yen was<br />
800<br />
weaker against the United<br />
600<br />
States Dollar, it attracted<br />
international investors, which<br />
400<br />
resulted in rapid growth in<br />
the second quarter of <strong>2022</strong>.<br />
200<br />
Now that the inflation rate<br />
in Japan has increased and<br />
0<br />
the government has begun<br />
Sep<br />
21<br />
Oct<br />
21<br />
Nov<br />
21<br />
Dec<br />
21<br />
Jan<br />
21<br />
Feb<br />
21<br />
Mar<br />
21<br />
Apr<br />
22<br />
May<br />
22<br />
Jun<br />
22<br />
Jul<br />
22<br />
Aug<br />
22<br />
Sep<br />
22<br />
to intervene in the exchange<br />
market, many businesses in<br />
FLIGHT ACTIVITY TREND<br />
2021 Sep - <strong>2022</strong> Sep<br />
Japan are unable to reverse<br />
their decline. This downturn<br />
also hampered growth in<br />
300%<br />
Japanese flight activity in the<br />
250%<br />
latest quarter.<br />
200%<br />
150%<br />
100%<br />
50%<br />
0%<br />
-50%<br />
-100%<br />
Greater China Japan India Malaysia Singapore Thailand<br />
Country/Subregion Number of Departures <strong>2022</strong> <strong>Q3</strong> YoY Trend<br />
India 3,577 24%<br />
Greater China 2,073 -35%<br />
Japan 1,314 26%<br />
Although Southeast <strong>Asian</strong><br />
countries are taking the<br />
lead in growth, India still<br />
dominates flight activity<br />
in Asia-Pacific, however<br />
growth was less pronounced<br />
compared to other<br />
Southeast <strong>Asian</strong> countries.<br />
The consumer electronics<br />
market in India continues to<br />
grow, and the government<br />
continues to promote related<br />
manufacturers to establish<br />
their presence in the country.<br />
This encourages people in<br />
the consumer electronics<br />
industry to book their trips to<br />
and from India.<br />
Singapore 1,136 251%<br />
Malaysia 1,029 103%<br />
Thailand 1,029 77%<br />
8 | GLOBAL SKY QUARTERLY — THIRD QUARTER <strong>2022</strong>
FLIGHT ACTIVITY<br />
GREATER CHINA DEPARTURES<br />
Greater China continued to see negative growth in the third<br />
quarter mostly due to restrictive policies still in place. Hong Kong<br />
lifted its hotel quarantine policy in late September, however third<br />
quarter business jet flight activity has not yet fully reflected<br />
this. The majority of flights departing from Greater China last<br />
between 30 minutes to three hours, indicating that most flights<br />
are domestic.<br />
Mainland China Hong Kong<br />
Taiwan Macao<br />
1,400<br />
1,200<br />
1,000<br />
800<br />
600<br />
400<br />
200<br />
0<br />
Sep<br />
21<br />
Oct<br />
21<br />
Nov<br />
21<br />
Dec<br />
21<br />
Jan<br />
22<br />
Feb<br />
22<br />
Mar<br />
22<br />
Apr<br />
22<br />
May<br />
22<br />
Jun<br />
22<br />
Jul<br />
22<br />
Aug<br />
22<br />
Sep<br />
22<br />
FLIGHT DURATIONS IN GREATER CHINA<br />
1,400<br />
1,200<br />
1,000<br />
800<br />
600<br />
More than five hours<br />
Four to five hours<br />
Three to four hours<br />
400<br />
Two to three hours<br />
200<br />
0<br />
One to two hours<br />
30 min to one hour<br />
Max 30 min<br />
Sep<br />
21<br />
Oct<br />
21<br />
Nov<br />
21<br />
Dec<br />
21<br />
Jan<br />
22<br />
Feb<br />
22<br />
Mar<br />
22<br />
Apr<br />
22<br />
May<br />
22<br />
Jun<br />
22<br />
Jul<br />
22<br />
Aug<br />
22<br />
Sep<br />
22<br />
THIRD QUARTER <strong>2022</strong> — GLOBAL SKY QUARTERLY | 9
FLIGHT ACTIVITY<br />
TOP OEM FLIGHT ACTIVITY, <strong>Q3</strong> <strong>2022</strong><br />
Flights<br />
<strong>2022</strong> <strong>Q3</strong> YoY Growth<br />
4,000<br />
105%<br />
3,500<br />
3,000<br />
3,564<br />
3,180<br />
3,103<br />
77%<br />
89%<br />
90%<br />
75%<br />
2,500<br />
60%<br />
2,000<br />
40%<br />
46%<br />
45%<br />
1,500<br />
26%<br />
26%<br />
1,664 1,443<br />
30%<br />
1,000<br />
7%<br />
15%<br />
500<br />
377<br />
304<br />
-10%<br />
0%<br />
0<br />
Bombardier Textron<br />
Gulfstream Dassault<br />
Embraer<br />
Boeing<br />
Honda<br />
128<br />
Other<br />
-15%<br />
Aircraft built by Bombardier, Textron, and Gulfstream accounted<br />
for 72% of flights departing from Asia-Pacific in the third quarter.<br />
Bombardier’s Global Express/6000/6500 remained the most<br />
popular model in the region, followed by another long-range<br />
aircraft - Gulfstream G650/G650ER. With 63% of Asia-Pacific flights<br />
still domestic, Embraer's Legacy 600/650 came in third. With<br />
international flights gaining more popularity, Boeing's BBJ family<br />
saw the greatest year-over-year growth in flight activity.<br />
TOP CITY FLIGHT ACTIVITY TRENDS<br />
Singapore continued to see the most flight activity in Asia-Pacific,<br />
with growth of roughly 250% compared with the same quarter last<br />
year. The development of the nation's financial system and tax<br />
exemptions attracted overseas investors to set up family offices in<br />
the city-state. Business engagement in Singapore also led to more<br />
business jet flights to and from the country bringing more flights<br />
in the surrounding countries, such as Indonesia, Malaysia, and the<br />
Philippines.<br />
Number of Departures YoY %<br />
Bangkok<br />
Beijing<br />
180%<br />
15%<br />
12%<br />
15%<br />
100<br />
35%<br />
123<br />
100%<br />
160<br />
33%<br />
173<br />
33%<br />
134<br />
26%<br />
151<br />
88%<br />
205<br />
80%<br />
196<br />
213<br />
88%<br />
205<br />
107%<br />
207<br />
127%<br />
234<br />
79%<br />
181<br />
203<br />
205<br />
-53%<br />
88<br />
-32%<br />
135<br />
-18%<br />
134<br />
-34%<br />
111<br />
-56%<br />
78<br />
-68%<br />
78<br />
-78%<br />
43<br />
-57%<br />
70<br />
-59%<br />
81<br />
-47%<br />
85<br />
-60%<br />
87<br />
Sep<br />
21<br />
Oct<br />
21<br />
Nov<br />
21<br />
Dec<br />
21<br />
Jan<br />
22<br />
Feb<br />
22<br />
Mar<br />
22<br />
Apr<br />
22<br />
May<br />
22<br />
Jun<br />
22<br />
Jul<br />
22<br />
Aug<br />
22<br />
Sep<br />
22<br />
Sep<br />
21<br />
Oct<br />
21<br />
Nov<br />
21<br />
Dec<br />
21<br />
Jan<br />
22<br />
Feb<br />
22<br />
Mar<br />
22<br />
Apr<br />
22<br />
May<br />
22<br />
Jun<br />
22<br />
Jul<br />
22<br />
Aug<br />
22<br />
Sep<br />
22<br />
10 | GLOBAL SKY QUARTERLY — THIRD QUARTER <strong>2022</strong>
THIRD QUARTER <strong>2022</strong> — GLOBAL SKY QUARTERLY | 11<br />
Sep<br />
21<br />
Sep<br />
21<br />
Sep<br />
21<br />
Feb<br />
22<br />
Jun<br />
22<br />
Dec<br />
21<br />
Apr<br />
22<br />
Aug<br />
22<br />
Oct<br />
21<br />
Nov<br />
21<br />
Mar<br />
22<br />
Jul<br />
22<br />
Jan<br />
22<br />
May<br />
22<br />
Sep<br />
22<br />
Sep<br />
21<br />
Feb<br />
22<br />
Jun<br />
22<br />
Dec<br />
21<br />
Apr<br />
22<br />
Aug<br />
22<br />
Oct<br />
21<br />
Nov<br />
21<br />
Mar<br />
22<br />
Jul<br />
22<br />
Jan<br />
22<br />
May<br />
22<br />
Sep<br />
22<br />
Hong Kong<br />
106<br />
126<br />
136<br />
111<br />
127<br />
121<br />
94<br />
113<br />
94<br />
105<br />
105<br />
107<br />
114<br />
-31%<br />
19%<br />
20%<br />
2%<br />
17%<br />
11%<br />
-3%<br />
-9%<br />
-15%<br />
-15%<br />
-43%<br />
-30%<br />
6%<br />
Manila<br />
Tokyo<br />
Jakarta<br />
149<br />
87<br />
292<br />
171<br />
226<br />
140<br />
290<br />
161<br />
257<br />
160<br />
215<br />
135<br />
229<br />
132<br />
261<br />
117<br />
151<br />
83<br />
193<br />
86<br />
253<br />
94<br />
178<br />
69<br />
173<br />
108<br />
39%<br />
58%<br />
96%<br />
97%<br />
60%<br />
49%<br />
85%<br />
77%<br />
24%<br />
72%<br />
17%<br />
78%<br />
46%<br />
47%<br />
74%<br />
86%<br />
70%<br />
34%<br />
65%<br />
21%<br />
56%<br />
47%<br />
15%<br />
6%<br />
New Delhi<br />
171<br />
278<br />
256<br />
254<br />
235<br />
235<br />
313<br />
305<br />
230<br />
161<br />
263<br />
258<br />
238<br />
19%<br />
44%<br />
9%<br />
10%<br />
21%<br />
7%<br />
37%<br />
13%<br />
18%<br />
-8%<br />
42%<br />
42%<br />
51%<br />
15%<br />
38%<br />
Singapore<br />
113<br />
378<br />
378<br />
380<br />
396<br />
344<br />
402<br />
223<br />
164<br />
147<br />
143<br />
152<br />
90<br />
-20%<br />
232%<br />
286%<br />
236%<br />
247%<br />
270%<br />
222%<br />
65%<br />
95%<br />
75%<br />
16%<br />
32%<br />
-11%<br />
98<br />
112<br />
87<br />
110<br />
160<br />
209<br />
244<br />
208<br />
169<br />
104<br />
123<br />
125<br />
111<br />
145%<br />
14%<br />
0%<br />
-7%<br />
54%<br />
179%<br />
239%<br />
215%<br />
173%<br />
63%<br />
71%<br />
79%<br />
79%<br />
FLIGHT ACTIVITY<br />
Sep<br />
21<br />
Feb<br />
22<br />
Jun<br />
22<br />
Dec<br />
21<br />
Apr<br />
22<br />
Aug<br />
22<br />
Oct<br />
21<br />
Nov<br />
21<br />
Mar<br />
22<br />
Jul<br />
22<br />
Jan<br />
22<br />
May<br />
22<br />
Sep<br />
22<br />
Feb<br />
22<br />
Jun<br />
22<br />
Dec<br />
21<br />
Apr<br />
22<br />
Aug<br />
22<br />
Oct<br />
21<br />
Nov<br />
21<br />
Mar<br />
22<br />
Jul<br />
22<br />
Jan<br />
22<br />
May<br />
22<br />
Sep<br />
22<br />
Sep<br />
21<br />
Feb<br />
22<br />
Jun<br />
22<br />
Dec<br />
21<br />
Apr<br />
22<br />
Aug<br />
22<br />
Oct<br />
21<br />
Nov<br />
21<br />
Mar<br />
22<br />
Jul<br />
22<br />
Jan<br />
22<br />
May<br />
22<br />
Sep<br />
22<br />
Feb<br />
22<br />
Jun<br />
22<br />
Dec<br />
21<br />
Apr<br />
22<br />
Aug<br />
22<br />
Oct<br />
21<br />
Nov<br />
21<br />
Mar<br />
22<br />
Jul<br />
22<br />
Jan<br />
22<br />
May<br />
22<br />
Sep<br />
22
www.globalsky.media<br />
WE’VE<br />
REBRANDED!<br />
<strong>Asian</strong> <strong>Sky</strong> Media is now GLOBAL SKY MEDIA!<br />
Our new name reflects who we are today, and symbolizes where we want to be<br />
tomorrow. Our market intelligence and marketing solutions will go beyond the<br />
Asia-Pacific and include the Middle East, North America, Europe, and more.<br />
More news<br />
More market intelligence<br />
More marketing solutions<br />
Globally<br />
Visit our new website now:<br />
www.globalsky.media<br />
www.globalsky.media<br />
www.globalsky.media<br />
12 | GLOBAL SKY QUARTERLY — THIRD QUARTER <strong>2022</strong><br />
Global <strong>Sky</strong> Media, an ASG Company.
ASIA-PACIFIC<br />
MOOD &<br />
INTENTIONS<br />
QUARTERLY SURVEY
MOOD & INTENTIONS: QUARTERLY SURVEY<br />
QUARTERLY SURVEY<br />
RESPONDENT BREAKDOWN<br />
Respondent Location Breakdown<br />
South Asia (8%)<br />
Rest of the World (13%)<br />
Middle East &<br />
North Africa (22%)<br />
Top 10 Respondent’s Locations<br />
Malaysia (6%)<br />
Australia (7%)<br />
United Arab Emirates (8%)<br />
India (8%)<br />
73% of total<br />
respondents<br />
Oceania (5%)<br />
Southeast &<br />
Northeast Asia (29%)<br />
Greater China (23%)<br />
Philippines (5%)<br />
China (16%)<br />
Hong Kong (13%)<br />
Updates & Highlights in <strong>Q3</strong> <strong>2022</strong> survey<br />
1. We added three questions: The first two about carbon<br />
emissions, the third about the impact of the conflict in<br />
Ukraine.<br />
2. We expanded our survey coverage to include the Middle<br />
East and North Africa (MENA)<br />
3. The mood across APAC continued to sink, driven<br />
mostly by Greater China.<br />
4. COVID-19 restrictions continued to ease, with tentative<br />
signs of market demand returning in those countries/<br />
regions.<br />
5. Aircraft utilization continued to increase across APAC,<br />
aside from in Greater China.<br />
6. Although aircraft purchase intentions seemed to<br />
increase, hesitations remain regarding pricing / demand<br />
in the current market environment.<br />
In <strong>Q3</strong> <strong>2022</strong> nearly 400 business aviation professionals responded<br />
to Global <strong>Sky</strong> Media’s latest quarterly survey about the mood and<br />
intentions in the industry.<br />
Pakistan (9%)<br />
Singapore (9%)<br />
Respondent’s Related Aircraft Type<br />
Turboprop (23%)<br />
Civil Helicopter (21%)<br />
Respondent’s Category<br />
Aircraft Sales /<br />
Charter Broker (18%)<br />
United States (10%)<br />
Indonesia (9%)<br />
Business Jet (56%)<br />
Aircraft Owner / Charter User (7%)<br />
The regions with the most respondents include:<br />
1. Southeast & Northeast Asia (29%)<br />
2. Greater China (23%, mainland China and Hong Kong as<br />
majority)<br />
3. Middle East & North Africa (22%, mainly from UAE, newly<br />
added in this quarter)<br />
4. South Asia (8%, mainly from India, newly added in this<br />
quarter)<br />
5. Oceania (5%).<br />
The majority (56%) of the respondents are related to business<br />
jets operations.<br />
In total, 75% of the respondents from this quarter’s survey are<br />
from aircraft services providers (FBO, MRO, etc.) and aircraft<br />
operators. This was followed by smaller percentages of aircraft<br />
brokers (18%), and aircraft end users (7%). The remainder of the<br />
respondents are from other associated areas.<br />
Environment & Politics<br />
In this quarterly survey we added a new set of questions to<br />
replace our COVID-19 series:<br />
Aircraft Operator /<br />
Management Company (34%)<br />
Service Providers 1<br />
(FBO, MRO, etc) (41%)<br />
1. Aircraft Service Providers includes financial services, training, FBO, ground handlers, Service,<br />
MRO, parts, etc.<br />
When we asked respondents if they had taken any measures<br />
to reduce their carbon emissions, only 38% said that they have.<br />
Whilst 69% of of respondents agree that we need to take action<br />
on climate change and need to reduce our carbon emissions, a<br />
surprising 4% were not concerned about the environment at all.<br />
14 | GLOBAL SKY QUARTERLY — THIRD QUARTER <strong>2022</strong>
MOOD & INTENTIONS: QUARTERLY SURVEY<br />
Interestingly, when we asked respondents to rank<br />
factors that are most critical to the future of business<br />
aviation, “Carbon Emissions” came in last, whilst the<br />
most important factor for many quarters has been<br />
“Value for Price Paid”.<br />
We also asked about the impact of the conflict in<br />
the Ukraine. Overall, 76% of the respondents believe<br />
that the ongoing conflict will have an impact on their<br />
business, with 35% strongly believing it will have a<br />
negative impact.<br />
Utilization, Demand and<br />
COVID-19 Pandemic<br />
in Asia-Pacific<br />
In <strong>Q3</strong> <strong>2022</strong>, only 60% respondents said that COVID-19<br />
was seriously affecting their business, which is the<br />
lowest percentage that we have seen since the<br />
question first appeared in our survey. Despite the<br />
current economic and political situation around the<br />
world, it seems like demand is finally returning to<br />
Asia-Pacific, especially in Southeast Asia.<br />
ENVIRONMENT & POLITICS<br />
Are you, your clients, or your authority currently taking any action<br />
for climate change?<br />
Not relevant to me (12%)<br />
No, and no plans yet (24%)<br />
Yes, we are proactively measuring carbon<br />
emissions and adopting new methods and<br />
technologies (SAF, eVTOL etc) (38%)<br />
No, but plan to in the near future (26%)<br />
Do you think the industry (BizAv & GA) should be doing more or<br />
should be doing less to address climate change & carbon emissions?<br />
Less (1%)<br />
We are doing OK (27%)<br />
Much less - climate change<br />
is a concept that needs proof (4%)<br />
Much more - serious actions<br />
need to be taken (39%)<br />
Do you believe the effects of the ongoing war between Russia and<br />
Ukraine will affect your business?<br />
More (30%)<br />
With Singapore's border fully open since April,<br />
this may be the reason why 77% of respondents<br />
from the region reported that their utilization had<br />
increased for the fourth quarter in a row. Operators<br />
in Oceania, South Asia and the MENA region also<br />
reported increased aircraft utilization.<br />
Hard to tell (16%)<br />
Strongly Disagree (3%)<br />
Somewhat Disagree (4%)<br />
Strongly Agree (35%)<br />
Somewhat Agree (41%)<br />
Greater China continues to stick to its COVID-zero<br />
policy, and as such there was almost no increase<br />
in aircraft utilization reported across the region.<br />
However, we anticipate an increase in Hong Kong in<br />
the fourth quarter in light of eased entry requirements<br />
and the scrapping of hotel quarantine.<br />
Purchase Intentions<br />
Large cabin jets are still favored in the Asia-Pacific<br />
region, especially in Greater China, where 45% of<br />
respondents prefered the category. In the Middle<br />
East & North Africa, Corporate Airliners are the most<br />
favored options.<br />
It is also the second quarter in a row that we have<br />
seen an increasing number of respondents indicating<br />
that the market is shifting from a seller's market to<br />
a buyer's market. The data in the Market Dynamics<br />
section appears to support this as we have seen a<br />
slowdown in transaction levels, mostly due to buyers<br />
taking their time to make final transaction decisions.<br />
COVID-19 IMPACT IN ASIA-PACIFIC<br />
Has the COVID-19 outbreak affected you or your organization’s<br />
business so far?<br />
6%<br />
3%<br />
1%<br />
2%<br />
2%<br />
0%<br />
1%<br />
1%<br />
Hard to tell<br />
5%<br />
5%<br />
3%<br />
2020Q1-<strong>2022</strong><strong>Q3</strong><br />
4%<br />
1%<br />
1%<br />
3%<br />
5%<br />
Rank the following factors that you think are critical to the future of<br />
business aviation / general aviation:<br />
Cabin Sanitation<br />
Carbon Emissions<br />
5%<br />
5%<br />
5%<br />
5%<br />
5%<br />
Not affected<br />
9%<br />
Value for Price Paid<br />
2.5<br />
4.3<br />
4.2<br />
3.7<br />
63%<br />
68%<br />
72%<br />
71%<br />
68%<br />
72%<br />
65%<br />
66%<br />
62%<br />
63%<br />
60%<br />
3.5<br />
Seriously affected<br />
2.9<br />
2.9<br />
Most Important<br />
27%<br />
28%<br />
25%<br />
Flexibility / Punctuality<br />
Customer Service<br />
24%<br />
25%<br />
23%<br />
29%<br />
27%<br />
28%<br />
28%<br />
Somewhat affected<br />
29%<br />
Privacy<br />
Maintenance Support<br />
THIRD QUARTER <strong>2022</strong> — GLOBAL SKY QUARTERLY | 15
MOOD & INTENTIONS: QUARTERLY SURVEY<br />
Do you foresee market demand bouncing back in the<br />
next six months?<br />
In terms of your current level of business, how does your<br />
domestic business compare to your overseas business?<br />
40%<br />
Hard to tell at the moment<br />
38% 38% 36%<br />
27%<br />
No<br />
33%<br />
32%<br />
Yes<br />
30%<br />
Overseas business recovery is better<br />
than domestic business<br />
Hard to tell at the moment<br />
Domestic and overseas operations<br />
have not started to recover<br />
My business has not been affected<br />
by COVID-19 so far<br />
Domestic business recovery is better<br />
than overseas business<br />
24%<br />
36%<br />
2020<br />
Q1<br />
27%<br />
35%<br />
2020<br />
Q2<br />
29%<br />
34%<br />
2020<br />
<strong>Q3</strong><br />
32%<br />
33%<br />
2020<br />
Q4<br />
44%<br />
30%<br />
2021<br />
Q1<br />
41%<br />
26%<br />
2021<br />
Q2<br />
38%<br />
31%<br />
2021<br />
<strong>Q3</strong><br />
37%<br />
33%<br />
2021<br />
Q4<br />
62% 60%<br />
66%<br />
12% 15%<br />
<strong>2022</strong><br />
Q1<br />
14%<br />
26% 25%<br />
20%<br />
<strong>2022</strong><br />
Q2<br />
<strong>2022</strong><br />
<strong>Q3</strong><br />
100%<br />
90%<br />
80%<br />
70%<br />
60%<br />
50%<br />
40%<br />
30%<br />
20%<br />
30%<br />
8%<br />
16%<br />
34%<br />
10%<br />
13%<br />
0%<br />
Aircraft Operator /<br />
Management Company<br />
45%<br />
18%<br />
18%<br />
18%<br />
0%<br />
Aircraft Owner /<br />
Charter User<br />
41%<br />
5%<br />
15%<br />
34%<br />
5%<br />
Aircraft Sales /<br />
Charter Broker<br />
29%<br />
2%<br />
32%<br />
17%<br />
20%<br />
Other Related<br />
(FBO, MRO, etc)<br />
ECONOMIC STATUS<br />
Optimism Levels - Regional Differences<br />
100%<br />
Greater China SE & NE Asia Middle East & North Africa Oceania South Aisa Overall<br />
90%<br />
80%<br />
70%<br />
60%<br />
50%<br />
73%<br />
62%<br />
55%<br />
70%<br />
61%<br />
60%<br />
58%<br />
74%<br />
70%<br />
62%<br />
77%<br />
75%<br />
84%<br />
83%<br />
73%<br />
89%<br />
86%<br />
85%<br />
87%<br />
81%<br />
80%<br />
69%<br />
85%<br />
83%<br />
81%<br />
73%<br />
89%<br />
83%<br />
77%<br />
72%<br />
67% 67%<br />
60% 60%<br />
88%<br />
82%<br />
73%<br />
69%<br />
59%<br />
56%<br />
40%<br />
44%<br />
44%<br />
41%<br />
30%<br />
31%<br />
29%<br />
30%<br />
37%<br />
20%<br />
20%<br />
2019<strong>Q3</strong><br />
2019Q4<br />
2020Q1<br />
2020Q2<br />
2020<strong>Q3</strong><br />
2020Q4<br />
2021Q1<br />
2021Q2<br />
2021<strong>Q3</strong><br />
2021Q4<br />
<strong>2022</strong>Q1 <strong>2022</strong>Q2 <strong>2022</strong><strong>Q3</strong><br />
16 | GLOBAL SKY QUARTERLY — THIRD QUARTER <strong>2022</strong>
MOOD & INTENTIONS: QUARTERLY SURVEY<br />
What is Our Current Economic Status?<br />
Past Low Point<br />
30%<br />
35%<br />
19%<br />
23%<br />
26%<br />
27%<br />
30%<br />
41%<br />
40%<br />
40% 44%<br />
41% 40%<br />
Optimistic<br />
31%<br />
29%<br />
32%<br />
24%<br />
45%<br />
40%<br />
At Low Point<br />
54%<br />
42%<br />
45%<br />
46%<br />
32%<br />
31%<br />
29%<br />
Pessimistic<br />
38%<br />
41%<br />
50%<br />
48%<br />
29%<br />
32%<br />
28%<br />
31%<br />
16%<br />
17%<br />
15%<br />
14% 24%<br />
Not Reached Low Point<br />
2019<strong>Q3</strong> 2019Q4 2020Q1 2020Q2 2020<strong>Q3</strong> 2020Q4 2021Q1 2021Q2 2021<strong>Q3</strong> 2021Q4<br />
<strong>2022</strong>Q1<br />
<strong>2022</strong>Q2<br />
<strong>2022</strong><strong>Q3</strong><br />
PURCHASE INTENTIONS<br />
Where are We Currently in the Pre-owned Market?<br />
Buyer’s Market<br />
50%<br />
55%<br />
66%<br />
54%<br />
62%<br />
62%<br />
48%<br />
52%<br />
58%<br />
58%<br />
55%<br />
58%<br />
53%<br />
Balanced Market<br />
Seller’s Market<br />
I’m not sure<br />
28%<br />
17%<br />
6%<br />
21%<br />
15%<br />
9%<br />
13%<br />
12%<br />
8%<br />
22%<br />
13%<br />
11%<br />
18%<br />
13%<br />
8%<br />
17%<br />
10%<br />
30%<br />
15%<br />
8%<br />
29%<br />
19%<br />
0%<br />
26% 26%<br />
28%<br />
24%<br />
18%<br />
16%<br />
15%<br />
16% 16%<br />
9%<br />
12%<br />
9%<br />
4%<br />
0%<br />
0%<br />
2019<br />
<strong>Q3</strong><br />
2019<br />
Q4<br />
2020<br />
Q1<br />
2020<br />
Q2<br />
2020<br />
<strong>Q3</strong><br />
2020<br />
Q4<br />
2021<br />
Q1<br />
2021<br />
Q2<br />
2021<br />
<strong>Q3</strong><br />
2021<br />
Q4<br />
<strong>2022</strong><br />
Q1<br />
<strong>2022</strong><br />
Q2<br />
<strong>2022</strong><br />
<strong>Q3</strong><br />
Purchase Intentions 2019<strong>Q3</strong> - <strong>2022</strong><strong>Q3</strong><br />
Yes, a new aircraft<br />
52.9%<br />
48.2%<br />
48.5%<br />
58.8%<br />
57.8%<br />
54.9% 55.6%<br />
52.1%<br />
52.7%<br />
55.0%<br />
45.5%<br />
42.9%<br />
39.9%<br />
Yes, a pre-owned aircraft<br />
No/I’m not sure<br />
26.7%<br />
20.4%<br />
28.0%<br />
23.8%<br />
26.4%<br />
25.1%<br />
21.9% 22.0%<br />
19.3%<br />
20.2%<br />
23.2%<br />
21.9%<br />
22.4%<br />
22.0%<br />
25.8%<br />
22.0%<br />
24.1%<br />
23.2%<br />
23.3%<br />
21.8%<br />
30.3% 30.2%<br />
24.2%<br />
26.9%<br />
31.9%<br />
29.0%<br />
2019<br />
<strong>Q3</strong><br />
2019<br />
Q4<br />
2020<br />
Q1<br />
2020<br />
Q2<br />
2020<br />
<strong>Q3</strong><br />
2020<br />
Q4<br />
2021<br />
Q1<br />
2021<br />
Q2<br />
2021<br />
<strong>Q3</strong><br />
2021<br />
Q4<br />
<strong>2022</strong><br />
Q1<br />
<strong>2022</strong><br />
Q2<br />
<strong>2022</strong><br />
<strong>Q3</strong><br />
THIRD QUARTER <strong>2022</strong> — GLOBAL SKY QUARTERLY | 17
MOOD & INTENTIONS: QUARTERLY SURVEY<br />
Regional Differences (Fixed Wing)<br />
Corporate Airliner<br />
Large Jet<br />
Medium Jet<br />
Small Jet<br />
Turboprop / Piston Fixed Wing<br />
Greater China<br />
15% 45%<br />
26%<br />
6% 8%<br />
Oceania<br />
6%<br />
31% 19%<br />
13%<br />
31%<br />
Southeast &<br />
Northeast Asia<br />
14% 28% 20%<br />
26%<br />
12%<br />
Middle East &<br />
North Africa<br />
41% 19%<br />
16%<br />
6%<br />
19%<br />
South Asia 30%<br />
20% 35% 5% 10%<br />
Aircraft Purchase Intention - Fixed Wing<br />
Aircraft Purchase Intention - Rotary<br />
Corporate Airliner<br />
(Such as ACJ, BBJ)<br />
Twin Turbine Helicopter<br />
(Such as Sikorsky S-76C+)<br />
Most Preferred<br />
Turboprop/<br />
Piston Fixed Wing<br />
(Such as King Air Series)<br />
Large Jet<br />
(Such as G650,<br />
Falcon 8X)<br />
Most Preferred<br />
Small Jet<br />
(Such as Citation Series,<br />
Hawker Series)<br />
Midsized Jet<br />
(Such as Challenger 650)<br />
Piston Helicopter<br />
(Such as Robinson R22)<br />
Single Turbine Helicopter<br />
(Such as Bell 206)<br />
Purchase Decisions - Influencing Factors 1 No Need Price<br />
Government / Public Opinion<br />
Most Limited<br />
Greater China<br />
Oceania<br />
Inconvenient to Use<br />
(limited or inflexible operation)<br />
No Interesting Aircraft<br />
Southeast & Northeast Asia<br />
Grand Total<br />
1. Outer means more limited<br />
18 | GLOBAL SKY QUARTERLY — THIRD QUARTER <strong>2022</strong>
MOOD & INTENTIONS: QUARTERLY SURVEY<br />
FLEET UTILIZATION<br />
How is Your Aircraft Utilization Compared to 12 months ago?<br />
100%<br />
50%<br />
0%<br />
Up by<br />
20% and more<br />
(>20%)<br />
Up but<br />
less than 20%<br />
(0 - 20%)<br />
The same (0%)<br />
Down but<br />
less than 20%<br />
(-20 - 0%)<br />
Down by<br />
20% or more<br />
(
SPONSORED CONTENT<br />
RECENT WORLD TOUR<br />
PREPARES WIDE-BODY<br />
FALCON 6X FOR<br />
SERVICE ENTRY<br />
Dassault Aviation is down to the final flight test campaigns before achieving certification and placing the<br />
Falcon 6X into service with customers. Those deliveries will take place in mid-2023 with first aircraft already<br />
undergoing cabin completion at the company’s Little Rock center.<br />
The 6X is Dassault’s most advanced aircraft yet and its largest<br />
and most comfortable. The cabin cross section (6.6 feet tall and<br />
8.6 feet wide) eclipses any other business jet - with the exception<br />
of the Falcon 10X now in development. The 6X is the largest<br />
aircraft in the long-range segment, and has the capability to fly<br />
over 11 hours and 5,500 nautical miles nonstop. It is a big jet that<br />
retains Dassault’s trademark short field capabilities, in large part<br />
due to the wing’s moveable slats that extend to provide high lift<br />
and low approach speeds.<br />
The 6X also retains typical Dassault efficiency through<br />
aerodynamics and the aircraft’s recently certified Pratt & Whitney<br />
812D engine, which provides double digit fuel efficiency gains<br />
over comparable earlier generation engines. The aircraft can<br />
operate on a blend of up to 50 percent sustainable aviation fuel.<br />
The 6X has marched through a certification program that began<br />
with first flight on March 10, 2021. As of writing in October <strong>2022</strong>,<br />
Dassault Aviation test pilots are finishing verification flights with<br />
EASA and FAA pilots, which is the last step toward certification.<br />
20 | GLOBAL SKY QUARTERLY — THIRD QUARTER <strong>2022</strong>
SPONSORED CONTENT<br />
Flight envelope expansion (including to .97 Mach, brushing the<br />
sound barrier) has been complete for months.<br />
In August, a flight test aircraft baked in the Tunisian desert at<br />
temperatures up to about 50°C to assure proper functioning in<br />
high heat and proper cooling while flying circuits at 10,000 feet<br />
over the desert. These were bookend tests to cold soak trials in<br />
the winter near the Arctic Circle in Canada, which involved aircraft<br />
operations after cold soaking overnight to -38°C.<br />
A full flight simulator for the 6X is up and running at CAE Burgess<br />
Hill in the UK and will be ready for training the first customer<br />
crews soon. Pilots will have a chance to train on the most<br />
advanced avionics yet installed in a Falcon. Its new EASy IV<br />
flight deck includes safety alerts to prevent runway overruns and<br />
detailed airport moving maps to make it easy to taxi in limited<br />
visibility, especially in complex airports with multiple runways<br />
and a maze of taxiways. Owners can now order dual head-up<br />
displays with the FalconEye combined vision system. Already,<br />
FalconEye operators with a single HUD can descend to within 100<br />
feet of the runway in limited visibility.<br />
The toughest test of all - the real world<br />
To give the 6X the kind of work out it can expect in customer<br />
operations, Dassault planned a grueling world tour to evaluate<br />
reliability far from testing bases in France.<br />
Within the month of<br />
July, the first production<br />
6X touched down in<br />
more than 50 cities<br />
on five continents<br />
(all but Australia and<br />
Antarctica), over 150<br />
flight hours."<br />
Serial number 004 experienced no aircraft-on-ground (AOG)<br />
issues and no delays.<br />
The aircraft was crewed over that time by a dozen pilots and<br />
several flight attendants. Also along to assess more than 250<br />
reliability items were dozens of engineers doubling as test<br />
passengers on various legs.<br />
THIRD QUARTER <strong>2022</strong> — GLOBAL SKY QUARTERLY | 21
SPONSORED CONTENT<br />
At times, every seat was full, with 14 passengers dining; working;<br />
reclining, swiveling and tracking seats; video conferencing;<br />
adjusting the air conditioning; and running the water and lav<br />
systems.<br />
Connectivity was reported as excellent in remote parts of the<br />
world. Pilots gave all systems, including the 6X’s advanced digital<br />
flight controls, high marks and assessed performance as “spot<br />
on.” Measurements and passenger perceptions confirm the 6X<br />
as the quietest Falcon yet, even at high cruise speeds (which can<br />
generate more slipstream noise) up to Mach .88. The Falcon 8X is<br />
currently reputed to be the quietest business jet.<br />
The 6X operated at a high tempo, accomplishing four or five<br />
flights on some days. It’s longest leg was Paris to Los Angeles in<br />
11 hours and 20 minutes. The route flown was 5,150 nautical miles<br />
against headwinds and was completed with an hour’s reserve fuel.<br />
One hundred and twenty hours in a month is very high usage for<br />
a business jet, and is usually achieved only by some high-volume<br />
charter and fractional businesses. That a brand new, not-yet<br />
certificated business jet can sustain this level of activity speaks to<br />
its maturity. That its toughest critics—the engineers who designed<br />
it—give it high marks as passengers, also speaks well of the airplane.<br />
For Dassault, the 6X is just embarking on its most important mission,<br />
asserting its status as the largest and most capable jet in the<br />
popular 5,000 nautical miles—range category.<br />
www.dassaultfalcon.com<br />
22 | GLOBAL SKY QUARTERLY — THIRD QUARTER <strong>2022</strong>
Premium Protection and Peace of Mind<br />
CorporateCare® Enhanced<br />
Increased Asset Value, Increased Aircraft<br />
Availability, Remote Site Rescue and much<br />
more, all supported by the world’s largest<br />
global service network.<br />
THIRD QUARTER <strong>2022</strong> — GLOBAL SKY QUARTERLY | 23
SPONSORED CONTENT<br />
EMPOWERING SUSTAINABLE TRAVEL<br />
WITH INTELDIGITAL INTELLIGENCE<br />
TECHNOLOGY<br />
SINO JET INTRODUCES SEAMLESS<br />
GREEN TRAVEL EXPERIENCE<br />
To actively address climate change and advocate green and sustainable development, Sino Jet, the largest<br />
business jet company in the Asia-Pacific region, has announced its goal of achieving carbon neutrality in its<br />
ground handling services and office operations by 2025 and in its overall business by 2035.<br />
As a leading business aircraft operator, Sino Jet provides comprehensive travel solutions with operation<br />
and maintenance licenses in China, the United States, Europe, Bermuda, the Cayman Islands, the Isle of<br />
Man, Guernsey, Aruba, San Marino and other major business aircraft registries. Sino Jet is also the first<br />
business jet company in mainland China to obtain IS-BAO Stage III certification for safe international<br />
operation.<br />
24 | GLOBAL SKY QUARTERLY — THIRD QUARTER <strong>2022</strong>
SPONSORED CONTENT<br />
Sino Jet promotes sustainable business aviation through carbon emission management<br />
Sino Jet joins hands with HiPhi<br />
Building digital aviation to support<br />
sustainable development<br />
Sino Jet has always taken the lead in developing an information<br />
management system that covers the entire life cycle of a business<br />
aircraft. The system is able to provide aircraft owners with details<br />
about their aircraft, arrange flight operations and manage aircraft<br />
assets using technology. This further improves the safety and<br />
operational standards of aircraft and maximizes the value of<br />
aircraft assets.<br />
Sino Jet is currently developing a "carbon management" system<br />
for business aviation companies. Through the data collected<br />
from aircraft operations, maintenance, safety management, flight<br />
records and financial details, the greenhouse gas emissions of<br />
each flight can be calculated. The management system will also<br />
suggest emission reduction plans that are based on science and<br />
therefore standardized, quantifiable and traceable, leading to<br />
increased energy conservation and reduced emissions. This level<br />
of innovation strives to inspire business aircraft users to do their<br />
part in achieving carbon neutrality through green and sustainable<br />
business aviation.<br />
New-energy intelligent vehicles for<br />
seamless green travel<br />
Sino Jet has been saving energy and reducing emissions from both<br />
the sky and on the ground through partnerships in the industry. It<br />
has teamed up with HiPhi, a Shanghai-based electric automobile<br />
manufacturer under Human Horizons, to combine green and lowcarbon<br />
travel with luxury. HiPhi X will become its vehicle for daily<br />
operations, with shuttle services provided by Fast East Aviation<br />
Service Company and Nanchang FBO.<br />
The HiPhi X, a super SUV, combines the world's leading hardware<br />
and software technologies in creating a new category of vehicles<br />
with innovative design concepts for every scenario. Compared with<br />
fuel vehicles of the same class, the HiPhi X significantly reduces<br />
carbon emissions per mileage.<br />
According to Sino Jet,<br />
Sino Jet has been actively leading the industry to explore and<br />
study carbon neutrality. In this year's CFS Financial Summit, the<br />
International Green Zero Carbon Festival and the International<br />
Quality Festival, Sino Jet has won awards including “<strong>2022</strong><br />
Model Enterprise for Sustainable Development”, “<strong>2022</strong> Digital<br />
Transformation Driving Force Award”, “<strong>2022</strong> Sustainable<br />
Development Model Enterprise”, “<strong>2022</strong> Model Enterprise for Carbon<br />
Neutralization” and “Green Quality Model Award”.<br />
www.sinojet.org<br />
The significance of<br />
achieving carbon neutrality<br />
lies not only in saving energy<br />
and reducing emissions,<br />
but also in ensuring that key<br />
stakeholders work together<br />
in research and innovation<br />
in the world of business<br />
aircraft.”<br />
THIRD QUARTER <strong>2022</strong> — GLOBAL SKY QUARTERLY | 25
The Hub of<br />
Business Aviation<br />
06–08 December <strong>2022</strong><br />
DWC, Dubai Airshow Site<br />
#MEBAAShow<br />
MEBAA Show, the Middle East’s leading<br />
business aviation event is back again<br />
this December - bringing the business<br />
aviation community together in person<br />
to take advantage of the enormous<br />
growth predicted for this sector.<br />
Follow us on:<br />
| | |<br />
Register Now<br />
visitors@dubai.aero
IADA<br />
MARKET<br />
REPORT<br />
THIRD QUARTER<br />
<strong>2022</strong><br />
WAYNE STARLING<br />
Executive Director, IADA<br />
IADA is proud to present its Third Quarter Market Report. The IADA Market<br />
Report has quickly become an essential tool for anyone interested in the<br />
business aviation market.<br />
The Market Report combines two essential elements. One is quantitative:<br />
the sales and transaction data provided by Aircraft Exchange. This data<br />
comes exclusively from IADA Accredited Dealers and Certified Brokers. More<br />
importantly, IADA Accredited Dealers buy and sell more aircraft by dollar<br />
volume than the rest of the world’s dealers combined. This means that the<br />
IADA Market Report is based on real sales data submitted by our global<br />
powerhouse collective of dealers and brokers.<br />
The second is qualitative: the opinions of IADA’s global membership. Together,<br />
they provide a unique temperature gauge measuring where our business<br />
stands now and, importantly, where our members believe the market is headed<br />
as we enter the fourth Quarter.<br />
The great news is that our business is thriving, in spite of the stressors<br />
affecting the global economy. The turbulence that we faced in 2020 and 2021<br />
has calmed down, bringing the market back to a more normalized pattern of<br />
transactions.<br />
In addition to the hard work and professionalism of our Accredited Dealers, we<br />
believe the strength and resilience of our industry has a number of factors:<br />
• There are new entrants in the market; we have an unprecedented number of<br />
first-time buyers.<br />
• Commercial airlines have cut back their services, especially in smaller<br />
cities. This has increased the need for private aircraft for individuals and<br />
businesses in those venues.<br />
• Our buyers and sellers are somewhat immune to current increases in<br />
interest rates. Over 60% of our transactions are paid in cash.<br />
We are proud of our contribution to understanding the business aviation<br />
marketplace. I'm proud to present this Market Report to you. I trust you'll find it<br />
as insightful as I do.<br />
THIRD QUARTER <strong>2022</strong> — GLOBAL SKY QUARTERLY | 27
IADA MARKET REPORT<br />
GENERAL MARKET CONDITIONS<br />
The following data is derived from questions that measure<br />
members' overall perspectives on the future of the used aircraft<br />
sales market over the next six months, including finance, leasing<br />
and commissions. Responses are reported on a 1-5 scale, with 1<br />
meaning “worst ever" and 5 meaning “best ever."<br />
Respondents report that current market conditions are “normal"<br />
for <strong>Q3</strong>. Current market conditions are driven by a near-total lack of<br />
inventory and high demand.<br />
OVERALL MARKET CONDITIONS | <strong>Q3</strong> YEAR OVER YEAR<br />
On a 1-5 scale, with 1 meaning “worst ever” and 5 meaning “best ever”<br />
<strong>Q3</strong> <strong>2022</strong> <strong>Q3</strong> 2021<br />
What is your assessment of the current<br />
business aircraft sales market?<br />
3.8<br />
4.3<br />
What is your projection for the business<br />
aircraft sales market six months from now?<br />
3.2<br />
3.8<br />
Similar to 2021, <strong>2022</strong><br />
started with optimistic<br />
sentiment and trended<br />
What is your projection for the aircraft finance<br />
market six months from now?<br />
2.8<br />
3.4<br />
back toward normal<br />
levels by <strong>Q3</strong>.<br />
What is your projection for the aircraft leasing<br />
market six months from now?<br />
2.7<br />
3.2<br />
OVERALL MARKET CONDITIONS FOR SALES, FINANCE, LEASING AND COMMISSIONS<br />
On a 1-5 scale, with 1 meaning “worst ever” and 5 meaning “best ever”<br />
What is your assessment of the current business aircraft sales market?<br />
2021 MEAN 2020 MEAN<br />
5<br />
BEST EVER<br />
4<br />
4.1 4.1<br />
3.7<br />
3.8<br />
3.9<br />
3<br />
3.4<br />
NORMAL<br />
2<br />
1<br />
WORST EVER<br />
0<br />
Q4 2021 MEAN Q1 <strong>2022</strong> MEAN Q2 <strong>2022</strong> MEAN <strong>Q3</strong> <strong>2022</strong> MEAN<br />
28 | GLOBAL SKY QUARTERLY — THIRD QUARTER <strong>2022</strong>
IADA MARKET REPORT<br />
What is your projection for the business aircraft sales market six months from now?<br />
2021 MEAN 2020 MEAN<br />
5<br />
BEST EVER<br />
4<br />
3<br />
3.8<br />
3.9<br />
3.3<br />
3.2<br />
3.7<br />
3.1<br />
NORMAL<br />
2<br />
1<br />
WORST EVER<br />
0<br />
Q4 <strong>2022</strong> MEAN Q1 <strong>2022</strong> MEAN Q2 <strong>2022</strong> MEAN <strong>Q3</strong> <strong>2022</strong> MEAN<br />
What is your projection for the aircraft finance market six months from now?<br />
2021 MEAN 2020 MEAN<br />
5<br />
BEST EVER<br />
4<br />
3<br />
3.2<br />
3.4<br />
2.8 2.8<br />
3.3<br />
3.0<br />
NORMAL<br />
2<br />
1<br />
WORST EVER<br />
0<br />
Q4 2021 MEAN Q1 <strong>2022</strong> MEAN Q2 <strong>2022</strong> MEAN <strong>Q3</strong> <strong>2022</strong> MEAN<br />
What is your projection for the aircraft leasing market six months from now?<br />
2021 MEAN 2020 MEAN<br />
5<br />
BEST EVER<br />
4<br />
NORMAL<br />
3<br />
3.1 3.1<br />
2.5<br />
2.7<br />
3.1<br />
2.7<br />
2<br />
1<br />
WORST EVER<br />
0<br />
Q4 2021 MEAN Q1 <strong>2022</strong> MEAN Q2 <strong>2022</strong> MEAN <strong>Q3</strong> <strong>2022</strong> MEAN<br />
THIRD QUARTER <strong>2022</strong> — GLOBAL SKY QUARTERLY | 29
IADA MARKET REPORT<br />
6-MONTH MARKET SECTOR OUTLOOK<br />
The <strong>Q3</strong> responses show a slight increase in demand as well as<br />
supply in the turboprop market for the next six months with the light<br />
jet, mid-size jet, and ultra-long-range jet markets stabilizing in both<br />
supply and demand. Pricing across all aircraft categories is projected<br />
to stabilize.<br />
On a 1-5 scale, with 1 meaning “worst ever” and 5 meaning “best ever”<br />
PROJECTIONS FOR THE PRE-OWNED TURBOPROP MARKET FOR THE NEXT SIX MONTHS<br />
Pricing Supply Willingness to Inventory Demand<br />
5<br />
Q4 2021 MEAN Q1 <strong>2022</strong> MEAN Q2 <strong>2022</strong> MEAN <strong>Q3</strong> <strong>2022</strong> MEAN<br />
SIGNIFICANT<br />
INCREASE<br />
4<br />
SLIGHT<br />
INCREASE<br />
3<br />
STABLE<br />
3.8<br />
3.8<br />
3.4<br />
2.5<br />
3.8<br />
3.8<br />
3.2<br />
2.4<br />
3.5<br />
3.0<br />
3.0<br />
2.7<br />
3.6<br />
3.0<br />
2.8<br />
2.7<br />
2<br />
SLIGHT<br />
DECREASE<br />
1<br />
SIGNIFICANT<br />
DECREASE<br />
0<br />
PROJECTIONS FOR THE PRE-OWNED LIGHT-JET MARKET FOR THE NEXT SIX MONTHS<br />
Pricing Supply Willingness to Inventory Demand<br />
5<br />
Q4 2021 MEAN Q1 <strong>2022</strong> MEAN Q2 <strong>2022</strong> MEAN <strong>Q3</strong> <strong>2022</strong> MEAN<br />
SIGNIFICANT<br />
INCREASE<br />
4<br />
SLIGHT<br />
INCREASE<br />
3<br />
STABLE<br />
4.0<br />
4.0<br />
3.7<br />
3.8<br />
3.8<br />
3.3<br />
2.6<br />
3.6<br />
3.1<br />
3.0<br />
2.9<br />
3.5<br />
2.9<br />
2.8<br />
2.7<br />
2<br />
2.4<br />
SLIGHT<br />
DECREASE<br />
1<br />
SIGNIFICANT<br />
DECREASE<br />
0<br />
30 | GLOBAL SKY QUARTERLY — THIRD QUARTER <strong>2022</strong>
IADA MARKET REPORT<br />
PROJECTIONS FOR THE PRE-OWNED MID-SIZE MARKET FOR THE NEXT SIX MONTHS<br />
Pricing Supply Willingness to Inventory Demand<br />
5<br />
Q4 2021 MEAN Q1 <strong>2022</strong> MEAN Q2 <strong>2022</strong> MEAN <strong>Q3</strong> <strong>2022</strong> MEAN<br />
SIGNIFICANT<br />
INCREASE<br />
4<br />
SLIGHT<br />
INCREASE<br />
3<br />
STABLE<br />
4.0<br />
3.9<br />
3.6<br />
2.4<br />
3.9<br />
3.9<br />
3.1<br />
2.7<br />
3.6<br />
3.6<br />
3.0<br />
2.9<br />
2.9<br />
2.9 2.7<br />
2.7<br />
2<br />
SLIGHT<br />
DECREASE<br />
1<br />
SIGNIFICANT<br />
DECREASE<br />
0<br />
PROJECTIONS FOR THE PRE-OWNED LARGE AND ULTRA-LONG-RANGE JET MARKET<br />
FOR THE NEXT SIX MONTHS<br />
Pricing Supply Willingness to Inventory Demand<br />
5<br />
Q4 2021 MEAN Q1 <strong>2022</strong> MEAN Q2 <strong>2022</strong> MEAN <strong>Q3</strong> <strong>2022</strong> MEAN<br />
SIGNIFICANT<br />
INCREASE<br />
4<br />
SLIGHT<br />
INCREASE<br />
3<br />
STABLE<br />
3.9<br />
3.6<br />
3.2<br />
2.4<br />
3.6<br />
3.5<br />
2.9<br />
2.7<br />
3.6<br />
2.9<br />
2.8<br />
2.7<br />
3.5<br />
2.7<br />
2.6<br />
2.5<br />
2<br />
SLIGHT<br />
DECREASE<br />
1<br />
SIGNIFICANT<br />
DECREASE<br />
0<br />
THIRD QUARTER <strong>2022</strong> — GLOBAL SKY QUARTERLY | 31
IADA MARKET REPORT<br />
MONTHLY ACTIVITY REPORTS<br />
The perspectives and projections from IADA Members for the<br />
IADA Market Report are supported by the monthly transaction/<br />
activity reports submitted by IADA Accredited Dealers through<br />
AircraftExchange.<br />
Please note that, in addition to sales data from AircraftExchange<br />
listings, the IADA Market Report includes data from all IADA<br />
Accredited Dealer activities and transactions, reported in total.<br />
Herein is a summary of those reports.<br />
DEALER ACTIVITY | <strong>Q3</strong> YEAR-OVER-YEAR<br />
<strong>Q3</strong> <strong>2022</strong> <strong>Q3</strong> 2021<br />
NEW ACQUISITION AGREEMENTS<br />
162<br />
190<br />
RETAINED TO SELL EXCLUSIVELY<br />
128<br />
210<br />
Dealer activity shows a<br />
shift away from a seller's<br />
market compared with<br />
LOWERED PRICE<br />
7<br />
31<br />
the same time last<br />
year. Q4 performance is<br />
expected to be brisk.<br />
FELL APART<br />
42<br />
40<br />
UNDER CONTRACT<br />
255<br />
360<br />
CLOSED DEALS<br />
331<br />
340<br />
IADA DEALER ACTIVITY YEAR-TO-DATE COMPARISON<br />
2021 <strong>Q3</strong> YTD 2021 YEAR TOTAL<br />
<strong>2022</strong> <strong>Q3</strong> YTD<br />
NEW ACQUISITION AGREEMENTS<br />
488<br />
519<br />
698<br />
RETAINED TO SELL EXCLUSIVELY<br />
418<br />
511<br />
552<br />
<strong>2022</strong> performance is on<br />
pace to meet or exceed<br />
2021 benchmarks, with<br />
LOWERED PRICE<br />
45<br />
59<br />
50<br />
the exception of deals<br />
under contract.<br />
FELL APART<br />
121<br />
127<br />
160<br />
UNDER CONTRACT<br />
938<br />
745<br />
1245<br />
CLOSED DEALS<br />
869<br />
929<br />
1370<br />
32 | GLOBAL SKY QUARTERLY — THIRD QUARTER <strong>2022</strong>
IADA MARKET REPORT<br />
IADA DEALER ACTIVITY REPORT<br />
Q4 2021 Q1 <strong>2022</strong> Q2 <strong>2022</strong> <strong>Q3</strong> <strong>2022</strong><br />
NEW ACQUISITION AGREEMENTS<br />
210<br />
223<br />
134<br />
162<br />
<strong>Q3</strong> ‘22<br />
162<br />
RETAINED TO SELL EXCLUSIVELY<br />
134<br />
155<br />
146<br />
210<br />
<strong>Q3</strong> ‘22<br />
210<br />
LOWERED PRICE<br />
5<br />
6<br />
22<br />
31<br />
<strong>Q3</strong> ‘22<br />
31<br />
FELL APART<br />
39<br />
45<br />
40<br />
42<br />
<strong>Q3</strong> ‘22<br />
42<br />
UNDER CONTRACT<br />
307<br />
259<br />
231<br />
255<br />
<strong>Q3</strong> ‘22<br />
255<br />
CLOSED DEALS<br />
501<br />
288<br />
310<br />
331<br />
<strong>Q3</strong> ‘22<br />
331<br />
TOTAL CLOSED DEALS BY QUARTER<br />
2020 2021 <strong>2022</strong><br />
554<br />
501<br />
288<br />
316 310<br />
283<br />
340<br />
331<br />
124<br />
213<br />
174<br />
Q1 Q2 <strong>Q3</strong> Q4<br />
THIRD QUARTER <strong>2022</strong> — GLOBAL SKY QUARTERLY | 33
NBAA-BACE ROLLS OUT<br />
OF ORLANDO<br />
By Alud Davies<br />
Traditionally the National Business Aviation Business Aviation Association's Convention and Exhibition, NBAA-<br />
BACE, has alternated between Orlando, Florida, and Las Vegas, Nevada, as there are only two exhibition spaces<br />
big enough to hold the show in the US.<br />
But a new deal will see the show move to Las Vegas for at least the next<br />
four years, much to the pleasure of many. That’s not to say that Orlando<br />
is without its charms, it is just that people tend to prefer Las Vegas.<br />
So the last show in Orlando, for the time being at least, went ahead<br />
with the usual pomp and ceremony you’d expect. The halls were<br />
packed, the static display jammed, and everybody agreed that it was<br />
the best NBAA-BACE of recent years.<br />
Two seemed to be a theme, as Cirrus also took along two of its<br />
VisionJets.<br />
The G800 that Gulfstream displayed was the very first aircraft built,<br />
serial number 80001, complete with “Experimental” titles and a<br />
long boom sticking out of the front of the nose. It is the first of two<br />
In the static display the show was notable for Gulfstream’s new G800<br />
making its public debut, as well as Dassault’s Falcon 6X making its<br />
US debut.<br />
Not satisfied with showing<br />
its G800 for the first time,<br />
Gulfstream also brought<br />
along two G700s.’’<br />
Gulfstream G800<br />
34 | THIRD QUARTER <strong>2022</strong> — GLOBAL SKY QUARTERLY
NBAA-BACE ROLLS OUT OF ORLANDO<br />
in its simplicity and designed to show just how simple an eVTOL's<br />
interior could be, whilst the flight simulator took visitors on a trip<br />
around the New York skyline, hoping from building to building with<br />
ease and at a speed unheard of in the city.<br />
Dassault’s Falcon 6X<br />
test aircraft, and will essentially be used for air data calibration and<br />
reduced vertical separation minimums (RVSM) compliance. The<br />
two Gulfstream G700s will be used by Gulfstream on a world tour to<br />
visit customers and potential customers. The two aircraft will start<br />
from opposite sides of the world, and will visit countries in South<br />
America, Europe, Africa and Asia, as well as events in the Middle East<br />
including shows in Riyadh, Bahrain and Dubai.<br />
Although most aircraft were a short coach ride away at Orlando<br />
Executive Airport, the convention halls held several advanced air<br />
mobility (AAM) electric take off and landing (eVTOL) aircraft. Hard<br />
to miss was the bright yellow Wisk Cora, it’s first generation eVTOL.<br />
For many it was the first time to be able to get up close and personal<br />
with the all-electric self-flying eVTOL, which Wisk had previously<br />
shown in Australia and the UK. The Cora sat as part of an AAM<br />
corner, which also included displays by fellow AAM companies Jaunt,<br />
and Overair.<br />
Also on display was a cabin mockup from Supernal, who took the<br />
opportunity to demonstrate its vision of AAM by having its cabinmockup<br />
as part of a flight simulator. The cabin mockup itself, whilst<br />
not necessarily representative of the finished version, was beautiful<br />
NBAA-BACE is of course a time that many companies tend to<br />
release their major news, with the Monday being littered with press<br />
conferences. This year, whilst there was a lot of news, there wasn’t<br />
much major news. Gulfstream announced that it would take its G700s<br />
on a world tour, and Honda released an updated HondaJet called the<br />
Elite II. Elsewhere, JetNet announced that it would be acquiring Asset<br />
Insight, FlyExclusive continued to make Textron happy with further<br />
Citation orders, and Web Manuals upgraded its app.<br />
As always, the event was also host to a number of personalities, this<br />
year featuring astrophysicist Neil deGrasse Tyson, Monica Barbaro<br />
– an actress that starred in the second Top Gun film – and NASCAR<br />
racer Dale Earnhardt Jr. All three spoke separately on the mainstage<br />
in the convention halls about different topics. Later, Barbaro was<br />
given a quick tour of the static display before being whisked back off<br />
to Los Angeles on a chartered Cessna Citation X.<br />
With the event drawing to a close, many drew comparisons between<br />
the event and the events that had taken place pre-pandemic. There<br />
were fewer people in attendance, but aside from the last day this was<br />
not noticeable. The halls were packed with exhibitors as they were<br />
before COVID-19, so the only real difference was the number of social<br />
events, which seemed lower than in previous years.<br />
For some, NBAA-BACE being in Orlando was a great excuse to<br />
combine a business trip with a family holiday to Disney, whilst for<br />
others the event being in Orlando was a great excuse to miss the<br />
trip completely. So as NBAA-BACE waves goodbye to Orlando for<br />
the foreseeable future, it's worth just remembering one thing: What<br />
happens in Vegas doesn’t always stay in Vegas.<br />
Gulfstream G700<br />
Wisk Cora<br />
THIRD QUARTER <strong>2022</strong> — GLOBAL SKY QUARTERLY | 35
CAPITALIZING<br />
ON THE FUTURE<br />
By Jeremy Chan<br />
The past two years have seen more electric vertical take-off and landing (eVTOL) companies merge with<br />
special purpose acquisition companies (SPACs) than ever before. While SPAC listings offer a feasible way for<br />
budding manufacturers to make their mark in the advanced air mobility industry, other challenges such as<br />
certification and a lack of talent within the AAM sector still linger in the air.<br />
When Joby Aviation went public on the New York Stock Exchange<br />
in August 2021, the company raised more money from the deal than<br />
any electric aircraft maker had ever done before.<br />
The listing helped the company to raise USD$1.1 billion – more than<br />
the USD$857.6 million Archer Aviation pocketed from its listing and<br />
nearly double the USD$584 million Lilium netted in September 2021.<br />
Joby Aviation, an electric vertical take-off and landing (eVTOL) aircraft<br />
developer, went public by merging with a special purpose acquisition<br />
company (SPAC), which is a shell corporation that is listed on a stock<br />
exchange that can merge with or acquire private companies.<br />
There are many reasons why more and more companies are listing<br />
via a SPAC merger. SPACs, or blank-check companies, help earlystage<br />
but high-growth corporations to go public in as little as<br />
eight weeks, bypassing the often tedious traditional initial public<br />
offering process, which can take anywhere between six months<br />
to two or even three years. Investor capital is also relatively safe;<br />
SPACs generally have 18 to 24 months to find a private company<br />
to merge with or acquire, and failing to do so will mean that any<br />
sort of capital that investors have put in is returned to them. The<br />
limited time window also presents an opportunity for the owners of<br />
the target company to negotiate a lower price with the SPAC for the<br />
merger. Being acquired or merging with a SPAC – which is typically<br />
sponsored by prominent business executives – provides the target<br />
company with enhanced market visibility.<br />
Though SPACs have been around for almost three decades, SPAC<br />
listings saw an explosion in popularity during the global pandemic<br />
in 2020 – with 248 SPACs listings to be exact – accounting for<br />
more than half of newly-listed U.S. companies, according to SPAC<br />
Analytics, a data provider. The year 2021 saw even more SPAC<br />
listings, with 613 SPAC IPOs, accounting for 63 percent of all IPOs in<br />
36 | GLOBAL SKY QUARTERLY — THIRD QUARTER <strong>2022</strong>
SPAC FEATURE STORY<br />
plans for a SPAC merger in November 2021, citing an “unfavorable”<br />
environment for SPAC transactions at the time. The company also<br />
wanted to avoid the risk of seeing investors redeem shares instead<br />
of remaining invested, which would have decreased the company’s<br />
overall valuation (Joby and Lilium both saw shareholder redemptions<br />
of about 65 percent, while Archer managed to hold redemptions to<br />
48.5 percent).<br />
the US. Activity, however, has eased this year, with only 82 SPAC IPOs<br />
seen in <strong>2022</strong> so far.<br />
Joby is one of six eVTOL aircraft companies that listed on a stock<br />
exchange through a SPAC merger in the last two years; eVTOL<br />
developers Vertical Aerospace, Blade and Eve Air Mobility also went<br />
public through SPAC mergers, raising more than USD$3.75 billion<br />
in total.<br />
Rapid funding<br />
SPAC mergers essentially help companies quickly raise a large<br />
amount of funds, which is crucial for an industry that is as nascent<br />
– and under pressure to succeed – as the advanced air mobility<br />
(AAM) sector. With some companies such as Archer Aviation, Lilium<br />
and Vertical Aerospace hoping to commence operations by 2024,<br />
having ready access to capital will enable eVTOL companies to ramp<br />
up production of aircraft and increase the likelihood of the company<br />
staying solvent, for example.<br />
Lilium, which merged with a SPAC called Qell Acquisition Corp, is<br />
expected to use the funds raised from the SPAC to fund the launch<br />
of its seven-seater Lilium Jet. The company’s existing shareholders<br />
are reported to have rolled 100 percent of their shares into the<br />
combined company, according a press release Lilium issued<br />
following the merger.<br />
Volocopter has opted to raise money through investors, raising more<br />
than USD$579 million in equity from investors including automotive<br />
manufacturers Geely and Mercedes-Benz Group, real estate<br />
developer WP Investment, and investment management companies<br />
Intel Capital and BlackRock.<br />
Regulatory hurdles<br />
Beyond having enough capital to kickstart operations, another<br />
obstacle all eVTOL aircraft companies have to face is the Federal<br />
Aviation Administration’s certification process.<br />
Two main types of FAA certification are required for any commercial<br />
aircraft – the first one is a type certification, under which the FAA<br />
agrees that the design of the aircraft meets all requisite safety and<br />
airworthiness standards, while the second one is an air operator’s<br />
certificate, which is when an aircraft operator receives approval<br />
from a civil aviation authority and is permitted to use aircraft for<br />
commercial purposes.<br />
Though the AAM industry believed that eVTOLs would be subject<br />
to the same FAA certifications – under Part 23 of the federal code,<br />
which is used to certificate conventional commercial aircraft –<br />
the FAA announced in May <strong>2022</strong> its choice to define eVTOLs as<br />
“powered lift” vehicles, meaning that they have to be certificated<br />
under Part 21.17(b) special class rules. The changes take into<br />
account the need to train and certify pilots to safely operate eVTOLs<br />
and the overall safety of these new transportation vehicles.<br />
Joby Aviation, on the other hand, plans to use to proceeds to fund<br />
its business through its commercial operations, including the<br />
certification of its aircraft and the development of manufacturing<br />
facilities. Or as JoeBen Bevirt, Chief Executive Officer of Joby<br />
Aviation, noted in the company’s press release following its listing:<br />
“Today’s transaction lets us look ahead to the next decade and<br />
provides us with the resources we need to bring our vision to life.”<br />
SPAC listings, however, aren’t the only way for eVTOL companies to<br />
raise capital. German aircraft manufacturer Volocopter called off its<br />
THIRD QUARTER <strong>2022</strong> — GLOBAL SKY QUARTERLY | 37
SPAC FEATURE STORY<br />
A May <strong>2022</strong> study conducted by the US Government Accountability<br />
Office, a legislative branch that provides auditing, evaluation, and<br />
investigative services for the Congress into the AAM market also notes<br />
that pilots and maintenance technicians will need to be trained in<br />
skills related to automation and electric propulsion. The report, which<br />
surveyed 36 stakeholders, noted the need to address certain issues<br />
before operations can be widely implemented, such as approving new<br />
aircraft designs, fostering public acceptance of AAM, and developing<br />
new ground infrastructure.<br />
The pressure on the FAA to quickly come up with new rules needed<br />
to kickstart commercial eVTOL operations is compounded by the<br />
fact that many eVTOL startups are backed by major airlines or other<br />
large companies: Toyota Motor Corp and Uber have a stake in Joby<br />
Aviation, Archer Aviation is backed by United Airlines – which in<br />
February 2021 reached a US$1 billion deal to buy Archer’s eVTOLs,<br />
and in September <strong>2022</strong>, also agreed to buy 200 eVTOLs from Eve<br />
Air Mobility – and Stellantis, while Vertical Aerospace is backed by<br />
American Airlines Group and Honeywell International.<br />
Financing tomorrow<br />
The next 24 months will be critical for eVTOL companies, with some<br />
of the major players in the industry such as Joby Aviation, Wisk<br />
and Volocopter working towards ensuring their aircraft commence<br />
commercial operations in late 2024 or early 2025 – with Volocopter<br />
aiming to provide eVTOL services during the 2024 Paris Olympic<br />
games, which begin in July that year.<br />
While there is currently no word on which eVTOL company will be<br />
next in line for a SPAC listing, it is clear that SPAC IPOs present a<br />
viable means for AAM companies – and even business aviation<br />
companies – to raise capital. Flexjet and FlyExecutive, for example,<br />
both announced plans for SPAC mergers in October <strong>2022</strong>. However,<br />
the fact that the AAM industry is still well in its infancy relative to the<br />
commercial or business aviation sectors, coupled with its need for<br />
fundraising to finance projects and operations, could well mean that<br />
the SPAC trend for eVTOLs looks set to continue or even accelerate<br />
within the next few years.<br />
38 | GLOBAL SKY QUARTERLY — THIRD QUARTER <strong>2022</strong>
GLOBAL<br />
PRE-OWNED<br />
MARKET UPDATE<br />
According to Andrew Young, General Manager, AMSTAT, the larger aircraft segments of the market continue to see year-over-year<br />
growth in transaction activity, and this continues to push the median value metric upwards. Availability in these markets has<br />
marginally increased but we remain in a tight market. In the medium and light jet markets, transaction activity has slowed compared<br />
to 2021 but remains significantly ahead of historic levels.<br />
THIRD QUARTER <strong>2022</strong> — GLOBAL SKY QUARTERLY | 39
GLOBAL PRE-OWNED MARKET UPDATE<br />
BUSINESS JETS & TURBOPROPS FOR SALE / LEASE<br />
Jets<br />
Turboprop<br />
1,200<br />
1,000<br />
800<br />
600<br />
Business Jet inventories are up<br />
from the start of the year but<br />
remain well below historical<br />
levels, and transaction<br />
activity remains strong with<br />
resale retail counts either<br />
meeting <strong>2022</strong> levels or at least<br />
exceeding historical counts.<br />
400<br />
Oct Nov Dec Jan<br />
<strong>2022</strong><br />
Feb Mar Apr May Jun Jul Aug Sep Oct<br />
BUSINESS JETS - RESALE RETAIL TRANSACTIONS<br />
600<br />
2020 2021 <strong>2022</strong><br />
500<br />
400<br />
300<br />
200<br />
100<br />
0<br />
Jan Feb Mar Apr May Jun Jul Aug Sep Prelim Oct Nov Dec<br />
BUSINESS TURBOPROPS - RESALE RETAIL TRANSACTIONS<br />
2020 2021 <strong>2022</strong><br />
250<br />
200<br />
150<br />
100<br />
50<br />
0<br />
Jan Feb Mar Apr May Jun Jul Aug Sep Prelim Oct Nov Dec<br />
40 | GLOBAL SKY QUARTERLY — THIRD QUARTER <strong>2022</strong>
GLOBAL PRE-OWNED MARKET UPDATE<br />
HEAVY JETS - SHORT TERM MEDIAN VALUE CHANGE<br />
50%<br />
Increase Decrease Total<br />
40%<br />
30%<br />
20%<br />
10%<br />
0%<br />
Sep15<br />
Sep1<br />
Aug15<br />
Aug1<br />
Jul15<br />
Jul1<br />
Jun15<br />
Jun1<br />
May15<br />
May1<br />
Apr15<br />
Apr1<br />
Mar15<br />
Mar1<br />
Feb15<br />
Feb1<br />
Jan15<br />
Jan1<br />
Dec15<br />
Dec1<br />
Nov15<br />
Nov1<br />
Oct15<br />
Oct1<br />
Sep15<br />
Sep1<br />
Aug15<br />
Aug1<br />
Jul15<br />
Jul1<br />
Jun15<br />
Jun1<br />
May15<br />
May1<br />
Apr15<br />
Apr1<br />
Over the past 12 months the median value of Heavy Jets has risen<br />
33% and is up 18% year-to-date. Transaction activity in this segment<br />
remains robust with pre-owned transactions in the first three<br />
quarters of the year just 4% behind historically high 2021 levels with<br />
transaction data for the period still coming in. Although availability in<br />
this segment is up 40% year-to-date, it remains 10% below a year ago.<br />
In addition, only 4% of the Heavy Jet active fleet is for sale, far below<br />
a 10-year average of 8.6%.<br />
SUPER-MID JETS - SHORT TERM MEDIAN VALUE CHANGE<br />
70%<br />
Increase Decrease Total<br />
60%<br />
50%<br />
40%<br />
30%<br />
20%<br />
10%<br />
0%<br />
Sep15<br />
Sep1<br />
Aug15<br />
Aug1<br />
Jul15<br />
Jul1<br />
Jun15<br />
Jun1<br />
May15<br />
May1<br />
Apr15<br />
Apr1<br />
Mar15<br />
Mar1<br />
Feb15<br />
Feb1<br />
Jan15<br />
Jan1<br />
Dec15<br />
Dec1<br />
Nov15<br />
Nov1<br />
Oct15<br />
Oct1<br />
Sep15<br />
Sep1<br />
Aug15<br />
Aug1<br />
Jul15<br />
Jul1<br />
Jun15<br />
Jun1<br />
May15<br />
May1<br />
Apr15<br />
Apr1<br />
Over the past 12 months, the median value of Super-Mid Jets has<br />
risen by 53% and this metric is up 31% year-to-date. The positive<br />
direction of values is in large part due to the continued momentum<br />
in resale transactions, with the first three quarters of <strong>2022</strong> already<br />
exceeding the same period in 2021 by 9%. As with the Heavy Jets, preowned<br />
inventory is up year-to-date (by 63%) but is 6% lower than a year<br />
ago. The current number of pre-owned Super-Mid Jets for sale only<br />
represents 3.4% of the active fleet versus a 10-year average of 8.3%.<br />
THIRD QUARTER <strong>2022</strong> — GLOBAL SKY QUARTERLY | 41
GLOBAL PRE-OWNED MARKET UPDATE<br />
MEDIUM JETS - SHORT TERM MEDIAN VALUE CHANGE<br />
60%<br />
Increase Decrease Total<br />
50%<br />
40%<br />
30%<br />
20%<br />
10%<br />
0%<br />
Sep15<br />
Sep1<br />
Aug15<br />
Aug1<br />
Jul15<br />
Jul1<br />
Jun15<br />
Jun1<br />
May15<br />
May1<br />
Apr15<br />
Apr1<br />
Mar15<br />
Mar1<br />
Feb15<br />
Feb1<br />
Jan15<br />
Jan1<br />
Dec15<br />
Dec1<br />
Nov15<br />
Nov1<br />
Oct15<br />
Oct1<br />
Sep15<br />
Sep1<br />
Aug15<br />
Aug1<br />
Jul15<br />
Jul1<br />
Jun15<br />
Jun1<br />
May15<br />
May1<br />
Apr15<br />
Apr1<br />
The median value of Medium Jets has risen 23% year-to-date.<br />
However, between May and today, this metric declined and then<br />
recovered which resulted in a 1% increase over the period. This<br />
slowdown is in part due to a 18% drop in pre-owned transactions in<br />
the first three quarters of <strong>2022</strong> versus 2021. That said, pre-owned<br />
transaction activity this year is a robust 30% ahead of the same<br />
period in 2019 (used as a pre-covid baseline). Availability in this<br />
segment is up 23% year-to-date but this represents only 4.1% of the<br />
fleet versus a 10-year average of 10%.<br />
LIGHT JETS - SHORT TERM MEDIAN VALUE CHANGE<br />
60%<br />
Increase Decrease Total<br />
50%<br />
40%<br />
30%<br />
20%<br />
10%<br />
0%<br />
Sep15<br />
Sep1<br />
Aug15<br />
Aug1<br />
Jul15<br />
Jul1<br />
Jun15<br />
Jun1<br />
May15<br />
May1<br />
Apr15<br />
Apr1<br />
Mar15<br />
Mar1<br />
Feb15<br />
Feb1<br />
Jan15<br />
Jan1<br />
Dec15<br />
Dec1<br />
Nov15<br />
Nov1<br />
Oct15<br />
Oct1<br />
Sep15<br />
Sep1<br />
Aug15<br />
Aug1<br />
Jul15<br />
Jul1<br />
Jun15<br />
Jun1<br />
May15<br />
May1<br />
Apr15<br />
Apr1<br />
Year-to-date the short-term median value metric for Light Jets is up<br />
25%. However the rate in increase for this metric has slowed since<br />
the summer and has even declined in some months, resulting in<br />
a 0% change since July. Transaction activity in this market is 18%<br />
below <strong>2022</strong> but 33% ahead of 2019. Availability in this segment is up<br />
21% year-to-date but 5% below a year ago. Pre-owned inventory in<br />
this market represents 5% of the fleet, well below a 10-year average<br />
of 10.7%.<br />
42 | GLOBAL SKY QUARTERLY — THIRD QUARTER <strong>2022</strong>
GLOBAL PRE-OWNED MARKET UPDATE<br />
TURBOPROPS - SHORT TERM MEDIAN VALUE CHANGE<br />
50%<br />
Increase Decrease Total<br />
45%<br />
40%<br />
35%<br />
30%<br />
25%<br />
20%<br />
15%<br />
10%<br />
5%<br />
0%<br />
-5%<br />
Sep15<br />
Sep1<br />
Aug15<br />
Aug1<br />
Jul15<br />
Jul1<br />
Jun15<br />
Jun1<br />
May15<br />
May1<br />
Apr15<br />
Apr1<br />
Mar15<br />
Mar1<br />
Feb15<br />
Feb1<br />
Jan15<br />
Jan1<br />
Dec15<br />
Dec1<br />
Nov15<br />
Nov1<br />
Oct15<br />
Oct1<br />
Sep15<br />
Sep1<br />
Aug15<br />
Aug1<br />
Jul15<br />
Jul1<br />
Jun15<br />
Jun1<br />
May15<br />
May1<br />
Apr15<br />
Apr1<br />
The median value of Turboprops has risen 12% year-to-date. Unlike<br />
the jet segments above, pre-owned transactions in the Turboprop<br />
year-to-date are below <strong>2022</strong> (-13%) and 2019 (-4%) levels. For sale<br />
inventory in the Turboprop market is up 12% year-to-date, but only<br />
3.3% of the fleet is for sale versus a 10-year average of 7.2%.<br />
Data Source: Amstat<br />
Commentary by Andrew Young<br />
IMPORTANT NOTE: The chart above uses aggregated data. The changes in values this year within individual make and model markets, and for specific serial numbers, may vary to a<br />
greater or lesser degree from these trends.<br />
THIRD QUARTER <strong>2022</strong> — GLOBAL SKY QUARTERLY | 43
PRE-OWNED<br />
MARKET<br />
SPOTLIGHT<br />
Gulfstream G650 & G650ER<br />
By Liana Liu<br />
THIRD QUARTER <strong>2022</strong> — GLOBAL SKY QUARTERLY | 45
PRE-OWNED MARKET SPOTLIGHT: G650 & G650ER<br />
HISTORY AND MODEL INTRODUCTION<br />
Although Gulfstream began working on the G650 in 2005,<br />
it wasn’t officially announced to the world until 2008. After<br />
receiving its type and production certification from the Federal<br />
Aviation Administration (FAA) and type certification from the<br />
European Union Aviation Safety Agency (EASA), the G650<br />
officially entered service in December 2012, with the OEM making<br />
multiple deliveries on the same day.<br />
Though the business jet market has evolved, the G650 is still<br />
the gold standard for its class, as it balances a comparatively<br />
low maximum take-off weight and long range, with a maximum<br />
speed that makes it the second fastest flying business jet<br />
currently available.<br />
Deriving from Gulfstream’s G550 – a model superseded by the<br />
G600 in 2014, the Gulfstream G650 family’s cabin altitude when<br />
flying at 51,000 feet (15.5 kilometers) is 4,850 feet, which at<br />
the time of the aircraft’s introduction, was the lowest one of<br />
any purpose built business jet. Cabin altitude, which refers to<br />
cabin pressure in terms of altitude above the mean sea level, is<br />
normally maintained at an altitude of 8,000 feet or less as a result<br />
of compromise between the physiological needs of the crew and<br />
passengers and an aircraft’s structural limitations.<br />
The aircraft is fitted with 16 of Gulfstream’s hallmark oval-shaped<br />
windows which are 16% larger than any of Gulfstream’s previous<br />
windows. The window blinds can be adjusted via a control panel<br />
embedded by the window, as well as Gulfstream’s downloadable<br />
app, which can also access the aircraft’s temperature, lighting,<br />
and entertainment system.<br />
Most cabin layouts see the living area at the rear of the aircraft<br />
used as a VIP cabin, where the divan or couch can convert into a<br />
bed and transform the room into an exclusive bedroom. Journeys<br />
are relatively quiet; sound levels inside the G650 cabin are similar<br />
to those of a household refrigerator.<br />
The G650ER, as its name suggests, is an extended-range version<br />
of the G650 that can fly an additional 500 nautical miles. In fact,<br />
the aircraft set a speed record in 2014 between Los Angles and<br />
Melbourne, flying non-stop in just under 15 hours – an hour less<br />
than commercial aircraft.<br />
The Gulfstream G650 family features Gulfstream’s PlaneView II<br />
flight deck which is based on a Honeywell system and includes<br />
a nose-mounted infrared camera to provide an enhanced view<br />
of airport conditions and terrain in poor visibility. The heads-up<br />
device can transmit data on a transparent screen, enabling the<br />
pilot to read and respond without distraction as they no longer<br />
need to look down to see critical information.<br />
In 2013, the G650 made history when a pre-owned aircraft was<br />
sold on the secondary market for more than USD$10 million<br />
above the aircraft’s list price. The aircraft was sold by the wife of<br />
Formula One owner Bernie Ecclestone to Thai business magnate<br />
Vichai Srivaddhanaprabha several weeks after the aircraft was<br />
delivered. A clause in G650 sales contracts forbids owners to sell<br />
on their aircraft’s position before delivery, as Gulfstream wanted<br />
to ensure that the aircraft that were ordered and delivered went<br />
to those that wanted the aircraft, and not companies that were<br />
looking to speculate on it.<br />
46 | GLOBAL SKY QUARTERLY — THIRD QUARTER <strong>2022</strong>
PRE-OWNED MARKET SPOTLIGHT: G650 & G650ER<br />
FLEET DISTRIBUTION<br />
FLEET DISTRIBUTION BY SUBREGION<br />
G650/G650ER<br />
300<br />
268<br />
250<br />
200<br />
No. of Aircraft<br />
150<br />
100<br />
85<br />
50<br />
0<br />
59<br />
39<br />
17<br />
10 10 7<br />
North<br />
America<br />
Asia<br />
West<br />
Europe<br />
Middle<br />
East<br />
South & Central<br />
America<br />
East<br />
Europe<br />
Oceania<br />
Others<br />
Data Source: Amstat<br />
As of the end of <strong>Q3</strong> <strong>2022</strong>, there was a combined total of 495<br />
G650s and G650ERs in operation worldwide, with over half (54%)<br />
in operation in the US. Of the total fleet, over 60% are G650ERs.<br />
The second highest share of aircraft are based in Asia, with<br />
Greater China home to 12% of all delivered G650 family aircraft.<br />
Diving into the Asia-Pacific region, mainland China and Hong<br />
Kong Special Administrative Region (SAR) have the largest G650/<br />
G650ER fleet. The top two Asia-Pacific charter operators with the<br />
most G650/G650ERs are Phenix Jet and TAG Aviation. (For more<br />
information about Asia-Pacific’s charter fleet, please see Global<br />
<strong>Sky</strong> Media’s Charter Report <strong>2022</strong>.) Supply chain issues and labor<br />
shortages brought about by COVID-19 related lockdown have had<br />
a negative effect on deliveries since 2020, with the number of<br />
new aircraft handed over to new owners almost being cut in half.<br />
NUMBER OF NEW G650/G650ER DELIVERY IN APAC<br />
25<br />
20<br />
No. of New Delivery<br />
15<br />
10<br />
5<br />
0<br />
2015 2016 2017 2018 2019 2020 2021<br />
Data Source: <strong>Asian</strong> <strong>Sky</strong> Group - Business Jet Fleet Report<br />
Having sold more than 500 aircraft, Gulfstream unveiled the<br />
G650’s successor in 2019. Named the G700, the aircraft is based<br />
on the G650ER, but with a 500-nautical-mile boost in range, and a<br />
larger cabin. Gulfstream said the G700, which is expected to enter<br />
service in early 2023, will eventually replace the G650 family.<br />
THIRD QUARTER <strong>2022</strong> — GLOBAL SKY QUARTERLY | 47
PRE-OWNED MARKET SPOTLIGHT: G650 & G650ER<br />
PRE-OWNED MAKET ANALYSIS<br />
As of September 30, <strong>2022</strong>, approximately 3% of the total active<br />
G650 family aircraft are listed on the market. From July 2019,<br />
inventory of available aircraft saw a shift from the baseline<br />
G650 to the G650ER, partly because there are more G650ERs<br />
in operation. The number of G650/G650ERs for sale gradually<br />
climbed from 14 to 24 from May to October 2020. Supply in the<br />
pre-owned market has shown an upward trend since November<br />
<strong>2022</strong>, with most sellers based in the US.<br />
INVENTORY LEVEL<br />
G650/G650ER<br />
30<br />
25<br />
No. of Aircraft for Sale<br />
20<br />
15<br />
10<br />
5<br />
0<br />
Oct<br />
2018<br />
Apr<br />
2019<br />
Oct<br />
2019<br />
Apr<br />
2020<br />
Oct<br />
2020<br />
Apr<br />
2021<br />
Oct<br />
2021<br />
Apr<br />
<strong>2022</strong><br />
Oct<br />
<strong>2022</strong><br />
Data Source: Amstat<br />
Prior to 2021, the average asking price of the G650 family<br />
had been on a downward trend. However, this trend has been<br />
reversed, with pre-owned prices for both the baseline G650 and<br />
the G650ER seeing increases. Many factors may contribute to the<br />
price increase. One possible reason is buyers in the US look to<br />
benefit from the 100% bonus depreciation before the end of <strong>2022</strong>.<br />
Another is new consumers with no prior exposure to business<br />
jet aviation decided to step into the market after the COVID-19<br />
outbreak. Prices may continue to rise for the Christmas season<br />
and will most likely soften as the market begins to normalize.<br />
AVERAGE ASKING PRICE<br />
G650 Avg Asking Price G650ER Avg Asking Price Avg Asking Price<br />
65,000,000<br />
60,000,000<br />
Asking Price (US Dollars)<br />
55,000,000<br />
50,000,000<br />
45,000,000<br />
40,000,000<br />
35,000,000<br />
30,000,000<br />
25,000,000<br />
Oct<br />
2018<br />
Apr<br />
2019<br />
Oct<br />
2019<br />
Apr<br />
2020<br />
Oct<br />
2020<br />
Apr<br />
2021<br />
Oct<br />
2021<br />
Apr<br />
<strong>2022</strong><br />
Oct<br />
<strong>2022</strong><br />
Data Source: Amstat & <strong>Asian</strong> <strong>Sky</strong> Group<br />
Transactions have been more active since the second half of <strong>2022</strong>.<br />
This is partly due to an increase in new users coming into business<br />
aviation for the first time. Although this had a small impact on<br />
the number of direct transactions, several charter operators<br />
looked to increase their fleets due to the increased numbers of<br />
were concentrated in the latter half of the year, which has seen<br />
fewer transactions compared with the same period of 2020, with<br />
many looking to travel during the Christmas holiday period. The<br />
US Tax Cuts and Jobs Act was behind the exceptional number of<br />
transactions that occurred in December 2020.<br />
charter enquiries that they were receiving. Transactions in 2021<br />
48 | GLOBAL SKY QUARTERLY — THIRD QUARTER <strong>2022</strong>
PRE-OWNED MARKET SPOTLIGHT: G650 & G650ER<br />
TRANSACTION HISTORY<br />
No. of G650/G650ER Sold<br />
18<br />
16<br />
14<br />
12<br />
No. of Aircraft Sold<br />
10<br />
8<br />
6<br />
4<br />
2<br />
0<br />
Oct<br />
2018<br />
Apr<br />
2019<br />
Oct<br />
2019<br />
Apr<br />
2020<br />
Oct<br />
2020<br />
Apr<br />
2021<br />
Oct<br />
2021<br />
Apr<br />
<strong>2022</strong><br />
Oct<br />
<strong>2022</strong><br />
Data Source: Amstat<br />
Aircraft usually depreciate over time and rarely see an increase in<br />
their values. For example, a 2015-build G650 saw a drop in value of<br />
51% by the end of 2020. Indeed, the G650 has been more sensitive<br />
to the external environment, seeing a 29% decrease in values<br />
between the first and the fourth quarter of 2020. This accelerated<br />
Demand from first-time buyers is stronger than before, which<br />
gives sellers in the secondary market more room to sell at a<br />
higher price, resulting in an abnormal trend in historical prices.<br />
The value of a 2015 G650 picked up by 27% from the third quarter<br />
of 2021.<br />
depreciation conflicts directly with the other aircraft in the Long<br />
Range category, which was stable within the same period.<br />
RETAIL PRICE HISTORY<br />
Aircraft Value<br />
Average Large Jet Value<br />
70M<br />
60M<br />
Aircraft Value (US Dollars)<br />
50M<br />
40M<br />
30M<br />
20M<br />
10M<br />
2015Q1<br />
2016Q1 2017Q1 2018Q1<br />
2019Q1 2020Q1 2021Q1 <strong>2022</strong>Q1<br />
Year / Quarter<br />
<strong>2022</strong><strong>Q3</strong><br />
Data Source: VREF<br />
Several operators have already disclosed their G700 orders,<br />
whilst the market for the G650/G650ER remains active. On<br />
September 26, <strong>2022</strong>, Gulfstream delivered the 500th aircraft of<br />
the G650 family. Mark Burns, Gulfstream Aerospace President,<br />
said at the time, "This milestone delivery is a strong testament to<br />
continue to invest in the G650 and G650ER to ensure continuous<br />
improvement throughout the growing fleet for our customers."<br />
During its second-quarter investor call, the parent company<br />
of Gulfstream-General Dynamics said the demand for a new<br />
G650ER continues.<br />
the tremendous work of our dedicated Gulfstream team. [...] We<br />
THIRD QUARTER <strong>2022</strong> — GLOBAL SKY QUARTERLY | 49
REASONS TO<br />
CHOOSE ASIAN SKY GROUP<br />
AN INTERNATIONAL AIRCRAFT DEALERS ASSOCIATION (IADA) MEMBER<br />
01<br />
02<br />
03<br />
CHOOSE AN ACCREDITED AIRCRAFT DEALER<br />
<strong>Asian</strong> <strong>Sky</strong> Group is an International Aircraft Dealers<br />
Association (IADA) Accredited Dealer, regulated by<br />
independent accreditation, ensuring strict compliance<br />
with IADA’s 14-point Code of Ethics. With headquarters<br />
in Hong Kong and offices around Asia, we are uniquely<br />
qualified to advise & manage aircraft transactions in<br />
Asia.<br />
CHOOSE A TEAM OF CERTIFIED AIRCRAFT BROKERS<br />
<strong>Asian</strong> <strong>Sky</strong> Group’s team of IADA Certified Brokers each<br />
passed a written test administered by an independent<br />
consulting firm. IADA Certified Brokers are required to<br />
participate in regular continuing education and be<br />
re-certified every 5 years.<br />
CHOOSE A PARTNER WITH A PROVEN HISTORY OF SUCCESS<br />
IADA aircraft dealers are responsible for 40% of the<br />
world’s pre-owned sales. IADA Accredited Dealers buy<br />
and sell more aircraft by dollar volume than the rest of<br />
the world’s dealers combined, averaging over 700<br />
transactions and USD$6 Billion in volume per year. <strong>Asian</strong><br />
<strong>Sky</strong> Group is the only IADA member in Asia.<br />
04<br />
05<br />
CHOOSE A PARTNER THAT CAN ACCESS THE MOST<br />
EXCLUSIVE AND TRUSTED GLOBAL MARKETPLACE<br />
<strong>Asian</strong> <strong>Sky</strong> Group lists and sources aircraft from an<br />
exclusive global online marketplace. AircraftExchange.com<br />
is the exclusive online marketplace of<br />
IADA and is the industry’s most trusted source for the<br />
sale or lease of aircraft. IADA’s robust listing verification<br />
process ensures aircraft advertised are truly<br />
available for sale.<br />
CHOOSE A PARTNER THAT CAN ACCESS BEST-IN-<br />
CLASS PRODUCTS AND SERVICE PROVIDERS<br />
<strong>Asian</strong> <strong>Sky</strong> Group has exclusive access to IADA-verified<br />
products and service members. These members are<br />
industry leaders in their respective fields, including<br />
escrow, legal, financial services, maintenance and<br />
refurbishment, aircraft management and operation, and<br />
over 15 other specialties.<br />
DISCRETION<br />
EXPERIENCE<br />
TRANSPARENCY<br />
PROFESSIONALISM<br />
ACCESS<br />
GLOBAL NETWORK<br />
50 | GLOBAL SKY QUARTERLY — THIRD QUARTER <strong>2022</strong><br />
sales@asianskygroup.com
MARKET<br />
DYNAMICS<br />
BUSINESS JET AND<br />
CIVIL HELICOPTER<br />
PRE-OWNED MARKET<br />
<strong>2022</strong> <strong>Q3</strong><br />
THIRD QUARTER <strong>2022</strong> — GLOBAL SKY QUARTERLY | 51
MARKET DYNAMICS: BUSINESS JET<br />
PRE-OWNED BUSINESS JET MARKET <strong>Q3</strong> <strong>2022</strong><br />
Understanding the market dynamics graphs:<br />
The Inventory Value Line represents the number of aircraft actively being marketed for sale. 1<br />
The Signal Line represents an indication of where the market’s direction may be heading in the future.<br />
INVENTORY VALUE (USD) 2<br />
$7,631M<br />
$1,044M<br />
WORLDWIDE<br />
$5,312M<br />
ASIA-PACIFIC<br />
$567M<br />
MARKET TREND 2 WORLDWIDE<br />
TREND REVERSAL<br />
MOVING TOWARDS SELLER’S MARKET<br />
MOVING TOWARDS BUYER’S MARKET<br />
TREND REVERSAL<br />
AIRCRAFT TRANSACTIONS 2 WORLDWIDE<br />
138<br />
113<br />
44<br />
58<br />
80<br />
64<br />
59<br />
62 65<br />
62<br />
50 52<br />
56 55 54<br />
48 52<br />
46<br />
41 39<br />
40<br />
30<br />
34<br />
39<br />
42<br />
38<br />
33<br />
34<br />
21 22<br />
57<br />
78<br />
63<br />
60<br />
61<br />
53<br />
53<br />
Oct<br />
2019<br />
Nov Dec Jan Feb Mar Apr May Jun Jul Aug Sep Oct Nov Dec Jan Feb Mar Apr May Jun Jul Aug Sep Oct Nov Dec Jan Feb Mar Apr May Jun Jul Aug Sep Oct<br />
2020<br />
2021<br />
<strong>2022</strong><br />
1 Global <strong>Sky</strong> Media’s Inventory Value line is calculated by taking the total number of aircraft for sale from a selection of 39 different models, multiplied by their average asking prices.<br />
2 Historical inventory value and transactions are subject to change based on latest market information updates.<br />
52 | GLOBAL SKY QUARTERLY — THIRD QUARTER <strong>2022</strong>
WORLDWIDE % OF FLEET SOLD<br />
1.70%<br />
1.60%<br />
1.50%<br />
1.40%<br />
1.30%<br />
1.20%<br />
1.10%<br />
1.00%<br />
0.90%<br />
0.80%<br />
0.70%<br />
0.60%<br />
0.50%<br />
0.40%<br />
0.30%<br />
0.20%<br />
0.10%<br />
0.00%<br />
Oct<br />
2019<br />
Dec Feb Apr Jun Aug Oct Dec Feb Apr Jun Aug Oct Dec Feb Apr Jun Aug Oct<br />
2020<br />
2021<br />
<strong>2022</strong><br />
AVERAGE ASKING PRICE<br />
MARKET DYNAMICS: BUSINESS JET<br />
MILLION USD<br />
35<br />
30<br />
25<br />
ASIA-PACIFIC<br />
20<br />
15<br />
WORLDWIDE<br />
10<br />
Oct<br />
2019<br />
% OF FLEET FOR SALE<br />
Dec Feb Apr Jun Aug Oct Dec Feb Apr Jun Aug Oct Dec Feb Apr Jun Aug Oct<br />
2020<br />
2021<br />
<strong>2022</strong><br />
9%<br />
8%<br />
ASIA-PACIFIC<br />
7%<br />
6%<br />
5%<br />
4%<br />
WORLDWIDE<br />
3%<br />
2%<br />
1%<br />
Oct<br />
2019<br />
Dec Feb Apr Jun Aug Oct Dec Feb Apr Jun Aug Oct Dec Feb Apr Jun Aug Oct<br />
2020<br />
2021<br />
<strong>2022</strong><br />
AVERAGE DAYS ON MARKET<br />
500<br />
450<br />
400<br />
350<br />
300<br />
250<br />
200<br />
ASIA-PACIFIC<br />
150<br />
100<br />
50<br />
Oct<br />
2019<br />
WORLDWIDE<br />
Dec Feb Apr Jun Aug Oct Dec Feb Apr Jun Aug Oct Dec Feb Apr Jun Aug Oct<br />
2020<br />
2021<br />
<strong>2022</strong><br />
THIRD QUARTER <strong>2022</strong> — GLOBAL SKY QUARTERLY | 53
MARKET DYNAMICS: BUSINESS JET<br />
SUPPLY / DEMAND INDICATORS<br />
BUSINESS JETS<br />
SUPPLY VS. DEMAND RATIO<br />
AVERAGE DAYS ON MARKET<br />
SUPPLY<br />
> DEMAND<br />
DAYS ON MARKET<br />
AVERAGE<br />
% OF FLEET<br />
FOR SALE<br />
MODEL<br />
AVERAGE<br />
NO TRANSACTION<br />
NO TRANSACTION<br />
NO TRANSACTION<br />
NO TRANSACTION<br />
NO TRANSACTION<br />
NO TRANSACTION<br />
450% 400% 350% 300% 250% 200% 150% 100% 50% 0<br />
Average AC for sale / Total sold in last 12 months<br />
16.7%<br />
4.2%<br />
4.8%<br />
6.1%<br />
0.0%<br />
3.8%<br />
1.0%<br />
5.4%<br />
3.1%<br />
1.6%<br />
8.9%<br />
5.1%<br />
4.9%<br />
3.4%<br />
3.1%<br />
3.5%<br />
2.4%<br />
0.6%<br />
2.2%<br />
1.5%<br />
1.6%<br />
0.0%<br />
0.0%<br />
0.0%<br />
2.6%<br />
5.6%<br />
ACJ318<br />
ACJ319<br />
ACJ320<br />
BBJ<br />
BBJ2<br />
CL300<br />
CL350<br />
CL604<br />
CL605<br />
CL650<br />
CL850<br />
GL Express<br />
GL XRS<br />
GL5000<br />
GL6000<br />
CIT. CJ3<br />
CIT. CJ4<br />
CIT. Latitude<br />
CIT. Sovereign<br />
F2000LX<br />
F2000LXS<br />
F2000S<br />
4.0% F7X<br />
2.3%<br />
0.0%<br />
F8X<br />
F900DX<br />
3.4% F900EX<br />
3.4%<br />
1.8%<br />
5.0%<br />
1.7%<br />
3.1%<br />
9.3%<br />
3.9%<br />
4.5%<br />
2.5%<br />
3.1%<br />
Average<br />
F900EXe<br />
F900LX<br />
L1000<br />
L600<br />
L650<br />
Phenom 300<br />
G200<br />
G280<br />
G450<br />
G500<br />
G550<br />
G650<br />
G650ER<br />
0 200 400 600 800 1000<br />
The above chart reflects where certain aircraft models are positioned<br />
in terms of supply and demand (based on a ratio of completed<br />
transactions compared to the number of sellers and the average<br />
number of days on the market for a transaction to take place).<br />
These indications do not necessarily mean that prices will be higher<br />
in the future, but it does indicate that sellers of these particular<br />
models are more likely to find willing buyers in a shorter period of<br />
time than on average.<br />
For some model types, given the market indicators shown on the<br />
previous page, the stabilization in pre-owned asking prices and decline<br />
in inventory level appear to have stimulated increased demand,<br />
leading to an increase in transactions and a more balanced state of<br />
supply and demand.<br />
This can be seen the most with certain Gulfstream (G200, G450, G550,<br />
G650), Bombardier (Challenger 604/605 & Global 5000) and Dassault<br />
Falcon models (2000 Series and 7X), where more transactions are<br />
occurring relative to the number for sale, and transactions are requiring<br />
less time on the market for sellers to complete.<br />
54 | GLOBAL SKY QUARTERLY — THIRD QUARTER <strong>2022</strong>
MARKET DYNAMICS: BUSINESS JET<br />
MARKET POSITIONING<br />
BUSINESS JETS<br />
INCREASED SUPPLY<br />
Balanced<br />
Supply & Demand<br />
INCREASED DEMAND<br />
ACJ318<br />
ACJ319<br />
ACJ320<br />
BBJ 1<br />
BBJ 2<br />
CL300<br />
CL350<br />
CL604<br />
CL605<br />
CL650<br />
CL850<br />
GL Express<br />
GL XRS<br />
GL5000<br />
GL6000<br />
CIT. CJ3<br />
CIT. CJ4<br />
CIT. Latitude<br />
CIT. Sovereign<br />
F2000LX<br />
F2000LXS<br />
F2000S<br />
F7X<br />
F8X<br />
F900DX<br />
F900EX<br />
F900EX EASy<br />
F900LX<br />
L1000<br />
L600<br />
L650<br />
Phenom 300<br />
G200<br />
G280<br />
G450<br />
G500<br />
G550<br />
G650<br />
G650ER<br />
The above chart provides a visual representation of the supply /<br />
demand ratio of each aircraft model relative to the overall market,<br />
and is based on a "Marketability" calculation for each particular<br />
model including the following four market indicators:<br />
1. The percentage of aircraft for sale relative to its fleet size.<br />
2. The number of aircraft sold relative to the average number for sale.<br />
3. The average days for sale relative to the overall market average.<br />
4. The momentum of the marketplace (represented by the trend<br />
towards supply and demand market equilibrium portrayed earlier).<br />
When taking into account these four factors, most of the large<br />
and medium sized jets, such as the Challenger 600, Falcon 2000<br />
& 900 Series, as well as various Gulfstream models, appear<br />
better positioned to find buyers available, compared to corporate<br />
airliner models.<br />
Global <strong>Sky</strong> Media expanded its market research scope in <strong>Q3</strong> 2019<br />
to include 39 business jet models including light jet models as<br />
described in the report.<br />
THIRD QUARTER <strong>2022</strong> — GLOBAL SKY QUARTERLY | 55
MARKET DYNAMICS: CIVIL HELICOPTERS<br />
PRE-OWNED HELICOPTERS MARKET <strong>Q3</strong> <strong>2022</strong><br />
Understanding the market dynamics graphs:<br />
The Inventory Value Line represents the number of aircraft actively being marketed for sale. 1<br />
The Signal Line represents an indication of where the market’s direction may be heading in the future.<br />
INVENTORY VALUE (USD) 2<br />
$1,218M<br />
WORLDWIDE<br />
ASIA-PACIFIC<br />
$757M<br />
$178M<br />
$127M<br />
MARKET TREND 2 WORLDWIDE<br />
MOVING TOWARDS SELLER’S MARKET<br />
TREND IMPROVEMENT<br />
MOVING TOWARDS BUYER’S MARKET<br />
AIRCRAFT TRANSACTIONS 2 WORLDWIDE<br />
22<br />
18<br />
24<br />
32<br />
27<br />
31<br />
24<br />
30<br />
22<br />
14<br />
20<br />
31<br />
15<br />
31 32<br />
27 28<br />
29<br />
50<br />
39<br />
32<br />
34<br />
29<br />
31<br />
27<br />
46<br />
23<br />
32<br />
22<br />
44<br />
50<br />
38<br />
35<br />
28<br />
31<br />
13<br />
6<br />
Oct<br />
2019<br />
Nov Dec Jan Feb Mar Apr May Jun Jul Aug Sep Oct Nov Dec Jan Feb Mar Apr May Jun Jul Aug Sep Oct Nov Dec Jan Feb Mar Apr May Jun Jul Aug Sep Oct<br />
2020<br />
2021<br />
<strong>2022</strong><br />
1 Global <strong>Sky</strong> Media’s Inventory Value line is calculated by taking the total number of aircraft for sale from a selection of 39 different models, multiplied by their average asking prices.<br />
2 Historical inventory value and transactions are subject to change based on latest market information updates.<br />
56 | GLOBAL SKY QUARTERLY — THIRD QUARTER <strong>2022</strong>
MARKET DYNAMICS: CIVIL HELICOPTERS<br />
% OF AIRCRAFT SOLD / TOTAL AIRCRAFT IN OPERATION<br />
0.50%<br />
0.45%<br />
0.40%<br />
0.35%<br />
0.30%<br />
0.25%<br />
0.20%<br />
0.15%<br />
0.10%<br />
0.05%<br />
0.00%<br />
Oct<br />
2019<br />
Dec Feb Apr Jun Aug Oct Dec Feb Apr Jun Aug Oct Dec Feb Apr Jun Aug Oct<br />
2020<br />
2021<br />
<strong>2022</strong><br />
AVERAGE ASKING PRICE<br />
MILLION USD<br />
3.8<br />
3.6<br />
3.4<br />
3.2<br />
3.0<br />
2.8<br />
2.6<br />
2.4<br />
2.2<br />
ASIA-PACIFIC<br />
WORLDWIDE<br />
2.0<br />
Oct<br />
2019<br />
Dec Feb Apr Jun Aug Oct Dec Feb Apr Jun Aug Oct Dec Feb Apr Jun Aug Oct<br />
2020<br />
2021<br />
<strong>2022</strong><br />
% OF AIRCRAFT FOR SALE<br />
5.0%<br />
4.5%<br />
WORLDWIDE<br />
4.0%<br />
ASIA-PACIFIC<br />
3.5%<br />
3.0%<br />
2.5%<br />
2.0%<br />
1.5%<br />
Oct<br />
2019<br />
Dec Feb Apr Jun Aug Oct Dec Feb Apr Jun Aug Oct Dec Feb Apr Jun Aug Oct<br />
2020<br />
2021<br />
<strong>2022</strong><br />
AVERAGE DAYS ON MARKET<br />
750<br />
700<br />
650<br />
600<br />
WORLDWIDE<br />
ASIA-PACIFIC<br />
550<br />
500<br />
450<br />
400<br />
350<br />
Oct<br />
2019<br />
Dec Feb Apr Jun Aug Oct Dec Feb Apr Jun Aug Oct Dec Feb Apr Jun Aug Oct<br />
2020<br />
2021<br />
<strong>2022</strong><br />
THIRD QUARTER <strong>2022</strong> — GLOBAL SKY QUARTERLY | 57
MARKET DYNAMICS: CIVIL HELICOPTERS<br />
SUPPLY / DEMAND INDICATORS<br />
HELICOPTERS<br />
SUPPLY VS. DEMAND RATIO<br />
SUPPLY / DEMAND INDICATORS<br />
SUPPLY<br />
> DEMAND<br />
DAYS ON MARKET<br />
AVERAGE<br />
% FOR SALE MODEL<br />
AVERAGE<br />
1.4%<br />
EC145<br />
1.6%<br />
H125<br />
2.0%<br />
H130<br />
0.7%<br />
H145<br />
6.5%<br />
H155<br />
3.2%<br />
EC135P2<br />
0.7%<br />
EC135T2<br />
NO TRANSACTION<br />
7.7%<br />
EC155B<br />
2.5%<br />
BELL<br />
206JETRANGER<br />
3.7%<br />
BELL<br />
206LONGRANGER<br />
1.6%<br />
BELL 407<br />
3.0%<br />
BELL 412EP<br />
NO TRANSACTION<br />
2.2%<br />
BELL 412HP<br />
1.2%<br />
BELL 429<br />
6.6%<br />
AW109SP GN<br />
1.6%<br />
AW139<br />
8.6%<br />
S76C+<br />
350% 300% 250% 200% 150% 100% 50% 0 2.36%<br />
0 100 200 300 400 500 600 700 800<br />
Average<br />
Average AC for sale / Total sold in last 12 months<br />
Average Days for Sale on Market<br />
The above chart reflects where certain aircraft models are positioned<br />
in terms of supply and demand (based on a ratio of completed<br />
transactions compared to the number of sellers, and average number<br />
of days on the market for a transaction to take place).<br />
58 | GLOBAL SKY QUARTERLY — THIRD QUARTER <strong>2022</strong>
MARKET DYNAMICS: CIVIL HELICOPTERS<br />
MARKET POSITIONING<br />
HELICOPTERS<br />
INCREASED SUPPLY<br />
Balanced<br />
Supply & Demand<br />
INCREASED DEMAND<br />
EC145<br />
H125<br />
H130<br />
H145<br />
H155<br />
EC135P2<br />
EC135T2<br />
EC155B<br />
BELL 206JETRANGER<br />
BELL 206LONGRANGER<br />
BELL 407<br />
BELL 412EP<br />
BELL 412HP<br />
BELL 429<br />
AW109SP GN<br />
AW139<br />
S76C+<br />
The above chart provides a visual representation of the supply / demand ratio of each aircraft model relative to the overall market,<br />
resulting in a "Marketability" calculation of each particular model based on the following four market indicators:<br />
1. The percentage of aircraft for sale relative to its fleet size.<br />
2. The number of aircraft sold relative to the average number for sale.<br />
3. The average days for sale relative to the overall market average.<br />
4. The momentum of the marketplace (represented by the trend towards supply and demand market equilibrium portrayed earlier).<br />
THIRD QUARTER <strong>2022</strong> — GLOBAL SKY QUARTERLY | 59
CONNECT YOUR BRAND WITH OUR AUDIENCE<br />
Global <strong>Sky</strong> Media readers are business decision-makers in the<br />
business jet and general aviation industry from Asia and across<br />
the world. Our market intelligence helps them drive strategies<br />
for achieving their business goals in Asia. Through Global <strong>Sky</strong><br />
Media's channels, you can connect with your target audience.<br />
Contact us to find out how we can help you.<br />
PUBLICATION ADVERTISING<br />
DIGITAL ADVERTISING<br />
CONTENT MARKETING<br />
EVENT MANAGEMENT<br />
www.globalsky.media<br />
media@globalsky.media
MARKET<br />
SUMMARY<br />
BUSINESS JETS<br />
<strong>2022</strong> <strong>Q3</strong><br />
Data Analysis by Qianyun Zhou<br />
THIRD QUARTER <strong>2022</strong> — GLOBAL SKY QUARTERLY | 61
MARKET SUMMARY: BUSINESS JETS<br />
MARKET SUMMARY PER MODEL<br />
INVENTORY LEVEL, PRICE TREND & TRANSACTIONS<br />
ACJ318, ACJ319 & ACJ320<br />
PERFORMANCE<br />
Max Range<br />
Max Speed<br />
Typ. Passengers<br />
ACJ318<br />
4,253 N.M. / 7,877 km<br />
Mach 0.82<br />
19<br />
ACJ319<br />
6,000 N.M. / 11,112 km<br />
Mach 0.82<br />
19<br />
ACJ320<br />
5,250 N.M. / 9,723 km<br />
Mach 0.82<br />
19<br />
SUPPLY<br />
No. for Sale<br />
Avg Asking Price<br />
Avg Days on Market<br />
Oct<br />
3 (16.7%)<br />
26.5M USD<br />
298<br />
Jul<br />
4 (22.2%)<br />
26.5M USD<br />
163<br />
Oct<br />
3 (4.2%)<br />
39.5M USD<br />
386<br />
Jul<br />
3 (4.3%)<br />
39.5M USD<br />
305<br />
Oct<br />
1 (4.8%)<br />
39.5M USD<br />
1,510<br />
Jul<br />
1 (4.8%)<br />
39.5M USD<br />
1,418<br />
TRANSACTION<br />
Past 12 Months<br />
Past 3 Months<br />
Oct<br />
0<br />
0<br />
Jul<br />
0<br />
0<br />
Oct<br />
0<br />
0<br />
Jul<br />
0<br />
0<br />
Oct<br />
0<br />
0<br />
Jul<br />
0<br />
0<br />
Average Asking Price (Million USD)<br />
ACJ318<br />
ACJ320<br />
ACJ319<br />
Average<br />
$42.0 $42.0<br />
$39.5 $39.5 $39.5 $39.5 $39.5<br />
$39.5<br />
$39.5<br />
$39.5 $39.5<br />
$39.5<br />
$39.5 $39.5<br />
$23.0<br />
Sold<br />
For Sale<br />
1 1<br />
$25.0<br />
For Sale vs. Sold<br />
1<br />
$22.0<br />
1<br />
$26.5 $26.5 $26.5 $26.5<br />
6 7 7 7 5 5 7 6 6 5 5 5 5 6 6 6 5 6 5 5 6 8 9 8 7<br />
Oct Dec Feb Apr Jun Aug Oct Dec Feb Apr Jun Aug Oct<br />
2020 2021 <strong>2022</strong><br />
Market Indicators (vs. Last Quarter)<br />
ACJ318<br />
Transaction Level (Past 12 Months)<br />
Inventory Level<br />
Average Asking Price<br />
Average Days on Market<br />
ACJ319<br />
Transaction Level (Past 12 Months)<br />
Inventory Level<br />
Average Asking Price<br />
Average Days on Market<br />
ACJ320<br />
Transaction Level (Past 12 Months)<br />
Inventory Level<br />
Average Asking Price<br />
Average Days on Market<br />
Source: AMSTAT & ASG<br />
62 | GLOBAL SKY QUARTERLY — THIRD QUARTER <strong>2022</strong>
MARKET SUMMARY: BUSINESS JETS<br />
BBJ & BBJ2<br />
PERFORMANCE<br />
Max Range<br />
Max Speed<br />
Typ. Passengers<br />
BBJ<br />
6,235 N.M. / 11,547 km<br />
Mach 0.82<br />
19<br />
BBJ2<br />
5,620 N.M. / 10,408 km<br />
Mach 0.82<br />
19<br />
SUPPLY<br />
No. for Sale<br />
Avg Asking Price<br />
Avg Days on Market<br />
Oct<br />
8 (6.1%)<br />
30.0M USD<br />
288<br />
Jul<br />
7 (5.3%)<br />
33.5M USD<br />
327<br />
Oct<br />
0 (0.0%)<br />
0.0M USD<br />
0<br />
Jul<br />
3 (13.6%)<br />
29.0M USD<br />
271<br />
TRANSACTION<br />
Past 12 Months<br />
Past 3 Months<br />
Oct<br />
10<br />
2<br />
Jul<br />
8<br />
4<br />
Oct<br />
3<br />
1<br />
Jul<br />
2<br />
1<br />
Average Asking Price (Million USD)<br />
BBJ2<br />
Market Indicators (vs. Last Quarter)<br />
$90.0 $90.0<br />
$59.5<br />
BBJ<br />
Average<br />
BBJ<br />
Transaction Level (Past 12 Months)<br />
$20.9<br />
$28.5<br />
$19.0<br />
$29.0<br />
$15.5<br />
$38.0<br />
$29.0<br />
$33.5 $30.0<br />
$29.0<br />
Inventory Level<br />
Average Asking Price<br />
Average Days on Market<br />
For Sale vs. Sold<br />
Sold For Sale<br />
1 1<br />
2<br />
2<br />
1 2<br />
1 2 1<br />
2<br />
1<br />
7 7 8 9 9 9 10 9 9 9 11 11 11 11 12 11 9 10 9 10 10 10 7 7 8<br />
Oct Dec Feb Apr Jun Aug Oct Dec Feb Apr Jun Aug Oct<br />
2020 2021 <strong>2022</strong><br />
FEATURED AIRCRAFT<br />
BBJ2<br />
Transaction Level (Past 12 Months)<br />
Inventory Level<br />
Average Asking Price<br />
Average Days on Market<br />
Source: AMSTAT & ASG<br />
BBJ MAX8<br />
TOTAL HOURS: DELIVERY HOURS<br />
• Green Delivery<br />
• Delivered Dec 2020<br />
• Valid Trasferable OEM Warranty<br />
• FAA N-registered<br />
• Located in the U.S.<br />
• 7 Auxiliary Fuel Tanks Installed<br />
• FAA Type Certificate and Certificate of Airworthiness<br />
• Valuable Goods, Services & Additional Training Credit<br />
THIRD QUARTER <strong>2022</strong> — GLOBAL SKY QUARTERLY | 63
MARKET SUMMARY: BUSINESS JETS<br />
CHALLENGER 300 & 350<br />
PERFORMANCE<br />
Max Range<br />
Max Speed<br />
Typ. Passengers<br />
CL300<br />
3,340 N.M. / 6,185 km<br />
Mach 0.82<br />
19<br />
CL350<br />
3,421 N.M. / 6,335 km<br />
Mach 0.82<br />
19<br />
SUPPLY<br />
No. for Sale<br />
Avg Asking Price<br />
Avg Days on Market<br />
Oct<br />
17 (3.8%)<br />
13.0M USD<br />
141<br />
Jul<br />
18 (4.0%)<br />
15.9M USD<br />
112<br />
Oct<br />
4 (1.0%)<br />
21.6M USD<br />
76<br />
Jul<br />
3 (0.7%)<br />
16.9M USD<br />
22<br />
TRANSACTION<br />
Past 12 Months<br />
Past 3 Months<br />
Oct<br />
28<br />
7<br />
Jul<br />
21<br />
14<br />
Oct<br />
22<br />
8<br />
Jul<br />
14<br />
7<br />
Average Asking Price (Million USD)<br />
CL350<br />
Market Indicators (vs. Last Quarter)<br />
CL300<br />
Average<br />
$14.6 $15.2 $16.3<br />
$16.8 $16.9<br />
$21.6<br />
CL300<br />
Transaction Level (Past 12 Months)<br />
$7.9 $8.1 $7.5<br />
$8.4<br />
$12.3<br />
$15.9<br />
$13.0<br />
Inventory Level<br />
Average Asking Price<br />
Average Days on Market<br />
For Sale vs. Sold<br />
Sold For Sale<br />
6<br />
3<br />
4<br />
5 4<br />
9<br />
8<br />
2<br />
1<br />
4 4<br />
3 4<br />
4 8<br />
5<br />
4<br />
6<br />
2<br />
2<br />
2<br />
8<br />
1 2<br />
1<br />
31 31 29 25 27 25 25 21 23 17 14 14 8 7 3 4 5 11 12 11 16 21 23 23 21<br />
Oct Dec Feb Apr Jun Aug Oct Dec Feb Apr Jun Aug Oct<br />
2020 2021 <strong>2022</strong><br />
CL350<br />
Transaction Level (Past 12 Months)<br />
Inventory Level<br />
Average Asking Price<br />
Average Days on Market<br />
Source: AMSTAT & ASG<br />
64 | GLOBAL SKY QUARTERLY — THIRD QUARTER <strong>2022</strong>
MARKET SUMMARY: BUSINESS JETS<br />
CHALLENGER 604, 605 & 650<br />
PERFORMANCE<br />
Max Range<br />
Max Speed<br />
Typ. Passengers<br />
CL604<br />
4,027 N.M. / 7,458 km<br />
Mach 0.82<br />
9<br />
CL605<br />
4,123 N.M. / 7,635 km<br />
Mach 0.82<br />
9<br />
CL650<br />
4,123 N.M. / 7,635 km<br />
Mach 0.82<br />
10<br />
SUPPLY<br />
No. for Sale<br />
Avg Asking Price<br />
Avg Days on Market<br />
Oct<br />
19 (5.4%)<br />
8.2M USD<br />
93<br />
Jul<br />
17 (4.8%)<br />
7.8M USD<br />
60<br />
Oct<br />
9 (3.1%)<br />
14.9M USD<br />
146<br />
Jul<br />
9 (3.1%)<br />
13.8M USD<br />
101<br />
Oct<br />
2 (1.6%)<br />
21.0M USD<br />
88<br />
Jul<br />
4 (3.2%)<br />
25.0M USD<br />
46<br />
TRANSACTION<br />
Past 12 Months<br />
Past 3 Months<br />
Oct<br />
35<br />
9<br />
Jul<br />
26<br />
15<br />
Oct<br />
24<br />
5<br />
Jul<br />
19<br />
11<br />
Oct<br />
16<br />
1<br />
Jul<br />
15<br />
8<br />
Average Asking Price (Million USD)<br />
$17.0<br />
$16.5<br />
$16.5<br />
$18.5<br />
$8.5<br />
$8.7<br />
$7.4 $6.9<br />
$4.4<br />
$4.4<br />
$4.5 $4.7<br />
CL650<br />
CL605<br />
$16.8<br />
$7.5<br />
$6.8<br />
CL604<br />
Average<br />
$25.0<br />
$21.0<br />
$13.5<br />
$14.9<br />
$8.9 $8.2<br />
Market Indicators (vs. Last Quarter)<br />
CL604<br />
Transaction Level (Past 12 Months)<br />
Inventory Level<br />
Average Asking Price<br />
Average Days on Market<br />
CL605<br />
Transaction Level (Past 12 Months)<br />
Inventory Level<br />
For Sale vs. Sold<br />
Sold For Sale<br />
Average Asking Price<br />
Average Days on Market<br />
8<br />
14<br />
18<br />
4 5 10 7 7 9<br />
6<br />
4 8<br />
8<br />
7<br />
7 6<br />
1<br />
2 8 11 10 6<br />
6 7<br />
3<br />
72 69 59 55 53 48 47 45 42 39 38 34 22 16 17 13 15 15 18 17 20 30 32 31 30<br />
Oct Dec Feb Apr Jun Aug Oct Dec Feb Apr Jun Aug Oct<br />
2020 2021 <strong>2022</strong><br />
CL650<br />
Transaction Level (Past 12 Months)<br />
Inventory Level<br />
Average Asking Price<br />
Average Days on Market<br />
Source: AMSTAT & ASG<br />
THIRD QUARTER <strong>2022</strong> — GLOBAL SKY QUARTERLY | 65
MARKET SUMMARY: BUSINESS JETS<br />
CHALLENGER 850<br />
Average Asking Price (Million USD)<br />
Market Indicators (vs. Last Quarter)<br />
$8.3<br />
$7.0<br />
Transaction Level (Past 12 Months)<br />
Inventory Level<br />
Average Asking Price<br />
Average Days on Market<br />
$4.5<br />
1<br />
1<br />
$4.3<br />
For Sale vs. Sold<br />
Sold<br />
For Sale<br />
1<br />
$4.7<br />
1<br />
1 1<br />
1<br />
$4.8 $5.7<br />
12 13 12 11 9 9 7 6 6 6 6 5 7 7 6 3 3 6 6 5 6 7 7 8 8<br />
Oct Dec Feb Apr Jun Aug Oct Dec Feb Apr Jun Aug Oct<br />
2020 2021 <strong>2022</strong><br />
1<br />
2<br />
1 1<br />
1<br />
2<br />
PERFORMANCE<br />
Max Range<br />
Max Speed<br />
Typ. Passengers<br />
SUPPLY<br />
No. for Sale<br />
Avg Asking Price<br />
Avg Days on Market<br />
TRANSACTION<br />
Past 12 Months<br />
Past 3 Months<br />
6,750 N.M. / 12,501 km<br />
Mach 0.87<br />
18<br />
Oct<br />
8 (8.9%)<br />
7.0M USD<br />
194<br />
Oct<br />
8<br />
2<br />
Jul<br />
7 (7.9%)<br />
8.3M USD<br />
138<br />
Jul<br />
6<br />
2<br />
Source: AMSTAT & ASG<br />
66 | GLOBAL SKY QUARTERLY — THIRD QUARTER <strong>2022</strong>
MARKET SUMMARY: BUSINESS JETS<br />
GLOBAL EXPRESS, 5000, XRS & 6000<br />
PERFORMANCE<br />
Max Range<br />
Max Speed<br />
Typ. Passengers<br />
GLOBAL 5000<br />
5,350 N.M. / 9,908 km<br />
Mach 0.82<br />
13<br />
GLOBAL EXPRESS<br />
6,125 N.M. / 11,343 km<br />
Mach 0.82<br />
13<br />
GLOBAL XRS<br />
6,226 N.M. / 11,520 km<br />
Mach 0.82<br />
13<br />
GLOBAL 6000<br />
6,080 N.M. / 11,260 km<br />
Mach 0.82<br />
13<br />
SUPPLY<br />
No. for Sale<br />
Avg Asking Price<br />
Avg Days on Market<br />
Oct<br />
8 (3.4%)<br />
27.9M USD<br />
155<br />
Jul<br />
7 (3.0%)<br />
25.5M USD<br />
163<br />
Oct<br />
7 (5.1%)<br />
14.1M USD<br />
353<br />
Jul<br />
4 (2.9%)<br />
12.3M USD<br />
549<br />
Oct<br />
8 (4.9%)<br />
17.8M USD<br />
331<br />
Jul<br />
6 (3.7%)<br />
17.5M USD<br />
398<br />
Oct<br />
10 (3.1%)<br />
31.5M USD<br />
103<br />
Jul<br />
6 (1.9%)<br />
32.0M USD<br />
67<br />
TRANSACTION<br />
Past 12 Months<br />
Past 3 Months<br />
Oct<br />
27<br />
6<br />
Jul<br />
21<br />
11<br />
Oct<br />
25<br />
4<br />
Jul<br />
21<br />
9<br />
Oct<br />
23<br />
4<br />
Jul<br />
19<br />
9<br />
Oct<br />
30<br />
5<br />
Jul<br />
25<br />
9<br />
Average Asking Price (Million USD)<br />
$27.2<br />
$16.9 $15.0<br />
$14.5<br />
7<br />
6<br />
11<br />
6<br />
$27.2<br />
$14.4<br />
8 3<br />
5 5 5<br />
$25.0<br />
$16.6<br />
$14.4<br />
$7.1 $7.7<br />
$7.4<br />
For Sale vs. Sold<br />
Sold<br />
For Sale<br />
9<br />
9<br />
$13.5<br />
5<br />
$27.0<br />
$15.0<br />
$9.4<br />
8<br />
79 81 80 69 73 70 79 73 71 63 56 52 47 41 32 21 25 23 26 26 24 23 24 23 33<br />
7<br />
GL EXPRESS<br />
GL XRS<br />
GL6000<br />
21<br />
7<br />
$28.0<br />
$14.7<br />
$14.0<br />
$6.5<br />
9<br />
4<br />
7<br />
$17.5<br />
GL5000<br />
Average<br />
$32.0<br />
$12.3<br />
11 11<br />
$17.0<br />
9<br />
$27.9<br />
12<br />
6<br />
$31.5<br />
$17.8<br />
$14.1<br />
Oct Dec Feb Apr Jun Aug Oct Dec Feb Apr Jun Aug Oct<br />
2020 2021 <strong>2022</strong><br />
1<br />
Market Indicators (vs. Last Quarter)<br />
GLOBAL 5000<br />
Transaction Level (Past 12 Months)<br />
Inventory Level<br />
Average Asking Price<br />
Average Days on Market<br />
GLOBAL EXPRESS<br />
Transaction Level (Past 12 Months)<br />
Inventory Level<br />
Average Asking Price<br />
Average Days on Market<br />
GLOBAL XRS<br />
Transaction Level (Past 12 Months)<br />
Inventory Level<br />
Average Asking Price<br />
Average Days on Market<br />
GLOBAL 6000<br />
Transaction Level (Past 12 Months)<br />
Inventory Level<br />
Average Asking Price<br />
Average Days on Market<br />
Source: AMSTAT & ASG<br />
THIRD QUARTER <strong>2022</strong> — GLOBAL SKY QUARTERLY | 67
MARKET SUMMARY: BUSINESS JETS<br />
CITATION CJ3 & CJ4<br />
PERFORMANCE<br />
Max Range<br />
Max Speed<br />
Typ. Passengers<br />
Cit. CJ3<br />
1,891 N.M. / 3,502 km<br />
Mach 0.73<br />
6<br />
Cit. CJ4<br />
1,991 N.M. / 3,687 km<br />
Mach 0.77<br />
7<br />
SUPPLY<br />
No. for Sale<br />
Avg Asking Price<br />
Avg Days on Market<br />
Oct<br />
22 (3.5%)<br />
6.7M USD<br />
76<br />
Jul<br />
13 (2.1%)<br />
3.8M USD<br />
53<br />
Oct<br />
8 (2.4%)<br />
8.1M USD<br />
75<br />
Jul<br />
10 (2.7%)<br />
9.0M USD<br />
51<br />
TRANSACTION<br />
Past 12 Months<br />
Past 3 Months<br />
Oct<br />
57<br />
14<br />
Jul<br />
43<br />
21<br />
Oct<br />
36<br />
6<br />
Jul<br />
30<br />
14<br />
Average Asking Price (Million USD)<br />
Market Indicators (vs. Last Quarter)<br />
CJ4<br />
CJ3<br />
Average<br />
$11.5<br />
Cit. CJ3<br />
$5.1<br />
$4.4<br />
$6.5 $6.6<br />
$5.1<br />
$7.8<br />
$5.6<br />
$6.7<br />
$4.8<br />
$5.6<br />
$8.1<br />
$6.7<br />
Transaction Level (Past 12 Months)<br />
Inventory Level<br />
Average Asking Price<br />
Average Days on Market<br />
$2.5<br />
For Sale vs. Sold<br />
Sold For Sale<br />
16<br />
8<br />
11<br />
6 15<br />
5 7<br />
6<br />
20<br />
5<br />
14 11<br />
5<br />
12<br />
5 2 7<br />
4<br />
5<br />
5<br />
6<br />
4 3<br />
6 3<br />
63 60 52 37 34 34 32 26 25 24 17 20 19 17 16 8 8 12 18 20 18 23 24 28 30<br />
Oct Dec Feb Apr Jun Aug Oct Dec Feb Apr Jun Aug Oct<br />
2020 2021 <strong>2022</strong><br />
Cit. CJ4<br />
Transaction Level (Past 12 Months)<br />
Inventory Level<br />
Average Asking Price<br />
Average Days on Market<br />
Source: AMSTAT & ASG<br />
68 | GLOBAL SKY QUARTERLY — THIRD QUARTER <strong>2022</strong>
MARKET SUMMARY: BUSINESS JETS<br />
CITATION LATITUDE<br />
Average Asking Price (Million USD)<br />
Market Indicators (vs. Last Quarter)<br />
Transaction Level (Past 12 Months)<br />
$13.5 $13.5 $13.5<br />
$11.5<br />
$11.5<br />
$11.5<br />
$14.3<br />
Inventory Level<br />
Average Asking Price<br />
Average Days on Market<br />
For Sale vs. Sold<br />
Sold<br />
For Sale<br />
1 1 1<br />
3<br />
1<br />
3<br />
1<br />
1<br />
1<br />
1<br />
1<br />
1<br />
7 7 7 6 7 6 3 2 2 1 1 2 1 1 1 1 3 2 4 4 1 1 2<br />
Oct Dec Feb Apr Jun Aug Oct Dec Feb Apr Jun Aug Oct<br />
2020 2021 <strong>2022</strong><br />
2<br />
PERFORMANCE<br />
Max Range<br />
Max Speed<br />
Typ. Passengers<br />
SUPPLY<br />
No. for Sale<br />
Avg Asking Price<br />
Avg Days on Market<br />
TRANSACTION<br />
Past 12 Months<br />
Past 3 Months<br />
2,870N.M. / 5,315 km<br />
Mach 0.80<br />
9<br />
Oct<br />
2 (0.6%)<br />
14.3M USD<br />
46<br />
Oct<br />
9<br />
1<br />
Jul<br />
4 (1.3%)<br />
11.5M USD<br />
62<br />
Jul<br />
8<br />
3<br />
CITATION SOVEREIGN<br />
Average Asking Price (Million USD)<br />
Market Indicators (vs. Last Quarter)<br />
$7.5<br />
$6.0 $6.1<br />
$6.1<br />
$9.0<br />
$10.2<br />
Transaction Level (Past 12 Months)<br />
Inventory Level<br />
Average Asking Price<br />
Average Days on Market<br />
For Sale vs. Sold<br />
4<br />
Sold<br />
6<br />
10<br />
For Sale<br />
1 4<br />
3 1 4<br />
2<br />
1 3<br />
1<br />
7<br />
1 3<br />
5<br />
2 3 2<br />
2<br />
1<br />
3<br />
33 35 33 24 21 24 23 21 20 17 16 14 12 10 8 4 3 4 7 6 5 7 8 9 10<br />
Oct Dec Feb Apr Jun Aug Oct Dec Feb Apr Jun Aug Oct<br />
2020 2021 <strong>2022</strong><br />
$4.8<br />
PERFORMANCE<br />
Max Range<br />
Max Speed<br />
Typ. Passengers<br />
SUPPLY<br />
No. for Sale<br />
Avg Asking Price<br />
Avg Days on on Market<br />
TRANSACTION<br />
Past 12 Months<br />
Past 3 Months<br />
3,010N.M. / 5,574 km<br />
Mach 0.80<br />
9<br />
Oct<br />
Jul<br />
10 (2.2%) 7 (1.6%)<br />
10.2M USD 6.9M USD<br />
82<br />
48<br />
Oct<br />
28<br />
4<br />
Jul<br />
24<br />
10<br />
Source: AMSTAT & ASG<br />
THIRD QUARTER <strong>2022</strong> — GLOBAL SKY QUARTERLY | 69
MARKET SUMMARY: BUSINESS JETS<br />
FALCON 900DX/EX/EX EASY/LX<br />
PERFORMANCE<br />
Max Range<br />
Max Speed<br />
Typ. Passengers<br />
F900DX<br />
4,100 N.M. / 7,593 km<br />
Mach 0.83<br />
12<br />
F900EX<br />
4,500 N.M. / 8,334 km<br />
Mach 0.83<br />
12<br />
F900EX EASy<br />
4,500 N.M. / 8,334 km<br />
Mach 0.83<br />
12<br />
F900LX<br />
4,750 N.M. / 8,800 km<br />
Mach 0.83<br />
12<br />
SUPPLY<br />
No. for Sale<br />
Avg Asking Price<br />
Avg Days on Market<br />
Oct<br />
0 (0.0%)<br />
0.0M USD<br />
0<br />
Jul<br />
0 (0.0%)<br />
0.0M USD<br />
0<br />
Oct<br />
4 (3.4%)<br />
12.5M USD<br />
86<br />
Jul<br />
2 (1.7%)<br />
13.8M USD<br />
111<br />
Oct<br />
4 (3.4%)<br />
15.9M USD<br />
53<br />
Jul<br />
2 (1.7%)<br />
22.0M USD<br />
51<br />
Oct<br />
0 (0.0%)<br />
0.0M USD<br />
0<br />
Jul<br />
0 (0.0%)<br />
0.0M USD<br />
0<br />
TRANSACTION<br />
Past 12 Months<br />
Past 3 Months<br />
Oct<br />
1<br />
0<br />
Jul<br />
1<br />
0<br />
Oct<br />
10<br />
0<br />
Jul<br />
10<br />
3<br />
Oct<br />
12<br />
3<br />
Jul<br />
9<br />
5<br />
Oct<br />
5<br />
0<br />
Jul<br />
5<br />
2<br />
Average Asking Price (Million USD)<br />
F900EX EASy<br />
F900DX<br />
F900LX<br />
Average<br />
F900EX<br />
$22.0<br />
$19.5<br />
$18.5<br />
$17.5<br />
$19.4 $19.4<br />
$14.9 $14.9<br />
$15.9<br />
$13.1<br />
$12.3 $13.7<br />
$12.3<br />
$10.9<br />
$10.5<br />
$10.3 $10.5<br />
$13.2 $12.5<br />
$8.0 $7.5 $7.8<br />
For Sale vs. Sold<br />
Sold For Sale<br />
2 7<br />
3<br />
1<br />
2 3 5<br />
2<br />
4<br />
1 1<br />
4 4<br />
2<br />
1<br />
3<br />
4<br />
6<br />
3<br />
1 1<br />
2<br />
25 21 20 23 18 18 20 19 20 18 13 15 18 16 15 11 5 4 4 6 6 4 6 7 8<br />
Oct Dec Feb Apr Jun Aug Oct Dec Feb Apr Jun Aug Oct<br />
2020 2021 <strong>2022</strong><br />
Market Indicators (vs. Last Quarter)<br />
F900DX<br />
Transaction Level (Past 12 Months)<br />
Inventory Level<br />
Average Asking Price<br />
Average Days on Market<br />
F900EX<br />
Transaction Level (Past 12 Months)<br />
Inventory Level<br />
Average Asking Price<br />
Average Days on Market<br />
F900EX EASy<br />
Transaction Level (Past 12 Months)<br />
Inventory Level<br />
Average Asking Price<br />
Average Days on Market<br />
F900LX<br />
Transaction Level (Past 12 Months)<br />
Inventory Level<br />
Average Asking Price<br />
Average Days on Market<br />
Source: AMSTAT & ASG<br />
70 | GLOBAL SKY QUARTERLY — THIRD QUARTER <strong>2022</strong>
MARKET SUMMARY: BUSINESS JETS<br />
FALCON 2000LX/LXS/S<br />
PERFORMANCE<br />
Max Range<br />
Max Speed<br />
Typ. Passengers<br />
F2000LX<br />
4,000 N.M. / 7,408 km<br />
Mach 0.83<br />
10<br />
F2000LXS<br />
4,000 N.M. / 7,408 km<br />
Mach 0.83<br />
10<br />
F2000S<br />
3,350 N.M. / 6,208 km<br />
Mach 0.83<br />
10<br />
SUPPLY<br />
No. for Sale<br />
Avg Asking Price<br />
Avg Days on Market<br />
Oct<br />
2 (1.5%)<br />
11.9M USD<br />
62<br />
Jul<br />
3 (2.2%)<br />
17.5M USD<br />
52<br />
Oct<br />
2 (1.6%)<br />
22.3M USD<br />
92<br />
Jul<br />
1 (0.8%)<br />
23.9M USD<br />
18<br />
Oct<br />
0 (0.0%)<br />
0.0M USD<br />
0<br />
Jul<br />
0 (0.0%)<br />
0.0M USD<br />
0<br />
TRANSACTION<br />
Past 12 Months<br />
Past 3 Months<br />
Oct<br />
7<br />
0<br />
Jul<br />
7<br />
4<br />
Oct<br />
11<br />
1<br />
Jul<br />
10<br />
3<br />
Oct<br />
2<br />
1<br />
Jul<br />
1<br />
0<br />
Average Asking Price (Million USD)<br />
$27.7 $27.7<br />
$19.9 $19.6 $20.3<br />
$11.3<br />
For Sale vs. Sold<br />
3<br />
Sold<br />
For Sale<br />
$9.1 $9.1<br />
$20.0<br />
$11.7<br />
F2000S<br />
F2000LXS<br />
$23.9<br />
F2000LX<br />
Average<br />
$23.9<br />
$17.1 $17.5 $17.5<br />
$22.3<br />
$11.9<br />
3<br />
3<br />
4<br />
2<br />
4<br />
3<br />
1<br />
6<br />
1<br />
4<br />
4<br />
1<br />
1<br />
1<br />
2<br />
2 1 1<br />
1 1<br />
20 16 15 13 8 13 11 10 10 6 4 4 4 5 4 2 1 2 2 4 5 4 4 4 4<br />
Oct Dec Feb Apr Jun Aug Oct Dec Feb Apr Jun Aug Oct<br />
2020 2021 <strong>2022</strong><br />
Market Indicators (vs. Last Quarter)<br />
F2000LX<br />
Transaction Level (Past 12 Months)<br />
Inventory Level<br />
Average Asking Price<br />
Average Days on Market<br />
F2000LXS<br />
Transaction Level (Past 12 Months)<br />
Inventory Level<br />
Average Asking Price<br />
Average Days on Market<br />
F2000S<br />
Transaction Level (Past 12 Months)<br />
Inventory Level<br />
Average Asking Price<br />
Average Days on Market<br />
Source: AMSTAT & ASG<br />
THIRD QUARTER <strong>2022</strong> — GLOBAL SKY QUARTERLY | 71
MARKET SUMMARY: BUSINESS JETS<br />
FALCON 7X<br />
Average Asking Price (Million USD)<br />
Market Indicators (vs. Last Quarter)<br />
$21.2<br />
$21.8<br />
$22.4<br />
$23.5 $23.5<br />
Transaction Level (Past 12 Months)<br />
Inventory Level<br />
Average Asking Price<br />
For Sale vs. Sold<br />
$19.5<br />
$20.3<br />
Average Days on Market<br />
PERFORMANCE<br />
Max Range<br />
Max Speed<br />
Typ. Passengers<br />
5,950 N.M. / 11,018 km<br />
Mach 0.90<br />
12<br />
Sold For Sale<br />
6<br />
5<br />
3<br />
1<br />
1 1<br />
4<br />
1<br />
5<br />
1 1<br />
4<br />
3<br />
1 1<br />
3 5<br />
1 3 1<br />
3<br />
2<br />
20 24 19 13 15 17 18 17 19 15 14 14 9 6 5 3 1 1 4 6 10 14 12 12 12<br />
Oct Dec Feb Apr Jun Aug Oct Dec Feb Apr Jun Aug Oct<br />
2020 2021 <strong>2022</strong><br />
SUPPLY<br />
No. for Sale<br />
Avg Asking Price<br />
Avg Days on Market<br />
TRANSACTION<br />
Past 12 Months<br />
Past 3 Months<br />
Oct<br />
12 (4.0%)<br />
20.3M USD<br />
103<br />
Oct<br />
32<br />
7<br />
Jul<br />
14 (4.7%)<br />
23.5M USD<br />
57<br />
Jul<br />
25<br />
12<br />
Source: AMSTAT & ASG<br />
FEATURED AIRCRAFT<br />
EMBRAER - PHENOM 300 50500159<br />
TOTAL HOURS: 2,147 SINCE NEW<br />
TOTAL CYCLES: 2,433 SINCE NEW<br />
• Medivac Configuration retrofit by Spectrum Aeromed Single Patient System<br />
• Aircraft Enrolled on Embraer Executive Care Standard (EEC Enhanced)<br />
72 | GLOBAL SKY QUARTERLY — THIRD QUARTER <strong>2022</strong>
MARKET SUMMARY: BUSINESS JETS<br />
PHENOM 300<br />
Average Asking Price (Million USD)<br />
Market Indicators (vs. Last Quarter)<br />
Transaction Level (Past 12 Months)<br />
$6.6<br />
$6.8<br />
$7.0<br />
$6.0<br />
$7.2<br />
$7.5<br />
Inventory Level<br />
Average Asking Price<br />
Average Days on Market<br />
For Sale vs. Sold<br />
Sold For Sale<br />
2 4<br />
4<br />
1<br />
4 6<br />
6<br />
$4.7<br />
3<br />
5<br />
1<br />
4 5<br />
4<br />
4<br />
4<br />
2<br />
3 1<br />
2 2<br />
2 2 1<br />
42 41 38 36 31 28 30 25 24 23 15 15 8 7 7 3 2 5 6 8 9 7 10 12 12<br />
Oct Dec Feb Apr Jun Aug Oct Dec Feb Apr Jun Aug Oct<br />
2020 2021 <strong>2022</strong><br />
PERFORMANCE<br />
Max Range<br />
Max Speed<br />
Typ. Passengers<br />
SUPPLY<br />
No. for Sale<br />
Avg Asking Price<br />
Avg Days on Market<br />
TRANSACTION<br />
Past 12 Months<br />
Past 3 Months<br />
1,242 N.M. / 2,300 km<br />
Mach 0.78<br />
5<br />
Oct<br />
12 (1.8%)<br />
4.7M USD<br />
172<br />
Oct<br />
23<br />
8<br />
Jul<br />
7 (1.1%)<br />
8.9M USD<br />
265<br />
Jul<br />
15<br />
7<br />
LEGACY 600/650<br />
Average Asking Price (Million USD)<br />
$13.1 $13.0<br />
$7.0 $7.2<br />
For Sale vs. Sold<br />
5<br />
Sold<br />
2<br />
For Sale<br />
5<br />
1 1<br />
3<br />
1<br />
$11.0<br />
5<br />
$7.7<br />
1<br />
1<br />
2<br />
$13.5<br />
$7.4<br />
$13.5<br />
$8.6<br />
L650<br />
L600<br />
Average<br />
$13.3 $13.3<br />
17 17 16 18 17 18 15 15 15 11 12 10 10 9 8 4 4 4 4 7 10 11 11 12 11<br />
Oct Dec Feb Apr Jun Aug Oct Dec Feb Apr Jun Aug Oct<br />
2020 2021 <strong>2022</strong><br />
1<br />
5<br />
2<br />
2<br />
3<br />
2<br />
$9.0<br />
3<br />
3<br />
1 1 1<br />
$9.8<br />
Market Indicators (vs. Last Quarter)<br />
L600<br />
Transaction Level (Past 12 Months)<br />
Inventory Level<br />
Average Asking Price<br />
Average Days on Market<br />
PERFORMANCE<br />
Max Range<br />
Max Speed<br />
Typ. Passengers<br />
SUPPLY<br />
No. for Sale<br />
Avg Asking Price<br />
Avg Days on Market<br />
TRANSACTION<br />
Past 12 Months<br />
Past 3 Months<br />
L600<br />
3,400 N.M.<br />
6,297 km<br />
Mach 0.80<br />
13<br />
Oct | Jul<br />
5 | 5<br />
9.8M USD<br />
8.5M USD<br />
96 | 63<br />
Oct | Jul<br />
14 | 11<br />
3 | 6<br />
L650<br />
L650<br />
3,640 N.M.<br />
7,112 km<br />
Mach 0.80<br />
13<br />
Oct | Jul<br />
6 | 6<br />
13.3M USD<br />
13.3M USD<br />
294 | 202<br />
Oct | Jul<br />
9 | 9<br />
0 | 5<br />
Source: AMSTAT & ASG<br />
THIRD QUARTER <strong>2022</strong> — GLOBAL SKY QUARTERLY | 73
MARKET SUMMARY: BUSINESS JETS<br />
LINEAGE 1000/E<br />
Average Asking Price (Million USD)<br />
Market Indicators (vs. Last Quarter)<br />
$17.7<br />
$14.9<br />
$14.9<br />
$16.0<br />
Transaction Level (Past 12 Months)<br />
Inventory Level<br />
Average Asking Price<br />
$7.5<br />
$7.5<br />
Average Days on Market<br />
PERFORMANCE<br />
For Sale vs. Sold<br />
Max Range<br />
Max Speed<br />
Typ. Passengers<br />
4,400 N.M. / 8,149 km<br />
Mach 0.82<br />
19<br />
Sold<br />
For Sale<br />
1<br />
SUPPLY<br />
No. for Sale<br />
Avg Asking Price<br />
Avg Days on Market<br />
Oct<br />
0 (0.0%)<br />
0.0M USD<br />
0<br />
Jul<br />
0 (0.0%)<br />
0.0M USD<br />
0<br />
4 4 4 4 4 3 4 4 4 2 2 2 2 2 2 2 2 2 2 1<br />
Oct Dec Feb Apr Jun Aug Oct Dec Feb Apr Jun Aug Oct<br />
2020 2021 <strong>2022</strong><br />
TRANSACTION<br />
Past 12 Months<br />
Past 3 Months<br />
Oct<br />
0<br />
0<br />
Jul<br />
0<br />
0<br />
Source: AMSTAT & ASG<br />
FEATURED AIRCRAFT<br />
GULFSTREAM - G280 SN2073<br />
TOTAL HOURS: 551 SINCE NEW<br />
TOTAL CYCLES: 288 SINCE NEW<br />
• Meticulously Maintained<br />
• One Owner Since New<br />
• Always Hangered<br />
• Low Hours<br />
• Honeywell MSP Gold (Engines & APU)<br />
• Honeywell MSP (for Avionics & Mechanical Components)<br />
• Collins Avionics Service Program<br />
• ADS-B Out & CPDLC<br />
74 | GLOBAL SKY QUARTERLY — THIRD QUARTER <strong>2022</strong>
MARKET SUMMARY: BUSINESS JETS<br />
G200<br />
Average Asking Price (Million USD)<br />
Market Indicators (vs. Last Quarter)<br />
Transaction Level (Past 12 Months)<br />
$3.7<br />
$3.8<br />
$3.7<br />
$3.2<br />
$4.7<br />
$3.7<br />
$5.8<br />
Inventory Level<br />
Average Asking Price<br />
Average Days on Market<br />
For Sale vs. Sold<br />
Sold For Sale<br />
4 4<br />
3<br />
1 1<br />
4<br />
3<br />
2 2 2<br />
1<br />
6<br />
4<br />
4<br />
3 7<br />
2<br />
1<br />
1<br />
5<br />
1 1 4<br />
20 21 18 19 19 19 18 19 19 22 19 18 12 10 7 7 8 9 6 5 11 11 12 12 12<br />
Oct Dec Feb Apr Jun Aug Oct Dec Feb Apr Jun Aug Oct<br />
2020 2021 <strong>2022</strong><br />
PERFORMANCE<br />
Max Range<br />
Max Speed<br />
Typ. Passengers<br />
SUPPLY<br />
No. for Sale<br />
Avg Asking Price<br />
Avg Days on Market<br />
TRANSACTION<br />
Past 12 Months<br />
Past 3 Months<br />
3,050 N.M. / 5,651 km<br />
Mach 0.81<br />
8<br />
Oct<br />
12 (5.0%)<br />
5.8M USD<br />
77<br />
Oct<br />
35<br />
11<br />
Jul<br />
11 (4.6%)<br />
3.7M USD<br />
122<br />
Jul<br />
24<br />
12<br />
G280<br />
Average Asking Price (Million USD)<br />
Market Indicators (vs. Last Quarter)<br />
$17.7<br />
$18.5<br />
$18.5<br />
$21.3<br />
Transaction Level (Past 12 Months)<br />
Inventory Level<br />
$14.5<br />
$11.8<br />
$11.2<br />
Average Asking Price<br />
Average Days on Market<br />
For Sale vs. Sold<br />
Sold<br />
5<br />
For Sale<br />
1<br />
3<br />
1<br />
2 3 3<br />
1<br />
5<br />
2<br />
1<br />
2<br />
1<br />
3<br />
4 1 1 1 1<br />
15 15 16 10 13 12 12 9 8 10 10 9 8 7 6 5 5 2<br />
1 2 2 3 4<br />
Oct Dec Feb Apr Jun Aug Oct Dec Feb Apr Jun Aug Oct<br />
2020 2021 <strong>2022</strong><br />
PERFORMANCE<br />
Max Range<br />
Max Speed<br />
Typ. Passengers<br />
SUPPLY<br />
No. for Sale<br />
Avg Asking Price<br />
Avg Days on Market<br />
TRANSACTION<br />
Past 12 Months<br />
Past 3 Months<br />
3,600 N.M. / 6,667 km<br />
Mach 0.84<br />
8<br />
Oct<br />
Jul<br />
4 (1.7%) 2 (0.9%)<br />
21.3M USD 18.5M USD<br />
56<br />
28<br />
Oct<br />
20<br />
2<br />
Jul<br />
18<br />
9<br />
Source: AMSTAT & ASG<br />
THIRD QUARTER <strong>2022</strong> — GLOBAL SKY QUARTERLY | 75
MARKET SUMMARY: BUSINESS JETS<br />
G450<br />
Average Asking Price (Million USD)<br />
Market Indicators (vs. Last Quarter)<br />
$19.0<br />
Transaction Level (Past 12 Months)<br />
$16.6<br />
Inventory Level<br />
$14.0<br />
$13.3<br />
$13.2<br />
Average Asking Price<br />
Average Days on Market<br />
$12.5<br />
$13.0<br />
For Sale vs. Sold<br />
Sold For Sale<br />
3<br />
3<br />
7 3 4 5<br />
4<br />
5<br />
2 3<br />
2 2 1 5 8<br />
8<br />
2<br />
2<br />
3 1 1<br />
1 2<br />
1<br />
30 27 27 32 32 34 31 25 25 24 18 19 19 15 11 6 6 6 9 10 11 12 12 9 11<br />
Oct Dec Feb Apr Jun Aug Oct Dec Feb Apr Jun Aug Oct<br />
2020 2021 <strong>2022</strong><br />
PERFORMANCE<br />
Max Range<br />
Max Speed<br />
Typ. Passengers<br />
SUPPLY<br />
No. for Sale<br />
Avg Asking Price<br />
Avg Days on Market<br />
TRANSACTION<br />
Past 12 Months<br />
Past 3 Months<br />
4,350 N.M. / 8,056 km<br />
Mach 0.85<br />
13<br />
Oct<br />
11 (3.1%)<br />
16.6M USD<br />
128<br />
Oct<br />
34<br />
3<br />
Jul<br />
12 (3.4%)<br />
16.0M USD<br />
122<br />
Jul<br />
31<br />
13<br />
G550<br />
Average Asking Price (Million USD)<br />
Market Indicators (vs. Last Quarter)<br />
$28.8<br />
Transaction Level (Past 12 Months)<br />
$16.9<br />
$16.3<br />
$18.7<br />
$20.8<br />
$24.2<br />
$25.0<br />
Inventory Level<br />
Average Asking Price<br />
Average Days on Market<br />
For Sale vs. Sold<br />
Sold For Sale<br />
4<br />
5<br />
6<br />
5 6<br />
13<br />
8<br />
20<br />
7<br />
3<br />
3<br />
2<br />
1<br />
7<br />
3<br />
3<br />
5 4<br />
6<br />
1<br />
5 2 5<br />
1<br />
1<br />
46 43 32 26 28 30 43 47 42 31 30 30 20 24 23 8 8 7 5 8 10 14 16 20 24<br />
Oct Dec Feb Apr Jun Aug Oct Dec Feb Apr Jun Aug Oct<br />
2020 2021 <strong>2022</strong><br />
PERFORMANCE<br />
Max Range<br />
Max Speed<br />
Typ. Passengers<br />
SUPPLY<br />
No. for Sale<br />
Avg Asking Price<br />
Avg Days on Market<br />
TRANSACTION<br />
Past 12 Months<br />
Past 3 Months<br />
6,750 N.M. / 12,501 km<br />
Mach 0.87<br />
18<br />
Oct<br />
24 (3.9%)<br />
25.0M USD<br />
84<br />
Oct<br />
56<br />
8<br />
Jul<br />
14 (2.3%)<br />
25.0M USD<br />
73<br />
Jul<br />
48<br />
13<br />
Source: AMSTAT & ASG<br />
76 | GLOBAL SKY QUARTERLY — THIRD QUARTER <strong>2022</strong>
MARKET SUMMARY: BUSINESS JETS<br />
G650 & G650 ER<br />
Average Asking Price (Million USD)<br />
Market Indicators (vs. Last Quarter)<br />
$41.7<br />
G650ER<br />
G650<br />
Average<br />
$37.8<br />
$43.0<br />
$47.5<br />
$52.7<br />
$49.0 $49.0<br />
$49.2<br />
$48.2<br />
$48.1<br />
G650<br />
Transaction Level (Past 12 Months)<br />
Inventory Level<br />
Average Asking Price<br />
Average Days on Market<br />
G650ER<br />
$36.8<br />
Sold<br />
6<br />
16<br />
For Sale<br />
$30.2<br />
For Sale vs. Sold<br />
$37.5<br />
$39.2<br />
5<br />
2 1<br />
5<br />
1<br />
1<br />
3 2<br />
3<br />
5<br />
2 3 5<br />
1<br />
1 2<br />
2 1<br />
1<br />
1<br />
24 21 14 13 12 12 12 12 15 16 15 13 10 5 7 9 9 11 13 12 9 10 11 13 16<br />
Oct Dec Feb Apr Jun Aug Oct Dec Feb Apr Jun Aug Oct<br />
2020 2021 <strong>2022</strong><br />
ASIAN SKY CONSULTING<br />
Independent Business and General Aviation Consulting Services<br />
01<br />
02<br />
03<br />
04<br />
PERFORMANCE<br />
Max Range<br />
Max Speed<br />
Typ. Passengers<br />
SUPPLY<br />
No. for Sale<br />
Avg Asking Price<br />
Avg Days on Market<br />
TRANSACTION<br />
Past 12 Months<br />
Past 3 Months<br />
G650<br />
7,000 N.M.<br />
12,964 km<br />
Mach 0.90<br />
18<br />
Oct | Jul<br />
8 | 4<br />
48.1M USD<br />
49.0M USD<br />
111 | 94<br />
Oct | Jul<br />
8 | 6<br />
2 | 3<br />
TRANSACTIONAL ADVISORY<br />
Manage the engagement, drafting, review and<br />
negotiation of any aviation transactional<br />
documents, liaise, control and lead the transaction<br />
process to ensure the best terms and successful<br />
results are achieved.<br />
OPERATION ADVISORY<br />
Perform operational analysis, management selection<br />
and due diligence, recommend operational and<br />
aircraft ownership structure advisory.<br />
MARKET RESEARCH & STUDIES<br />
Perform aviation market research, appraisals,<br />
feasibility studies and aviation business planning.<br />
G650ER<br />
7,500 N.M.<br />
13,890 km<br />
Mach 0.90<br />
18<br />
Oct | Jul<br />
8 | 6<br />
48.2M USD<br />
43.5M USD<br />
102 | 72<br />
Oct | Jul<br />
16 | 15<br />
1 | 8<br />
Source: AMSTAT & ASG<br />
COMPLETION MANAGEMENT<br />
Generate corporate airliner cabin definition, select the<br />
most suitable completion facility, handle green aircraft<br />
delivery, carry out completion oversight and conduct<br />
aircraft final delivery & compliance inspections.<br />
Please contact our sales team for more information<br />
Email: sales@asianskygroup.com<br />
Website: www.asianskygroup.com<br />
THIRD QUARTER <strong>2022</strong> — GLOBAL SKY QUARTERLY | 77
MARKET<br />
SUMMARY<br />
CIVIL HELICOPTERS<br />
<strong>2022</strong> <strong>Q3</strong><br />
78 | GLOBAL SKY QUARTERLY — THIRD QUARTER <strong>2022</strong>
MARKET SUMMARY: CIVIL HELICOPTERS<br />
MARKET SUMMARY PER MODEL<br />
INVENTORY LEVEL, PRICE TREND & TRANSACTIONS<br />
H125<br />
Average Asking Price (Million USD)<br />
$2.4<br />
$2.5<br />
$2.2<br />
$2.3<br />
$2.5<br />
$2.6<br />
$2.8<br />
Market Indicators (vs. Last Quarter)<br />
Transaction Level (Past 12 Months)<br />
Inventory Level<br />
Average Asking Price<br />
Average Days on Market<br />
For Sale vs. Sold<br />
Sold<br />
3<br />
26 26<br />
27<br />
For Sale<br />
2<br />
1<br />
3 6<br />
31 36 38<br />
5<br />
4<br />
1<br />
1<br />
1<br />
5<br />
2<br />
4 3 3<br />
25 24 24 15 14 15 15 19 18 19 20 19 17 14 13<br />
1<br />
8<br />
7<br />
1<br />
5<br />
2<br />
13 13 13<br />
Oct Dec Feb Apr Jun Aug Oct Dec Feb Apr Jun Aug Oct<br />
2020 2021 <strong>2022</strong><br />
17<br />
PERFORMANCE<br />
Max Range<br />
Max Speed<br />
Typ. Passengers<br />
SUPPLY<br />
No. for Sale<br />
Avg Asking Price<br />
Avg Days on Market<br />
TRANSACTION<br />
Past 12 Months<br />
Past 3 Months<br />
340 N.M. / 630 km<br />
140 Knots<br />
6<br />
Oct<br />
17 (1.6%)<br />
2.8M USD<br />
252<br />
Oct<br />
36<br />
2<br />
Jul<br />
13 (1.2%)<br />
2.6M USD<br />
272<br />
Jul<br />
34<br />
21<br />
H130<br />
Average Asking Price (Million USD)<br />
Market Indicators (vs. Last Quarter)<br />
$3.6<br />
Transaction Level (Past 12 Months)<br />
$2.7<br />
$2.7<br />
$2.9<br />
$2.5<br />
$2.0<br />
$2.8<br />
Inventory Level<br />
Average Asking Price<br />
Average Days on Market<br />
For Sale vs. Sold<br />
2<br />
Sold<br />
3<br />
For Sale<br />
2<br />
1<br />
1<br />
2<br />
2<br />
5<br />
1<br />
2<br />
5<br />
16 15 15 12 10 9 8 7 5 5 5 5 5 5 4 4 4 7 6 5 6 6 7 7 7<br />
Oct Dec Feb Apr Jun Aug Oct Dec Feb Apr Jun Aug Oct<br />
2020 2021 <strong>2022</strong><br />
2<br />
1<br />
3 3<br />
3<br />
4<br />
PERFORMANCE<br />
Max Range<br />
Max Speed<br />
Typ. Passengers<br />
SUPPLY<br />
No. for Sale<br />
Avg Asking Price<br />
Avg Days on Market<br />
TRANSACTION<br />
Past 12 Months<br />
Past 3 Months<br />
333 N.M. / 606km<br />
128 Knots<br />
7<br />
Oct<br />
7 (2.0%)<br />
3.6M USD<br />
73<br />
Oct<br />
16<br />
7<br />
Jul<br />
6 (1.8%)<br />
2.8M USD<br />
240<br />
Jul<br />
9<br />
6<br />
Source: AMSTAT & ASG<br />
THIRD QUARTER <strong>2022</strong> — GLOBAL SKY QUARTERLY | 79
MARKET SUMMARY: CIVIL HELICOPTERS<br />
EC135P2 & T2<br />
Average Asking Price (Million USD)<br />
EC135T2<br />
EC135P2<br />
Average<br />
$2.9 $2.9<br />
Market Indicators (vs. Last Quarter)<br />
EC135P2 EC135T2<br />
$2.5<br />
$2.3<br />
$2.0<br />
Transaction Level (Past 12 Months)<br />
Inventory Level<br />
Average Asking Price<br />
$1.7<br />
$1.7<br />
Average Days on Market<br />
$1.7<br />
$1.7<br />
For Sale vs. Sold<br />
Sold For Sale<br />
$1.7 $1.7<br />
$1.7<br />
$1.7<br />
$1.6<br />
PERFORMANCE<br />
Max Range<br />
Max Speed<br />
Typ. Passengers<br />
EC135P2<br />
332 N.M.<br />
614 km<br />
127 Knots<br />
6<br />
EC135T2<br />
332 N.M.<br />
614 km<br />
127 Knots<br />
6<br />
1<br />
1<br />
2<br />
1 1 1<br />
1 1 2<br />
1<br />
1<br />
1<br />
SUPPLY<br />
No. for Sale<br />
Avg Asking Price<br />
Avg Days on Market<br />
Oct | Jul<br />
5 | 5<br />
2.9M USD<br />
2.9M USD<br />
467 | 375<br />
Oct | Jul<br />
1 | 2<br />
1.6M USD<br />
1.7M USD<br />
389 | 257<br />
7 7 7 10 9 9 8 8 8 5 5 5 8 8 9 9 10 10 10 9 9 7 6 6 6<br />
Oct Dec Feb Apr Jun Aug Oct Dec Feb Apr Jun Aug Oct<br />
2020 2021 <strong>2022</strong><br />
TRANSACTION<br />
Past 12 Months<br />
Past 3 Months<br />
Oct | Jul<br />
3 | 3<br />
0 | 2<br />
Oct | Jul<br />
4 | 3<br />
1 | 3<br />
EC145<br />
Average Asking Price (Million USD)<br />
Market Indicators (vs. Last Quarter)<br />
$3.7<br />
$3.7<br />
Transaction Level (Past 12 Months)<br />
$2.9<br />
$3.0<br />
$2.8<br />
Inventory Level<br />
Average Asking Price<br />
Average Days on Market<br />
For Sale vs. Sold<br />
Sold<br />
For Sale<br />
$2.4<br />
$2.2<br />
PERFORMANCE<br />
Max Range<br />
Max Speed<br />
Typ. Passengers<br />
461 N.M. / 855 km<br />
131 Knots<br />
9<br />
1<br />
2<br />
2<br />
1<br />
1<br />
2<br />
1<br />
2<br />
1<br />
2<br />
2<br />
1 1<br />
SUPPLY<br />
No. for Sale<br />
Avg Asking Price<br />
Avg Days on Market<br />
Oct<br />
10 (1.4%)<br />
2.2M USD<br />
426<br />
Jul<br />
10 (1.4%)<br />
2.4M USD<br />
334<br />
9 7 7 7 6 7 7 8 8 7 5 5 5 9 9 10 10 9 9 10 10 10 10 10 10<br />
Oct Dec Feb Apr Jun Aug Oct Dec Feb Apr Jun Aug Oct<br />
2020 2021 <strong>2022</strong><br />
TRANSACTION<br />
Past 12 Months<br />
Past 3 Months<br />
Oct<br />
7<br />
2<br />
Jul<br />
5<br />
0<br />
Source: AMSTAT & ASG<br />
80 | GLOBAL SKY QUARTERLY — THIRD QUARTER <strong>2022</strong>
MARKET SUMMARY: CIVIL HELICOPTERS<br />
H155 & EC155B<br />
Average Asking Price (Million USD)<br />
EC155B<br />
H155<br />
Average<br />
$3.9<br />
$3.5<br />
$3.4<br />
$3.7<br />
$3.6<br />
$3.6<br />
$2.6<br />
$2.6<br />
$2.6<br />
$2.4<br />
$4.0<br />
$2.4<br />
Market Indicators (vs. Last Quarter)<br />
H155 EC155B<br />
Transaction Level (Past 12 Months)<br />
Inventory Level<br />
Average Asking Price<br />
Average Days on Market<br />
For Sale vs. Sold<br />
Sold For Sale<br />
PERFORMANCE<br />
Max Range<br />
Max Speed<br />
Typ. Passengers<br />
H155<br />
516 N.M.<br />
955 km<br />
150 Knots<br />
13<br />
EC155B<br />
516 N.M.<br />
955 km<br />
135 Knots<br />
13<br />
1<br />
1<br />
2<br />
1<br />
3<br />
3<br />
3<br />
1<br />
SUPPLY<br />
No. for Sale<br />
Avg Asking Price<br />
Avg Days on Market<br />
Oct | Jul<br />
9 | 10<br />
4.0M USD<br />
4.0M USD<br />
998 | 818<br />
Oct | Jul<br />
3 | 1<br />
2.4M USD<br />
2.4M USD<br />
106 | 106<br />
15 12 11 11 10 10 10 12 11 12 13 12 10 8 8 9 10 10 9 8 10 11 10 12 12<br />
Oct Dec Feb Apr Jun Aug Oct Dec Feb Apr Jun Aug Oct<br />
2020 2021 <strong>2022</strong><br />
TRANSACTION<br />
Past 12 Months<br />
Past 3 Months<br />
Oct | Jul<br />
7 | 7<br />
0 | 1<br />
Oct | Jul<br />
0 | 0<br />
0 | 0<br />
H225<br />
Average Asking Price (Million USD)<br />
Market Indicators (vs. Last Quarter)<br />
$9.0<br />
Transaction Level (Past 12 Months)<br />
Inventory Level<br />
$5.5<br />
$5.0<br />
Average Asking Price<br />
Average Days on Market<br />
For Sale vs. Sold<br />
Sold<br />
For Sale<br />
$3.9<br />
$3.9 $3.8 $3.8<br />
PERFORMANCE<br />
Max Range<br />
Max Speed<br />
Typ. Passengers<br />
452 N.M. / 837 km<br />
142 Knots<br />
19<br />
10<br />
1 2 2<br />
1<br />
1<br />
1<br />
3<br />
2<br />
SUPPLY<br />
No. for Sale<br />
Avg Asking Price<br />
Avg Days onMarket<br />
Oct<br />
7 (4.0%)<br />
3.8M USD<br />
695<br />
Jul<br />
8 (4.5%)<br />
3.8M USD<br />
563<br />
9 11 11 11 11 11 12 12 12 11 11 11 11 11 11 11 13 10 9 8 8 8 8 8 7<br />
Oct Dec Feb Apr Jun Aug Oct Dec Feb Apr Jun Aug Oct<br />
TRANSACTION<br />
Past 12 Months<br />
Past 3 Months<br />
Oct<br />
8<br />
2<br />
Jul<br />
6<br />
4<br />
2020 2021 <strong>2022</strong><br />
Source: AMSTAT & ASG<br />
THIRD QUARTER <strong>2022</strong> — GLOBAL SKY QUARTERLY | 81
MARKET SUMMARY: CIVIL HELICOPTERS<br />
BELL 206 JETRANGER / LONGRANGER<br />
Average Asking Price (Million USD)<br />
$0.8<br />
$0.8<br />
$0.8<br />
$0.9<br />
$0.9<br />
Bell 206 LongRanger<br />
Bell 206 JetRanger<br />
Average<br />
$0.9<br />
$0.9<br />
Market Indicators (vs. Last Quarter)<br />
Bell 206J Bell 206L<br />
Transaction Level (Past 12 Months)<br />
Inventory Level<br />
Average Asking Price<br />
$0.5<br />
$0.5<br />
For Sale vs. Sold<br />
Sold For Sale<br />
$0.5<br />
$0.5<br />
$0.6<br />
$0.7<br />
$0.6<br />
Average Days on Market<br />
PERFORMANCE<br />
Max Range<br />
Max Speed<br />
Typ. Passengers<br />
Bell 206J<br />
374 N.M.<br />
693 km<br />
121 Knots<br />
4<br />
Bell 206L<br />
270 N.M.<br />
500 km<br />
105 Knots<br />
6<br />
3 8<br />
3<br />
7 8 11 15 14<br />
14<br />
8<br />
4<br />
5<br />
6<br />
10 11<br />
2<br />
14<br />
6<br />
9 16<br />
10 8 10 11<br />
4<br />
SUPPLY<br />
No. for Sale<br />
Avg Asking Price<br />
Avg Days on Market<br />
Oct | Jul<br />
63 | 67<br />
0.6M USD<br />
0.6M USD<br />
742 | 794<br />
Oct | Jul<br />
45 | 39<br />
0.9M USD<br />
0.9M USD<br />
399 | 413<br />
221 222 215 197 205 195 197 197 184 175 169 162 161 154 143 140 138 118 110 104 99 106 108 112 108<br />
Oct Dec Feb Apr Jun Aug Oct Dec Feb Apr Jun Aug Oct<br />
TRANSACTION<br />
Past 12 Months<br />
Past 3 Months<br />
Oct | Jul<br />
110 | 85<br />
25 | 42<br />
Oct | Jul<br />
1 | 1<br />
0 | 1<br />
2020 2021 <strong>2022</strong><br />
BELL 407<br />
Average Asking Price (Million USD)<br />
Market Indicators (vs. Last Quarter)<br />
$2.4<br />
$2.2<br />
$2.2<br />
$2.1<br />
$2.3<br />
$2.5<br />
$2.5<br />
Transaction Level (Past 12 Months)<br />
Inventory Level<br />
Average Asking Price<br />
Average Days on Market<br />
For Sale vs. Sold<br />
Sold For Sale<br />
1<br />
6<br />
6 2 3<br />
8<br />
3<br />
5<br />
4 5<br />
2<br />
7<br />
4 8<br />
5<br />
5<br />
4 6 7 11<br />
6<br />
7 3 1<br />
64 66 68 67 71 68 68 66 64 61 59 53 55 57 50 37 32 28 27 27 24 24 25 31 27<br />
Oct Dec Feb Apr Jun Aug Oct Dec Feb Apr Jun Aug Oct<br />
2020 2021 <strong>2022</strong><br />
PERFORMANCE<br />
Max Range<br />
Max Speed<br />
Typ. Passengers<br />
SUPPLY<br />
No. for Sale<br />
Avg Asking Price<br />
Avg Days on Market<br />
TRANSACTION<br />
Past 12 Months<br />
Past 3 Months<br />
323 N.M. / 598 km<br />
132 Knots<br />
7<br />
Oct<br />
27 (1.6%)<br />
2.5M USD<br />
358<br />
Oct<br />
70<br />
10<br />
Jul<br />
24 (1.4%)<br />
2.5M USD<br />
398<br />
Jul<br />
60<br />
31<br />
Source: AMSTAT & ASG<br />
82 | GLOBAL SKY QUARTERLY — THIRD QUARTER <strong>2022</strong>
MARKET SUMMARY: CIVIL HELICOPTERS<br />
BELL 412EP/412HP<br />
Average Asking Price (Million USD)<br />
Bell 412 HP<br />
Bell 412 EP<br />
Market Indicators (vs. Last Quarter)<br />
Average<br />
Bell 412EP Bell 412HP<br />
Transaction Level (Past 12 Months)<br />
$4.7<br />
$4.7<br />
$5.4<br />
$6.4<br />
$4.9<br />
Inventory Level<br />
Average Asking Price<br />
$3.3<br />
$3.1<br />
Average Days on Market<br />
$2.2<br />
$2.2<br />
For Sale vs. Sold<br />
Sold For Sale<br />
$2.6<br />
$2.6<br />
$2.6 $2.6<br />
$2.6<br />
PERFORMANCE<br />
Max Range<br />
Max Speed<br />
Typ. Passengers<br />
Bell 412EP<br />
356 N.M. /<br />
659 km<br />
140 Knots<br />
9<br />
Bell 412HP<br />
349 N.M. /<br />
646 km<br />
133 Knots<br />
14<br />
1<br />
1<br />
8<br />
1<br />
1<br />
1<br />
3<br />
2<br />
1<br />
2<br />
1<br />
2<br />
1<br />
3<br />
1 1<br />
2<br />
SUPPLY<br />
No. for Sale<br />
Avg Asking Price<br />
Avg Days on Market<br />
Oct | Jul<br />
18 | 20<br />
4.9M USD<br />
6.4M USD<br />
404 | 360<br />
Oct | Jul<br />
1 | 1<br />
2.6M USD<br />
2.6M USD<br />
610 | 518<br />
29 29 30 31 29 29 23 22 21 23 24 24 22 22 21 20 22 23 21 20 21 21 22 20 19<br />
Oct Dec Feb Apr Jun Aug Oct Dec Feb Apr Jun Aug Oct<br />
TRANSACTION<br />
Past 12 Months<br />
Past 3 Months<br />
Oct | Jul<br />
14 | 11<br />
3 | 7<br />
Oct | Jul<br />
0 | 0<br />
0 | 0<br />
2020 2021 <strong>2022</strong><br />
BELL 429<br />
Average Asking Price (Million USD)<br />
Market Indicators (vs. Last Quarter)<br />
$6.2<br />
Transaction Level (Past 12 Months)<br />
Inventory Level<br />
Average Asking Price<br />
$4.2<br />
$3.9 $4.0<br />
$4.0<br />
$4.0<br />
$4.3<br />
Average Days on Market<br />
For Sale vs. Sold<br />
Sold For Sale<br />
1<br />
1<br />
2<br />
3<br />
1<br />
1 1<br />
1 1<br />
2<br />
1<br />
3<br />
1 1<br />
1<br />
2<br />
1<br />
1 2 1<br />
15 14 12 9 8 9 9 8 8 8 6 5 5 5 4 3 3 3 5 6 6 5 4 6 5<br />
Oct Dec Feb Apr Jun Aug Oct Dec Feb Apr Jun Aug Oct<br />
2020 2021 <strong>2022</strong><br />
PERFORMANCE<br />
Max Range<br />
Max Speed<br />
Typ. Passengers<br />
SUPPLY<br />
No. for Sale<br />
Avg Asking Price<br />
Avg Days on Market<br />
TRANSACTION<br />
Past 12 Months<br />
Past 3 Months<br />
368 N.M. / 681 km<br />
130 Knots<br />
7<br />
Oct<br />
5 (1.2%)<br />
6.2M USD<br />
272<br />
Oct<br />
13<br />
3<br />
Jul<br />
5 (1.2%)<br />
4.3M USD<br />
370<br />
Jul<br />
10<br />
4<br />
Source: AMSTAT & ASG<br />
THIRD QUARTER <strong>2022</strong> — GLOBAL SKY QUARTERLY | 83
MARKET SUMMARY: CIVIL HELICOPTERS<br />
AW109SP GRANDNEW<br />
Average Asking Price (Million USD)<br />
Market Indicators (vs. Last Quarter)<br />
$4.7<br />
$4.8<br />
$4.7<br />
$4.5 $4.5<br />
$4.6<br />
Transaction Level (Past 12 Months)<br />
Inventory Level<br />
Average Asking Price<br />
Average Days on Market<br />
For Sale vs. Sold<br />
Sold<br />
For Sale<br />
$3.9<br />
PERFORMANCE<br />
Max Range<br />
Max Speed<br />
Typ. Passengers<br />
480 N.M. / 889 km<br />
130 Knots<br />
7<br />
1<br />
4<br />
2 2<br />
1<br />
1<br />
4<br />
1 4<br />
1<br />
1<br />
22 22 19 15 16 14 13 15 14 10 8 7 7 6 6 10 10 9 7 7 7 10 12 14 14<br />
Oct Dec Feb Apr Jun Aug Oct Dec Feb Apr Jun Aug Oct<br />
2020 2021 <strong>2022</strong><br />
1<br />
SUPPLY<br />
No. for Sale<br />
Avg Asking Price<br />
Avg Days on Market<br />
TRANSACTION<br />
Past 12 Months<br />
Past 3 Months<br />
Oct<br />
14 (6.6%)<br />
3.9M USD<br />
154<br />
Oct<br />
8<br />
1<br />
Jul<br />
10 (4.8%)<br />
3.9M USD<br />
114<br />
Jul<br />
7<br />
5<br />
AW139<br />
Average Asking Price (Million USD)<br />
Market Indicators (vs. Last Quarter)<br />
$6.8<br />
$7.5<br />
Transaction Level (Past 12 Months)<br />
Inventory Level<br />
$5.9<br />
$5.2<br />
$5.9<br />
$5.9<br />
Average Asking Price<br />
Average Days on Market<br />
$5.4<br />
For Sale vs. Sold<br />
Sold For Sale<br />
4 1 1 2<br />
3 4 2<br />
4<br />
3<br />
3<br />
1<br />
2<br />
3<br />
3<br />
4<br />
3<br />
4<br />
3<br />
2<br />
1<br />
28 29 28 31 31 32 30 32 31 29 32 31 33 31 30 27 28 20 17 15 13 13 14 15 17<br />
Oct Dec Feb Apr Jun Aug Oct Dec Feb Apr Jun Aug Oct<br />
2020 2021 <strong>2022</strong><br />
PERFORMANCE<br />
Max Range<br />
Max Speed<br />
Typ. Passengers<br />
SUPPLY<br />
No. for Sale<br />
Avg Asking Price<br />
Avg Days on Market<br />
TRANSACTION<br />
Past 12 Months<br />
Past 3 Months<br />
568 N.M. / 1,052 km<br />
140 Knots<br />
15<br />
Oct<br />
17 (1.6%)<br />
7.5M USD<br />
403<br />
Oct<br />
32<br />
10<br />
Jul<br />
13 (1.2%)<br />
7.5M USD<br />
483<br />
Jul<br />
22<br />
10<br />
Source: AMSTAT & ASG<br />
84 | GLOBAL SKY QUARTERLY — THIRD QUARTER <strong>2022</strong>
MARKET SUMMARY: CIVIL HELICOPTERS<br />
S-76C+ / S-76C++<br />
Average Asking Price (Million USD)<br />
$3.3<br />
S76C+<br />
S76C++<br />
Average<br />
Market Indicators (vs. Last Quarter)<br />
S76C+<br />
S76C++<br />
Transaction Level (Past 12 Months)<br />
$2.2<br />
$1.7<br />
$1.8<br />
$2.5<br />
$2.1<br />
$2.5<br />
$1.9<br />
$1.9<br />
$2.5<br />
$1.9<br />
$2.5<br />
$2.5<br />
Inventory Level<br />
Average Asking Price<br />
Average Days on Market<br />
For Sale vs. Sold<br />
Sold For Sale<br />
$1.4<br />
PERFORMANCE<br />
Max Range<br />
Max Speed<br />
Typ. Passengers<br />
S-76C+<br />
335 N.M. /<br />
620 km<br />
155 Knots<br />
12<br />
S-76C++<br />
335 N.M. /<br />
620 km<br />
155 Knots<br />
12<br />
4<br />
1<br />
5<br />
1 1<br />
1 1 2<br />
3 1<br />
42 44 39 42 32 27 24 23 23 22 22 23 22 22 22 21 23 21 20 19 15 16 14 15 13<br />
Oct Dec Feb Apr Jun Aug Oct Dec Feb Apr Jun Aug Oct<br />
2020 2021 <strong>2022</strong><br />
FEATURED AIRCRAFT<br />
SUPPLY<br />
No. for Sale<br />
Avg Asking Price<br />
Avg Days on Market<br />
TRANSACTION<br />
Past 12 Months<br />
Past 3 Months<br />
Oct | Jul<br />
9 | 11<br />
2.5M USD<br />
1.9M USD<br />
979 | 1001<br />
Oct | Jul<br />
4 | 4<br />
0 | 4<br />
Oct | Jul<br />
4 | 5<br />
2.5M USD<br />
2.5M USD<br />
622 | 618<br />
Oct | Jul<br />
9 | 9<br />
0 | 7<br />
Source: AMSTAT & ASG<br />
AIRBUS - EC135P2+ SN0682<br />
TOTAL HOURS: 3,425 HOURS SINCE NEW<br />
• 2+4 VIP configuration<br />
• Single pilot / dual pilot IFR<br />
• 3-Axis autopilot<br />
• Air comm air conditioning system<br />
• Safran aero emergency floats<br />
• Aero metals engine inlet barrier filter system<br />
• Outerlink flight data monitoring system<br />
• Weather radar fixed parts<br />
THIRD QUARTER <strong>2022</strong> — GLOBAL SKY QUARTERLY | 85