Chapter 11--Rosgen Geomorphic Channel Design
Chapter 11--Rosgen Geomorphic Channel Design
Chapter 11--Rosgen Geomorphic Channel Design
You also want an ePaper? Increase the reach of your titles
YUMPU automatically turns print PDFs into web optimized ePapers that Google loves.
<strong>Chapter</strong> <strong>11</strong><br />
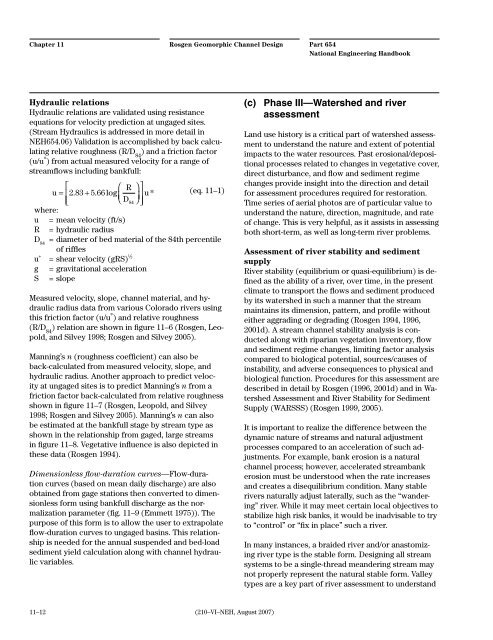
Hydraulic relations<br />
Hydraulic relations are validated using resistance<br />
equations for velocity prediction at ungaged sites.<br />
(Stream Hydraulics is addressed in more detail in<br />
NEH654.06) Validation is accomplished by back calculating<br />
relative roughness (R/D 84 ) and a friction factor<br />
(u/u * ) from actual measured velocity for a range of<br />
streamflows including bankfull:<br />
⎡<br />
⎛ R ⎞ ⎤<br />
u = ⎢2.<br />
83 + 5. 66 log u<br />
⎝<br />
⎜ D ⎠<br />
⎟ ⎥ *<br />
⎣⎢<br />
84 ⎦⎥<br />
where:<br />
(eq. <strong>11</strong>–1)<br />
u = mean velocity (ft/s)<br />
R = hydraulic radius<br />
D = diameter of bed material of the 84th percentile<br />
84<br />
of riffles<br />
u * = shear velocity (gRS)½<br />
g = gravitational acceleration<br />
S = slope<br />
Measured velocity, slope, channel material, and hydraulic<br />
radius data from various Colorado rivers using<br />
this friction factor (u/u * ) and relative roughness<br />
(R/D 84 ) relation are shown in figure <strong>11</strong>–6 (<strong>Rosgen</strong>, Leopold,<br />
and Silvey 1998; <strong>Rosgen</strong> and Silvey 2005).<br />
Manning’s n (roughness coefficient) can also be<br />
back-calculated from measured velocity, slope, and<br />
hydraulic radius. Another approach to predict velocity<br />
at ungaged sites is to predict Manning’s n from a<br />
friction factor back-calculated from relative roughness<br />
shown in figure <strong>11</strong>–7 (<strong>Rosgen</strong>, Leopold, and Silvey<br />
1998; <strong>Rosgen</strong> and Silvey 2005). Manning’s n can also<br />
be estimated at the bankfull stage by stream type as<br />
shown in the relationship from gaged, large streams<br />
in figure <strong>11</strong>–8. Vegetative influence is also depicted in<br />
these data (<strong>Rosgen</strong> 1994).<br />
Dimensionless flow-duration curves—Flow-duration<br />
curves (based on mean daily discharge) are also<br />
obtained from gage stations then converted to dimensionless<br />
form using bankfull discharge as the normalization<br />
parameter (fig. <strong>11</strong>–9 (Emmett 1975)). The<br />
purpose of this form is to allow the user to extrapolate<br />
flow-duration curves to ungaged basins. This relationship<br />
is needed for the annual suspended and bed-load<br />
sediment yield calculation along with channel hydraulic<br />
variables.<br />
<strong>Rosgen</strong> <strong>Geomorphic</strong> <strong>Channel</strong> <strong>Design</strong><br />
<strong>11</strong>–12 (210–VI–NEH, August 2007)<br />
Part 654<br />
National Engineering Handbook<br />
(c) Phase III—Watershed and river<br />
assessment<br />
Land use history is a critical part of watershed assessment<br />
to understand the nature and extent of potential<br />
impacts to the water resources. Past erosional/depositional<br />
processes related to changes in vegetative cover,<br />
direct disturbance, and flow and sediment regime<br />
changes provide insight into the direction and detail<br />
for assessment procedures required for restoration.<br />
Time series of aerial photos are of particular value to<br />
understand the nature, direction, magnitude, and rate<br />
of change. This is very helpful, as it assists in assessing<br />
both short-term, as well as long-term river problems.<br />
Assessment of river stability and sediment<br />
supply<br />
River stability (equilibrium or quasi-equilibrium) is defined<br />
as the ability of a river, over time, in the present<br />
climate to transport the flows and sediment produced<br />
by its watershed in such a manner that the stream<br />
maintains its dimension, pattern, and profile without<br />
either aggrading or degrading (<strong>Rosgen</strong> 1994, 1996,<br />
2001d). A stream channel stability analysis is conducted<br />
along with riparian vegetation inventory, flow<br />
and sediment regime changes, limiting factor analysis<br />
compared to biological potential, sources/causes of<br />
instability, and adverse consequences to physical and<br />
biological function. Procedures for this assessment are<br />
described in detail by <strong>Rosgen</strong> (1996, 2001d) and in Watershed<br />
Assessment and River Stability for Sediment<br />
Supply (WARSSS) (<strong>Rosgen</strong> 1999, 2005).<br />
It is important to realize the difference between the<br />
dynamic nature of streams and natural adjustment<br />
processes compared to an acceleration of such adjustments.<br />
For example, bank erosion is a natural<br />
channel process; however, accelerated streambank<br />
erosion must be understood when the rate increases<br />
and creates a disequilibrium condition. Many stable<br />
rivers naturally adjust laterally, such as the “wandering”<br />
river. While it may meet certain local objectives to<br />
stabilize high risk banks, it would be inadvisable to try<br />
to “control” or “fix in place” such a river.<br />
In many instances, a braided river and/or anastomizing<br />
river type is the stable form. <strong>Design</strong>ing all stream<br />
systems to be a single-thread meandering stream may<br />
not properly represent the natural stable form. Valley<br />
types are a key part of river assessment to understand


